Article

Monitoring and Evaluation of Eco-Environment Quality Based on Remote Sensing-Based Ecological Index (RSEI) in Taihu Lake Basin, China

1
Shaanxi Key Laboratory of Earth Surface System and Environmental Carrying Capacity, College of Urban and Environmental Sciences, Northwest University, Xi’an 710127, China
2
Shaanxi Remote Sensing and GIS Engineering Research Center, Xi’an 710127, China
*
Author to whom correspondence should be addressed.
Sustainability 2022, 14(9), 5642; https://doi.org/10.3390/su14095642
Submission received: 21 March 2022 / Revised: 1 May 2022 / Accepted: 4 May 2022 / Published: 7 May 2022

Abstract

:
Rapid and effective access to the spatiotemporal patterns and evolutionary trends of the regional eco-environment is key to regional environment protection and planning. Based on the Google Earth Engine platform, we use 165 Landsat images from the summer and autumn seasons (May–November) of 2000, 2010, and 2018 as data sources to calculate the RSEI, which represents the quality of the eco-environment, and then analyze the factors influencing the spatial heterogeneity of the eco-environment and the relationship between eco-environment and land-use changes based on RSEI. The results showed the following: (1) From 2000 to 2018, the overall ecological environment quality of the Taihu Lake Basin showed a stage of rapid decline (2000–2010) and a stage of slow decline (2010–2018). (2) The factors were ranked in order of their explanatory power for the spatial heterogeneity of the RSEI: land-use (0.594) > population density (0.418) > slope (0.309) > elevation (0.308) > GDP (0.304) > temperature (0.233) > precipitation (0.208). An interactive effect was found for each factor of the RSEI, which is mainly represented by a mutual enhancement. (3) From 2000 to 2010, the rapid urban expansion was the main reason for the deterioration of ecological quality. From 2010 to 2018, urban expansion slowed down, and the trend of ecological quality deterioration was effectively curbed. Therefore, promoting the intensive use of land and reducing construction land expansion are key to ensuring sustainable regional socio-economic development.

1. Introduction

Eco-environmental quality results from the joint action of human activities and the natural environment and is closely related to the survival of human beings and social and economic development [1]. In recent decades, with the rapid development of urbanization in China, land-use changes have intensified; ecosystems have been continuously degraded; and various ecological problems have emerged, such as soil erosion, land desertification, vegetation degradation, and loss of biodiversity [2,3,4,5,6,7]. To cope with the increasingly serious environmental problems, it is necessary to quickly and effectively assess the state of the regional eco-environment, obtain the development trend of the eco-environment, and understand the influencing factors of changes in the eco-environment. In 2006, the Ministry of Environmental Protection of China proposed the Ecological Index (EI), which was based on the Biological Abundance Index, the Vegetation Cover Index, the Water Network Density Index, the Land Degradation Index, and the Environmental Quality Index and has since been widely used in ecological quality assessments [8]. However, in practical applications, the EI often faces difficulty obtaining indicators and long data update cycles [9].
Satellite remote sensing is widely used in evaluating the regional eco-environment due to its advantages: large-scale monitoring, periodicity, and real-time assessments. However, most current studies characterize particular aspects of the eco-environment based only on a single indicator, such as assessing the growth of vegetation using the Normalized Difference Vegetation Index (NDVI) [10,11], the leaf area index (LAI) [12], and the net primary productivity (NPP) [13]; monitoring urban heat islands by retrieving the land surface temperature based on the thermal infrared band of remote-sensing images [14]; or constructing various drought indices to assess regional drought conditions [15,16,17]. However, due to the complexity of ecosystems, a single indicator is often unable to provide a comprehensive and effective description of the eco-environment [18]. Some scholars have also used the analytic hierarchy process and pressure–state–response (PSR) model to synthesize multiple indices to construct comprehensive indicators and thus to evaluate the eco-environment [19]. However, these indicators usually face some problems: difficulty determining the weight and strong human subjectivity. In 2013, Xu proposed the remote sensing-based ecological index (RSEI), which coupled four ecological indicators using principal component analysis: greenness (NDVI), wetness (WET), dryness (NDBSI), and heat (LST). The advantages of the index include the simple acquisition of the index and not needing to manually determine the weight, and the index has since been widely used for evaluations of regional eco-environmental quality [20]. However, traditional remote-sensing image-processing methods often encounter problems, such as cumbersome data collection and pre-processing, difficult image de-clouding, and difficult and poor comparability when stitching remote sensing images at different times when extracting the RSEI, so many applications of the RSEI are limited to small-scale studies in specific regions and times [21]. The emergence of the Google Earth Engine platform has solved this problem. Relying on the massive remote sensing image data and geographic data stored on the GEE platform and the high-performance computing power, researchers can use the web-based interactive development environment to realize the online use of data and the construction of algorithmic models. Calculating RSEI indicators based on the Google Earth Engine (GEE) platform can significantly simplify data processing and quickly realize image cloud removal, image mosaicking, and index calculation [22]. Many scholars have already monitored regional eco-environment quality based on the GEE platform [9,23].
Taihu Lake is the third-largest freshwater lake in China. The Taihu Lake Basin is situated at the core of the Yangtze River Delta in eastern China, one of the most economically developed regions in China. Rapid economic development has accelerated urbanization in this region, resulting in dramatic changes in regional land-use and the conversion of a large amount of cultivated land and forest land into construction land [24,25]. The dramatic change in land-use has caused a series of environmental problems, including the degradation of ecosystem services, a reduction in water quality, vegetation destruction, and urban heat islands [25,26,27,28,29]. Therefore, this paper uses the GEE platform to obtain the RSEI of the Taihu Lake Basin; to subsequently monitor the spatiotemporal patterns and evolution trends in the eco-environment quality of the basin; and to explore the mechanisms behind the spatial distribution patterns of the eco-environmental quality, and the relationship between ecological–environmental and land-use changes. The results of this study can provide a theoretical basis for the coordinated development of strategies for protecting the eco-environment and for developing the economy of the Taihu Lake Basin.

2. Materials and Methods
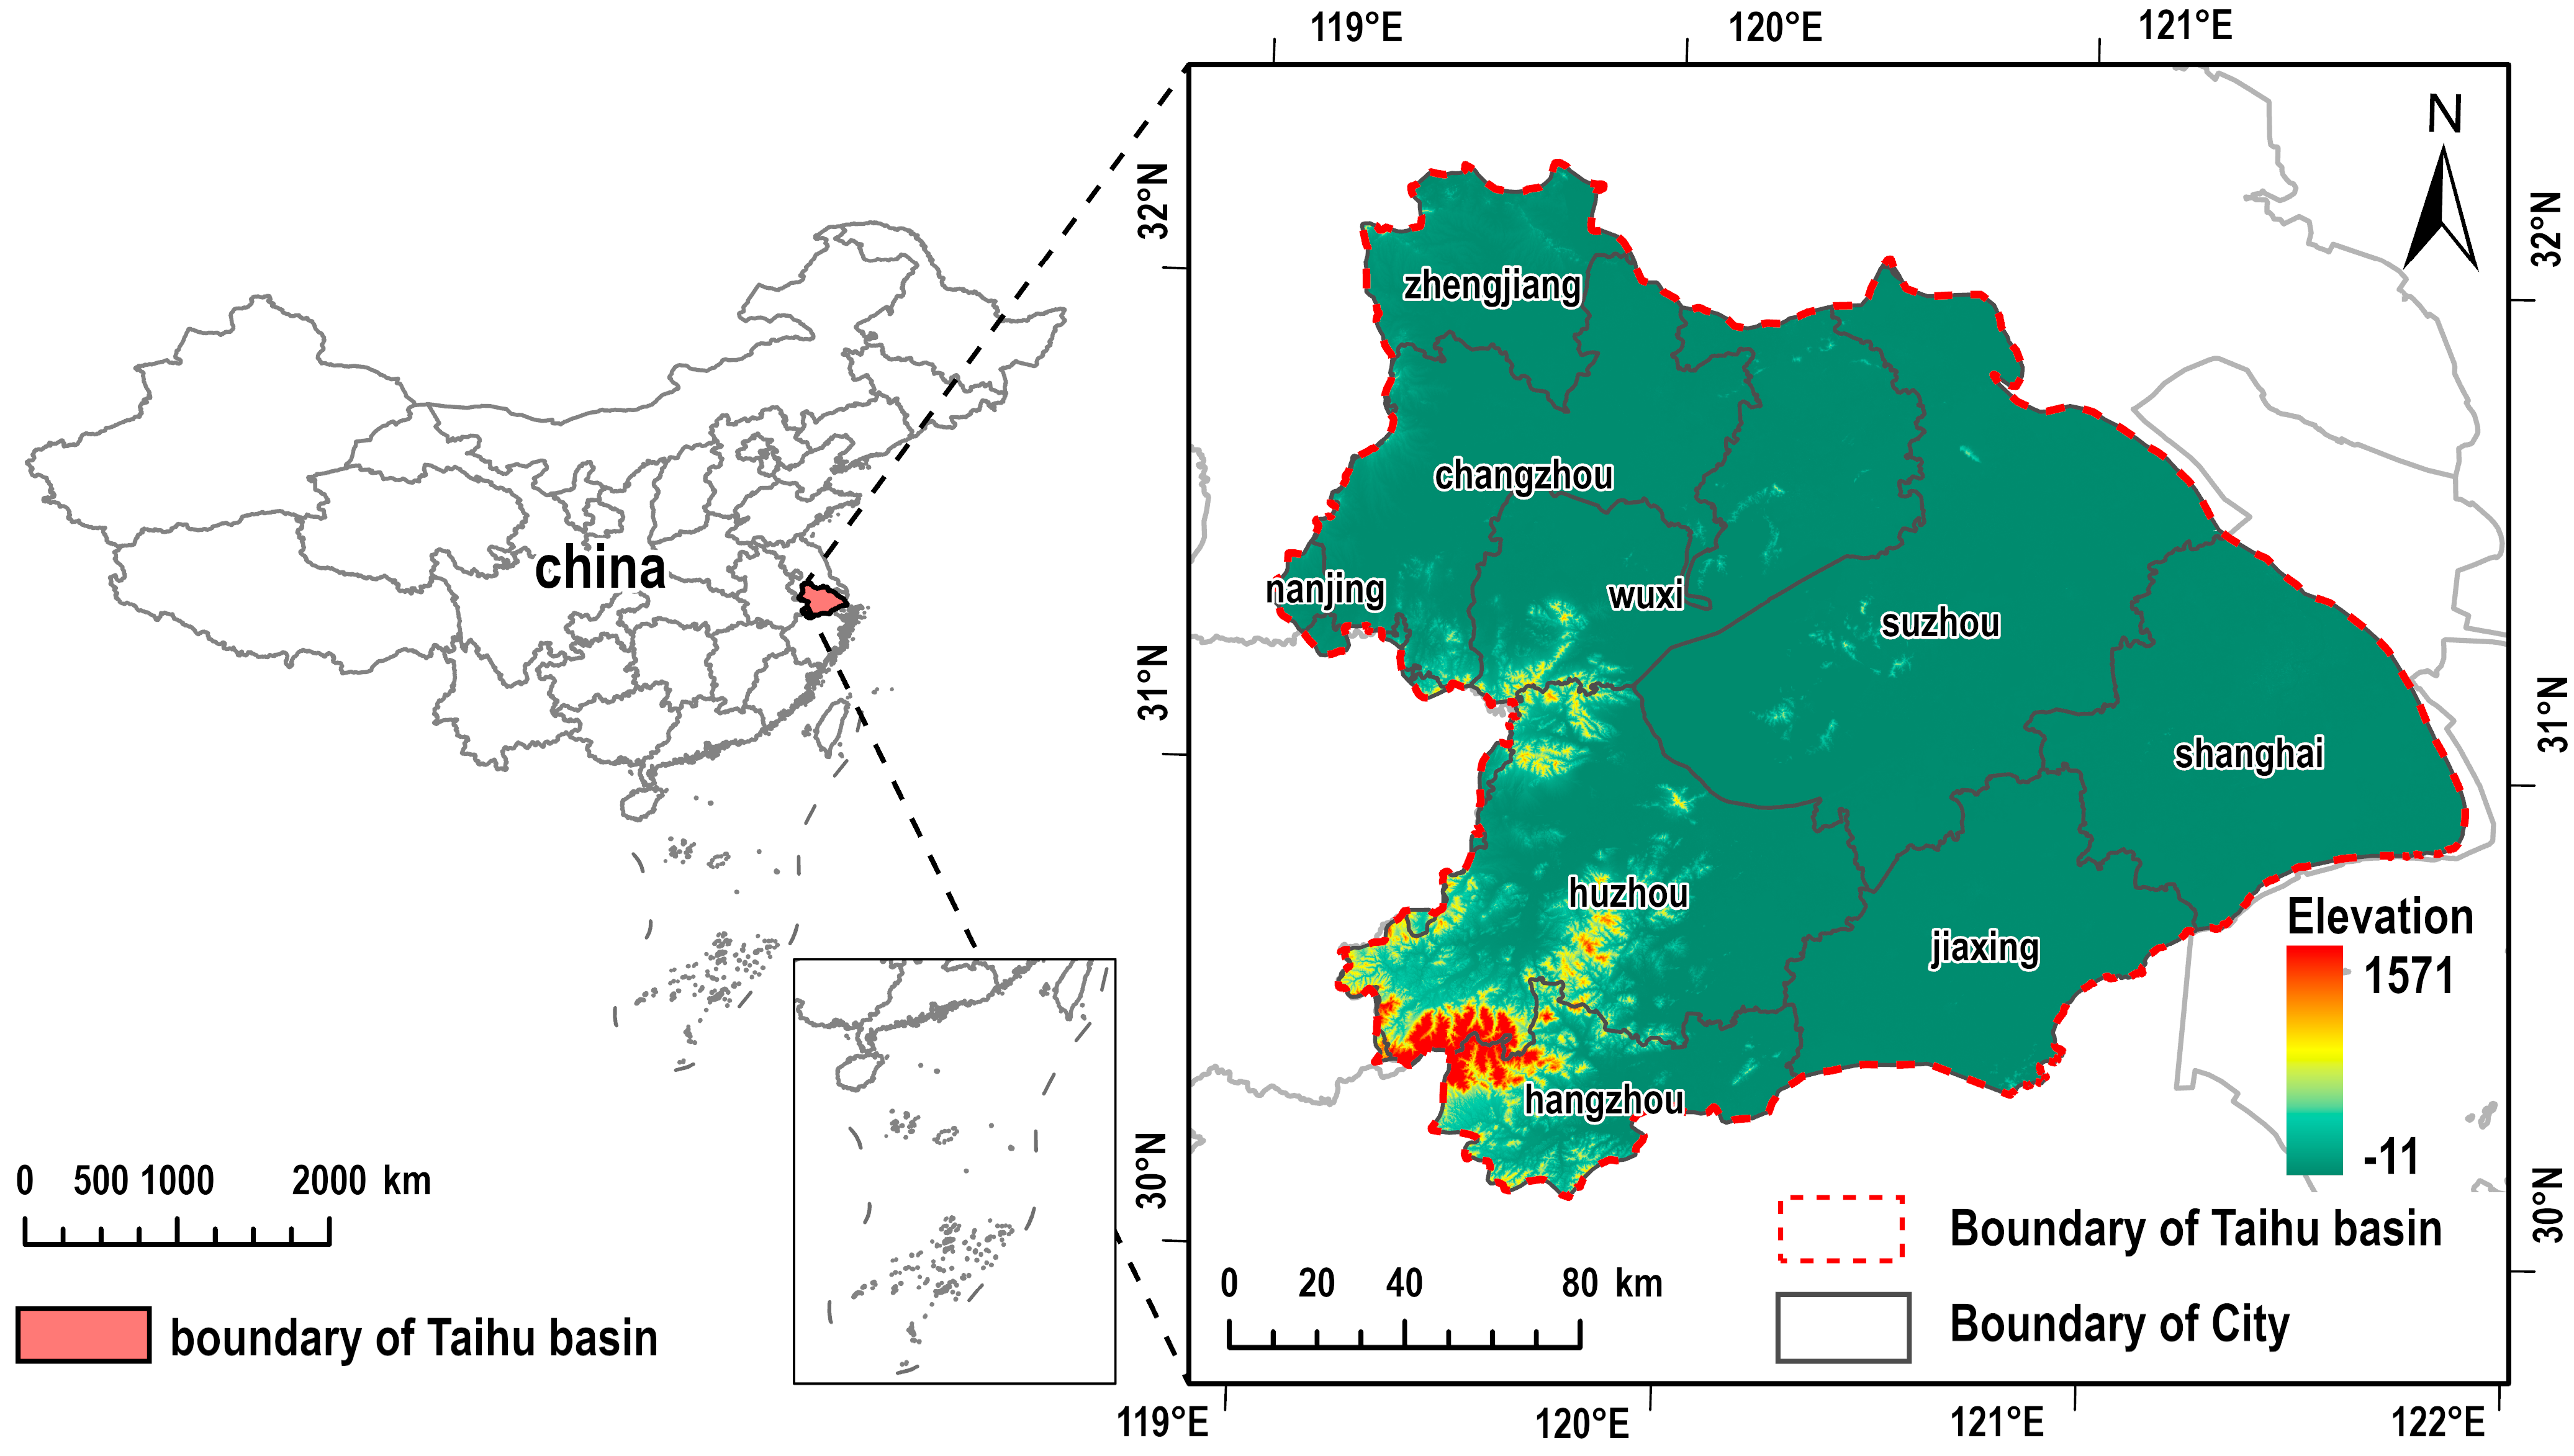
2.1. Study Area

The Taihu Lake Basin (30°55′–31°32′ N, 119°52′–120°36′ E) is located at the core of the Yangtze River Delta in eastern China (Figure 1) and has a subtropical monsoon climate, with an average annual temperature of 15–17 °C and an average annual rainfall of 1181 mm. Administratively, it spans three provinces and one city: Jiangsu, Anhui, Zhejiang, and Shanghai, with a total watershed area of about 36,900 km2. In 2018, the total population of the basin was 61.04 million, accounting for 4.4% of China’s total population; the basin’s GDP was CNY 876.63 billion, accounting for 9.7% of China’s GDP. The Taihu Lake Basin is one of the most economically developed areas in China and one of the most intense in terms of human activity.

2.2. Material

Landsat 5 TM and Landsat 8 OLI/TIRS images for 2000, 2010, and 2018 were derived from the Google Earth Engine platform with a spatial resolution of 30 m and a temporal resolution of 16 days (https://developers.google.com/earth-engine/datasets/catalog/landsat, accessed on 5 June 2022). Based on the Google Earth Engine (GEE) platform, we filtered Landsat remote-sensing images of the Taihu Lake Basin in the summer and autumn (May–November) of 2000, 2010, and 2018; a total of 100 TM scenes and 65 OLI scenes were used in this study, and the details of the images used for each target year are shown in Table 1. For each scene image, we removed cloud pixels; masked water bodies; then obtained four ecological indicators—greenness, wetness, dryness, and heat—through median composition and constructed a remote sensing-based ecological index (RSEI) using principal component analysis.
Land-use data for 2000, 2010, and 2018 were collected from the Data Centre for Resources and Environmental Sciences, Chinese Academy of Sciences (http://www.resdc.cn, accessed on 5 June 2022), with a spatial resolution of 30 m, and reclassified into six categories: cultivated land, forest land, grassland, water, construction land, and unused land, according to the land-use characteristics of the Taihu Lake Basin and research needs. Precipitation and temperature data were obtained from the National Earth System Science Data Sharing Platform (http://www.geodata.cn, accessed on 5 June 2022), with a spatial resolution of 1000 m. Population density and GDP data were obtained from the Data Centre for Resources and Environmental Sciences, Chinese Academy of Sciences (http://www.resdc.cn, accessed on 5 June 2022), with a spatial resolution of 1000 m. Topographic data were obtained using the SRTM 90 m DEM product from Geospatial Data Cloud site, Computer Network Information Center, Chinese Academy of Sciences. (http://www.gscloud.cn, accessed on 5 June 2022), and slope data were calculated from the DEM.
All the above data were mosaicked and cropped according to the extent of the study area, and the projection was defined as WGS−1984. As the temperature and precipitation data were stored in NC data format, they were converted into TIF format using Python to obtain the annual average temperature and annual precipitation data for 2000, 2010, and 2018.
In this study, a 3 × 3 km grid was used as the basic spatial unit to obtain the values of each factor on each grid. Since the values of the impact factor required by the Geodetector need to be categorical values [30], the slope was divided into six categories: ≤5°, 5–10°, 10–15°, 15–20°, 20–25°, and >25°. Additionally, elevation, GDP, population density, temperature, and precipitation were divided into six categories based on natural breaks.

2.3. Construction of Remote Sensing-Based Ecological Index (RSEI)

The Remote Sensing-based Ecological Index (RSEI) couples four ecological indicators using principal component analysis: greenness, wetness, heat, and dryness.

2.3.1. Greenness

The Normalized Difference Vegetation Index (NDVI) was used to obtain greenness. The NDVI is constructed based on the different absorption and reflection characteristics of vegetation in the red and near-infrared bands, is closely related to the vegetation growth condition, and is the most widely used vegetation index [31]:
NDVI = ρ NIR ρ R ρ NIR + ρ R
where ρNIR and ρR represent the near-infrared and red bands of Landsat 5 TM and Landsat 8 OLI/TIRS, respectively.

2.3.2. Wetness

The third component of the tasseled cap transformation (wetness) was used to obtain wetness. The tasseled cap transformation is a principal component analysis with a fixed conversion factor, and its third component (wetness) reflects the surface moisture well, especially the soil moisture [32]:
WET TM = 0.0315 ρ B + 0.2021 ρ G + 0.3102 ρ R + 0.1594 ρ NIR 0.6806 ρ SWIR 1 0.6109 ρ SWIR 2
WET OLI = 0.1511 ρ B + 0.1973 ρ G + 0.3102 ρ R + 0.1594 ρ NIR 0.6806 ρ SWIR 1 0.6109 ρ SWIR 2
where ρB, ρG, ρR, ρNIR, ρ SWIR 1 , and ρ SWIR 2 represent the blue, red, green, near-red, shortwave infrared 1, and shortwave infrared 2 bands, respectively, of Landsat 5 TM and Landsat 8 OLI/TIRS.

2.3.3. Heat

The land surface temperature (LST) was used to obtain the heat:
LST = T 1 + λ T ρ ln ε
where λ is the central wavelength of the thermal band of Landsat 5 TM and Landsat 8 OLI/TIRS (λTM = 11.435 and λOLI = 10.9, respectively), ρ = 1.438 × 10⁻² m K, ε is the land surface emissivity estimated by NDVI, and T is the heat value at the sensor.

2.3.4. Dryness

Both construction land and bare soil contribute to the regional environment drying out, so the building index (IBI) and the soil index (SI) were used to synthesize the normalized difference built-up and soil index (NDBSI) [33]:
NDBSI = IBI + SI 2
IBI = [ 2 ρ SWIR 1 ρ SWIR 1 + ρ NIR ρ NIR ρ NIR + ρ R ρ G ρ G + ρ SWIR 1 ] / [ 2 ρ SWIR 1 ρ SWIR 1 + ρ NIR + ρ NIR ρ NIR + ρ R + ρ G ρ G + ρ SWIR 1 ]
SI = ( ρ SWIR 1 + ρ R ) ( ρ NIR + ρ B ) ( ρ SWIR 1 + ρ R ) + ( ρ NIR + ρ B )
where ρB, ρG, ρR, ρNIR, ρ SWIR 1 , and ρ SWIR 2 represent the blue, red, green, near-red, shortwave infrared 1, and shortwave infrared 2 bands, respectively, of Landsat 5 TM and Landsat 8 OLI/TIRS.

2.3.5. Calculation of Remote Sensing-Based Ecological Index (RSEI)

Principal component analysis was used to couple the four indicators: greenness (NDVI), wetness (WET), heat (LST), and dryness (NDBSI). Their weights were determined based on the original data characteristics of the indicators, which helps avoid uncertainty in the determination of their weights due to human influence and is easy to operate. To avoid the influence of large water bodies on the load distribution of the wetness in the principal component analysis, the MNDWI was used to mask out the water body. Since the unit and data ranges between the four indicators were not uniform, it was necessary to normalize these indicators between 0 and 1 before principal component analysis [34].
EI i = ( I i I min ) / ( I max I min )
where Ii is the index value at pixel i, and Imin and Imax are the minimum and maximum values, respectively.
When PC1 has a low value in areas with good ecological quality and a high value in areas with poor environmental quality, PC1 needs to be subtracted from one so that the high value of RSEI0 represents the good ecological condition [35].
RSEI 0 = 1 PC 1 [ f ( NDVI , WET , LST , NDBSI ) ]
The initial remote sensing-based ecological index (RSEI0) needs to be normalized in order to facilitate the comparison of remote sensing-based ecological indices in different years:
RSEI = ( RSEI 0 RSEI min ) / ( RSEI max RSEI min )
where RSEImin and RSEImax are the minimum and maximum values of the index, respectively.

2.4. Geodetector

Geodetectors are a set of statistical methods used to detect the spatial heterogeneity of geographic elements and their driving forces [36]. A Geodetector includes a factor detector, an interaction detector, a risk detector, and an ecological detector. In this study, the factor and interaction detectors were used to detect the explanatory power of each factor for the spatial heterogeneity of the eco-environment quality in the Taihu Lake Basin and the relationship between each factor. The explanatory power of each factor for the spatial heterogeneity of the eco-environment quality and the relationship among factors can be measured using the q-value. The formula for the Geodetector is as follows:
q = 1 1 N σ 2 h = 1 L N h σ h 2
where Nh is the number of sample units in the sub-level region; N is the number of sample units in the whole region; L is the number of sub-regions; σ2 is the variance in the whole region; σ h 2 is the variance in the sub-level region; and q has a range of [0, 1], where q = 1 indicates that the factor completely controls the spatial distribution of the eco-environment quality and q = 0 indicates that the factor has no relationship with the spatial distribution of the eco-environment quality. The interaction between two factors resulted in the following five cases: (1) q(x∩y) < Min(q(x),q(y)), indicating a non-linear, weakened interaction; (2) Min(q(x),q(y)) < q(x∩y) < Max(q(x),q(y)), indicating a single-factor, non-linear, weakened interaction; (3) q(x∩y) > Max(q(x),q(y)), indicating mutual enhancement; (4) q(x∩y) = q(x) + q(y), indicating that the two factors are independent; and (5) q(x∩y) > q(x) + q(y), indicating non-linear enhancement.

3. Results

3.1. RSEI Model Testing

As seen from Table 2, the contribution rates of the first principal component (PC1) were 68.25%, 72.41%, and 72.60% for 2000, 2010, and 2018, respectively, showing that PC1 concentrates most of the characteristics of the four indicators. The eigenvalues of greenness (NDVI) and wetness (WET) in PC1 were both positive, but the eigenvalue of greenness (NDVI) was greater than that of wetness (WET), indicating that greenness (NDVI) and wetness (WET) have positive effects on the RSEI, but that the contribution of greenness (NDVI) to the RSEI is greater than that of wetness (WET). Similarly, the eigenvalues of heat (LST) and dryness (NDBSI) in the first principal component were both negative, but the eigenvalue of dryness (NDBSI) was greater than that of heat (LST), indicating that heat (LST) and dryness (NDBSI) have negative effects on the RSEI, but that the contribution of dryness (NDBSI) to the RSEI is greater than that of heat (LST).
Table 3 shows the correlation coefficient matrix of the indicators, from which we can see that the RSEI had the highest average correlation of 0.812, followed by NDBSI (0.719), LST (0.552), NDVI (0.55), and WET (0.460). We can see that the RSEI was more suitable than any single indicator used to evaluate the regional ecological environment.

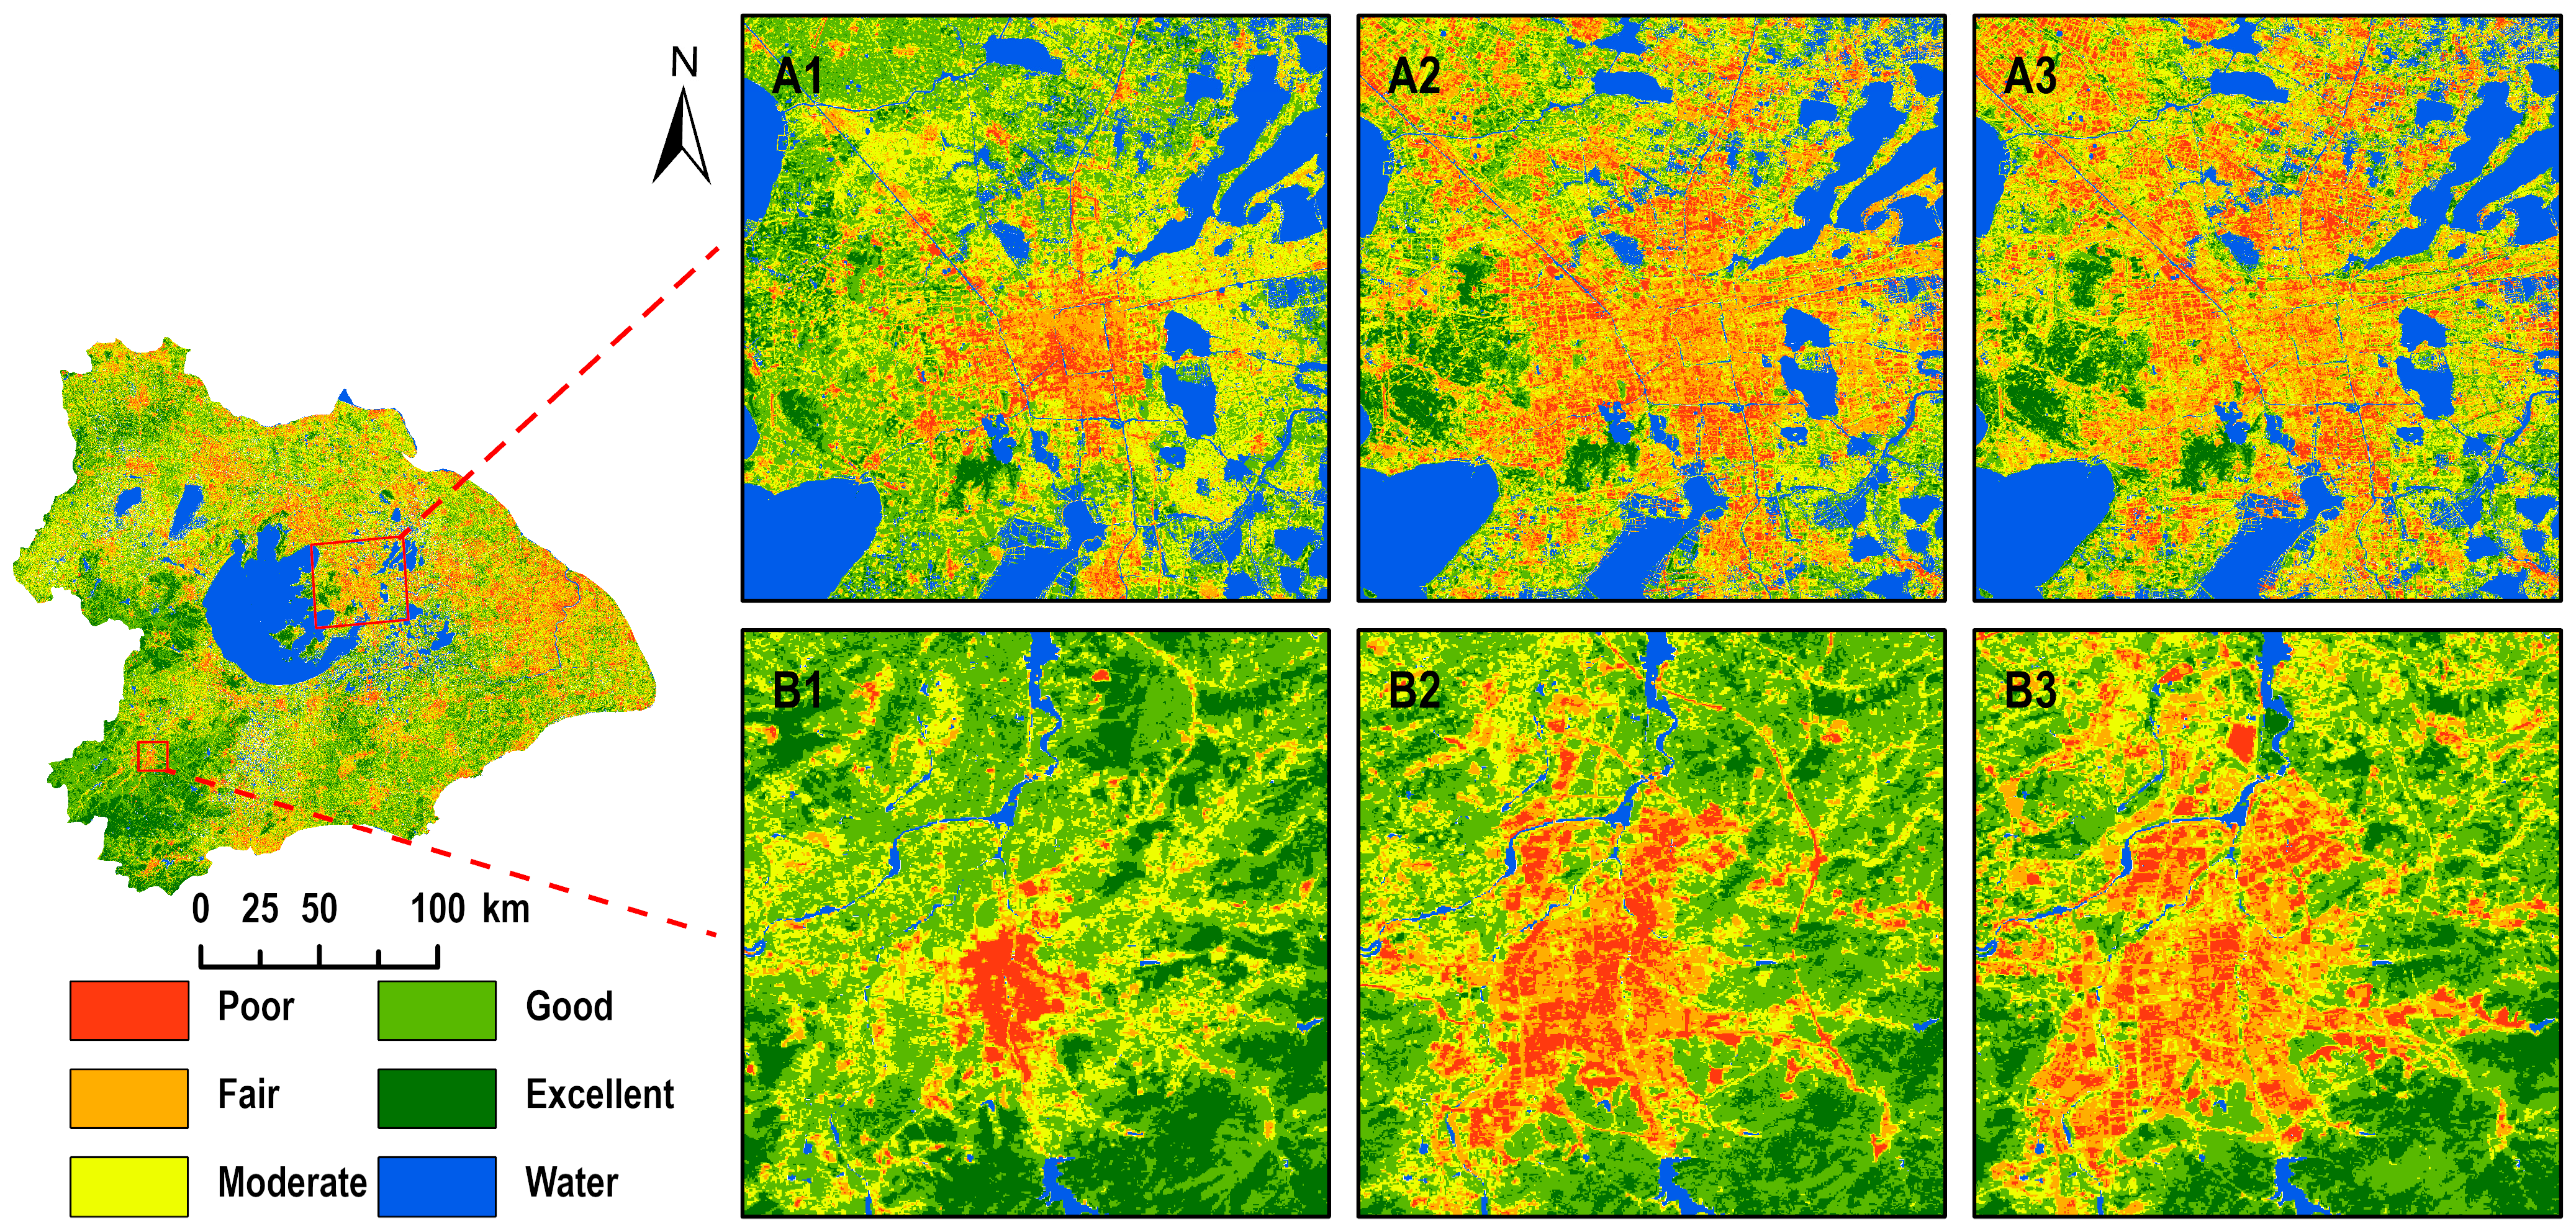
3.2. Spatiotemporal Changes in Eco-Environment Quality of Taihu Lake Basin

The average RSEI of the Taihu Lake Basin for the three years was 0.568 (Table 4), indicating that its eco-environment quality is generally at a medium level but that the overall trend of the eco-environment quality in the Taihu Lake Basin is decreasing, and during 2000–2018, the RSEI decreased from 0.594 to 0.553, with a decreasing trend of 0.022/10a and a decrease of 6.9%. The decreasing trend for the quality of the ecological environment in the Taihu Lake Basin from 2000 to 2010 was 0.034/10a, with a decrease of 6.2%, while the decreasing trend for the quality of the eco-environment in the Taihu Lake Basin from 2010 to 2018 was 0.004/10a, with a decrease of only 0.7%. This indicates that, although the eco-environmental quality of the Taihu Lake Basin showed a decreasing trend in general, the rate of decline slowed down from 2010 to 2018.

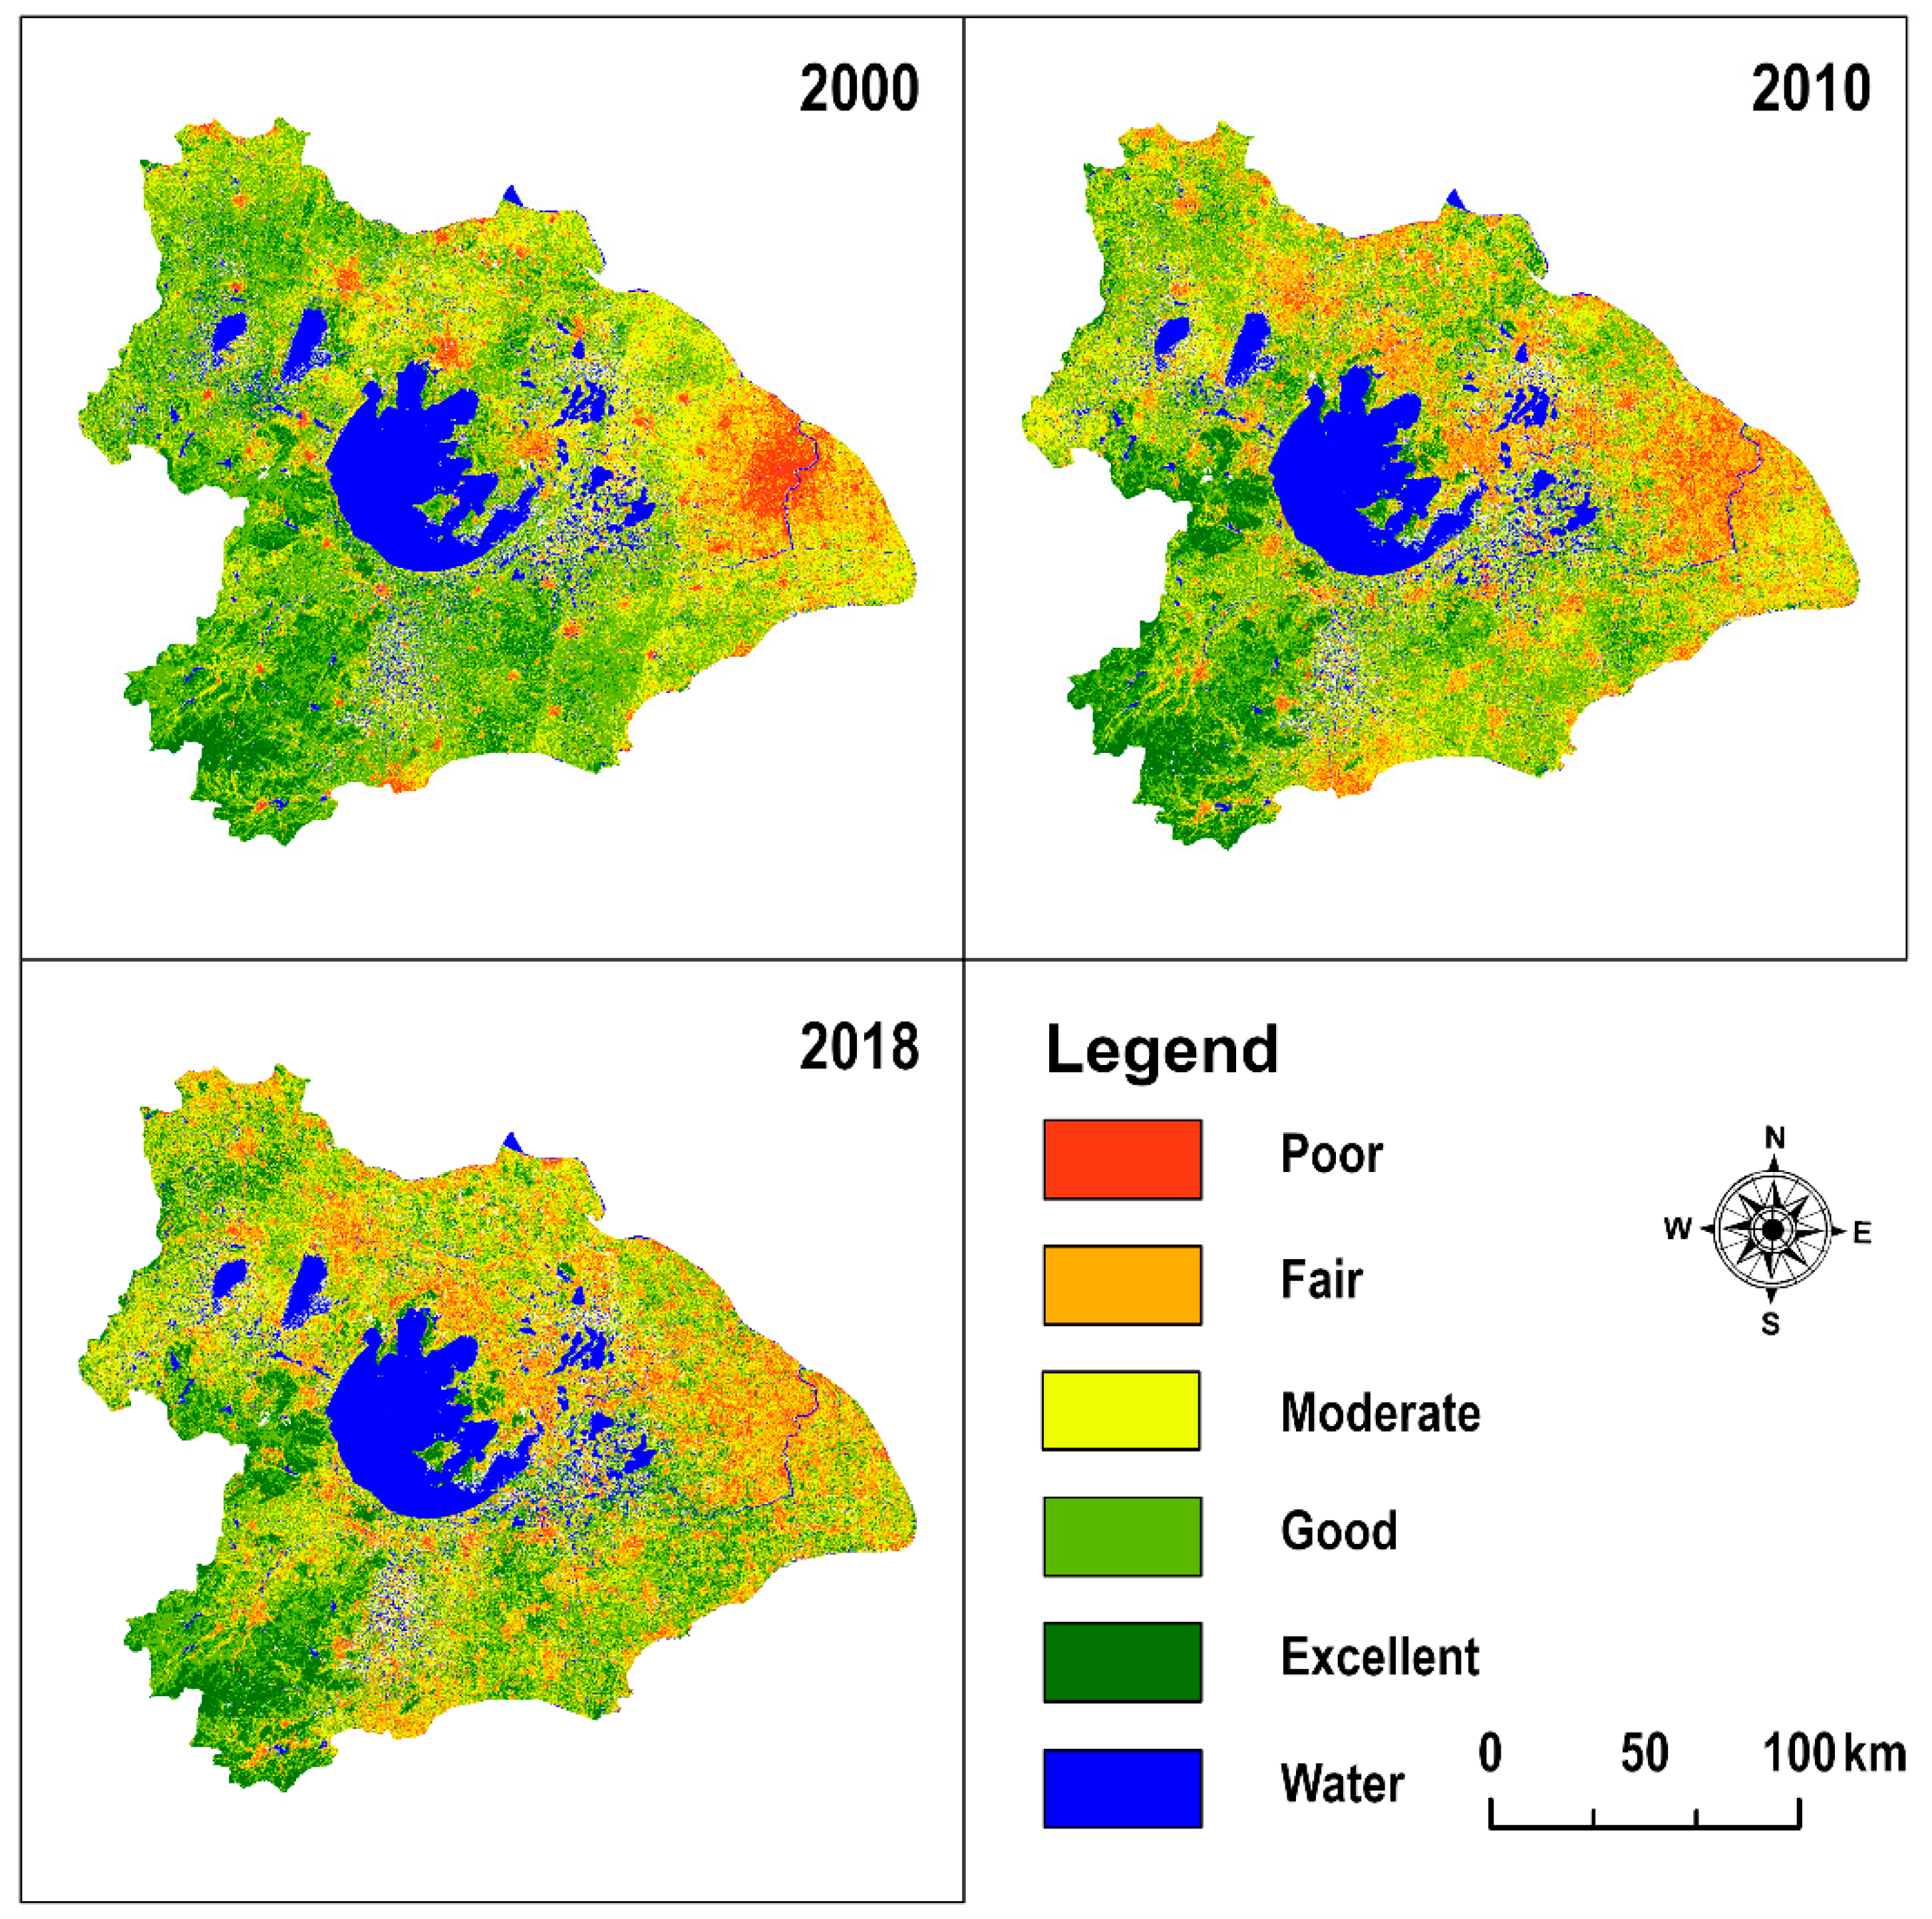
3.2.1. Grading Evaluation of Eco-Environment Quality in Taihu Lake Basin

Based on existing research [38], the RSEI was divided into five grades at equal intervals: poor (0–0.2), fair (0.2–0.4), moderate (0.4–0.6), good (0.4–0.6), and excellent (0.8–1). As seen from Table 5, the percentages of the eco-environment qualities “poor”, “fair”, and “moderate” increased gradually in 2000, 2010, and 2018; the percentage of “good” quality gradually decreased, and the percentage of “excellent” quality decreased in 2010 but increased significantly in 2018.
In 2000, the percentage of areas with “good” eco-environment quality was 45.92%, the percentage of areas with “excellent” and “moderate” quality was 38.84%, and the percentage of areas with “poor” and “fair” quality was only 15.24%. This indicates that the eco-environment quality of the Taihu Lake Basin was generally good in 2000. In 2010, the proportions of “poor”, “fair”, and “moderate” eco-environment quality all increased, with the largest decrease of 6.96% for “poor” quality; the proportion of “good” and “excellent” eco-environment quality decreased, with the largest decrease of 8.76% for “good” quality. Compared with 2000, the eco-environment of the Taihu Lake Basin deteriorated. In 2018, the proportion of “poor”, “fair”, and “moderate” eco-environment quality was still increasing, but the rates of increase decreased, with the proportions of “poor” and “fair” quality only increasing by 0.97% and 0.35%, respectively. The proportion of “poor” and “fair” quality only increased by 0.97% and 0.35%, while the proportion of “good” eco-environment quality still decreased by 4.17%, but the proportion of “excellent” quality increased by 1.5%. From 2010 to 2018, the eco-environment quality of the Taihu Lake Basin deteriorated, but the trend of deterioration was curbed.
In terms of spatial distribution (Figure 2), the areas with “excellent” and “good” eco-environment quality are mainly distributed in the mountainous and hilly areas in the southwest of the Taihu Lake Basin, while the areas with “poor” and “fair” quality are mainly distributed in Shanghai and the Suzhou, Wuxi, and Changzhou urban agglomerations in the northeast of the basin. From 2000 to 2010, regions with “poor” and “fair” ecological quality had a clear trend of expansion, which was more consistent with the spatial expansion of cities, while from 2010 to 2018, the trend of expansion for regions with “poor” and “fair” eco-environment quality slowed down significantly. The spatial clusters are obvious in the spatial distribution of the RSEI, and the high-value clusters are mainly located in the hilly and mountainous areas in the southwestern part of the study area, while the low-value clusters are mainly located in urban centers, with a decreasing degree of spatial aggregation.
In summary, the eco-environment quality in the study area tended to deteriorate during the study period, but the trend was curbed during the period 2010–2018. The eco-environment quality in the study area is influenced by urban expansion, and the areas with “poor” and “fair” eco-environment quality are mainly located in urban built-up areas, with a tendency to expand with the expansion of cities.

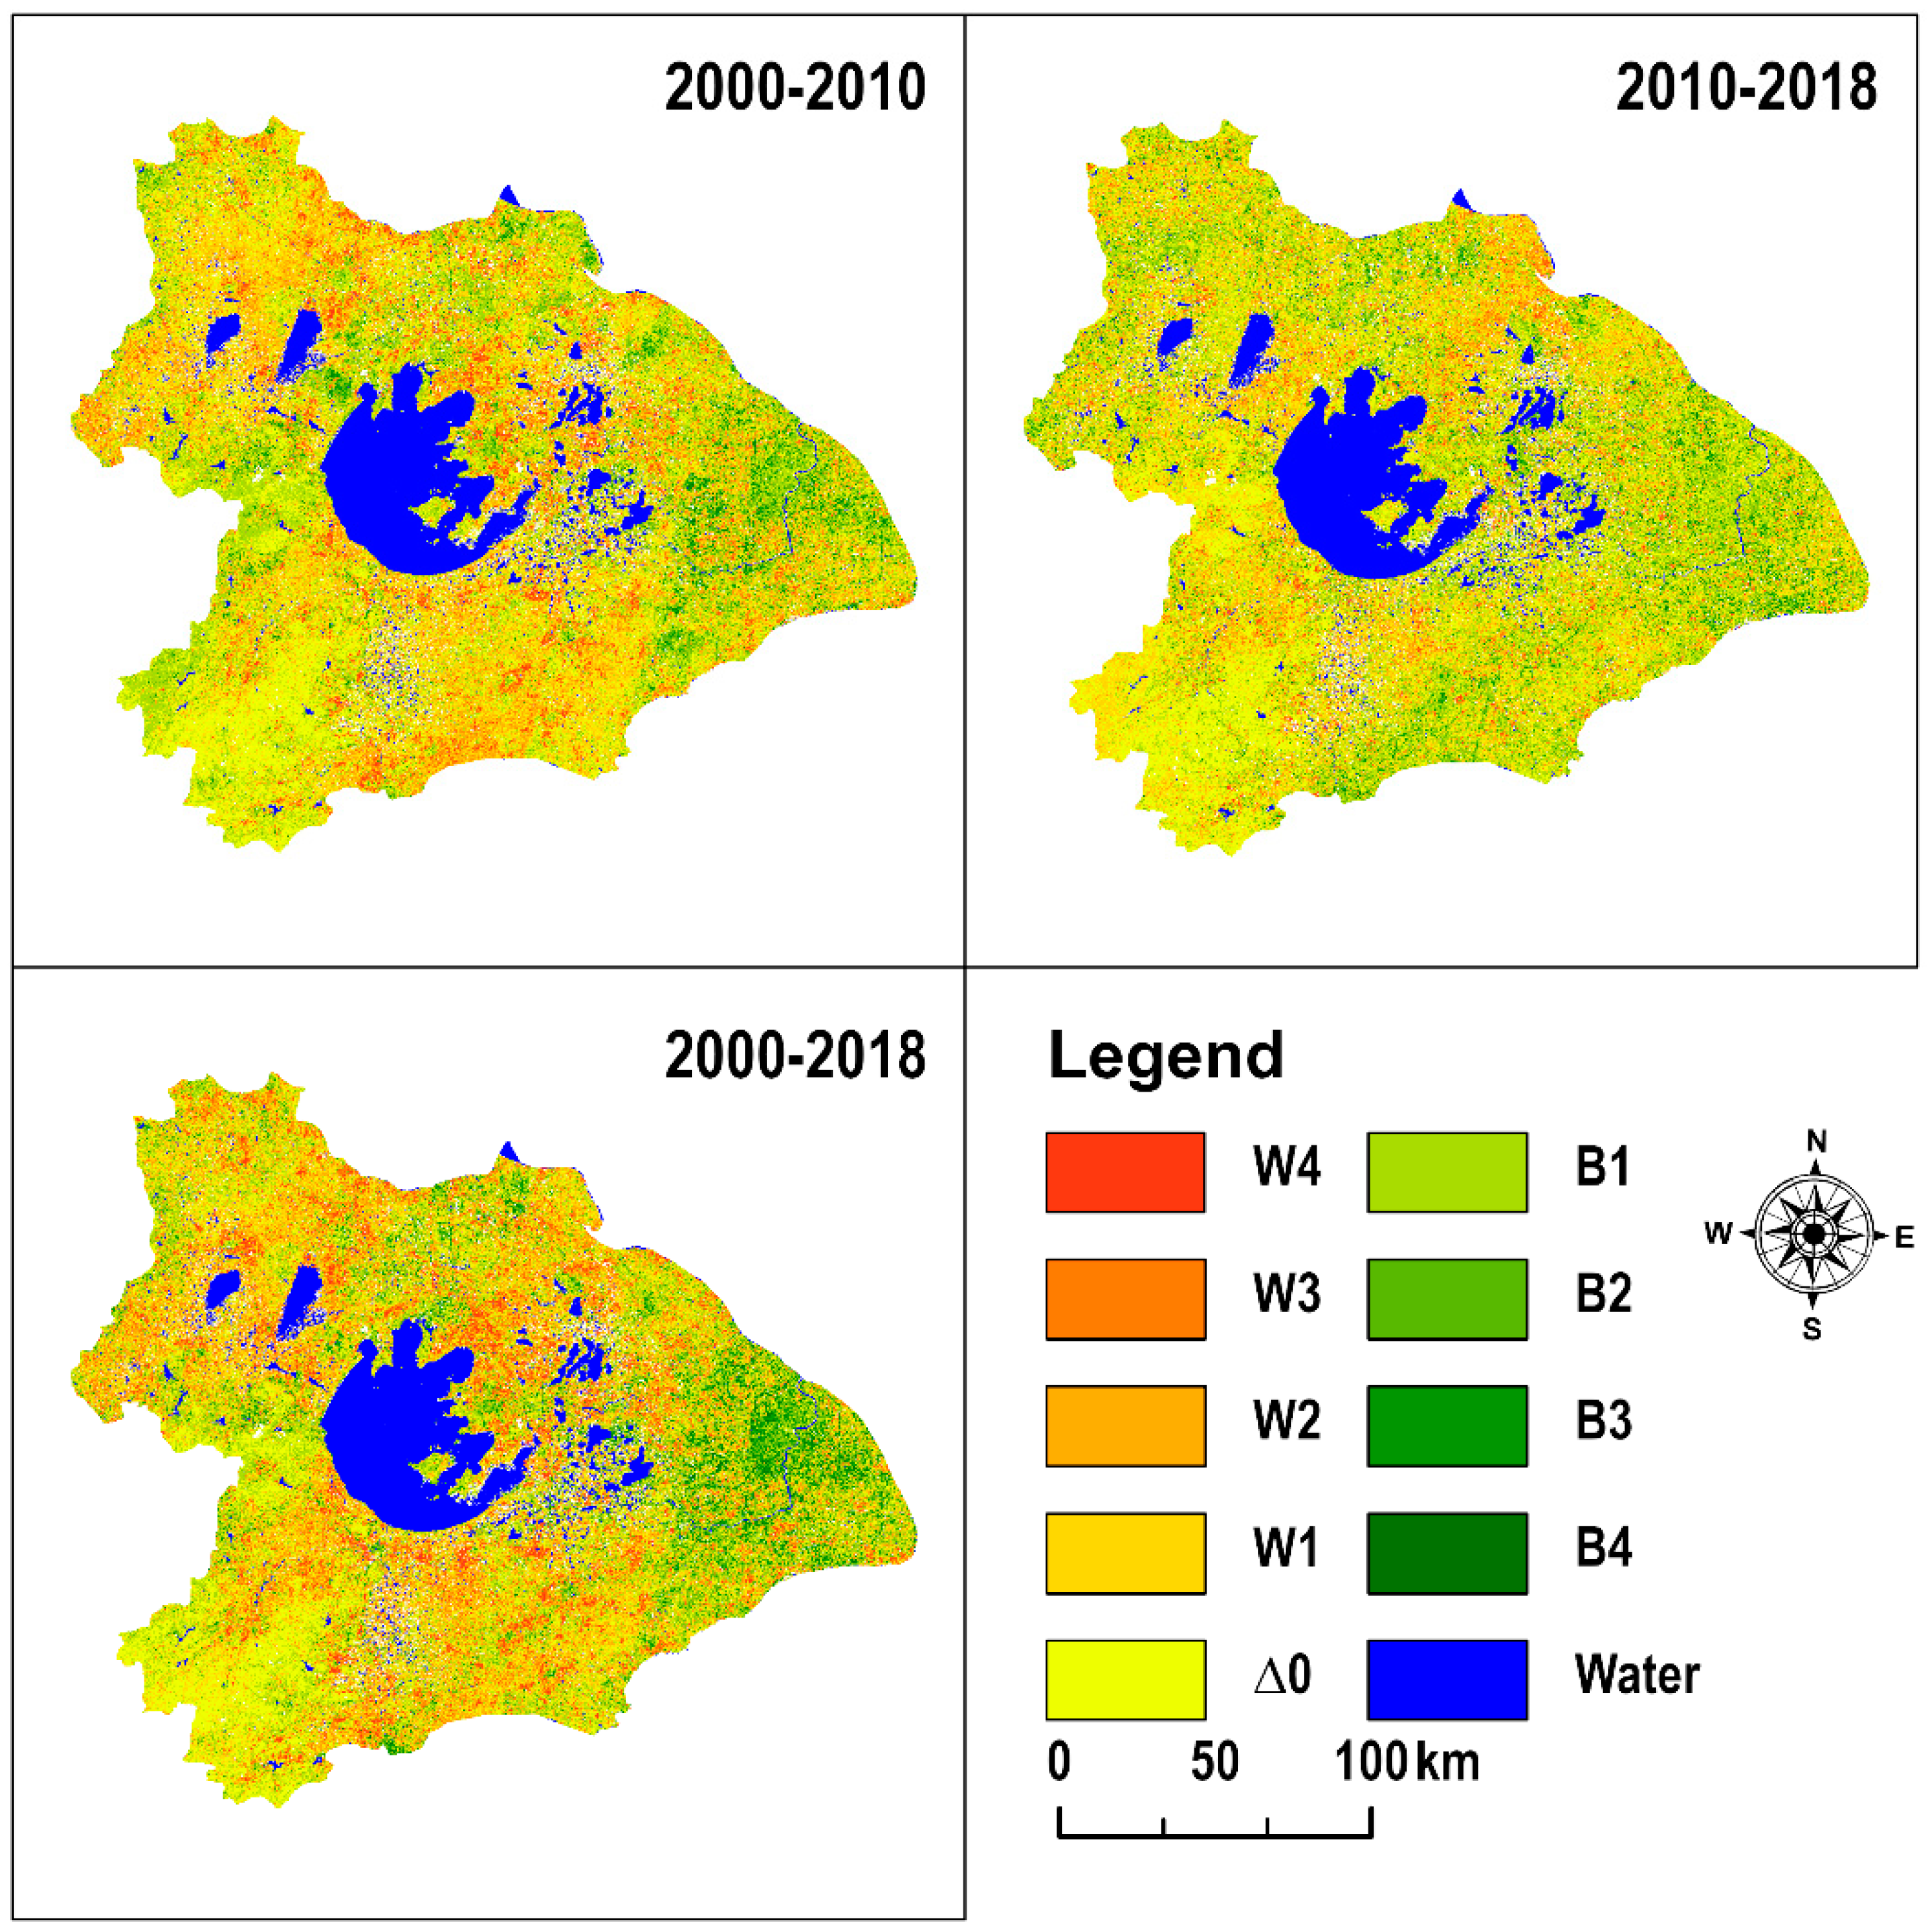
3.2.2. Detection of Eco-Environmental Quality Changes in Taihu Lake Basin

The difference method was utilized to detect changes in the eco-environmental quality of the Taihu Lake Basin, and the degree of RSEI change was graded (Table 6). Table 7 and Figure 3 show the results of the change detection.
From 2000 to 2010, the total area with deterioration in the eco-environment quality was 12,780 km2, while the area for improvements was 9215 km2; therefore, the eco-environment of the Taihu Lake Basin showed a deteriorating trend. Regions with deteriorations in eco-environment quality were more spatially consistent with urban expansion, and regions with improvements in eco-environment quality were distributed to varying degrees within the basin. From 2010 to 2018, the total area for improvements in eco-environment quality (10,759 km2) was comparable with the total area for deterioration (10,024 km2), indicating that the trend of eco-environment deterioration in the Taihu Lake Basin was curbed.
Figure 4 shows the eco-environmental changes in the Taihu Lake Basin’s urban areas from 2000 to 2018; A1–A3 and B1–B3 are the ecological environment of Suzhou city and Anji county in 2000, 2010, and 2018, respectively. Suzhou City is a large city in the eastern urban agglomeration of the study area, and Anji County is a medium-sized town in the western hilly region of the study area. As can be seen from the figure, ecological degradation due to the significant increase in construction land is common in urban areas of the Taihu Lake Basin. Among them, 2000–2010 was a period of rapid ecological deterioration. The trend of environmental deterioration slowed down from 2010 to 2018, mainly due to the slowdown in urban expansion during this period.

3.3. Influencing Factors of Spatial Heterogeneity in Ecological Environment Quality of Taihu Lake Basin

The spatial distribution characteristics of the eco-environmental quality are due to a combination of several factors. Based on the existing research [39,40,41], this paper selected seven factors from topography, climate, land-use, and socio-economic factors to analyze the formation mechanism of the spatial distribution characteristics of ecological environment quality in Taihu Lake Basin.
Eco-environments are influenced by a combination of natural and human factors, but the strength of the influence of each factor on the spatial heterogeneity of eco-environments and how the factors interact with each other are often difficult to quantify. Therefore, this paper detected the influencing factors of the RSEI spatial heterogeneity and the interaction between factors based on the factor and interaction detectors of the Geodetector to reveal the mechanism behind the RSEI spatial heterogeneity in the Taihu Lake Basin. The results of the analysis are shown in Table 8 and Table 9.
The results of the factor detector showed (Table 8) that all factors had strong explanatory powers (q > 0.2) for the spatial heterogeneity of the RSEI, in descending order: land-use (0.594) > population density (0.418) > slope (0.309) > elevation (0.308) > GDP (0.304) > temperature (0.233) > precipitation (0.208). Among them, land-use was the dominant factor in the spatial heterogeneity of the RSEI, explaining nearly 60% of the spatial heterogeneity of the RSEI.
The results of the interaction detector showed (Table 9) that the q-value of the interaction between temperature and precipitation was greater than the sum of the q-values for both, showing a non-linear enhancement; the q-values of their interactions with the other factors were greater than the maximum values of q(X1) and q(X2), showing a mutual enhancement. Ranking first in explanatory power for the interaction among a combination of factors was land-use and population density (0.662), followed by land-use and GDP (0.65), and land-use and temperature (0.637). Moreover, the interaction between temperature and precipitation was the most obvious. The interaction among all factors enhanced the explanatory power of the spatial heterogeneity of the RSEI, indicating that the spatial heterogeneity of the RSEI is influenced by the synergistic interactions of multiple factors.

3.4. Relationship between Ecological Change and Land-Use Change

In this paper, the changes in the total RSEI of different land-use conversion types were quantified to analyze the impact of land-use change on the eco-environment. As the RSEI is not suitable for evaluating water bodies, the land-use transition matrix does not include the conversion of water bodies with each land-use type.

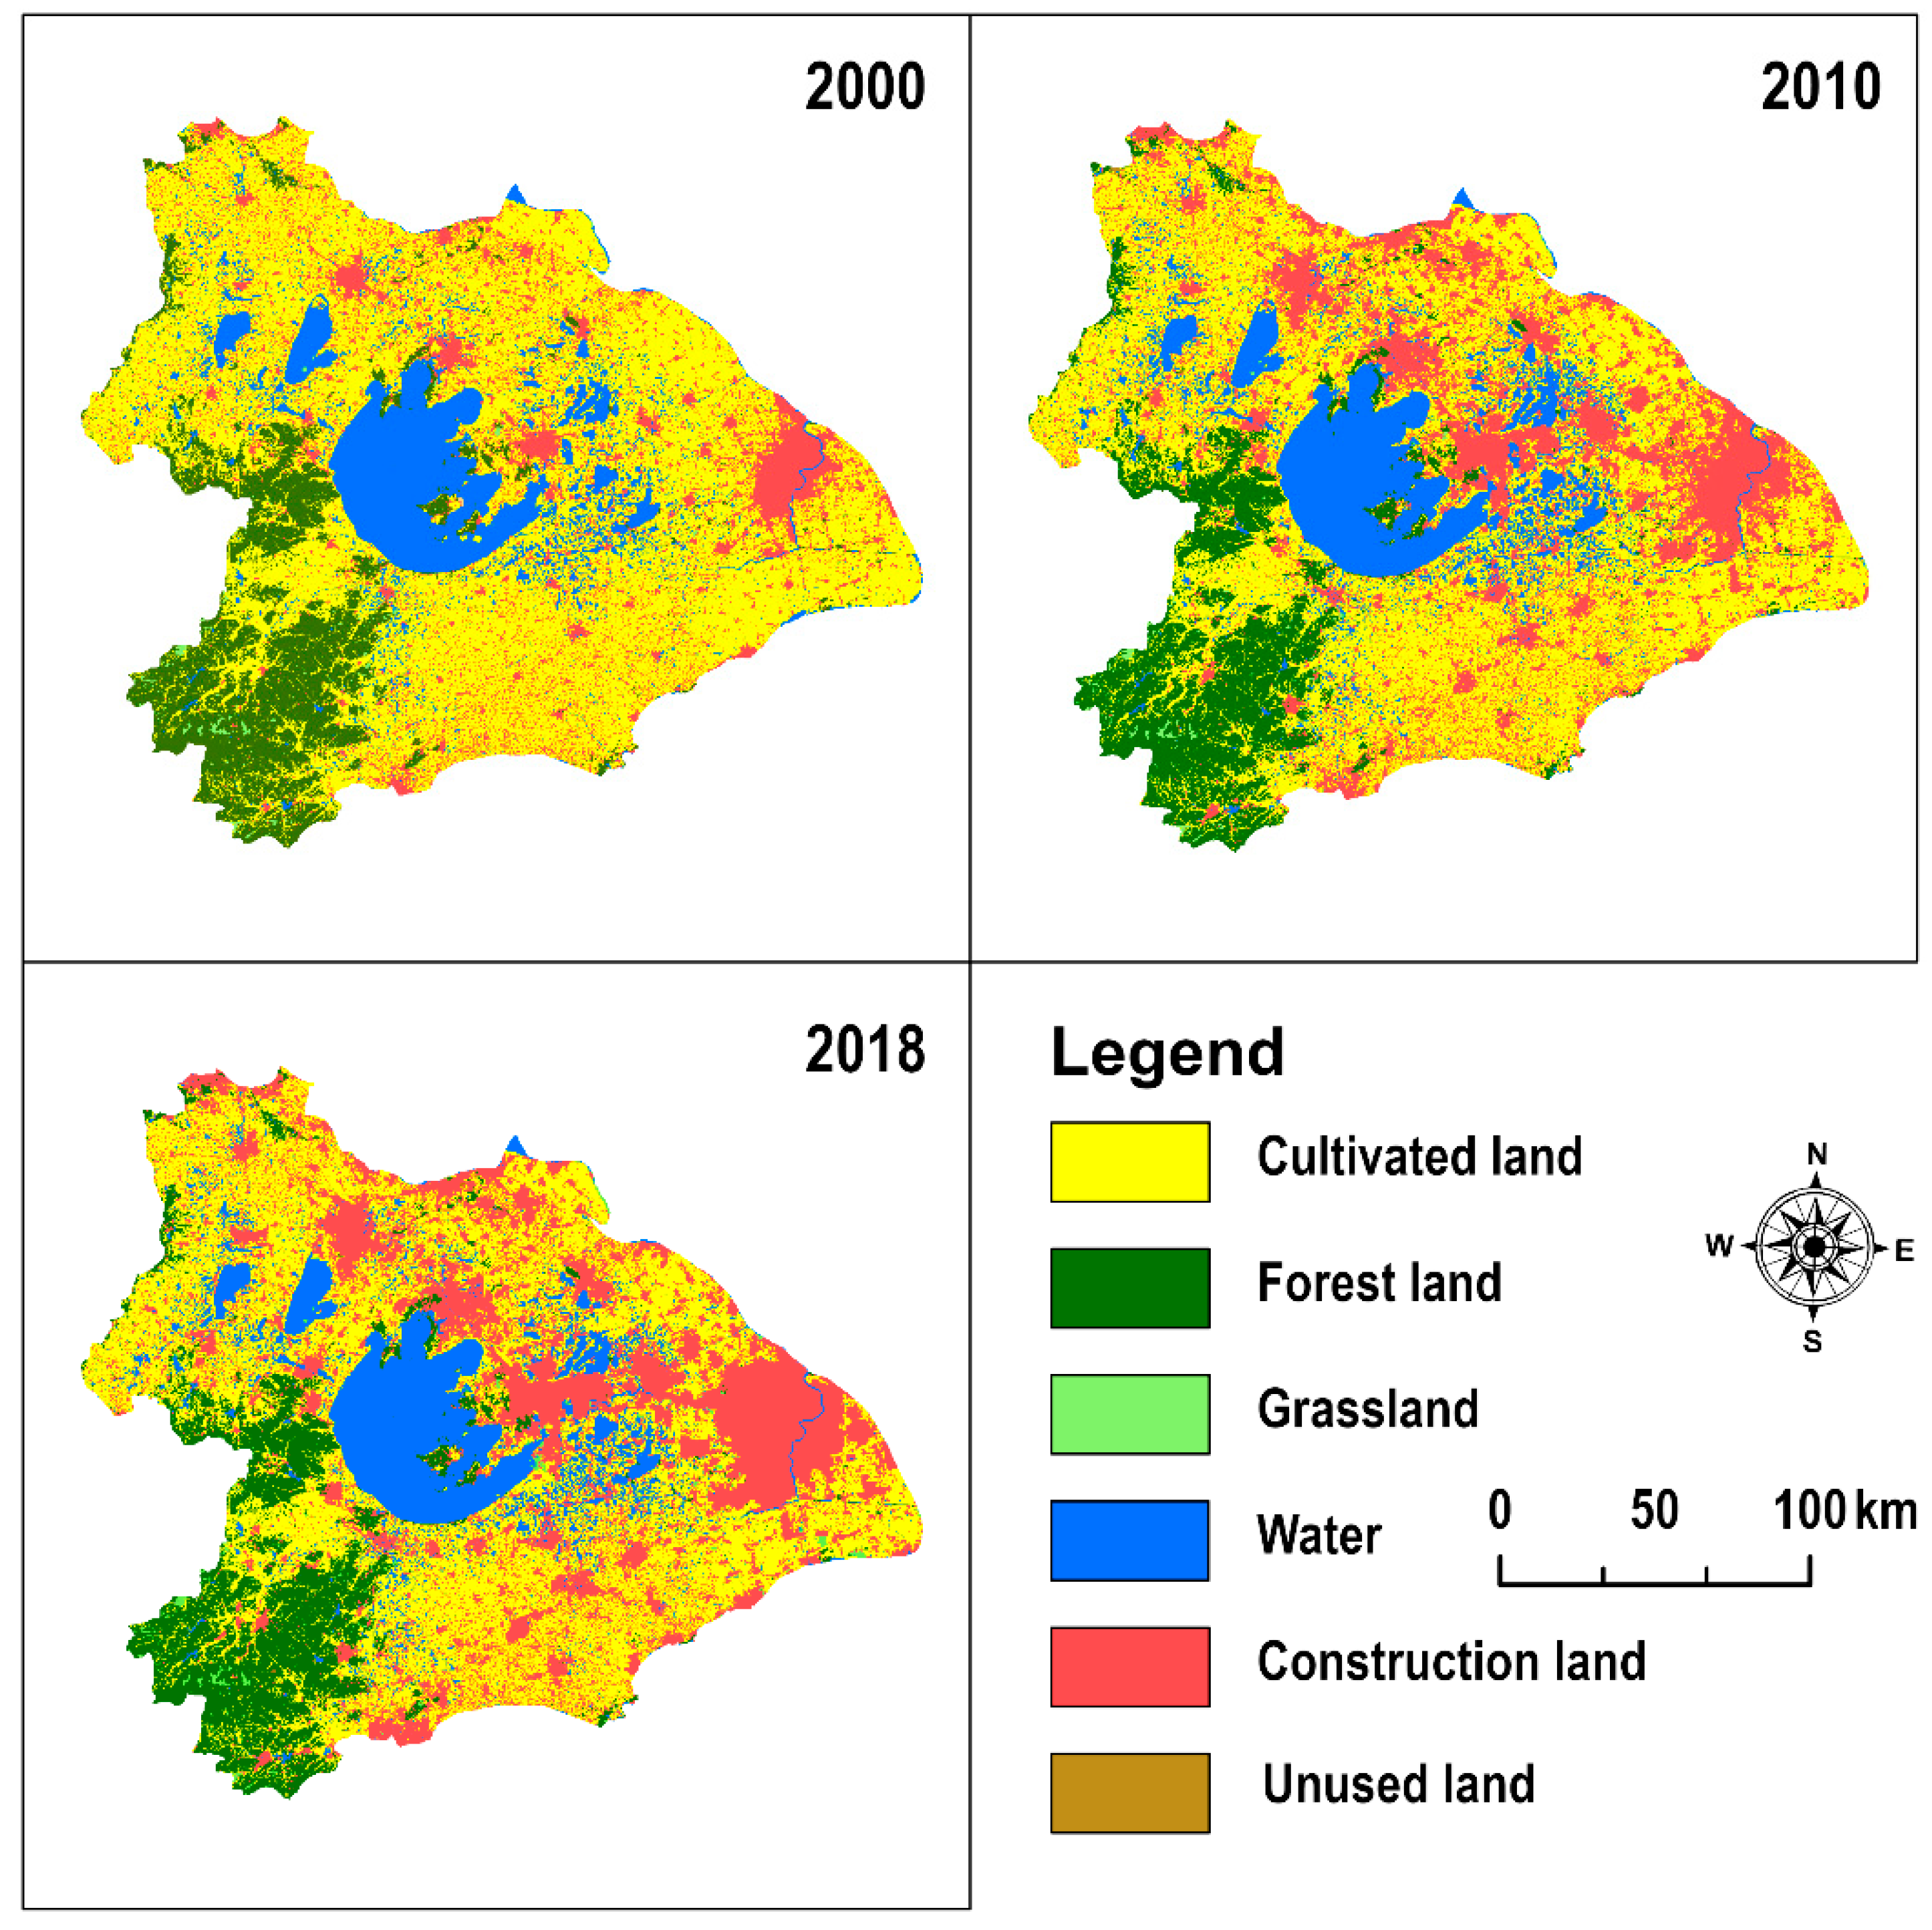
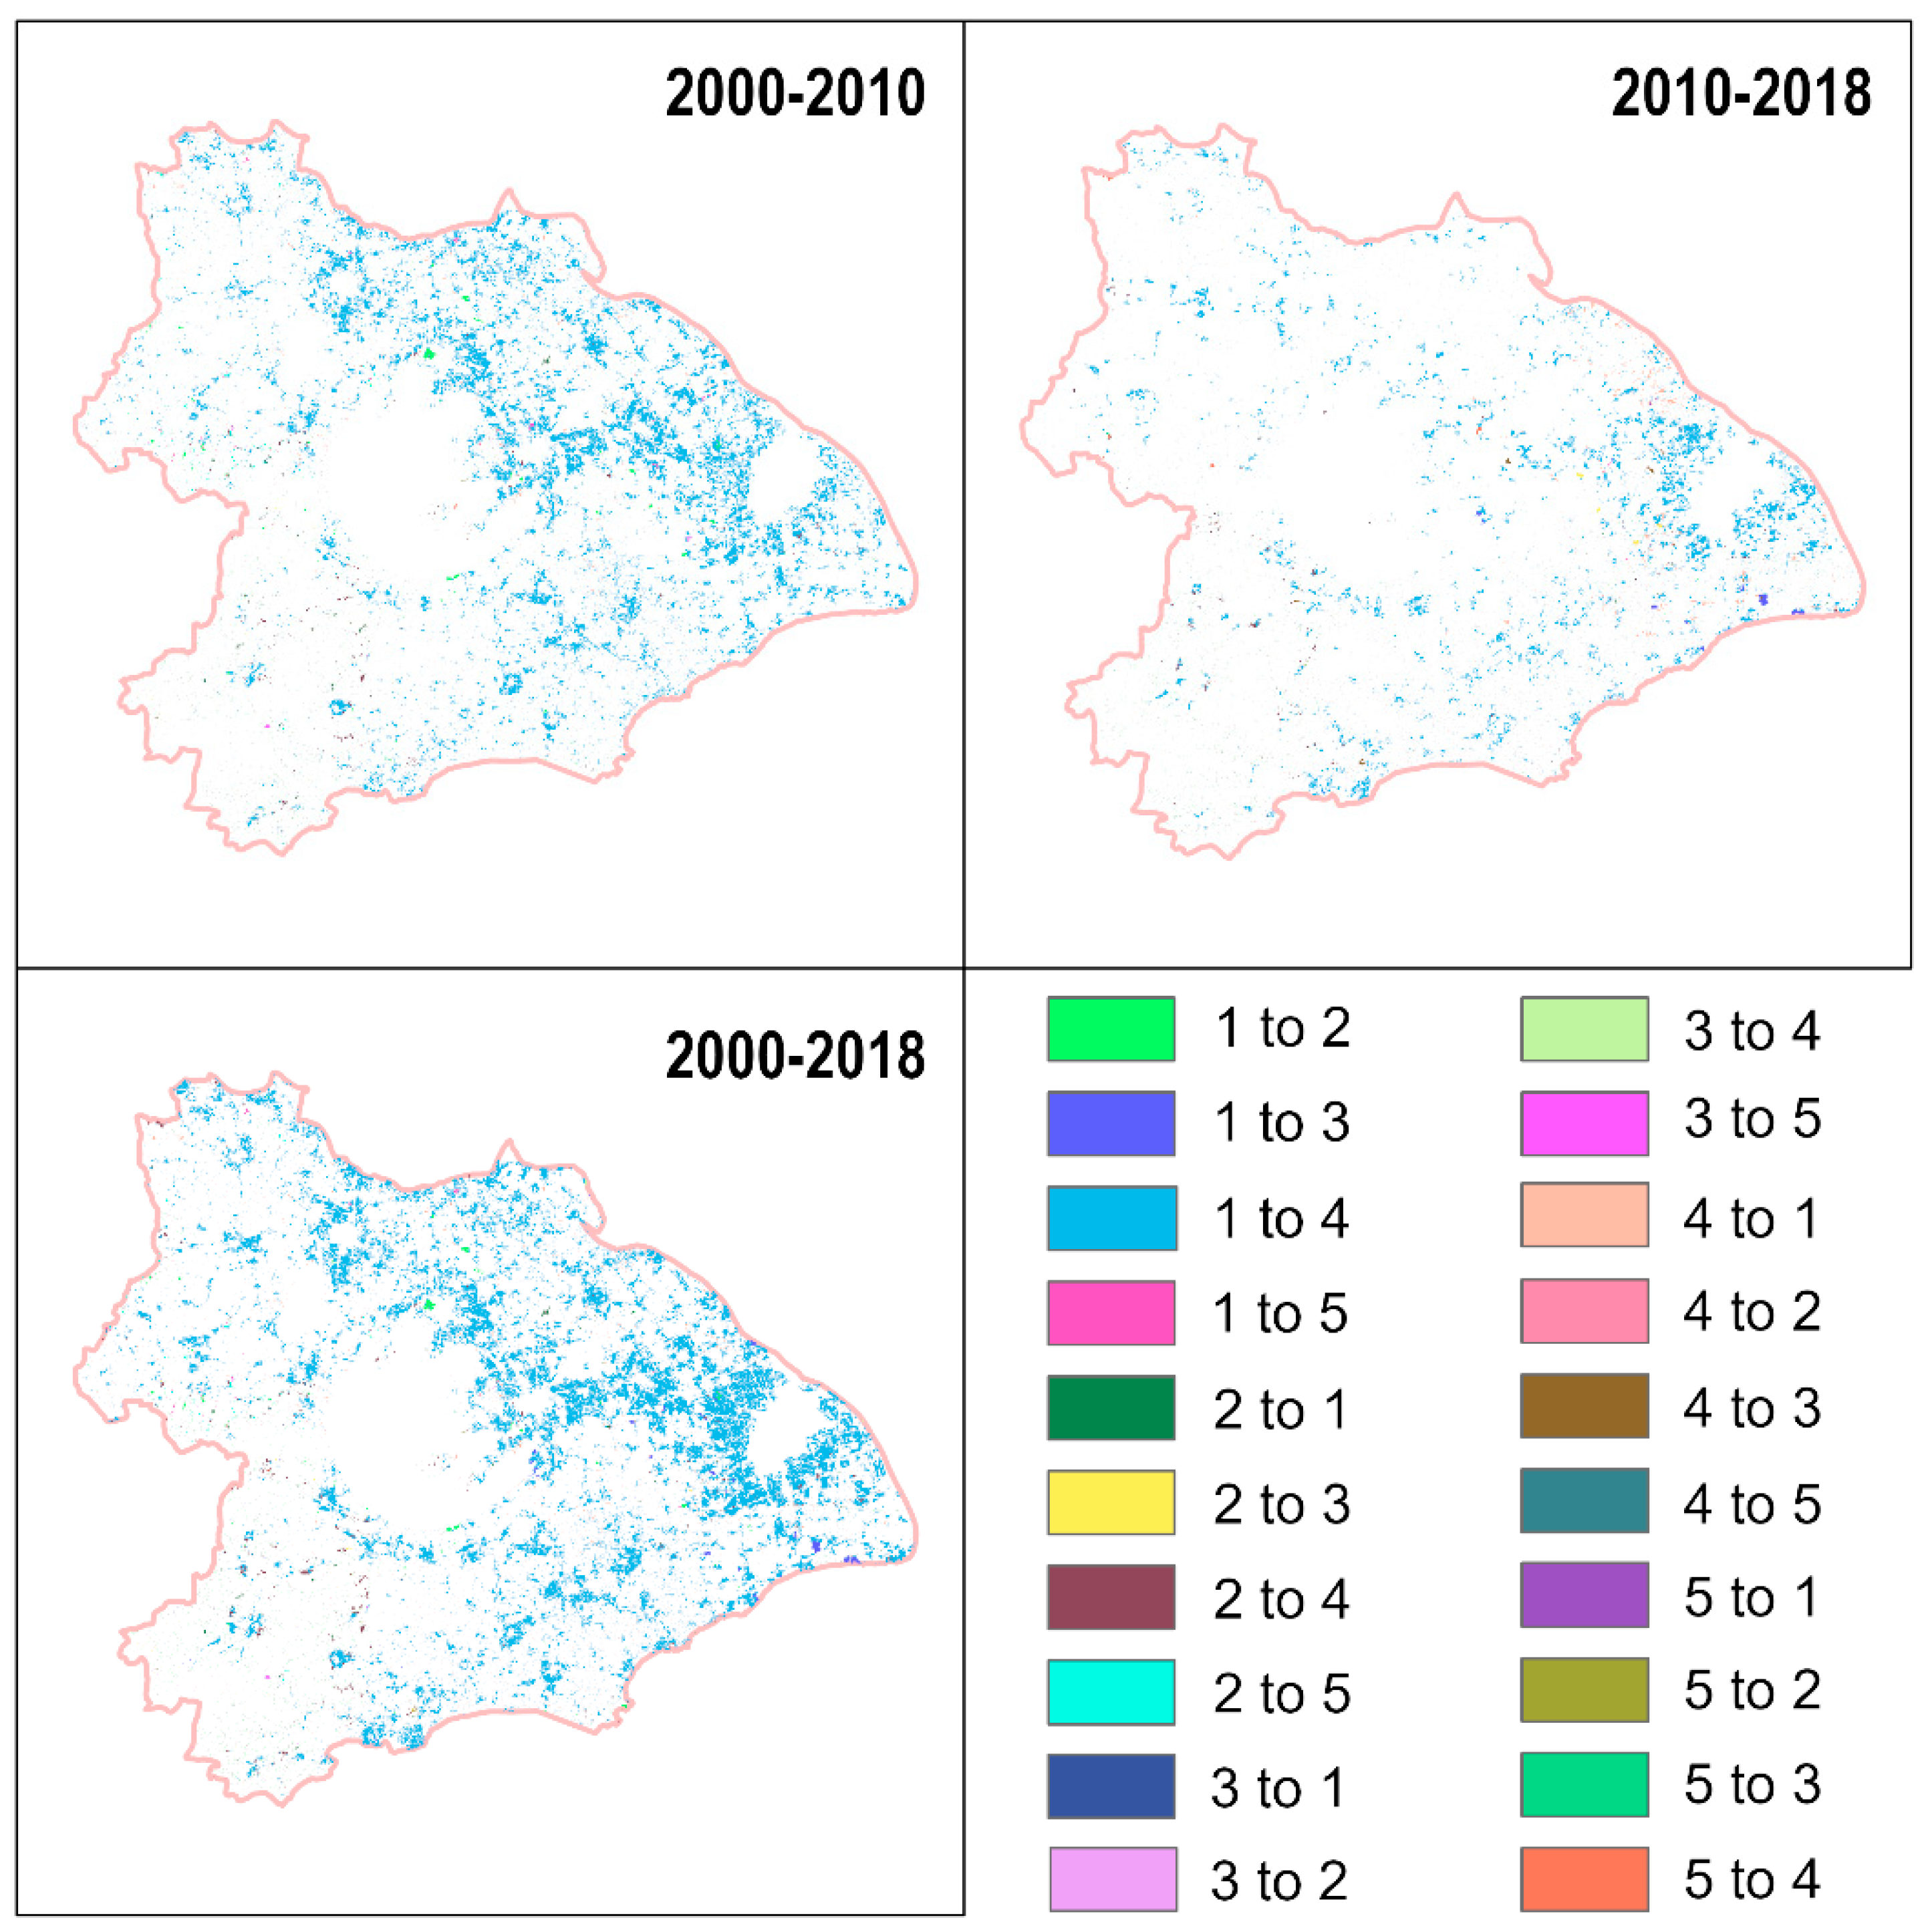
3.4.1. Characteristics of Land-Use Changes in Taihu Lake Basin

The land-use changes in the Taihu Lake Basin from 2000 to 2018 are shown in Table 10 and Table 11 and in Figure 5 and Figure 6. Among the areas transferred out by land-use types from 2000 to 2010, the area transferred out from cultivated land was the largest, at 3638.22 km2; the area converted into construction land was the largest, accounting for 97.63% of the area transferred out from cultivated land. Second, the area of forest land and construction land transferred out was also large, 135.92 km2 and 142.34 km2, respectively. Among the areas transferred in by land-use types from 2000 to 2010, the area of construction land transferred in was the largest, with an area of 3624.29 km2; among them, the area of cultivated land transferred to construction land was the largest, with an area of 3552.02 km2, followed by forest land, with an area of 173.07 km2.
Among the areas transferred out of each land-use type from 2010 to 2018, the area transferred out of cultivated land was still the largest, but the area transferred out decreased to 1508.72 km2, and the area transferred out for construction land accounted for 96.02%. The area of construction land transferred out increased to 193.36 km2, mainly for conversion to cultivated land. Among the areas transferred in by land-use type from 2010 to 2018, the area transferred in for construction land was the largest at 1511.54 km2, of which 95.84% was transferred in for cultivated land. The transferred area of cultivated land increased to 210.14 km2, which was mainly transferred from construction land.
The total area of land-use changes in the study area from 2000 to 2018 was 5380.04 km2; it mainly consisted of the conversion of cultivated land to construction land, construction land to cultivated land, and forest land to construction land, accounting for 90.44%, 3.08%, and 2.10% of the total area of land-use change, respectively. The land-use change in the study area was characterized by the encroachment of construction land on other land-use types, and the main transfer out types of cultivated land, forest land, grassland, and unused land were all construction land.
Spatially, the construction land in the Taihu Lake Basin increased significantly from 2000 to 2018, and the source of most of the construction land was cultivated land, except for the hilly areas in the western part of the basin, where some forest land was converted to construction land (Figure 5 and Figure 6). The expansion of construction land was mainly from the urban center to the outside. The period from 2000 to 2010 was a period of rapid expansion of construction land. The type of expansion of construction land in this period was mainly edge-expansion and leapfrog, and the boundaries of cities expanded rapidly, with construction land in Suzhou, Wuxi, Changzhou, and Shanghai already connected in space. From 2010 to 2018, construction land expansion slowed down significantly and was mainly distributed within the existing urban boundaries, showing an infill expansion. Other land types did not change significantly.

3.4.2. Relationship between Land-Use Change and Socio-Economic Indicators

In this study, the changes in GDP, population, and area of each land-use category from 2000 to 2018 in each city were counted to analyze the effects of population and GDP changes on land-use changes. The results of the analysis are shown in Table 12. GDP and population were positively correlated with the area of construction land and negatively correlated with the area of cultivated land, and both passed the significance test of p < 0.01. This indicates that the growth of GDP and population increased the demand for construction land in the cities, which led to a significant increase in the area of construction land. Additionally, most of the expansion of construction land came at the expense of taking up cultivated land, which led to a significant decrease in the area of cultivated land. Meanwhile, with the growth of GDP and population, cities strengthened urban greening, and the area of grassland increased significantly. However, the correlation between forest land and socio-economic factors did not pass the significance test, which may be due to the existence of both new forest land due to urban greening and the encroachment of forest land due to urban expansion in each city.

3.4.3. Changes in Total RSEI for Different Land-Use Conversion Types

In this paper, the changes in total RSEI for different land-use conversion types were quantified, as shown in Table 13 and Table 14. From 2000 to 2018, the total RSEI decreased by 848.39 × 10³, and the period 2000–2010 showed a rapid decline in total RSEI, with a total reduction of 730.32 × 10³; during the period 2010–2018, the reduction in the total RSEI decreased significantly, with a total reduction of 93.83 × 10³, which is 87% lower compared with that in 2000–2010.
From 2000 to 2010, the total RSEI decreased by 730.32 × 10³; the total RSEI caused by the conversion of cultivated land and forest land to construction land decreased by 708.91 × 10³ and 12.07 × 10³, respectively, and the total RSEI caused by the conversion to unused land decreased by 1.69 × 10³ and 3.65 × 10³, respectively. Similarly, the total RSEI caused by the conversion of forest land and construction land to cultivated land decreased by 1.66 × 10³ and 2.74 × 10³, respectively, but the changes in the total RSEI for other land-use conversion types were not obvious. From 2010 to 2018, the total RSEI decreased by 93.83 × 10³, and the conversion of cultivated land and forest land to construction land caused the total RSEI to decrease by 94.53 × 10³ and 5.26 × 10³, respectively; the conversion of construction land to cultivated land and grassland caused the total RSEI to increase by 4.06 × 10³ and 1.34 × 10³, respectively, and the conversion of cultivated land to grassland caused the total RSEI to increase by 1.38 × 10³.

4. Discussion

4.1. Applicability of the Remote Sensing-Based Ecological Index (RSEI)

In the principal component analysis, the eigenvalues of the four indicators used to construct the RSEI—greenness, wetness, heat, and dryness—were not negligible, indicating that each indicator has an important impact on the eco-environment and that a single indicator cannot fully describe the ecological condition. The positive eigenvalues of greenness and wetness indicate that they play positive roles in the ecosystem; on the contrary, heat and dryness play negative roles in the ecosystem. These results are consistent with real-world observations. From Table 3, the highest average correlation between the RSEI and each indicator was 0.812, indicating that the RSEI is more representative of the ecological condition than any single indicator. Although the RSEI has the advantages of being fast, accurate, and visualizable when assessing the ecological quality of the regional eco-environment, the impact of water on the eco-environment was not examined in this study because the RSEI is not suitable for evaluating the ecological quality of water. However, water is an indispensable component of the eco-environment of the basin, and future studies should further incorporate the ecological effects of water into the evaluation system of the eco-environment of the Taihu Lake Basin.

4.2. Influence Factors of RSEI Spatial Heterogeneity

The RSEI of the Taihu Lake Basin is mainly influenced by anthropogenic factors, among which land-use is the dominant factor in the spatial heterogeneity of the RSEI, with an independent explanatory power close to 60%, which has a higher degree of influence on the spatial heterogeneity of the RSEI compared with other anthropogenic, topographic, and climatic factors. This is mainly because the greenness, wetness, dryness, and heat indexes of different land-use types are significantly different, with cultivated land, forest land, and grassland having higher greenness and wetness and lower dryness and heat, while construction land and unused land have higher dryness and heat and lower greenness and wetness. Especially in the Taihu Lake Basin, the level of utilization of regional land is high [42], the homogeneity within each land class is strong, and the differences in the RSEI between different land classes are obvious. Therefore, the reasonable planning of land-use structures is key to finding a balance between regional economic development and environmental protection. Additionally, the independent explanatory powers of GDP and population density on the RSEI were 30.4% and 41.8%, respectively, and they were negatively correlated with the RSEI. These findings may be explained by the fact that the higher GDP and population density in the region is associated with a more intense impact of human activities on the eco-environment [43]. Topographic factors are also an important influencing factor of the spatial heterogeneity of the RSEI and are positively correlated with the RSEI. The reason for this correlation is that the areas with higher slope and elevation values in the study area are mainly mountains and hills, which have high vegetation cover and are less influenced by human activities. Temperature and precipitation are important influencing factors of the eco-environment, but climate factors have less explanatory power over the spatial heterogeneity of the RSEI in the Taihu Lake Basin, mainly due to the excellent water and heat conditions in the Taihu Lake Basin, and temperature and precipitation are not the main factors restricting the eco-environment.
These factors do not act alone on the RSEI: the interaction detector results show that the explanatory power of any two factors interacting with each other is higher than that of a single factor. Among them, the strongest explanatory power of the interaction among land-use, population, and GDP indicates that the spatial heterogeneity of the RSEI in the Taihu Lake Basin is mainly influenced by anthropogenic factors. The significant interaction effect between climate factors suggests that temperature and precipitation act synergistically to influence the spatial heterogeneity of the RSEI. The lowest q-value for the interaction between climatic and topographic factors is mainly because the topography of the Taihu Lake Basin includes mainly plains and low mountains and hills, and because the vertical differentiation in the characteristics of temperature and precipitation are not significant.

4.3. Relationship between Total RSEI Changes and Land-Use Changes

The overall trend of the RSEI in the Taihu Lake Basin decreased from 2000 to 2018, but significant differences could be seen in the different periods, which can be divided into a rapidly decreasing phase (2000–2010) and a slowly decreasing phase (2010–2018). These trends were similar to the trends in land-use change in the study area. The period 2000–2010 showed dramatic land-use change, with a total area of 3929.70 km2 of land-use change, resulting in a decrease of 730.32 × 10³ in the total RSEI; the rate of land-use change slowed down from 2010 to 2018, with the total area of land-use change decreasing to 1813.13 km2, resulting in a decrease of 93.83 × 10³ in the total RSEI. Compared with the previous period, the decrease in the total RSEI was 87%.
The transformation of cultivated land and forest land into construction land due to urban expansion is the main land-use change in the Taihu Lake Basin and the main cause of regional eco-environment deterioration. The period 2000–2010 saw rapid urbanization in the Taihu Lake Basin, with the area of construction land growing from 5112.92 km2 to 8594.88 km2 and the expansion of construction land growing by 3481.96 km2. This significant growth is primarily due to the region’s rapid economic and population growth, which greatly increased the demand for construction land and contributed to the city’s rapid expansion [37,44]. The land-use types transformed into construction land were mainly cultivated land, 3552.02 km2, followed by forest land, 67.83 km2, causing total decreases in the RSEI of 708.91 × 10³ and 12.07 × 10³, respectively, and accounting for 99% of the total decrease in the RSEI. The area of grassland and unused land transformed into construction land was very small, with a total of 4.45 km2, which had a small impact on the total RSEI. From 2010 to 2018, with the implementation of a new overall plan for land utilization in China, the state advocated the intensive use of land and increasingly strict control over urban expansion. Urban expansion in the Taihu Lake Basin slowed down, and the frequency of exchange between land-use types decreased [45]. During this period, the construction land area increased by 1318.18 km2, with the main sources still being cultivated land and forest land, 1448.72 km2 and 48.28 km2, respectively, which reduced the total RSEI by 94.53 × 10³ and 5.26 × 10³, respectively. The area of cultivated land and forest land transformed into construction land decreased by 59% relative to the period 2000–2010, while the total reduction in the RSEI decreased by 86%, mainly due to the type of expansion of construction land in the early period, which was mainly edge-expansion and leapfrog, resulting in the rapid outward expansion of urban boundaries, which had a serious impact on the ecological environment; however, in the later period, influenced by the policy of intensive land-use, it mainly showed infill expansion, which reduced the impact on the eco-environment.

5. Conclusions

This paper extracted the Remote Sensing-based Ecological Index (RSEI) using the Google Earth Engine (GEE) platform to monitor the ecological environment of the Taihu Lake Basin from 2000 to 2018, analyzed the factors influencing the spatial heterogeneity of the RSEI in the Taihu Lake Basin using a Geodetector, and analyzed the relationship between RSEI changes and land-use changes. The following conclusions were drawn.
(I) The overall trend for the eco-environment quality in the Taihu Lake Basin declined, but the rate of decline varied significantly during different periods and can be divided into a rapid deterioration phase (2000–2010) and a slow deterioration phase (2010–2018). The spatial distribution of the RSEI has heterogeneity characteristics, with the areas with better ecological quality being mainly located in the mountainous and hilly areas in the southwest of the Taihu Lake Basin and the areas with poorer quality being mainly located in the northeast of the basin in Shanghai and in the urban cluster of Suzhou, Wuxi, and Changzhou. The areas where the RSEI decreased were mainly distributed in the urban expansion area, and the areas where the RSEI increased were distributed to varying degrees within the watershed.
(II) The spatial heterogeneity of the RSEI in the Taihu Lake Basin is obvious. Land-use type is the most important influencing factor of the RSEI spatial heterogeneity, and population density, elevation, slope, and GDP are also major influencing factors of the RSEI spatial heterogeneity, while precipitation and temperature are still important influencing factors of the RSEI spatial heterogeneity, although their explanatory powers are weak. The interaction among all factors can enhance the explanatory power of the spatial heterogeneity of the RSEI, and the interaction among land-use, population density, and GDP has the strongest explanatory power, while the interaction between temperature and precipitation is the most significant.
(III) The conversion of cultivated land and forest land into construction land is the main land-use change in the Taihu Lake Basin and is also the main cause of regional eco-environment deterioration. From 2000 to 2010, the rapid urbanization of the Taihu Lake Basin led to the conversion of a large amount of cultivated land and forest land into construction land, which was the main reason for the decrease in the total RSEI. From 2010 to 2018, urban expansion slowed down, the area of cultivated land and forest land converted to construction land was significantly reduced, and the trend of ecological quality deterioration was effectively curbed. Therefore, continuing to promote the intensive use of land and reducing the occupation of cultivated land and forest land due to the expansion of construction land are key to ensuring the sustainable development of the regional economy.
(Ⅳ) There are still some shortcomings in this study. The first is that the RSEI constructed based on four ecological indicators of greenness, humidity, heat, and dryness, although reflecting the structure and function of the ecosystem to some extent, cannot fully characterize the quality of the regional ecological environment. For example, in this paper, since RSEI cannot characterize the eco-environment quality of water bodies, water bodies were excluded from constructing the eco-environment evaluation system of the Taihu Lake Basin. Therefore, in future study, we can consider increasing the number of indicators to improve the representativeness of RSEI on the quality of the eco-environment. Second, this paper only analyzed and discussed the relationship between ecological changes and land-use changes in the Taihu Lake Basin. The evaluation of the impact of climate change on the ecological environment is the next step that needs to be carried out.

Author Contributions

Data collection and analysis, J.Z.; writing—original draft preparation, J.Z.; writing—review and editing, W.L. All authors have read and agreed to the published version of the manuscript.

Funding

This research was funded by the National Natural Science Foundation of China, grant number 41071271.

Institutional Review Board Statement

Not applicable.

Informed Consent Statement

Not applicable.

Data Availability Statement

The data presented in this study are available within the article.

Conflicts of Interest

The authors declare no conflict of interest.

References

  1. Sowińska-Świerkosz, B. Application of surrogate measures of ecological quality assessment: The introduction of the Indicator of Ecological Landscape Quality (IELQ). Ecol. Indic. 2017, 73, 224–234. [Google Scholar] [CrossRef]
  2. Wang, X.; Zhao, X.; Zhang, Z.; Yi, L.; Zuo, L.; Wen, Q.; Liu, F.; Xu, J.; Hu, S.; Liu, B. Assessment of soil erosion change and its relationships with land use/cover change in China from the end of the 1980s to 2010. Catena 2016, 137, 256–268. [Google Scholar] [CrossRef]
  3. Feng, Q.; Ma, H.; Jiang, X.; Wang, X.; Cao, S. What Has Caused Desertification in China? Sci. Rep. 2015, 5, 15998. [Google Scholar] [CrossRef] [PubMed] [Green Version]
  4. Wang, X.; Chen, F.; Dong, Z. The relative role of climatic and human factors in desertification in semiarid China. Glob. Environ. Chang. 2006, 16, 48–57. [Google Scholar] [CrossRef]
  5. Luo, Y.; Sun, W.; Yang, K.; Zhao, L. China urbanization process induced vegetation degradation and improvement in recent 20 years. Cities 2021, 114, 103207. [Google Scholar] [CrossRef]
  6. Li, D.; Wu, S.; Liang, Z.; Li, S. The impacts of urbanization and climate change on urban vegetation dynamics in China. Urban For. Urban Green. 2020, 54, 126764. [Google Scholar] [CrossRef]
  7. Liu, J.; Coomes, D.A.; Gibson, L.; Hu, G.; Liu, J.; Luo, Y.; Wu, C.; Yu, M. Forest Fragmentation in China and Its Effect on Biodiversity. Biol. Rev. 2019, 94, 1636–1657. [Google Scholar] [CrossRef]
  8. Wang, C.; Jiang, Q.; Shao, Y.; Sun, S.; Xiao, L.; Guo, J. Ecological environment assessment based on land use simulation: A case study in the Heihe River Basin. Sci. Total Environ. 2019, 697, 133928. [Google Scholar] [CrossRef]
  9. Xiong, Y.; Xu, W.; Lu, N.; Huang, S.; Wu, C.; Wang, L.; Dai, F.; Kou, W. Assessment of spatial–temporal changes of ecological environment quality based on RSEI and GEE: A case study in Erhai Lake Basin, Yunnan province, China. Ecol. Indic. 2021, 125, 107518. [Google Scholar] [CrossRef]
  10. Pettorelli, N.; Vik, J.O.; Mysterud, A.; Gaillard, J.-M.; Tucker, C.J.; Stenseth, N.C. Using the satellite-derived NDVI to assess ecological responses to environmental change. Trends Ecol. Evol. 2005, 20, 503–510. [Google Scholar] [CrossRef]
  11. Shammi, S.A.; Meng, Q. Use Time Series NDVI and EVI to Develop Dynamic Crop Growth Metrics for Yield Modeling. Ecol. Indic. 2021, 121, 107124. [Google Scholar] [CrossRef]
  12. Goswami, S.; Gamon, J.; Vargas, S.; Tweedie, C. Relationships of NDVI, Biomass, and Leaf Area Index (LAI) for Six Key Plant Species in Barrow, Alaska. PeerJ 2015, 3, e913v1. [Google Scholar]
  13. Wu, S.; Zhou, S.; Chen, D.; Wei, Z.; Dai, L.; Li, X. Determining the contributions of urbanisation and climate change to NPP variations over the last decade in the Yangtze River Delta, China. Sci. Total Environ. 2014, 472, 397–406. [Google Scholar] [CrossRef] [PubMed]
  14. Guo, A.; Yang, J.; Xiao, X.; Xia, J.; Jin, C.; Li, X. Influences of urban spatial form on urban heat island effects at the community level in China. Sustain. Cities Soc. 2020, 53, 101972. [Google Scholar] [CrossRef]
  15. Zarch, M.A.A.; Malekinezhad, H.; Mobin, M.H.; Dastorani, M.T.; Kousari, M.R. Drought Monitoring by Reconnaissance Drought Index (RDI) in Iran. Water Resour. Manag. 2011, 25, 3485–3504. [Google Scholar] [CrossRef] [Green Version]
  16. Tsakiris, G. Establishing a Drought Index Incorporating Evapotranspiration. Eur. Water 2005, 9, 3–11. [Google Scholar]
  17. Vicente-Serrano, S.M.; Beguería, S.; López-Moreno, J.I. A Multiscalar Drought Index Sensitive to Global Warming: The Standardized Precipitation Evapotranspiration Index. J. Clim. 2010, 23, 1696–1718. [Google Scholar] [CrossRef] [Green Version]
  18. Hu, X.; Xu, H. A new remote sensing index for assessing the spatial heterogeneity in urban ecological quality: A case from Fuzhou City, China. Ecol. Indic. 2018, 89, 11–21. [Google Scholar] [CrossRef]
  19. Hazbavi, Z.; Sadeghi, S.H.; Gholamalifard, M.; Davudirad, A.A. Watershed Health Assessment Using the Pressure–State–Response (PSR) Framework. Land Degrad. Dev. 2020, 31, 3–19. [Google Scholar] [CrossRef]
  20. Xu, H.Q. A Remote Sensing Index for Assessment of Regional Ecological Changes. China Environ. Sci. 2013, 33, 889–897. [Google Scholar]
  21. Yan, Y.; Zhuang, Q.; Zan, C.; Ren, J.; Yang, L.; Wen, Y.; Zeng, S.; Zhang, Q.; Kong, L. Using the Google Earth Engine to rapidly monitor impacts of geohazards on ecological quality in highly susceptible areas. Ecol. Indic. 2021, 132, 108258. [Google Scholar] [CrossRef]
  22. Jia, H.; Yan, C.; Xing, X. Evaluation of Eco-Environmental Quality in Qaidam Basin Based on the Ecological Index (MRSEI) and GEE. Remote Sens. 2021, 13, 4543. [Google Scholar] [CrossRef]
  23. Yang, X.; Meng, F.; Fu, P.; Zhang, Y.; Liu, Y. Spatiotemporal change and driving factors of the Eco-Environment quality in the Yangtze River Basin from 2001 to 2019. Ecol. Indic. 2021, 131, 108214. [Google Scholar] [CrossRef]
  24. Chen, X.; Wang, Y.; Cai, Z.; Wu, C.; Ye, C. Effects of Land-Use and Land-Cover Change on Nitrogen Transport in Northern Taihu Basin, China during 1990–2017. Sustainability 2020, 12, 3895. [Google Scholar] [CrossRef]
  25. Xu, X.; Yang, G.; Tan, Y.; Zhuang, Q.; Li, H.; Wan, R.; Su, W.; Zhang, J. Ecological risk assessment of ecosystem services in the Taihu Lake Basin of China from 1985 to 2020. Sci. Total Environ. 2016, 554–555, 7–16. [Google Scholar] [CrossRef]
  26. Qin, B.; Paerl, H.W.; Brookes, J.D.; Liu, J.; Jeppesen, E.; Zhu, G.; Zhang, Y.; Xu, H.; Shi, K.; Deng, J. Why Lake Taihu continues to be plagued with cyanobacterial blooms through 10 years (2007–2017) efforts. Sci. Bull. 2019, 64, 354–356. [Google Scholar] [CrossRef] [Green Version]
  27. Huang, X.; Hua, W.; Dai, X. Performance Evaluation of Watershed Environment Governance—A Case Study of Taihu Basin. Water 2022, 14, 158. [Google Scholar] [CrossRef]
  28. Feng, Y.; Li, H.; Tong, X.; Chen, L.; Liu, Y. Projection of land surface temperature considering the effects of future land change in the Taihu Lake Basin of China. Glob. Planet. Chang. 2018, 167, 24–34. [Google Scholar] [CrossRef]
  29. Deng, P.; Hu, Q.; Wang, Y.; Lv, S.; Zhang, D. Use of the DMSP-OLS Nighttime Light Data to Study Urbanization and Its Influence on NDVI in Taihu Basin, China. J. Urban Plan. Dev. 2016, 142, 04016018. [Google Scholar] [CrossRef]
  30. Cao, F.; Ge, Y.; Wang, J.-F. Optimal discretization for geographical detectors-based risk assessment. GISci. Remote Sens. 2013, 50, 78–92. [Google Scholar] [CrossRef]
  31. Yan, L.; He, R.; Kašanin-Grubin, M.; Luo, G.; Peng, H.; Qiu, J. The Dynamic Change of Vegetation Cover and Associated Driving Forces in Nanxiong Basin, China. Sustainability 2017, 9, 443. [Google Scholar] [CrossRef] [Green Version]
  32. Jin, S.; Sader, S.A. Comparison of time series tasseled cap wetness and the normalized difference moisture index in detecting forest disturbances. Remote Sens. Environ. 2005, 94, 364–372. [Google Scholar] [CrossRef]
  33. Xu, H. A new index for delineating built-up land features in satellite imagery. Int. J. Remote Sens. 2008, 29, 4269–4276. [Google Scholar] [CrossRef]
  34. Han-Qiu, X.U. A Study on Information Extraction of Water Body with the Modified Normalized Difference Water Index (MNDWI). J. Remote Sens. 2005, 9, 589–595. [Google Scholar]
  35. Xu, H.; Wang, Y.; Guan, H.; Shi, T.; Hu, X. Detecting Ecological Changes with a Remote Sensing Based Ecological Index (RSEI) Produced Time Series and Change Vector Analysis. Remote Sens. 2019, 11, 2345. [Google Scholar] [CrossRef] [Green Version]
  36. Wang, J.F.; Xu, C.D. Geodetector: Principle and Prospective. Acta Geogr. Sin. 2017, 72, 116–134. [Google Scholar]
  37. Gao, X.; Shen, J.; He, W.; Zhao, X.; Li, Z.; Hu, W.; Wang, J.; Ren, Y.; Zhang, X. Spatial-temporal analysis of ecosystem services value and research on ecological compensation in Taihu Lake Basin of Jiangsu Province in China from 2005 to 2018. J. Clean. Prod. 2021, 317, 128241. [Google Scholar] [CrossRef]
  38. Wen, X.; Ming, Y.; Gao, Y.; Hu, X. Dynamic Monitoring and Analysis of Ecological Quality of Pingtan Comprehensive Experimental Zone, a New Type of Sea Island City, Based on RSEI. Sustainability 2019, 12, 21. [Google Scholar] [CrossRef] [Green Version]
  39. Yuan, B.; Fu, L.; Zou, Y.; Zhang, S.; Chen, X.; Li, F.; Deng, Z.; Xie, Y. Spatiotemporal change detection of ecological quality and the associated affecting factors in Dongting Lake Basin, based on RSEI. J. Clean. Prod. 2021, 302, 126995. [Google Scholar] [CrossRef]
  40. Zhu, Q.; Guo, J.-X.; Guo, X.; Xu, Z.; Ding, H.; Han, Y. Spatial variation of ecological environment quality and its influencing factors in Poyang Lake area, Jiangxi, China. J. Appl. Ecol. 2019, 30, 4108–4116. [Google Scholar]
  41. Yuan, J.; Xu, Y.; Xiang, J.; Wu, L.; Wang, D. Spatiotemporal variation of vegetation coverage and its associated influence factor analysis in the Yangtze River Delta, eastern China. Environ. Sci. Pollut. Res. 2019, 26, 32866–32879. [Google Scholar] [CrossRef] [PubMed]
  42. Zhao, X.F.; Li, Y.Y.; Zhao, Y.T.; Tian, Z.Q. Spatiotemporal Differences and Driving Factors of Land Development Degree in China Based on Geographical Detector. Resour. Environ. Yangtze Basin 2018, 27, 2425–2433. [Google Scholar]
  43. Han, G.F.; Xu, J.H. Spatio-Temporal Correlation between Urbanization and Vegetation Vigor in the Delta of Yangtze River. Ecol. Sci. 2008, 27, 1–5. [Google Scholar]
  44. Ning, J.; Liu, G.; Liu, Q.; Xie, C. Land use change and ecological environment evolution in Taihu Lake Basin. In Proceedings of the 2010 18th International Conference on Geoinformatics, Beijing, China, 18–20 June 2010; pp. 1–6. [Google Scholar]
  45. Shao, Z.; Spit, T.; Jin, Z.; Bakker, M.; Wu, Q. Can the Land Use Master Plan Control Urban Expansion and Protect Farmland in China? A Case Study of Nanjing. Growth Chang. 2018, 49, 512–531. [Google Scholar] [CrossRef]
Figure 1. Location of the Taihu Lake Basin.
Sustainability 14 05642 g001
Figure 2. Spatial distribution of ecological environmental quality in the Taihu Lake Basin for 2000, 2010, and 2018.
Sustainability 14 05642 g002
Figure 3. Change detection of ecological quality in the Taihu Lake Basin from 2000 to 2018, where W1, W2, W3, and W4 indicate the degree of variation in the eco-environment quality: slightly degraded, moderately degraded, significantly degraded, and dramatically degraded, respectively. B1, B2, B3, and B4 indicate the degree of variation in the eco-environment quality: slightly meliorated, moderately meliorated, significantly meliorated, and dramatically meliorated, respectively. Δ0 indicates that the eco-environment quality was unchanged.
Sustainability 14 05642 g003
Figure 4. Ecological change in the urban area from 2000 to 2018. (A) is Suzhou City, and (B) is Anji country. (A1A3) and (B1B3) are the ecological environment of Suzhou city and Anji county in 2000, 2010, and 2018, respectively.
Sustainability 14 05642 g004
Figure 5. Land-use map of the Taihu Lake Basin from 2000 to 2018.
Sustainability 14 05642 g005
Figure 6. Land-use change map of the Taihu Lake Basin from 2000 to 2018, where 1, 2, 3, 4 and 5 indicate cultivated land, forest land, grassland, construction land, and unused land, respectively.
Sustainability 14 05642 g006
Table 1. Data information for the Landsat images.
YearDataset TypeNumber of ImagesDate TimesPath/Row
2000Landsat 5 TM573 May 2000, 5 May 2000,
12 May 2000, 19 May 2000,
21 May 2000, 28 May 2000,
118/038, 118/039,
6 June 2000, 13 June 2000,
20 June 2000, 29 June 2000,
6 July 2000, 8 July 2000,
119/038, 119/039,
15 July 2000, 22 July 2000,
24 July 2000, 31 July 2000,
7 August 2000, 9 August 2000,
120/038, 120/039
16 August 2000, 23 August 2000,
1 September 2000, 8 September 2000,
10 September 2000, 17 September 2000,
24 September 2000, 26 September 2000,
10 October 2000, 19 October 2000,
28 October 2000, 4 November 2000,
13 November 2000, 20 November 2000
2010Landsat 5 TM431 May 2010, 17 May 2010,
24 May 2010, 31 May 2010,
16 June 2010, 2 July 2010,
118/038, 118/039,
4 July 2010, 18 July 2010,
20 July 2010, 3 August 2010,
5 August 2010, 12 August 2010,
119/038, 119/039,
19 August 2010, 21 August 2010,
20 September 2010, 6 October 2010,
8 October 2010, 15 October 2010,
120/038, 120/039
22 October 2010, 31 October 2010,
7 November 2010, 9 November 2010,
16 November 2010, 23 November 2010,
25 November 2010
2018Landsat 8 OLI6514 May 2018, 23 May 2018,
30 May 2018, 6 June 2018,
8 June 2018, 15 June 2018,
118/038, 118/039,
24 June 2018, 8 July 2018,
10 July 2018, 17 July 2018,
24 July 2018, 26 July 2018,
119/038, 119/039,
2 August 2018, 9 August 2018,
11 August 2018, 18 August 2018,
25 August 2018, 27 August 2018,
120/037, 120/038,
3 September 2018, 10 September 2018,
19 September 2018, 26 September 2018,
28 September 2018, 5 October 2018,
120/039
12 October 2018, 21 October 2018,
28 October 2018, 30 October 2018,
13 November 2018, 22 November 2018,
29 November 2018
Table 2. Principal component analysis results of the RSEI for 2000, 2010, and 2018.
YearIndicatorPC1PC2PC3PC4
2000NDVI0.525−0.595−0.305−0.527
Wet0.3290.798−0.173−0.474
LST−0.4740.016−0.8800.019
NDBSI−0.626−0.0920.320−0.705
Eigenvalue0.1280.0450.0120.003
Percent eigenvalue68.25%23.82%6.38%1.54%
2010NDVI0.612−0.646−0.147−0.432
Wet0.2680.711−0.251−0.600
LST−0.372−0.161−0.9140.025
NDBSI−0.644−0.2250.284−0.673
Eigenvalue0.1360.0330.0160.002
Percent eigenvalue72.41%17.57%8.76%1.26%
2018NDVI0.598−0.523−0.333−0.508
Wet0.3280.3700.729−0.474
LST−0.383−0.7520.536−0.028
NDBSI−0.6230.155−0.266−0.719
Eigenvalue0.1500.0350.0270.002
Percent eigenvalue70.60%16.23%12.46%0.71%
Table 3. Correlation matrix of indicators (Pearson, p < 0.01).
YearIndicatorNDVIWETLSTNDBSIRSEI
2000NDVI10.1210.6670.7780.838
WET0.12110.4410.6260.590
LST0.6670.44110.7640.866
NDBSI0.7780.6260.76410.972
C0.5220.3960.6100.7230.816
2010NDVI10.2540.5610.8080.897
WET0.25410.4440.7040.607
LST0.5610.44410.6570.751
NDBSI0.8080.7040.65710.970
C0.5410.4670.5760.7230.806
2018NDVI10.399−0.472−0.8930.913
WET0.3991−0.426−0.7290.696
LST−0.472−0.42610.512−0.670
NDBSI−0.893−0.7290.5121−0.974
C0.5880.5180.4700.7110.813
Mean of C0.5500.4600.5520.7190.812
C is the average correlation. It is worth noting that the correlation level between NDVI and WET is low, firstly due to the abundant precipitation in the Taihu Lake Basin and the overall high level of soil moisture in the basin, which makes WET not a limiting factor for NDVI. Secondly, most of the cultivated land in the basin is irrigated farmland, which makes the cultivated land have very high WET values and relatively small NDVI values. The forested land in the basin is mainly located in the hilly areas in the western part of the study area, which has a very high NDVI value and a relatively low WET value. The inconsistency in the spatial distribution of the high values of WET and NDVI resulted in the low correlation between WET and NDVI. The correlation between WET and NDVI in the Lake Tai Basin gradually increased as the proportion of dry land increased with the implementation of water-saving agriculture in the basin [37].
Table 4. Mean values of each indicator in the Taihu Lake Basin for 2000, 2010, and 2018.
YearRSEINDVIWETLSTNDBSI
20000.5940.5460.5430.3410.388
20100.5570.4980.6650.4830.41
20180.5530.5350.680.5120.457
mean0.5680.5260.6290.4450.418
Table 5. Area and Percentage of eco-environment quality levels in Taihu Lake Basin in 2000, 2010, and 2018.
RSEI Level200020102018
Area
(km2)
Percentage
(%)
Area
(km2)
Percentage
(%)
Area
(km2)
Percentage
(%)
Poor (0–0.2) 1561.414.971826.285.811936.366.16
Fair (0.2–0.4)3230.9810.275419.7317.235725.0318.20
Moderate (0.4–0.6)8862.3828.189274.3229.499590.0030.49
Good (0.4–0.6)14,441.4745.9211,687.2237.1610,376.9232.99
Excellent (0.8–1)3351.5610.663240.2610.303819.5212.14
Table 6. Change in the grading criteria of the RSEI.
LevelChange Value
Almost Unchanged | RSEI | < 0.05
Slightly Changed 0.05 | RSEI | < 0.15
Moderately Changed 0.15 | RSEI | < 0.25
Significantly Changed 0.25 | RSEI | < 0.40
Dramatically Changed | RSEI | 0.40
Table 7. Results of the changes in ecological quality in the Taihu Lake Basin from 2000 to 2018.
Change Level2000–20102010–20182000–2018
Area
(km2)
Percentage
(%)
Area
(km2)
Percentage
(%)
Area
(km2)
Percentage
(%)
Dramatically degraded1201.673.82578.851.841694.025.39
Significantly degraded2192.336.971415.534.52875.219.14
Moderately degraded3233.0510.282349.77.47349811.12
Slightly degraded6152.9619.565680.1518.065453.0117.34
Almost unchanged9452.7130.0610,663.9133.918014.1525.48
Slightly meliorated5984.0519.036723.3621.385425.1617.25
Moderately meliorated2181.066.932740.488.712605.118.28
Significantly meliorated875.632.781084.213.451437.854.57
Dramatically meliorated174.340.55211.610.67445.291.42
Table 8. The result of the factor detector for driving factors of the RSEI in the Taihu Lake Basin during 2000–2018.
GDPPopulation DensityElevationSlopeLand-UsePrecipitationTemperature
q0.3040.4180.3080.3090.5940.2080.233
Table 9. The result of the interaction detector for driving factors of the RSEI in the Taihu Lake Basin during 2000–2018.
FactorsGDPPopulation DensityElevationSlopeLand-UsePrecipitationTemperature
GDP0.304
Population density0.456 #0.418
Elevation0.493 #0.57 #0.308
Slope0.498 #0.577 #0.319 #0.309
Land-use0.650 #0.662 #0.621 #0.622 #0.594
precipitation0.431 #0.513 #0.334 #0.337 #0.618 #0.208
temperature0.454 #0.524 #0.384 #0.386 #0.637 #0.447 *0.233
#” and “*” indicate that the interaction of two factors is mutually enhanced and non-linearly enhanced, respectively.
Table 10. Land-use transition matrixes in the Taihu Lake Basin during the period 2000–2018 (km2).
2000–20102010–2018
Cultivated
Land
Forest
Land
Grass
Land
Construction
Land
Unused
Land
Cultivated
Land
Forest
Land
Grass
Land
Construction
Land
Unused
Land
Cultivated land17,474.54 71.32 1.00 3552.02 13.88 16,119.30 30.61 28.22 1448.72 1.17
Forest land41.57 4782.90 4.15 67.83 22.37 31.21 4768.70 10.04 48.28 0.54
Grassland1.32 4.31 143.68 3.56 2.62 1.30 2.96 144.70 2.84 0.03
Construction land130.13 5.71 0.11 4970.58 6.39 176.33 6.27 10.68 8500.45 0.08
Unused land0.05 0.46 0.01 0.89 10.89 1.30 0.44 0.41 11.70 41.64
Table 11. Land-use transition matrixes in the Taihu Lake Basin during the period 2000—2018 (km2).
2000–2018
Cultivated LandForestGrasslandConstruction LandUnused LandSum
Cultivated land16,133.54 76.98 41.00 4865.73 10.03 21,127.26
Forest53.32 4721.33 7.32 112.84 18.43 4913.24
Grassland1.60 3.54 141.49 6.03 2.61 155.28
Construction land166.13 6.35 3.40 4928.88 2.75 5107.51
Unused land0.05 0.50 0.01 1.43 9.64 11.63
Sum16,354.64 4808.70 193.22 9914.90 43.45 31,314.92
Table 12. The correlation coefficients between land-use change and socio-economic indicators.
Correlation AnalysisCultivated LandForest
Land
Grass
Land
Construction
Land
Unused
Land
GDPr−0.8630.1230.890.882−0.175
p0.0060.7720.0030.0040.678
Populationr−0.8490.0920.9060.866−0.233
p0.0080.8280.0020.0050.578
Table 13. Total RSEI variation matrixes for different land-use conversion types in the Taihu Lake Basin during the period 2000–2010 and 2010–2018 (103).
2000–20102010–2018
Cultivated LandForest
Land
Grass
Land
Construction
Land
Unused
Land
Cultivated LandForest
Land
Grass
Land
Construction
Land
Unused
Land
Cultivated land*--−708.91−1.69*-1.38−94.53-
Forest−1.66*-−12.07−3.65-*-−5.26-
Grassland--*----*--
Construction land−2.74--*-4.06-1.34*-
Unused land----*----*
“-” indicates no data or very small value, and “*” indicates any land-use type that was not transformed.
Table 14. Total RSEI variation matrixes for different land-use conversion types in the Taihu Lake Basin during the period 2000–2018 (103).
2000–2018
Cultivated LandForest
Land
Grass
Land
Construction
Land
Unused
Land
Sum
Cultivated land*-4−830.16-−825.83
Forest land-*−0.2−21.46-−23.49
Grassland--*--−0.4
Construction land---*-1.05
Unused land----*0.29
Sum−1.451.144.32−851.96−0.45−848.39
“-” indicates no data or very small value, and “*” indicates any land-use type that was not transformed.
Publisher’s Note: MDPI stays neutral with regard to jurisdictional claims in published maps and institutional affiliations.

