Abstract
This article describes the basic principles and results of an expert system for construction planning and management. In the field of expert opinions, the system greatly helps to determine the limit of unreasonably low construction prices on the basis of a rapid cost analysis. Additionally, it can determine the technologically shortest possible construction periods or can answer the question of whether it is possible to complete the construction in the specified period, provided that a certain amount of construction is currently underway, which is very useful in expert opinions. The system is based on modeling the construction process using the so-called construction technology network graphs. This method allows, among other things, to create and use so-called typical network graphs as preprepared models of individual types of objects in the form of computer files, which can be modified according to the spatial structure of real buildings or facilities when used in creating a feasibility study or efficient time and financial planning and management of the building process. The system also enables the automatic creation of quality assurance checklists (inspection and acceptance plans for quality assurance), environmental plans (plans for the elimination of adverse effects of construction activities on the environment), and safety and health plans. Direct links to the bills of quantities (list of works and supplies with numbering of individual items), budgets (list of works and supplies with prices), or production calculations, despite the operational records of the actual construction process also on the company’s accounting agenda, are available.
1. Introduction—The Most Common Questions of Expert Opinions in the Field of Financial and Time Planning and Management of Projects
In recent years, the following basic requirements have appeared from both suppliers and investor (developer) companies, or from judicial institutions, in the field of financial and time planning of projects for expert opinions:
- What is the limit of an unreasonably low cost of the project and how is it set?
- What is the shortest technologically possible construction time and how is it determined?
- If the project is under construction on a certain date, is it possible to meet the specified required date of its completion and under what conditions concerning the resource allocation (especially workers and finances in real time)?
These questions can be answered relatively quickly and accurately based on a computer model of a project’s implementation. When modeling the building process, it is also necessary that the investor or developer has the opportunity to quickly obtain information on the optimal technologically correct building process and the resulting reasonable price of investment, technologically justified completion date, overview of construction funding, or use of other resources and quality control of the work performed. Furthermore, it is necessary that the potential contractor is able to obtain a contract for a specific supply of construction to respond quickly to the processing of its price and technologically justified bid to the investor and to be able to use these documents in cooperation with the investor for time and financial management of the building process [1,2]. All these issues are solved on a computer using construction technology network graphs, which use and respect the principles of project management and quality assurance of building production.
When creating a model of investment implementation, it is necessary that the software is able to provide evidence to answer basic questions, especially about the price of the project and construction time, the need for funds in real time, the deployment of manpower, the necessary means of production and quality control of construction work, the impact of construction activities on the environment, and issues of safety and health at work (hereinafter SHW).
The quality of this justification, of course, depends on what information on the project under consideration is currently available. Using construction technology network graphs, which use the developed expert software system [3], the user has the opportunity to quickly model the expected building process on a computer based on objectified data on construction processes and according to typical procedures of construction works on various types of buildings, i.e., using so-called typical network graphs. These objectified data have been regularly updated semi-annually for more than 30 years by collecting data from about 10 Czech construction companies and their subsequent processing, see [4]. For successful modeling in the initial stages of investment planning, the documentation for the zoning process is sufficient, from which it is possible to obtain data on the division of the project into buildings, their volume in specific units (m3 of enclosed space, m2 of roads, m connections, etc.), data on their spatial structure, basic data on their construction system, and basic requirements for the construction period. Of course, the more accurate the project documentation, the more accurate the results of the implementation model. The documentation for the building permit, which includes the construction organization plan, or the documentation for construction, is very suitable for modeling the project implementation. This documentation, including the bill of quantities, should also be used for the documents of the construction implementation model for expert opinion.
The project implementation model includes the basic documents of construction technology design, see [3], based on the algorithm for the calculation of construction technology network graphs, i.e., technological analysis as a list of activities with their evaluation of resources needed to calculate their time, price and costs, and material consumption, then the schedule (time chart) or line-of-balance graph, operational and financial plan, graphs and overviews of the need for various economic and technological resources in real time, quality assurance checklist, environmental plan, and health and safety plan. These documents can be supplemented by a budget. Based on the model input data, the supplier can also balance the classification of the anticipated supply in terms of available resources in real time for the entire business program of the company. The modeling of construction implementation conceived in this way serves both time and financial planning and management and becomes a part of the integrated management system (quality, environment, and safety), according to ISO 9001:2015 (quality), ISO 14001:2015 (environment), and ISO 45001:2018 (safety) [5,6,7,8].
2. Current State of the Issue
Over the last 3 decades, a large body of research focused on automated construction planning and scheduling. Some of these efforts introduced methods to use design information to automatically develop the scope of work, establish work breakdown structures, and create optimal project sequences. Others introduced new techniques to formalize the sequencing relationships among scheduled activities and project components. Building on the recent advancements in deep learning and natural language processing and the rise in the adoption of lean construction theories, a discussion is offered on the path for research on automatic generation of dynamic work templates and their inclusion in integrated planning, scheduling, and optimization systems [9]. The research in [10] presents a comprehensive cost comparative analysis of a mass timber building mainly developed with cross-laminated timber. The actual construction cost of the project is compared with the modeled cost of the same building designed as a concrete option. The study is helpful to provide insight into the construction cost of typical mass timber buildings. It also can be used as a guide for the project owners to make decisions regarding their initial investments on a mass timber project. Lean project delivery system (LPDS) has proven to be an effective productivity improvement method, seen in [11]. Despite enormous benefits, the construction industry is struggling with effective implementation of LPDS, especially in achieving lean construction (LC) principles like improving visualization and maintaining effective flow of information. Concurrently, virtual design and construction (VDC) has opened new windows of opportunities for the construction industry through multidisciplinary integration of design, and construction processes and improving automation through visualization. Using the potentials of VDC to effectively implement LPDS is an area scarcely examined in the current body of knowledge. A study completed in [12] identifies the implementation potential of LPDS integrated with VDC, and develops implementation steps to effectively utilize VDC functionalities within the lean environment using a systematic literature review (SLR) process. The research in [12] proposed an integrated decision support system for building asset management that addresses the systematization and coordination of lifecycle data. In this approach, a lifecycle work breakdown structure (WBS) for the asset management system is developed to provide a unified hierarchy to categorize and organize building assets. Since building information modeling (BIM) is a rich information-based platform requiring large volumes of asset data, it is integrated with the WBS-based DBMS to achieve effective integrated building asset management. A case study in [12] demonstrates how the proposed automated solution is used for asset management. The research contributes to the body of knowledge by formalizing a WBS-based unified asset inventory hierarchy and mapping BIM data to the proposed hierarchy for effective asset management. The topic of time planning is not a part of modern construction in recent years, but it has accompanied constructions in the past [13]. It was also part of military department, where it also played an important role [14]. Dasovic et al. presents an achievements survey on the integration of optimization and PMT that allow sustainable construction scheduling, particularly in terms of continuous optimal time and resource allocation throughout the project life cycle. The optimization platform for construction scheduling is given in the article. Focusing on construction scheduling, an in-depth achievement survey was conducted on the integration of heuristics methods, mathematical programming, and special solving methods with conventional PMT as well as optimization-based building information modeling (BIM) [15]. Nusen et al. explored opportunities to develop a multi-objective genetic algorithm (MOGA) for existing BIM. Direct and indirect project costs, actual schedule, and resource usage were tracked and retrieved to create a BIM-based MOGA model. The BIM-MOGA can be used as an efficient tool for construction planning and scheduling, using a combination of existing BIM along with MOGA for professional practices [16]. Sepasgozar et al. applied a systematic review method designed to identify scholarly papers covering both concepts “lean” and “BIM” in construction and possibilities of using IoT. Findings revealed a large synergy between lean and BIM in control interactions and a reduction in variations and, surprisingly, there are many uncovered areas in this field. The results also show that the capability of IoT is also largely not considered in recent years [17]. Zavadskas et al. focused on sustainable construction by offering technological, economic, social, and environmental benefits through a variety of methodologies and tools, including fundamental decision-making models and methods as well as advanced multi-criteria decision making (MCDM) methods and techniques [18]. In their study, Onososen et al. adopt the “interpretive structural modeling approach” to advance a ranked structure of the interrelatedness of the barriers to integrating BIM in buildings sustainability assessment. The “Matrice d’Impacts croises-multipication applique a classement analysis (MICMAC)” was utilized to ategorizes the identified adoption barriers in the model. The findings are critical for policy, stakeholders, and extending the body of knowledge [19]. There are other researchers [20,21,22] who have focused on multi-criteria optimization, taking into account criteria such as construction time, costs, and energy efficiency in the application for selected construction processes.
3. Necessary Conditions for the Creation of a Construction Technology Design of Project on a Computer
For a quick and accurate creation of a model of the building process, a database for modeling the building process is available, which has been regularly updated every six months for more than 30 years. The database contains normative data on construction processes in the technological structure of partial construction processes (work gangs), or stage and facility processes. It stores basic data on product labor consumption, labor productivity, composition of the work gang, necessary technological breaks, unit price of the product, costs per unit of the process product; according to the construction industry calculation formula (direct material, direct wages, machine costs, other direct costs, various fees, production overheads, administrative overheads, and profit); and the additional resources needed to produce a unit of measurement for the process product. There are also related databases: quality checks of all construction process products, which are stored in the above-mentioned database of normative data, environmental aspects of all construction processes, and a database of their health and safety risks.
The second part of the database includes type procedures of work on certain types of facilities in the form of construction-technology-type network graphs [2,3] related to the special custom-made measurement unit, according to the type of a facility, e.g., m3 of build-in space or m2 of reconstructed area in the case of a reconstruction. In the technological sequence, the typical network graphs contain all construction activities that may occur during the construction of the building or facility, including all technological and organizational links. For frequently occurring activities, the volume of work related to the purpose for unit of measurement of the building is also entered. These typical network graphs can be modified to model the optimal construction process according to the spatial structure of a particular object. In their creation, the method of construction technology network graph is also used, which enables this modification with the help of the so-called minimum working space indices. Typical network graphs can be adapted by a particular user to his established habits in the composition of work gangs or to the most frequently used technologies of implementation individual types of facilities, as well as to the used construction systems. The user can also create his own typical network graphs. At present, there are about 50 standard network graphs for the construction of various buildings available.
However, the expert system is completely general and open and may not always use only typical network graphs and data from the mentioned databases for modeling the building process of the project. It is possible to enter any activities into the computer model of the project implementation (types of construction processes, parts of machine technology, design, investment and development activities, etc.). However, the use of preprepared typical network graphs and databases greatly speeds up the work of modeling the building process. In contrast to systems that do not have these options and where each model of the building process must be created by successively entering all activities and links of the network graph, activity times, required resources, etc., using a system that exploits the construction technology network graphs will speed up work in project planning by more than fifty times.
For expert opinions, it is necessary to be able to refine the models of the building process created according to the typical network graphs by converting data about quantities and prices of activities from bills of quantities. This system also enables this matter, as it is currently linked to 26 systems for budgeting and production calculations used in Czechia and Slovakia, as well as for any sets of bills of quantities or budgets created in the Excel spreadsheet.
4. On Fast Creation of a Computer Model of Project Implementation
In order to answer the questions from Section 1 with expert opinions, it is necessary to create a model of the project implementation as quickly and accurately as possible. When modeling the building process when planning an investment, we usually start in the first phase with a typical network graph and a database of activities. The type of facility is selected, which is then modeled according to the typical network graph. The course of construction of the building can be modeled according to the number of custom-made measurement units (e.g., m3 of build-in space), or the total price, if known. The computer then automatically creates the appropriate files with all data about construction processes, including all the necessary network graph links and all resources for the facility, taking into account the technological sequence of construction given by the typical network graph.
After such a conversion of the typical network graph to the initial model of the building process of a particular facility, the user has the option to enter the next facility again on the basis of the typical network graph or on the basis of the already prepared and complete construction technology network graph of this next facility. Similarly, one can specify the following facilities in the project, along with entering new main minimum working space indices. It is also necessary to select the link of the currently entered next facility to the previous facility.
In this way, the initial model of the implementation of all the buildings and facilities of the project is gradually created, which is usually further modified. During the modification, it is possible to omit some modeled construction processes, add others, or modify the modeled values from typical network graphs, including data on technological and economic resources, or add or omit other partial smaller network graphs of facilities or their parts in the network graph. If there is no bill of quantity, then the volumes or unit prices, decisively 25–30% of the so-called Pareto activities, which affect 80% of the final price of the building, are usually amended. These volumes can usually also be determined by measuring from the drawings that are part of the design documentation.
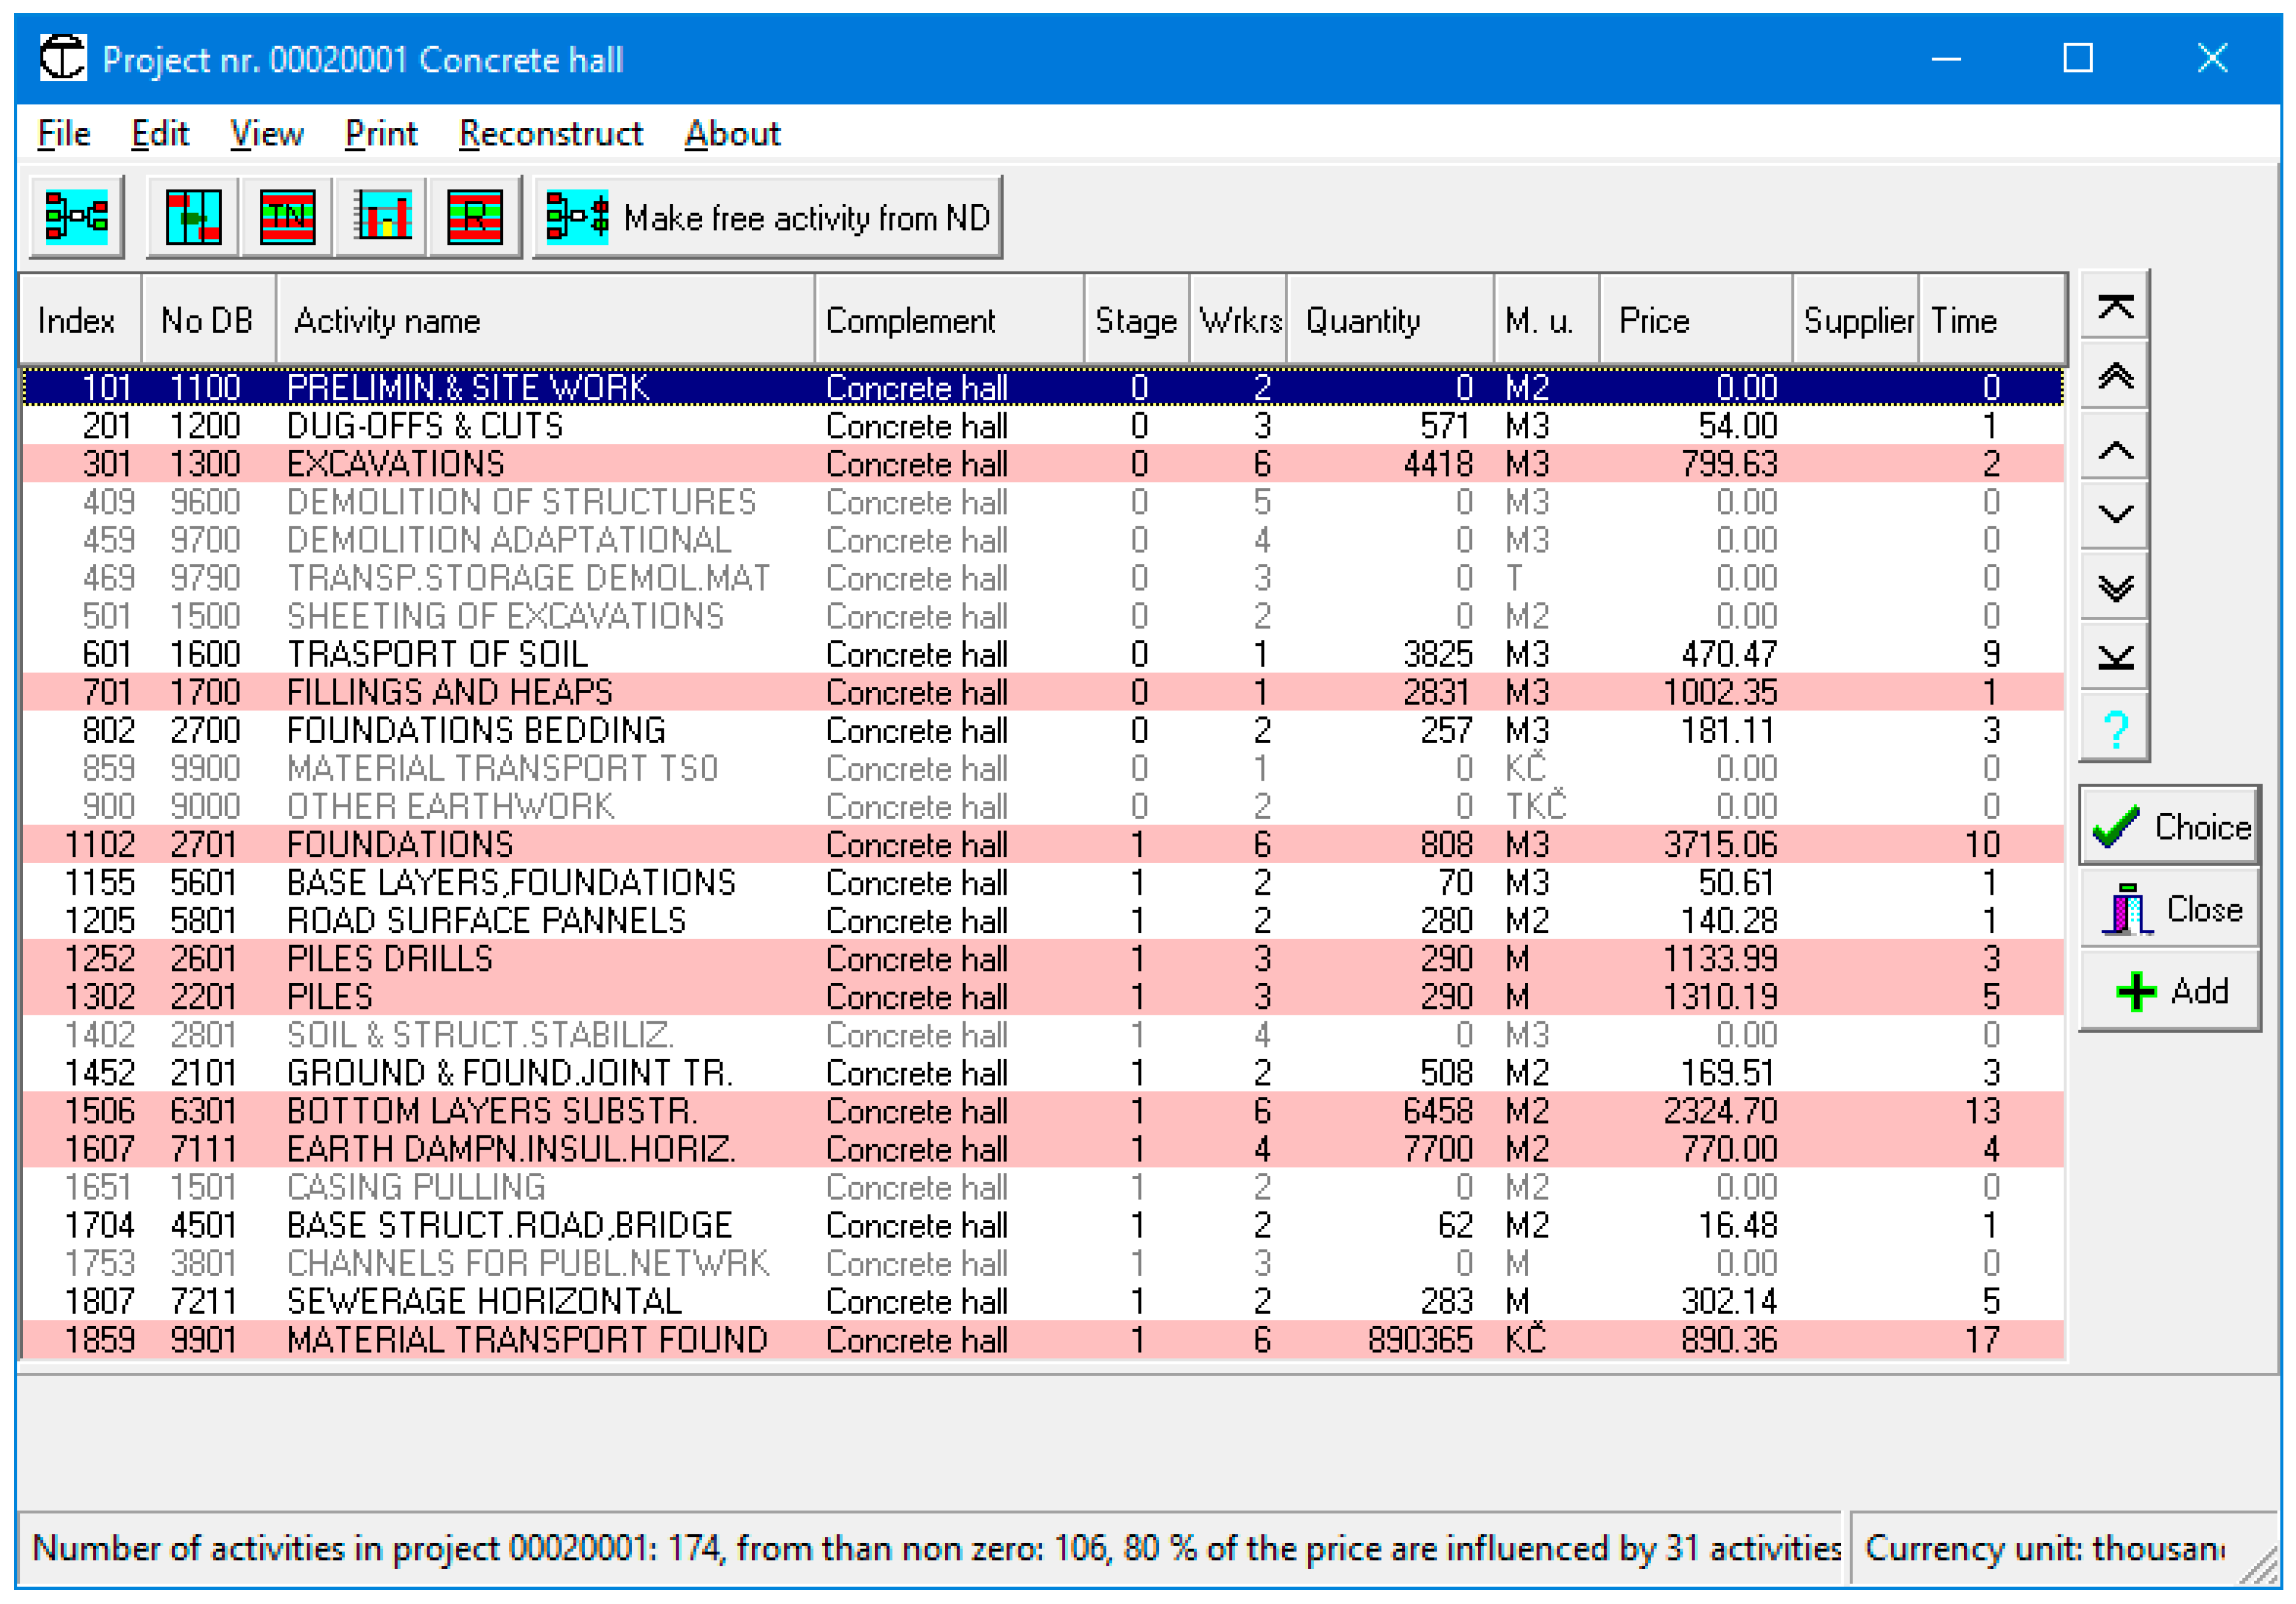
In this way, we gradually refine the model of the course of construction and thus obtain a more accurate picture of the need for resources in real time and the price of the project implementation and its time course, which is determined by calculating a network graph. While respecting the above fact, it is possible to determine, during about 2 h of work, the price of the realization of the project with a deviation of about 5–8% (according to the level of documentation available at the time of creating the model of project implementation) compared to the classic calculation using a program that would last about 2–3 days. The listing of the part of the model with the Pareto activities marked in pink is shown in Figure 1.
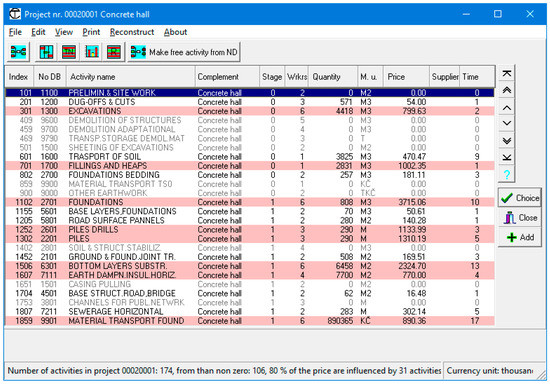
Figure 1.
Listing in part of the model of project implementation.
The model of the building process can be further specified after the elaboration of the budget or production calculation by directly transferring the data from these documents to the project preparation documents. For example, a direct connection of the system for modeling the building process to 26 systems of production calculations and budgets used in Czechia and Slovakia is ensured. If the user has a printed report of the bill of quantity or budget, as a file prepared on any system, especially in Excel, the amounts of production of the budget items or their price indicators from this set can be transferred automatically, even with any necessary adaptation to the technological structure of activities in the network graph, i.e., by aggregating budget items into network graph activities according to the technological division of labor. In the case of expert opinions, this is a necessary condition for the accuracy of the resulting project implementation model.
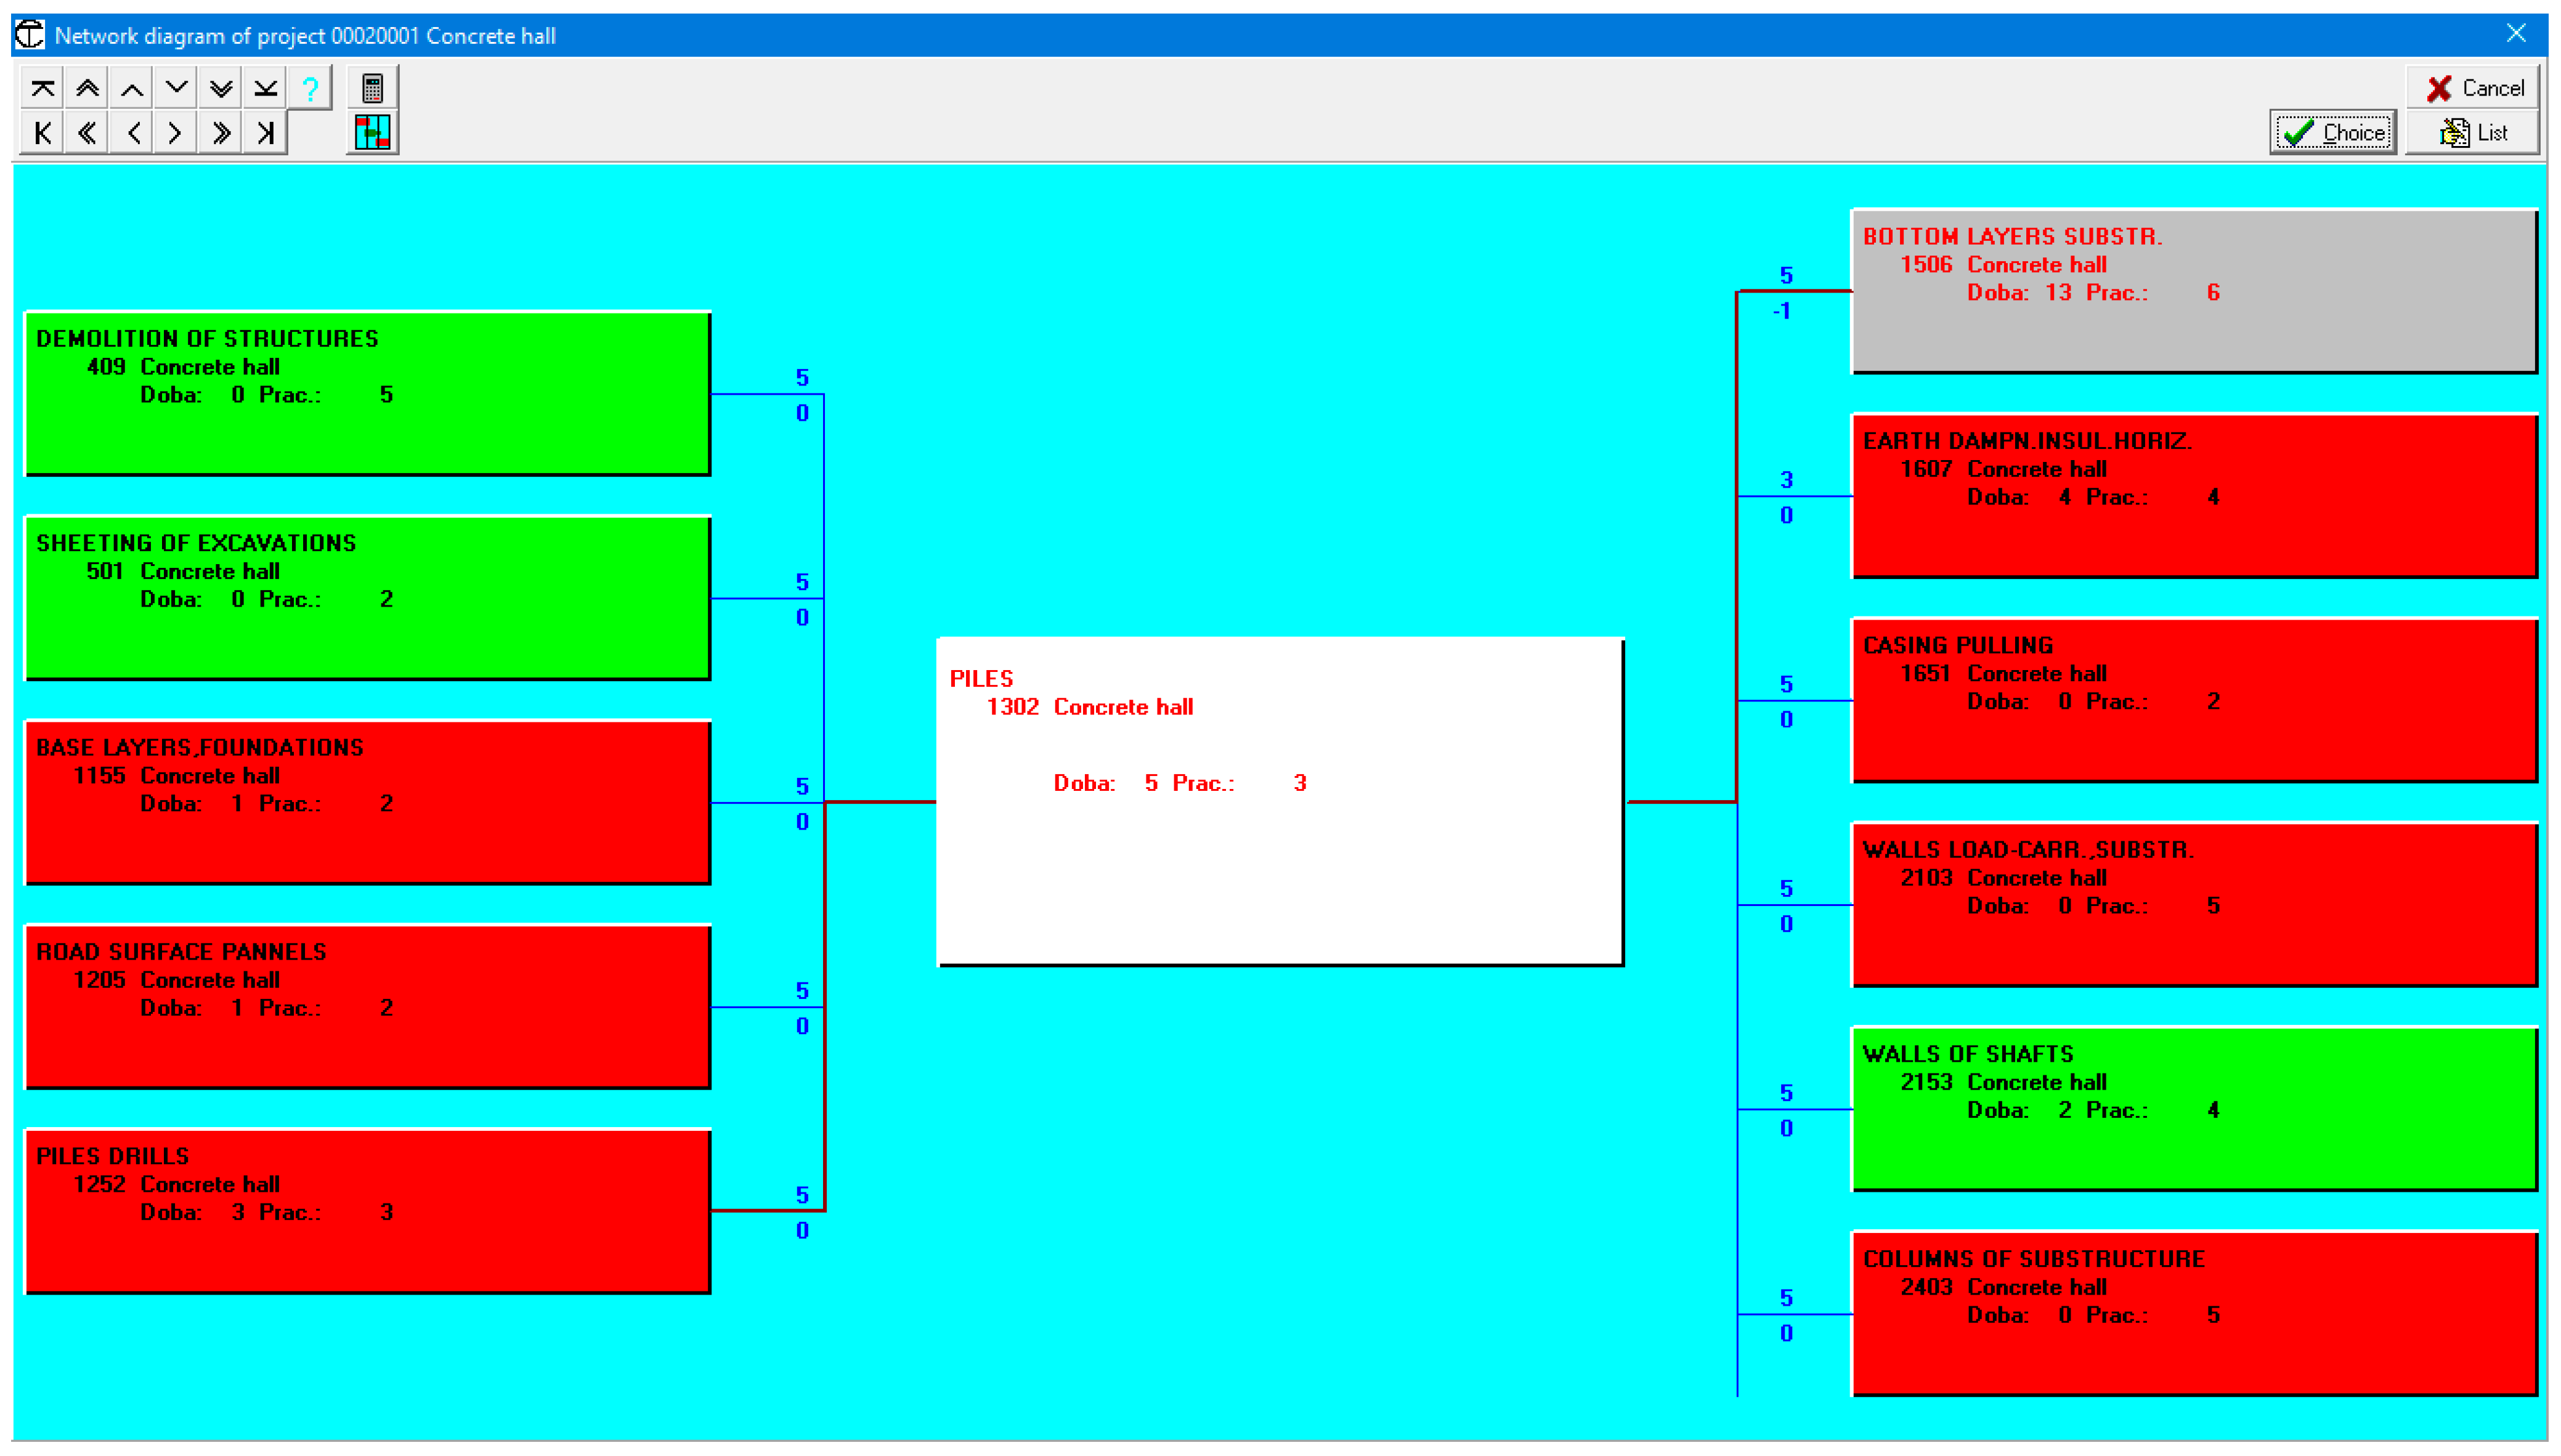
The user can, of course, modify the model network graph according to the conditions of the project in terms of its structure, ambient conditions, and links. Part of the network graph around a certain monitored process can be viewed on the screen with the so-called main links, which are crucial for calculating the terms of the monitored process, and this is shown in Figure 2. Critical activities are marked in red and activities with time reserve are marked in green. The main links are highlighted with brown lines. The numbers above the dark blue and brown lines showing the links indicate the type of link and their specific value (lag time, working space index, or partial link factor).
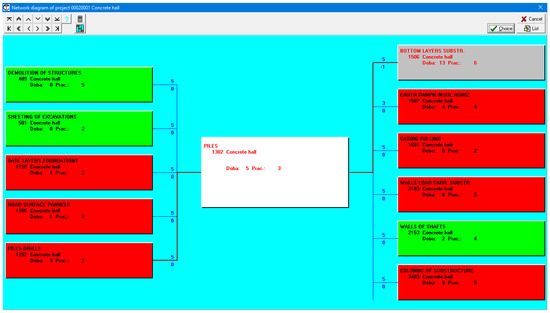
Figure 2.
Part of the construction technology network diagram.
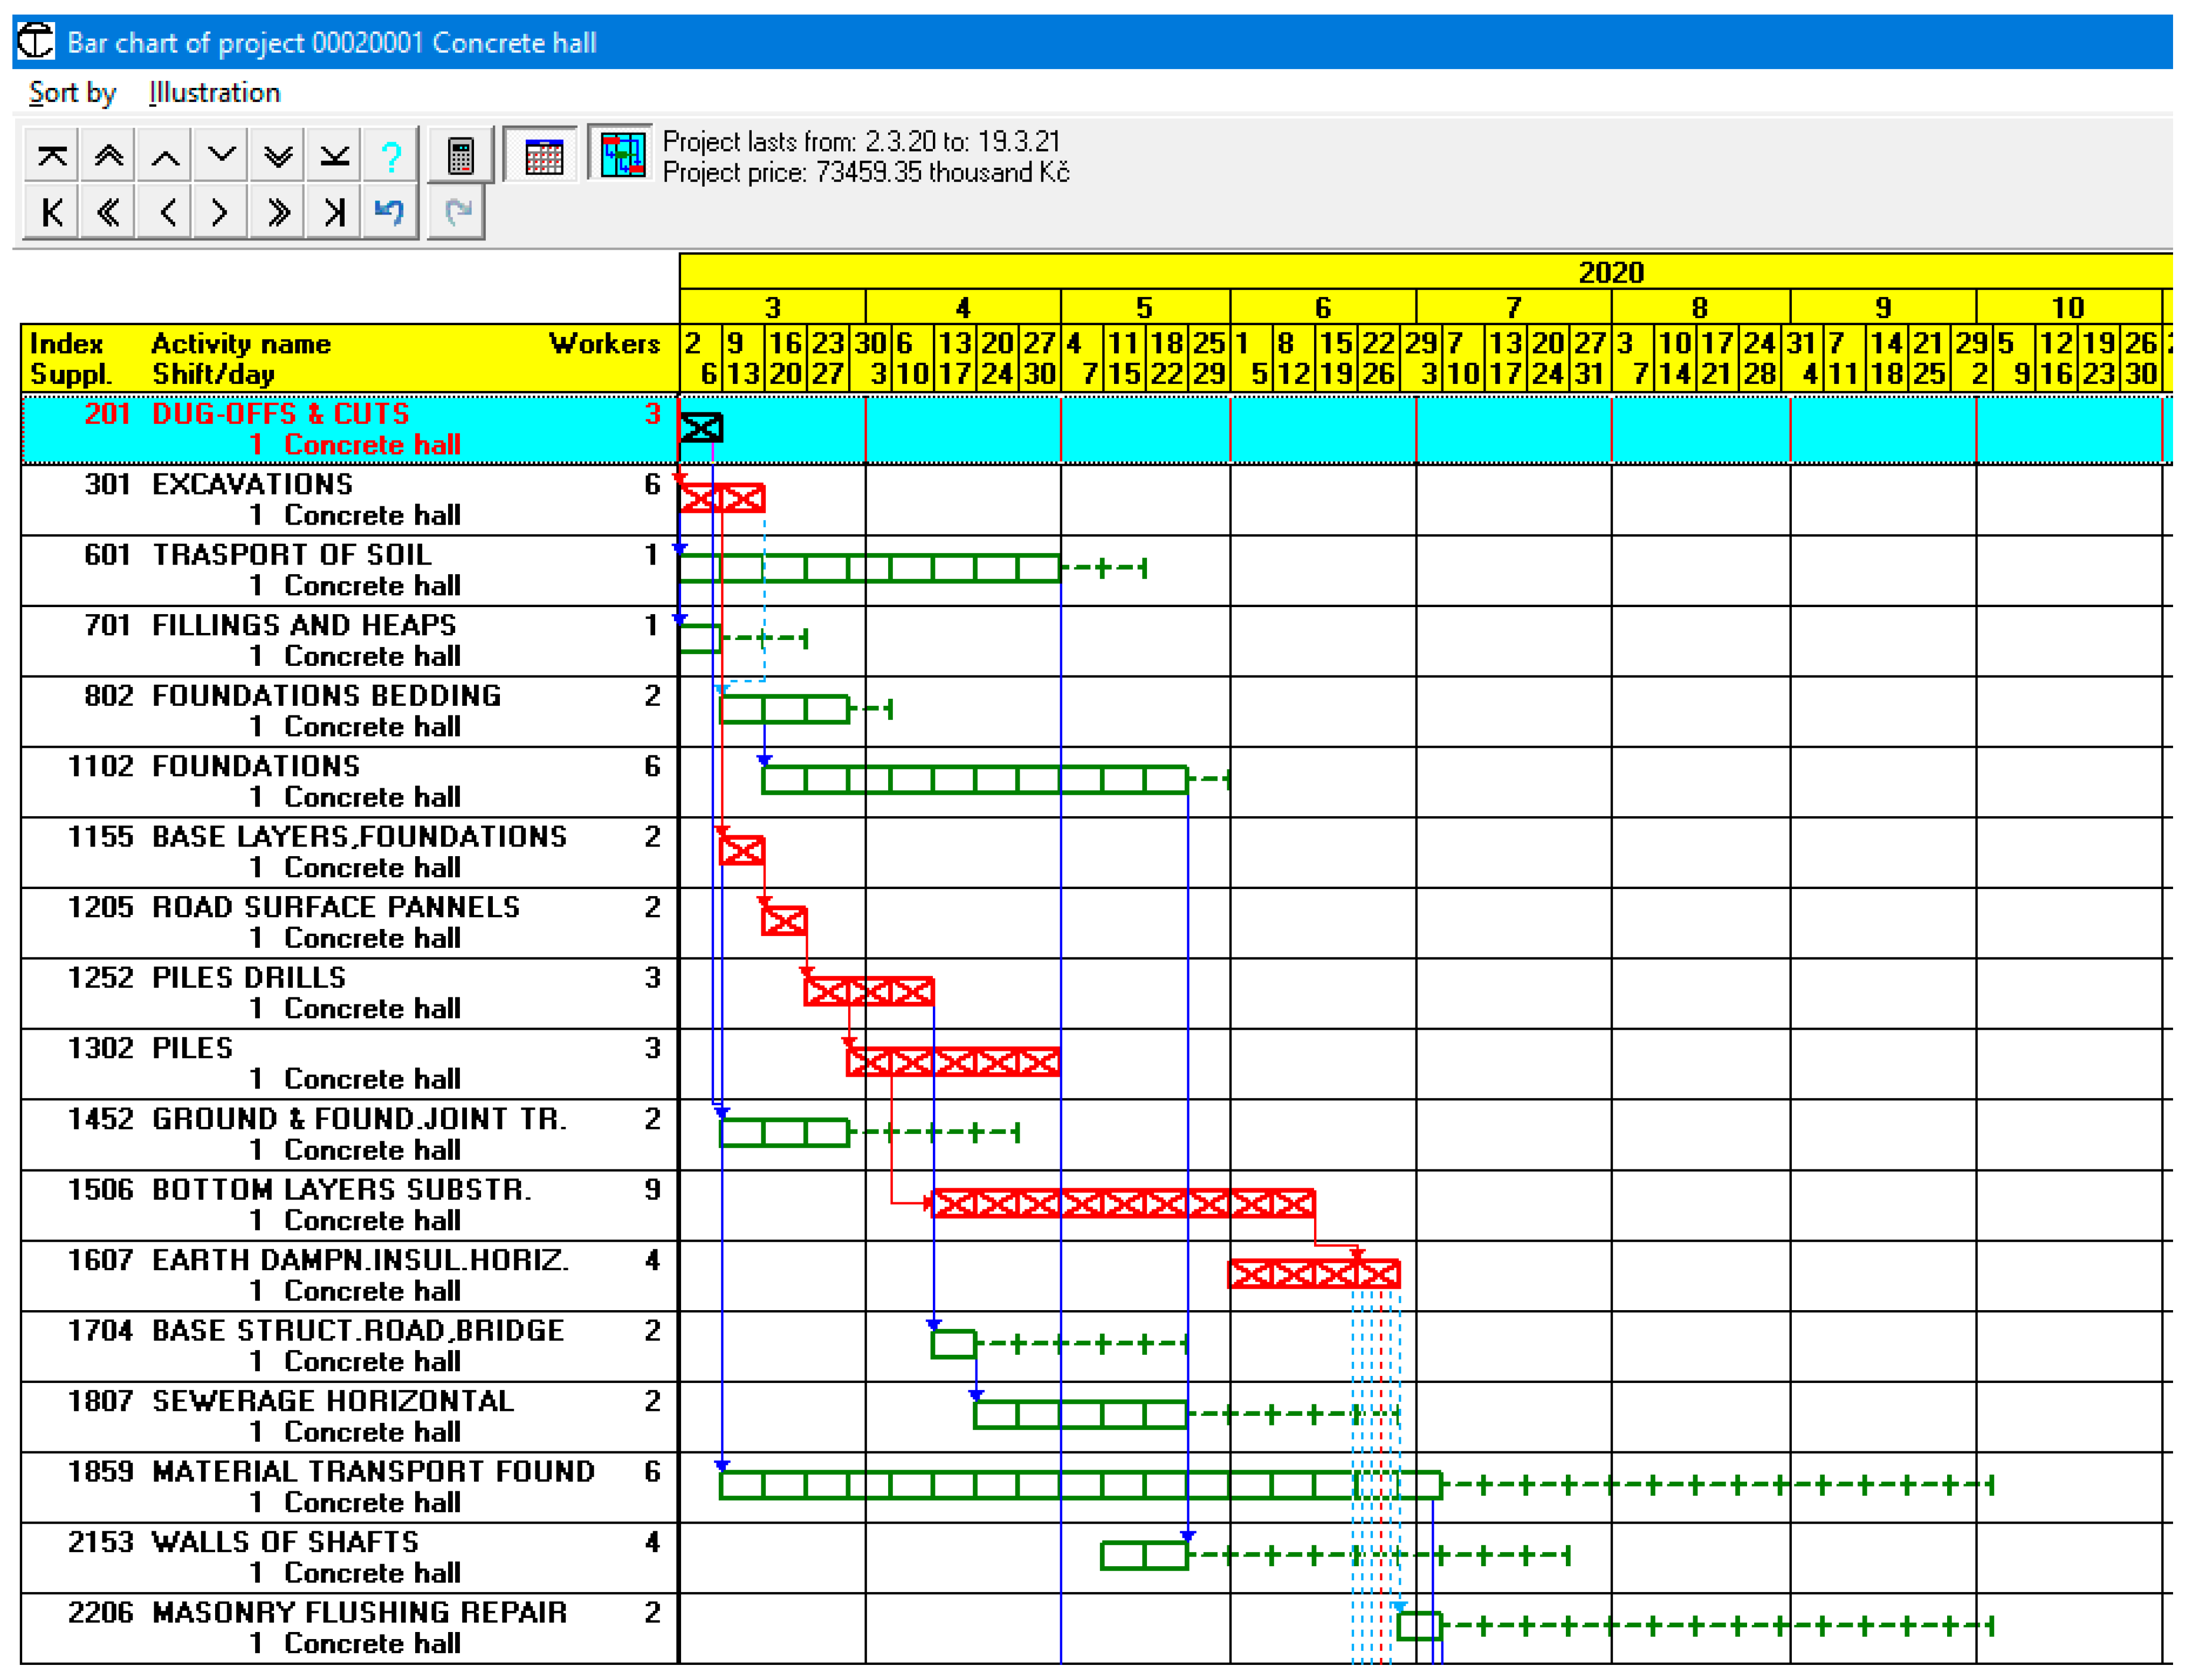
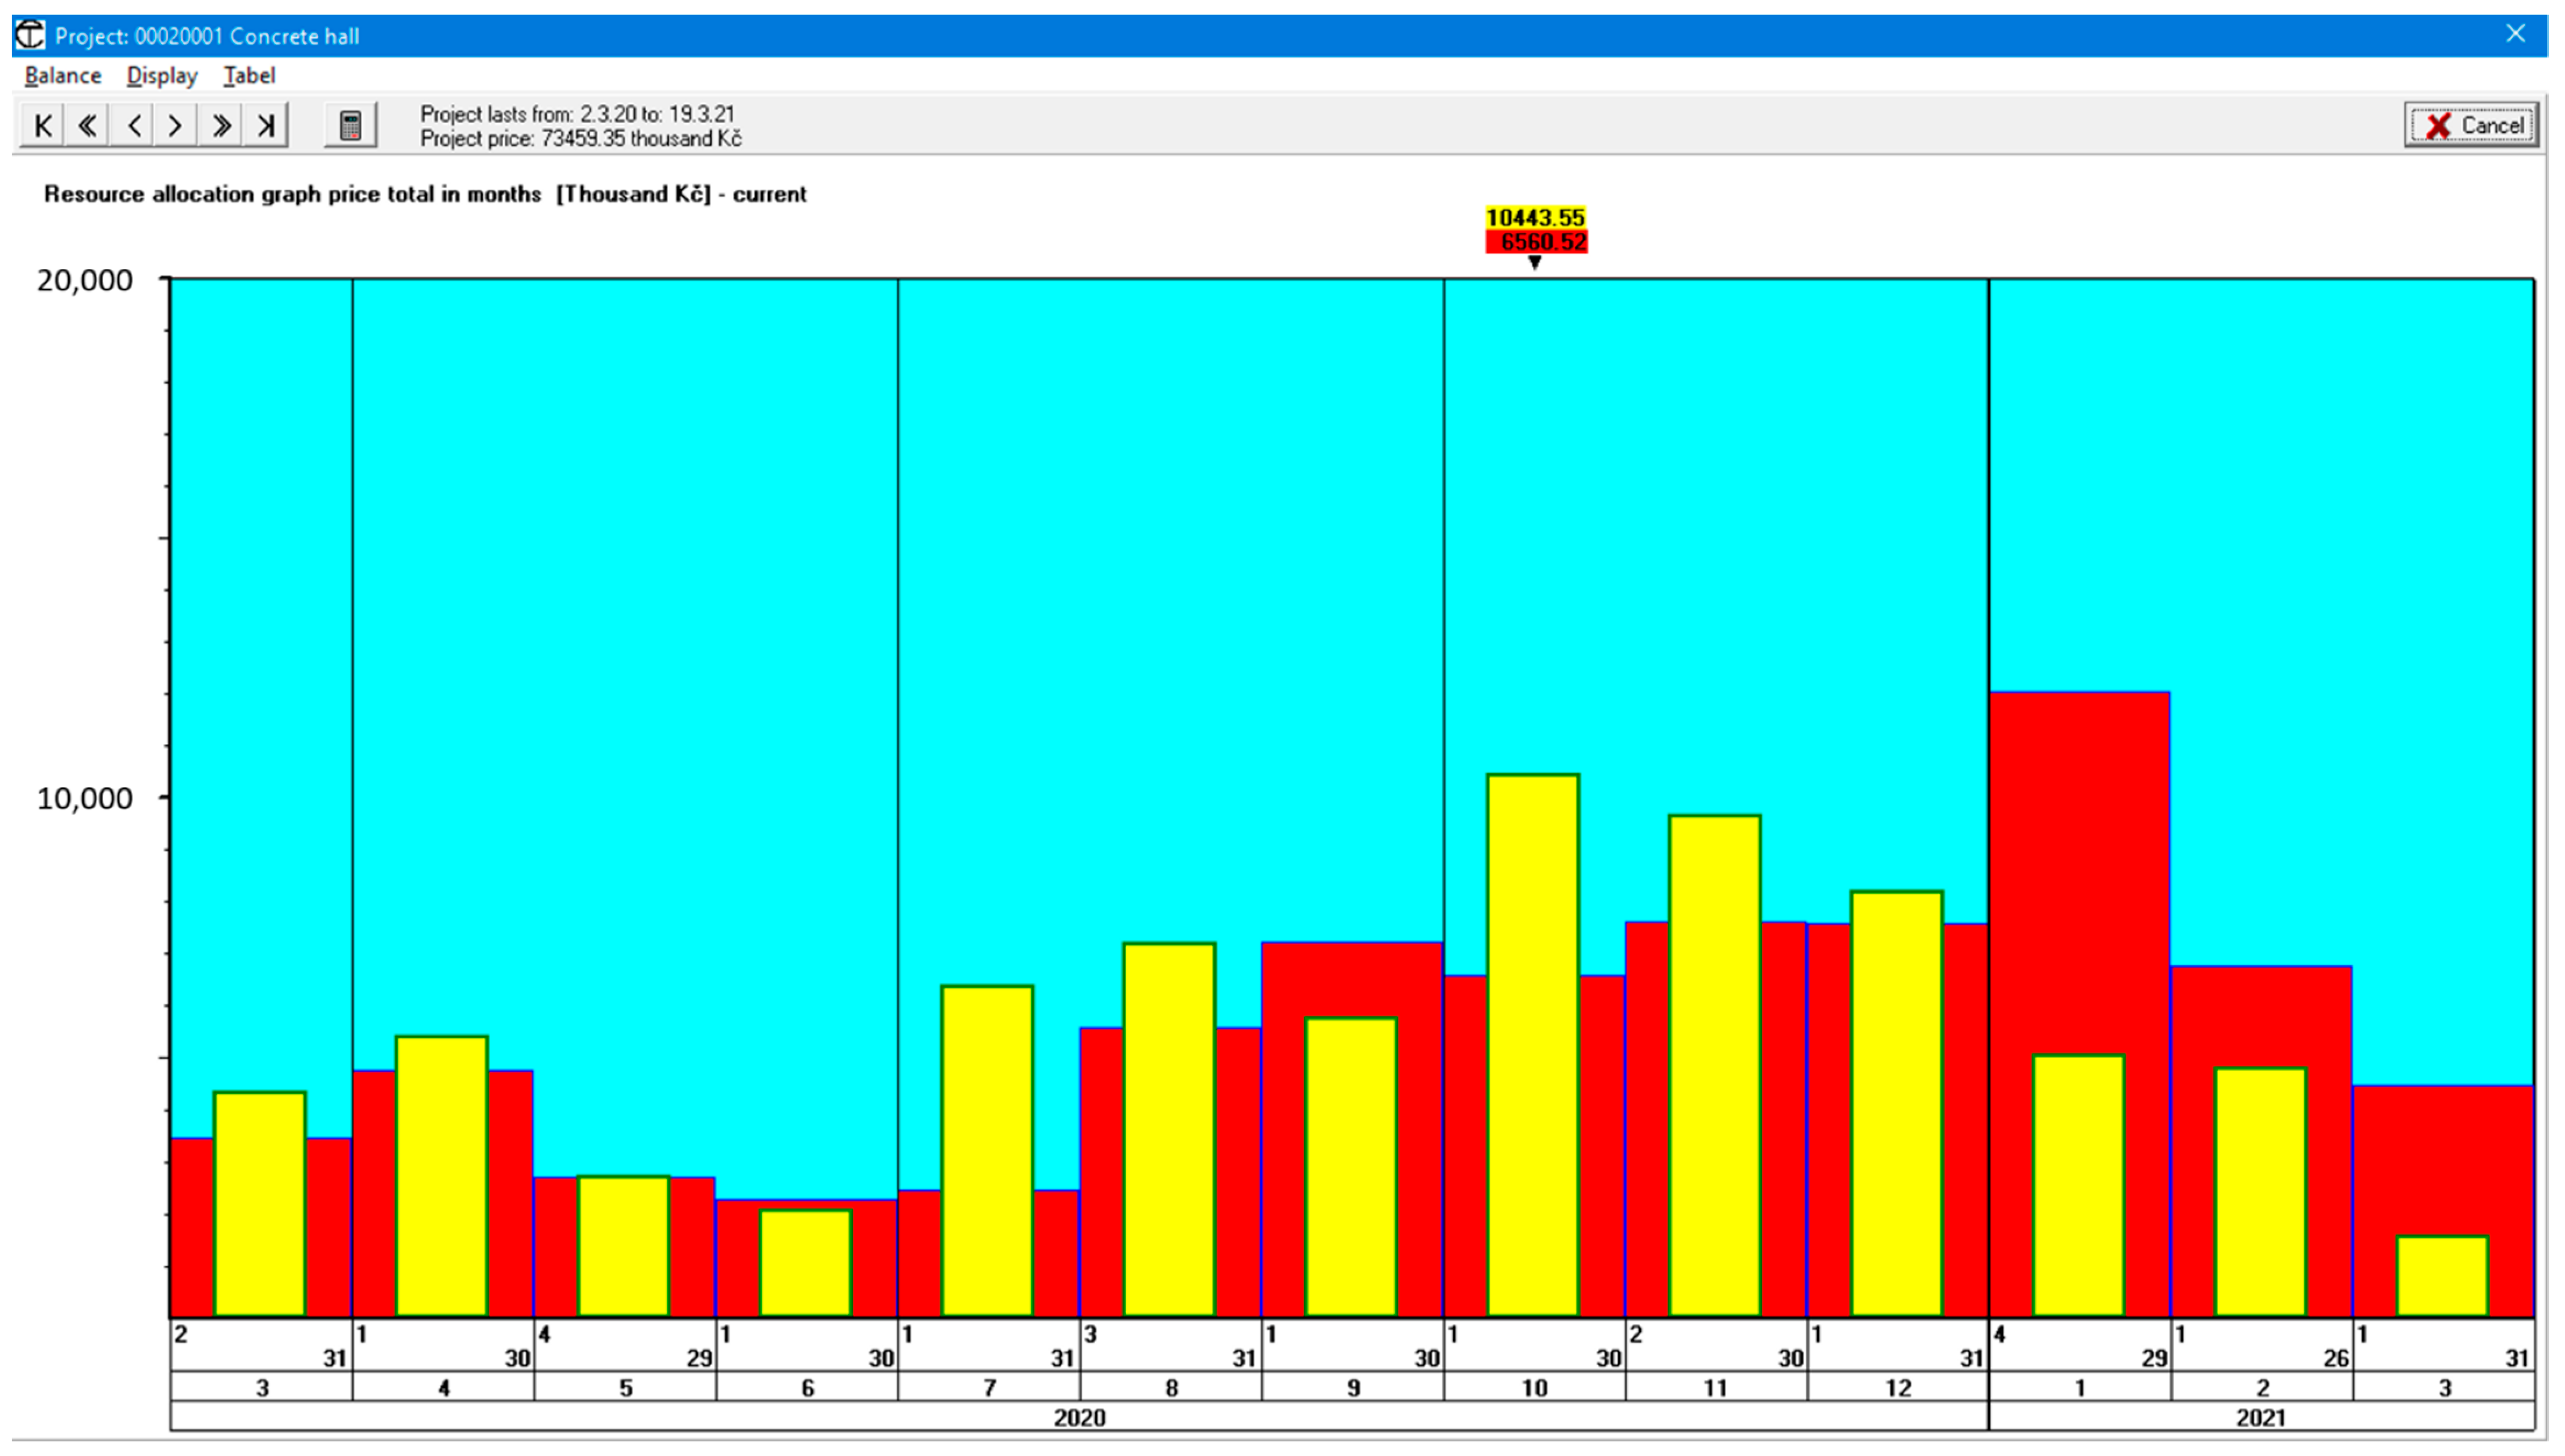
The system also allows you to perform the so-called harmonizing of the network graph, which is a calculation of the number of workers in construction processes with respect to a given date of project completion. After this calculation, the calculated data on the construction period and construction price will appear and it is possible to list the technological analysis schedule, including the main links (see Figure 3), and overviews of the resource allocation of monitored resources, including the number of employees and construction financing (cash flow) in real time (see Figure 4), and possibly to draw a line-of-balance of the construction process. In the schedule in Figure 3, the activities on the critical path are marked in red, the activities with a time float in green, and the delayed activities in blue. The blue or red vertical arrows show the main links of the network graph. In the resource allocation graph of financial needs in Figure 4, the values resulting from the early terms are marked in yellow, and the values resulting from late terms are marked in yellow. Of course, there is a cumulative form of the resource allocation graph for countable resources.
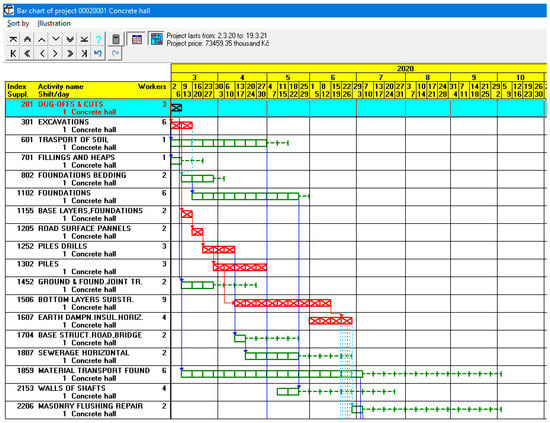
Figure 3.
Bar chart with main links of the network diagram (part).
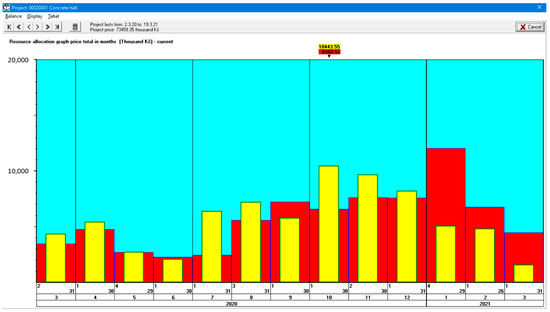
Figure 4.
Finance resource allocation graph (current).
The system is equipped with a so-called mini-calculation, which allows the determination of a different calculation formula for calculating the price of each modeled building. At the same time, the user can set his own percentages of indirect costs (production and administrative overheads) and profit, seen in Figure 5, and then recalculate the final cost of construction. This is very important for answering the first question presented in the Introduction. The user can enter the minimum overhead (not zero) and zero profit, then reduce the calculated price by a percentage of discounts on materials or wages, and after recalculating the model, the user obtains the limit of unreasonably low price.
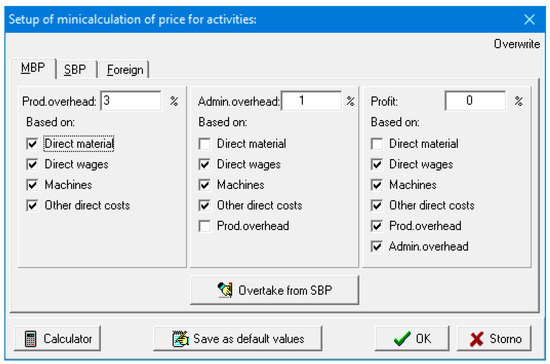
Figure 5.
Indirect cost setting for final price calculation.
The detailed model created in this way, in the technological structure of partial construction processes (work of individual work gangs), is very suitable for managing the implementation of projects directly on the construction site, or for expert opinions, where the construction model must be as accurate as possible. In addition, the model of implementation created in this way, the method of using construction technology network graphs, optimizes the building process due to the maximum use of the minimum working space for work gangs and thus determines the shortest technologically possible construction time for a given number of resources in real time. The user can modify the model, for example, by shortening or elongating some processes directly in the schedule and further improve the created model. The user can also use the automated model harmonizing. Of course, the experienced user must assess himself whether the resulting allocation of resources in real time, especially at peak hours, is still technologically feasible, especially in terms of work space available on the construction site. This is how it is possible to answer the second question posed in the Introduction.
To answer the third question posed in the Introduction, it is necessary to know the percentage of completion of all activities that are underway on the project at the given date of model creation (100% for completed activities, 0% for those that have not yet started, and 0–99% for ongoing activities). In the complete model of project realization, this percentage of completion is simply entered for the individual activities, and then it is possible to deduct the quantities of works already built in the bloc modifications from the total quantities of activities that are in the basic model. This leaves only unrealized quantities of the remaining activities in the model, while of course the structure of the network graph, i.e., all the links from the complete model, will remain in the modified model as well. After recalculating the modified network graph, the user will receive a technologically justified building procedure with the construction deadline of the remaining part of the project, which can be further modified in order to find the appropriate optimum for a given number of resources, or find the answer to the third question.
For the project management of an investor or developer or for the top management of a construction company, this technological structure (information level) of the project implementation model is in many cases too detailed. Therefore, it is possible to further aggregate the detailed model of the building process into other technological structures: processes of technological stage, step of completion processes, building (facility) processes, crafts, works of individual suppliers, and activities defined directly by the user. This approach makes it possible to create an ideal information level of the project implementation model for any user in the field of project preparation and management of the construction implementation process.
5. Follow Up to Other Agendas of Planning and Management of Project Implementation
The building process model created in this way, using the methodology of construction technology design of a building or a project, includes all the necessary data for planning and managing the building process as well as balancing resources. It can therefore be used, in addition to documents for expert opinions, as construction technology documentation for feasibility studies, investment plans, construction organization plans, tenders, preproduction and production preparation, compilation of operational plans, obtaining an overview of technological resources, i.e., crucial material needs, machinery and labor, as well as economic resources, i.e., an overview of construction financing and invoicing. Based on this building process model, it is also possible to automatically create, as a part of the integrated management system [5], the quality assurance checklist a according to IS0 9001:2015 [23], the environmental plan according to ISO 14001:2015 [24], and the health and safety plan according to ISO 45001:2018 [25], using other program modules in the expert system.
During the building period, all documents are very easy to update according to the actually achieved level of completion of parts of the construction work. In the event of a delay, it is possible to automatically calculate the measures that need to be implemented so that the original deadline for project completion is met. Numerical outputs can be exported to an Excel spreadsheet; the entire construction technology network graph can be exported to the MS Project system.
Recently, a software model of operative records and keeping a construction financial diary has been developed, which enables a direct link to the financial accounting of a construction company and mainly serves the needs of operational management of the building process both from the investor’s point of view and from the supplier’s point of view. All outputs except quality assurance checklists, environmental plans, and health and safety plans can be obtained by automatic translation in Slovak, English, Russian, and Italian.
6. Conclusions
The presented paper outlines the principles of rational processing of documents for planning and management of project implementation using computer modeling, based on the use of construction technology network graphs in close connection with the methodology of construction technology design and project management. This method can be used for accurate processing of expert opinions in the mentioned field.
The advantages of using the method described above are obvious: the system using databases and typical network graphs allows very fast creation of building construction models, including calculation of price, labor, and resources usable for investment planning, bid processing and building process management, and debugging and capacity calculation with respect to the required date of project completion. This can also be used as a basis for expert opinions, especially for answering the three basic questions presented in the introductory part of this paper. It is possible to confirm that what is created on other systems in about 1 week lasts about 2–3 h on the described expert system and the outputs are significantly better as they are based on construction technology analysis and synthesis and optimization of the construction process in terms of the maximum use of working space on site. The connection with the systems of budgets and production calculations enables the immediate use of building process models processed in the offer as well as for the processing of production preparation for construction management, due to the possibility of a full transfer of data from the budget or production calculation. It is also important to update all documents with regard to the percentage of completion of construction processes under construction and to calculate the necessary capacities to meet the deadline for project completion of the in the event of a delay. The direct connection of the agenda of quality assurance checklists and records of quality controls to the model of the construction process, environmental plans, and records of controls of environmental aspects as well as health and safety plans and records of controls of its risks is also very important.
At present, the mentioned system is used by about 370 construction, investment, and development companies in Czechia and Slovakia. Among the most important building projects for which the basic documents of construction preparation were prepared using an expert system are the reconstruction and completion of the headquarters of Czech Savings Bank in Prague, the Nationale Nederlanden (dancing house) in Prague, reconstruction of the Toscano Palace in Prague, construction of the State Scientific Library in Liberec, construction of the MAFRA printing house in Olomouc, reconstruction of Promstrojbanka in St. Petersburg, reconstruction of the Czech National Building in New York, regeneration and construction of rental halls in the Škoda Plzeň industrial area, construction of modern housing estates, administrative and university units where investors and developers are foreign and domestic companies, and more. The system was also used for the modeling and management of the building process for a number of civil engineering structures (roads, railways, bridges, tunnels, etc.). The system was also used for the processing of time plans in construction organization plans, such as the completion of the Masaryk Hospital in Ústí nad Labem, construction of the Sazka arena, and others. Based on the outputs from the system, a number of expert opinions were prepared for various projects, such as the Domažlice Swimming Pool, Hotel No. 812 on Venceslaus Square in Prague, the Regional Cultural and Educational Center in Zlín, reconstruction and completion of the central part of the Chemical Institute in Prague 6, sewers and water mains in Křivoklátsko, reconstruction of part of the D1 motorway, regional hospital in Cheb, and others. The system is also used in teaching the subject of construction technology (preparation and implementation of constructions) at all faculties of construction in Czechia and Slovakia.
The system can be operated on microcomputers compatible with IBM PC under the operating system MS Windows XP/7/8/10. Operation a hard disk requires free space of minimum 25 MB and printers or plotters. Further information and other programs for the system are available on the website www.sitovegrafy.cz (accessed on 4 May 2022), including a demo version.
Author Contributions
Conceptualization, Č.J., M.P., J.G. and P.Š.; methodology, Č.J., M.P. and J.G.; software, Č.J. and M.P.; validation, Č.J. and M.P.; formal analysis, Č.J., M.P., J.G. and P.Š.; investigation, Č.J., M.P., J.G. and P.Š.; resources, Č.J., M.P., J.G. and P.Š.; data curation, Č.J.; M.P. and J.G.; writing—original draft preparation, Č.J., J.G. and P.Š.; writing—review and editing, Č.J., M.P., J.G. and P.Š.; visualization, Č.J.; supervision, Č.J. and J.G.; project administration, J.G.; funding acquisition, Č.J. and M.P. All authors have read and agreed to the published version of the manuscript.
Funding
This research received no external funding. It is a private research of Čeněk Jarský, DSc. financed by himself.
Institutional Review Board Statement
Not applicable.
Informed Consent Statement
Not applicable.
Data Availability Statement
Data supporting reported results can be found at: Čeněk Jarský, DSc., CONTEC, Mánesova 819, 278 01 Kralupy n. Vlt., Czechia, www.contec.cz, accessed on 4 May 2022.
Conflicts of Interest
The authors declare no conflict of interest.
References
- Jarský, Č. On modeling of the building process by a computer expert system. In Proceedings of the Eighth International Conference on Computing in Civil and Building Engineering (ICCCBE-VIII), Stanford, CA, USA, 14–16 August 2000. [Google Scholar] [CrossRef]
- Jarský, Č. Automatizovaná Příprava a Řízení Realizace Staveb; CONTEC: Kralupy n. Vlt., Chzech Republic, 2000; p. 222. [Google Scholar]
- Jarský, Č.; Musil, F.; Svoboda, P.; Gašparík, J.; Motyčka, V.; Pospíchal, V.; Kovářová, B.; Vyčítal, M. Příprava a Realizace Staveb, 2nd ed.; Akademické Nakladatelství CERM s. r. o.: Brno, Czech Republic, 2019; ISBN 978-80-7204-994-3. [Google Scholar]
- Vrána, P. APSTA—Datová Základna pro Přípravu a Řízení Staveb, Instruktážní Příručka; NETDATA: Praha, Czech Republic, 2021. [Google Scholar]
- Gašparík, J. Quality, Environmental, Occupational Health and Safety Integrated Management System in the Organization: ISO 9001:2015, ISO 14001:2015, ISO 45001:2018; Tribun EU: Brno, Czech Republic, 2019; CD-ROM; p. 131. [Google Scholar]
- Švajlenka, J.; Kozlovská, M. Perception of user criteria in the context of sustainability of modern methods of construction based on wood. Sustainability 2018, 10, 116. [Google Scholar] [CrossRef] [Green Version]
- Kantová, R. Evaluation of construction site noise to allow the optimisation of construction processes and construction machinery selection. Appl. Sci. 2021, 11, 4389. [Google Scholar] [CrossRef]
- Mandičák, T.; Mésároš, P.; Spišáková, M. Impact of information and communication technology on sustainable supply chain and cost reducing of waste management in Slovak construction. Sustainability 2021, 13, 7966. [Google Scholar] [CrossRef]
- Fouad, A.; Hui, Y.K.; Mani, G.F. Automated methods and systems for construction planning and scheduling: Critical review of three decades of research. J. Constr. Eng. Manag. 2021, 147, 03121002. [Google Scholar] [CrossRef]
- Shafayet, A.; Arocho, I. Analysis of cost comparison and effects of change orders during construction: Study of a mass timber and a concrete building project. J. Build. Eng. 2021, 33, 101856. [Google Scholar] [CrossRef]
- Aslam, M.; Gao, Z.; Smith, G. Integrated implementation of Virtual Design and Construction (VDC) and lean project delivery system (LPDS). J. Build. Eng. 2021, 39, 102252. [Google Scholar] [CrossRef]
- Al Kasasbeh, M.; Abudayyeh, O.; Liu, H. An integrated decision support system for building asset management based on BIM and Work Breakdown Structure. J. Build. Eng. 2021, 34, 101959. [Google Scholar] [CrossRef]
- Makýš, O.; Krušinský, P. Stredoveké staviteľstvo, Výstavba Sakrálnych Stavieb I., Sakrálne Stavby v Stredoveku, 1st ed.; Renesans: Pezinok, Slovakia, 2020; p. 92. [Google Scholar]
- Makýš, O.; Németh, A. Vojenské Staviteľstvo Bastiónových Pevností Polovice 19. Storočia, 1st ed.; Renesans: Pezinok, Slovakia, 2016; p. 239. [Google Scholar]
- Dasović, B.; Galić, M.; Klanšek, U. A survey on integration of optimization and project management tools for sustainable construction scheduling. Sustainability 2020, 12, 3405. [Google Scholar] [CrossRef] [Green Version]
- Nusen, P.; Boonyung, W.; Nusen, S.; Panuwatwanich, K.; Champrasert, P.; Kaewmoracharoen, M. Construction planning and scheduling of a renovation project using BIM-based multi-objective genetic algorithm. Appl. Sci. 2021, 11, 4716. [Google Scholar] [CrossRef]
- Sepasgozar, S.M.E.; Hui, F.K.P.; Shirowzhan, S.; Foroozanfar, M.; Yang, L.; Aye, L. Lean Practices Using Building Information Modeling (BIM) and Digital Twinning for Sustainable Construction. Sustainability 2021, 13, 161. [Google Scholar] [CrossRef]
- Zavadskas, E.K.; Šaparauskas, J.; Antucheviciene, J. Sustainability in construction engineering. Sustainability 2018, 10, 2236. [Google Scholar] [CrossRef] [Green Version]
- Onososen, A.; Musonda, I. Barriers to BIM-based life cycle sustainability assessment for buildings: An interpretive structural modelling approach. Buildings 2022, 12, 324. [Google Scholar] [CrossRef]
- Gašparík, J.; Motyčka, V.; Šťastný, P.; Szalayová, S. Multi-criteria optimization of mechanized earth processes and its impact on economic and environmental sustainability. Sustainability 2022, 14, 78. [Google Scholar] [CrossRef]
- Motyčka, V.; Gašparík, J.; Přibyl, O.; Štěrba, M.; Hořínková, D.; Kantová, R. Effective use of tower Cranes over time in the selected construction process. Buildings 2022, 12, 436. [Google Scholar] [CrossRef]
- Hyun, H.; Maddah, B.; Park, M.; Lee, D.; Lee, J. Tower crane location optimization for heavy unit lifting in high-rise modular construction. Buildings 2021, 11, 121. [Google Scholar] [CrossRef]
- ISO 9001:2015; Quality Management Systems. Requirements. ISO: Geneva, Switzerland, 2015.
- ISO 14001:2015; Environmental Management Systems. Requirements with Guidance to Use. ISO: Geneva, Switzerland, 2015.
- ISO 45001:2018; Occupational Health and Safety Management Systems. Requirements with Guidance for Use. ISO: Geneva, Switzerland, 2018.

Publisher’s Note: MDPI stays neutral with regard to jurisdictional claims in published maps and institutional affiliations. |
© 2022 by the authors. Licensee MDPI, Basel, Switzerland. This article is an open access article distributed under the terms and conditions of the Creative Commons Attribution (CC BY) license (https://creativecommons.org/licenses/by/4.0/).