Article

Local Indicator-Based Flood Vulnerability Indices and Predictors of Relocation in the Ketu South Municipal Area of Ghana

by
Daystar Babanawo
1,2,*,
Precious Agbeko D. Mattah
1,2,
Samuel K. M. Agblorti
1,3,4,
Emmanuel K. Brempong
1,2,
Memuna Mawusi Mattah
5 and
Denis Worlanyo Aheto
1,2
1
Centre for Coastal Management—Africa Centre of Excellence in Coastal Resilience (ACECoR), University of Cape Coast, Cape Coast PMB TF0494, Ghana
2
Department of Fisheries and Aquatic Sciences (DFAS), University of Cape Coast, Cape Coast PMB TF0494, Ghana
3
Department of Population and Health, University of Cape Coast, Cape Coast PMB TF0494, Ghana
4
Centre for Mixed Migration and Diaspora Studies (CeMMiDS), University of Cape Coast, Cape Coast PMB TF0494, Ghana
5
Department of Environment and Development Studies, Central University, Tema PMB TF253, Ghana
*
Author to whom correspondence should be addressed.
Sustainability 2022, 14(9), 5698; https://doi.org/10.3390/su14095698
Submission received: 3 March 2022 / Revised: 25 April 2022 / Accepted: 29 April 2022 / Published: 9 May 2022

Abstract

:
Certain communities along the coast of Ketu South Municipality in south-eastern Ghana, remain vulnerable to coastal flood events from storm surges, high tidal waves, lagoon overflow, and heavy rainfall. However, the local conditions that make these communities vulnerable are poorly understood and knowledge on which communities are most vulnerable is lacking. This study improves the conceptual understanding of different dimensions of vulnerability that exist across the communities and the various levels of vulnerability that each exposed community exhibits. The study surveyed 354 household heads from selected flood-prone communities including Blekusu, Agavedzi, Salakope, Amutsinu, and Adina. The survey collected data on demographic, social, economic, physical, exposure, and adaptive capacity to flood hazards. The data was then used to construct composite vulnerability indices at community levels. Results from the study demonstrate that the communities have different levels of vulnerability as a result of differences in their exposure, sensitivity, and adaptive capacity levels. The willingness to relocate as an adaptation strategy was determined by household flood duration, number of livelihoods, and sea defence preference. These results are relevant to flood disaster management programs and the adoption of effective adaptation measures that take into account local knowledge. The findings imply that interventions aimed at reducing vulnerability should take into account household characteristics, as well as flood exposure, and adaptive capacity factors.

1. Introduction

Coastal flooding induced by sea-level rise, heavy rainfall, and a flash flood is one of the increasing coastal hazards threatening coastal communities [1,2,3]. According to McGranahan et al. [4], 56 million people reside in the low elevation coastal zones (LECZ) of Africa. The LECZ are areas of 0–10 m above sea level and these zones are often exposed to the threats of sea-level rise.
Global sea level has risen by 1–2.5 mm/y in the past one hundred years [5] and predictions of future sea-level rise range from 20 cm to 86 cm by the year 2100 [6]. From observations, Ghana’s sea level rose at a rate of 2.1 mm/year in the Takoradi port between 1925 and 1970, which conformed with the global rate [7]. Sea level rise may be responsible for the frequent storm surges and tidal wave flooding being experienced along the coast of the Gulf of Guinea [8]. The phenomenon is having detrimental effects on many coastal settlements in the West African sub-region and predictions are that the situation may be worsened in the 21st century and beyond [9].
The coast of Ghana, particularly the eastern coastline, has been noted to be at high risk and prone to the impacts of these threats [10]. Hence, communities along this coastline, including those in the Ketu South Municipality, remain vulnerable to flood hazards. According to Aboagye et al. [11], vulnerability to hazards is influenced by various factors, which are grouped into physical, environmental, institutional, social, and economic factors, and its interpretations depend on disciplinary perspective and context. For example, social scientists tend to define vulnerability as a set of social, economic, and demographic factors that combine to determine people’s ability to cope with stressors [12].
In the literature, vulnerability to hazards such as sea-level rise is a multidimensional concept, encompassing biophysical, socioeconomic, and political factors [6,13]. Knowledge on all these factors provides policy makers with a holistic approach to instil climate resilience in vulnerable areas. According to Wu et al. [14], assessing the physical vulnerability alone does not capture the pattern of differentiated impacts as well as social factors among the populations that are exposed to the hazards. Thus, to provide more efficient and effective adaptation solutions, especially for marginalized and poor communities, composite vulnerability information encompassing the biophysical, political, and socioeconomic aspects of the society is required [15,16,17]. Investigating vulnerability at the local scale is crucial for understanding its characteristics, which are necessary for developing site-specific and appropriate adaptation measures to match the level of exposure and sensitivity of the particular area under study [3,6,18]. Understanding the various factors of vulnerability with respect to exposure, sensitivity, and adaptive capacity of population groups at the local level also drives prioritization and efficient allocation of scarce resources to mitigate, prepare, respond, and recover from disasters. In this regard, this study assesses composite vulnerability levels of selected coastal communities in the Ketu South Municipal area of Ghana, using an indicator-based approach. Secondly, it assessed the predictors of relocation as a possible adaptation strategy in the study area.

1.1. The Concept of Vulnerability

The quest for vulnerability assessment dates back to the 1970s when it became more relevant for reducing disaster risks [19,20,21]. In the research community of natural hazards, vulnerability was first defined as “the degree of loss to a given element, or set of elements, at-risk” and was often quantified in different indices. But the narrative started to change in the 1980s and 1990s when there was a recognition on the importance of environmental, economic, social, and political factors influencing the vulnerability of social systems [22,23]. The idea was to consider different perspectives, including the assessment of susceptibility to harmful impacts and the ability to adapt or moderate the impacts [22], rather than just an exposure assessment, which communicates only the likelihood of risk to policy makers. Recently, IPCC has refined the definition of vulnerability (in terms of climate change) to include exposure, susceptibility (sensitivity), and coping or adaptive capacity [20,24]. These factors can be measured as biophysical and socioeconomic variables.
Aside from the mentioned evolutionary concepts, vulnerability assessment can be conceptualized in terms of disciplines and that can be construed from three main perspectives [25]. The three perspectives are: (1) the risk-hazard concept, which assesses a system’s physical exposure to hazards [26,27,28]. This perspective is common to the disaster risk management discipline. (2) The social constructivist concept dominates the fields of Political Economy and Human Geography and regards vulnerability as a function of socioeconomic and political factors [29]. (3) The third concept is the integrated assessment of biophysical, socioeconomic, and institutional factors to assess the vulnerability of any system to climate change events, which is interdisciplinary [3,11,16,30].
The conception of vulnerability can also depend on the level or scale of analysis, be it the global, regional, country, or local level [20,31]. Some of the factors that are considered important for vulnerability assessment at the global scale often include indicators such as population distribution, relative mortality rate, and relative GDP losses [20,32]. At the regional scale, indicators are selected based on the characteristic of exposure, socioeconomic status, and resilience [30]. Local-scale or community-level assessments of vulnerability differ largely depending upon the scope of the assessment and data availability [16,30,33].
Many vulnerability frameworks and conceptual models have been developed to provide a context-specific understanding of vulnerability at local scales [16,33,34]. An example is the “Hazard-of-Place Model” proposed by [16] and expounded by [3,27,30] to measure composite vulnerability at local levels, which was adapted for this study.

1.2. Developing a Vulnerability Index (Composite Index)

The concept of developing a composite index was introduced in the 1990s to capture the complexity and multidimensionality of development issues [35]. Since then, some studies and international organizations such as the World Bank, United Nations, and European Commission have developed composite indices [35]. Examples include the Environmental Performance Index (EPI), the Human Development Index (HDI), Gender Empowerment Index (GEM), Livelihood Vulnerability Index [36], and Flood Vulnerability Index [30,37], among others.
Developing an index involves the conceptualization of the phenomenon and operationalization of the concept with identified measurable indicators [38]. The operationalization stage mainly involves (i) normalization, (ii) weighting, (iii) aggregation of the indicators scores into an index, and (vi) classification of the results into either quantile, equal interval, natural breaks, or standard deviation, and (iv) uncertainty and sensitivity analysis [39].
When all the indicators are measured with the same unit (e.g., percent or ratios), data can be aggregated without being scaled. However, in many instances, the indicators to be aggregated have various units and measurements such as nominal, ordinal, interval, and ratio scales. In this circumstance, normalization is the technique used to standardize the indicators on a common scale. The choice of a preferred normalization approach should be made with consideration when constructing composite indices, considering the composite index’s aims as well as the data attributes [35]. This is because varied normalization procedures provide different results and can have significant implications for composite index scores [35].
The most widely used normalization techniques in the literature are ranking, Z-score, min-max, and distance to target, as presented in Table 1 below.
The final score and ranking of the composite indices depend on the weighting of the normalized values of the indicators. Weighting reflects the importance of each indicator relative to the overall. Weighting can be very important because it modifies the sub-indices values before aggregation to a composite index is done. However, Sajeva et al. [40] found that different weighting techniques do not influence the ranking of composite indices. There is no agreed-upon mechanism for weighing individual indicators. The two main types of weighting in the literature include equal weighting, used in the Human Development Index, HDI [41], and flood vulnerability indices, [42] or unequal weighting [3,41,43].
The aggregation method of a composite index can be compensatory (linear aggregation) or non-compensatory (geometric aggregation). Compensability of indicators, which is defined as compensating for any indicator’s dimension with an appropriate surplus in another indicator’s dimension, is the most fundamental issue in aggregation. The method of aggregation used has a significant impact on the index scores. Moreira et al. [39] found that when geometric aggregation was opposed to linear aggregation (additive), the geometric aggregation (multiplication) approach was more sensitive, as it provided less compensability for the indices, resulting in lower scores. Many vulnerability indices have been aggregated from the IPCC’s three components, Exposure (E), Sensitivity (S) and Adaptive Capacity (C) using any of the two aggregation techniques expressed as:
Linear aggregation (additive function)—V = α1E + α2Sα3C [3].
Geometric aggregation (multiplication function)— V = E S C [30,44,45].

1.3. Adaptation Options

Adaptation has to do with the reduction of risk and vulnerability through taking advantage of opportunities, building or improving the capacity of nations, regions, cities, the private sector, communities, individuals, and natural systems. It is to moderate the impacts of climate change-related disasters on the sectors and mobilize the capacity to implement decisions and actions [46].
Adaptation to climate change hazards in any specific system requires adequate information to select robust options that could be helpful. There is therefore the need to engage people with different knowledge, experiences, and backgrounds. In the case of coastal areas, there are so many adaptation strategies including protection, accommodation, and retreats [47].
The protection option involves reducing the risk of a hazard by decreasing the probability at which it occurs, and this is done by building systems that protect societies or populations and their assets through hard structural (sea defences) or soft structural interventions (e.g., beach nourishment, dune restoration and creation, wetland restoration and creation, etc.). The accommodation option, on the other hand, has to do with changing conditions to improve adaptive strategies or a society’s ability to withstand or cope with the harm that a hazard may cause. This is done through hazard emergency planning, early warning and evacuation systems, hazard insurance, modification of land use and agricultural practices, and modification of building styles, among others. In a physical vulnerability study by Boateng [26], policies that could allow settling in exposed coastal areas were recommended as temporary adaptation measures in certain parts of Ghana. Retreat options can be in the form of relocating away from the hazard through property acquisition, buyouts, or relocation programs to reduce the risk of the event and limit its potential effects [26].
The preference for any of these options is dependent on the local context, such as the type of support (political and public) available, technical and financial resources, institutional capacity, as well as socioeconomic characteristics [48]. It is also influenced by the complexity of the hazard risk in terms of the magnitude of impacts as a result of local characteristics like topography, hydrology, ecological systems, tourism, and the presence of other hazards [48].

1.4. Relocation

Some areas such as regions with low-lying coastal plains, islands, and deltas are highly vulnerable [49]. According to Bukvic et al. [50], due to the complexity of hazards that these areas are exposed to, particularly, areas with interconnected waterbodies (deltas), the robust adaptation option may either be the combination of all the options or considering a retreat, which is relocation. Relocation is an effective strategy for coastal flood hazard mitigation [48], yet its implementation can depend on the integration of governance or institutional frameworks [51]. The willingness of communities and households to consider relocation is another important factor to consider [39,42].

1.5. Conceptual Base of the Study

The concept underpinning this study is the “Hazard-of-Place Model” proposed and explained by Yankson et al. [3], Boateng et al. [27], and Sajeva et al. [40]. The concept discusses the integration of exposure, sensitivity, and adaptive capacity factors in determining the extent of vulnerability of societies to natural phenomena. The concept remains the standard approach used in most climate change vulnerability studies [25]. According to Fussel [25], the conceptualization of vulnerability in a specific setting tends to contain factors of vulnerability that are considered targets for policy interventions. The hazard-of-place model captures vulnerability as a combined effect of physical (exposure), social (sensitivity), as well as wealth and institutional concepts (Adaptive capacity). Figure 1 is a conceptual framework adapted from the Hazard-of-Place Model for this study; it illustrates the three vulnerability factors of exposure, sensitivity, and adaptive capacity with their respective indicators.
The exposure component is a measure of the character, including, the magnitude, depth, duration, and frequency of flood and the population that is exposed to the impact of floods [3]. The sensitivity, on the other hand, is a measure of the social characteristics of a community, including gender, age, disability, marital status, and household size, among others. Thirdly, adaptive capacity measures wealth and institutional capacity, a collection of governance measures (local and external measures), which influence the adaptability of societies and communities that are exposed to extreme events that are characteristic of climate change [28,43,45,52].
Figure 1. Conceptual framework of the study. Source: Adapted from Yankson et al. [3], Marshall et al. [34], and Messner & Meyer [53].
Sustainability 14 05698 g001

2. Materials and Methods
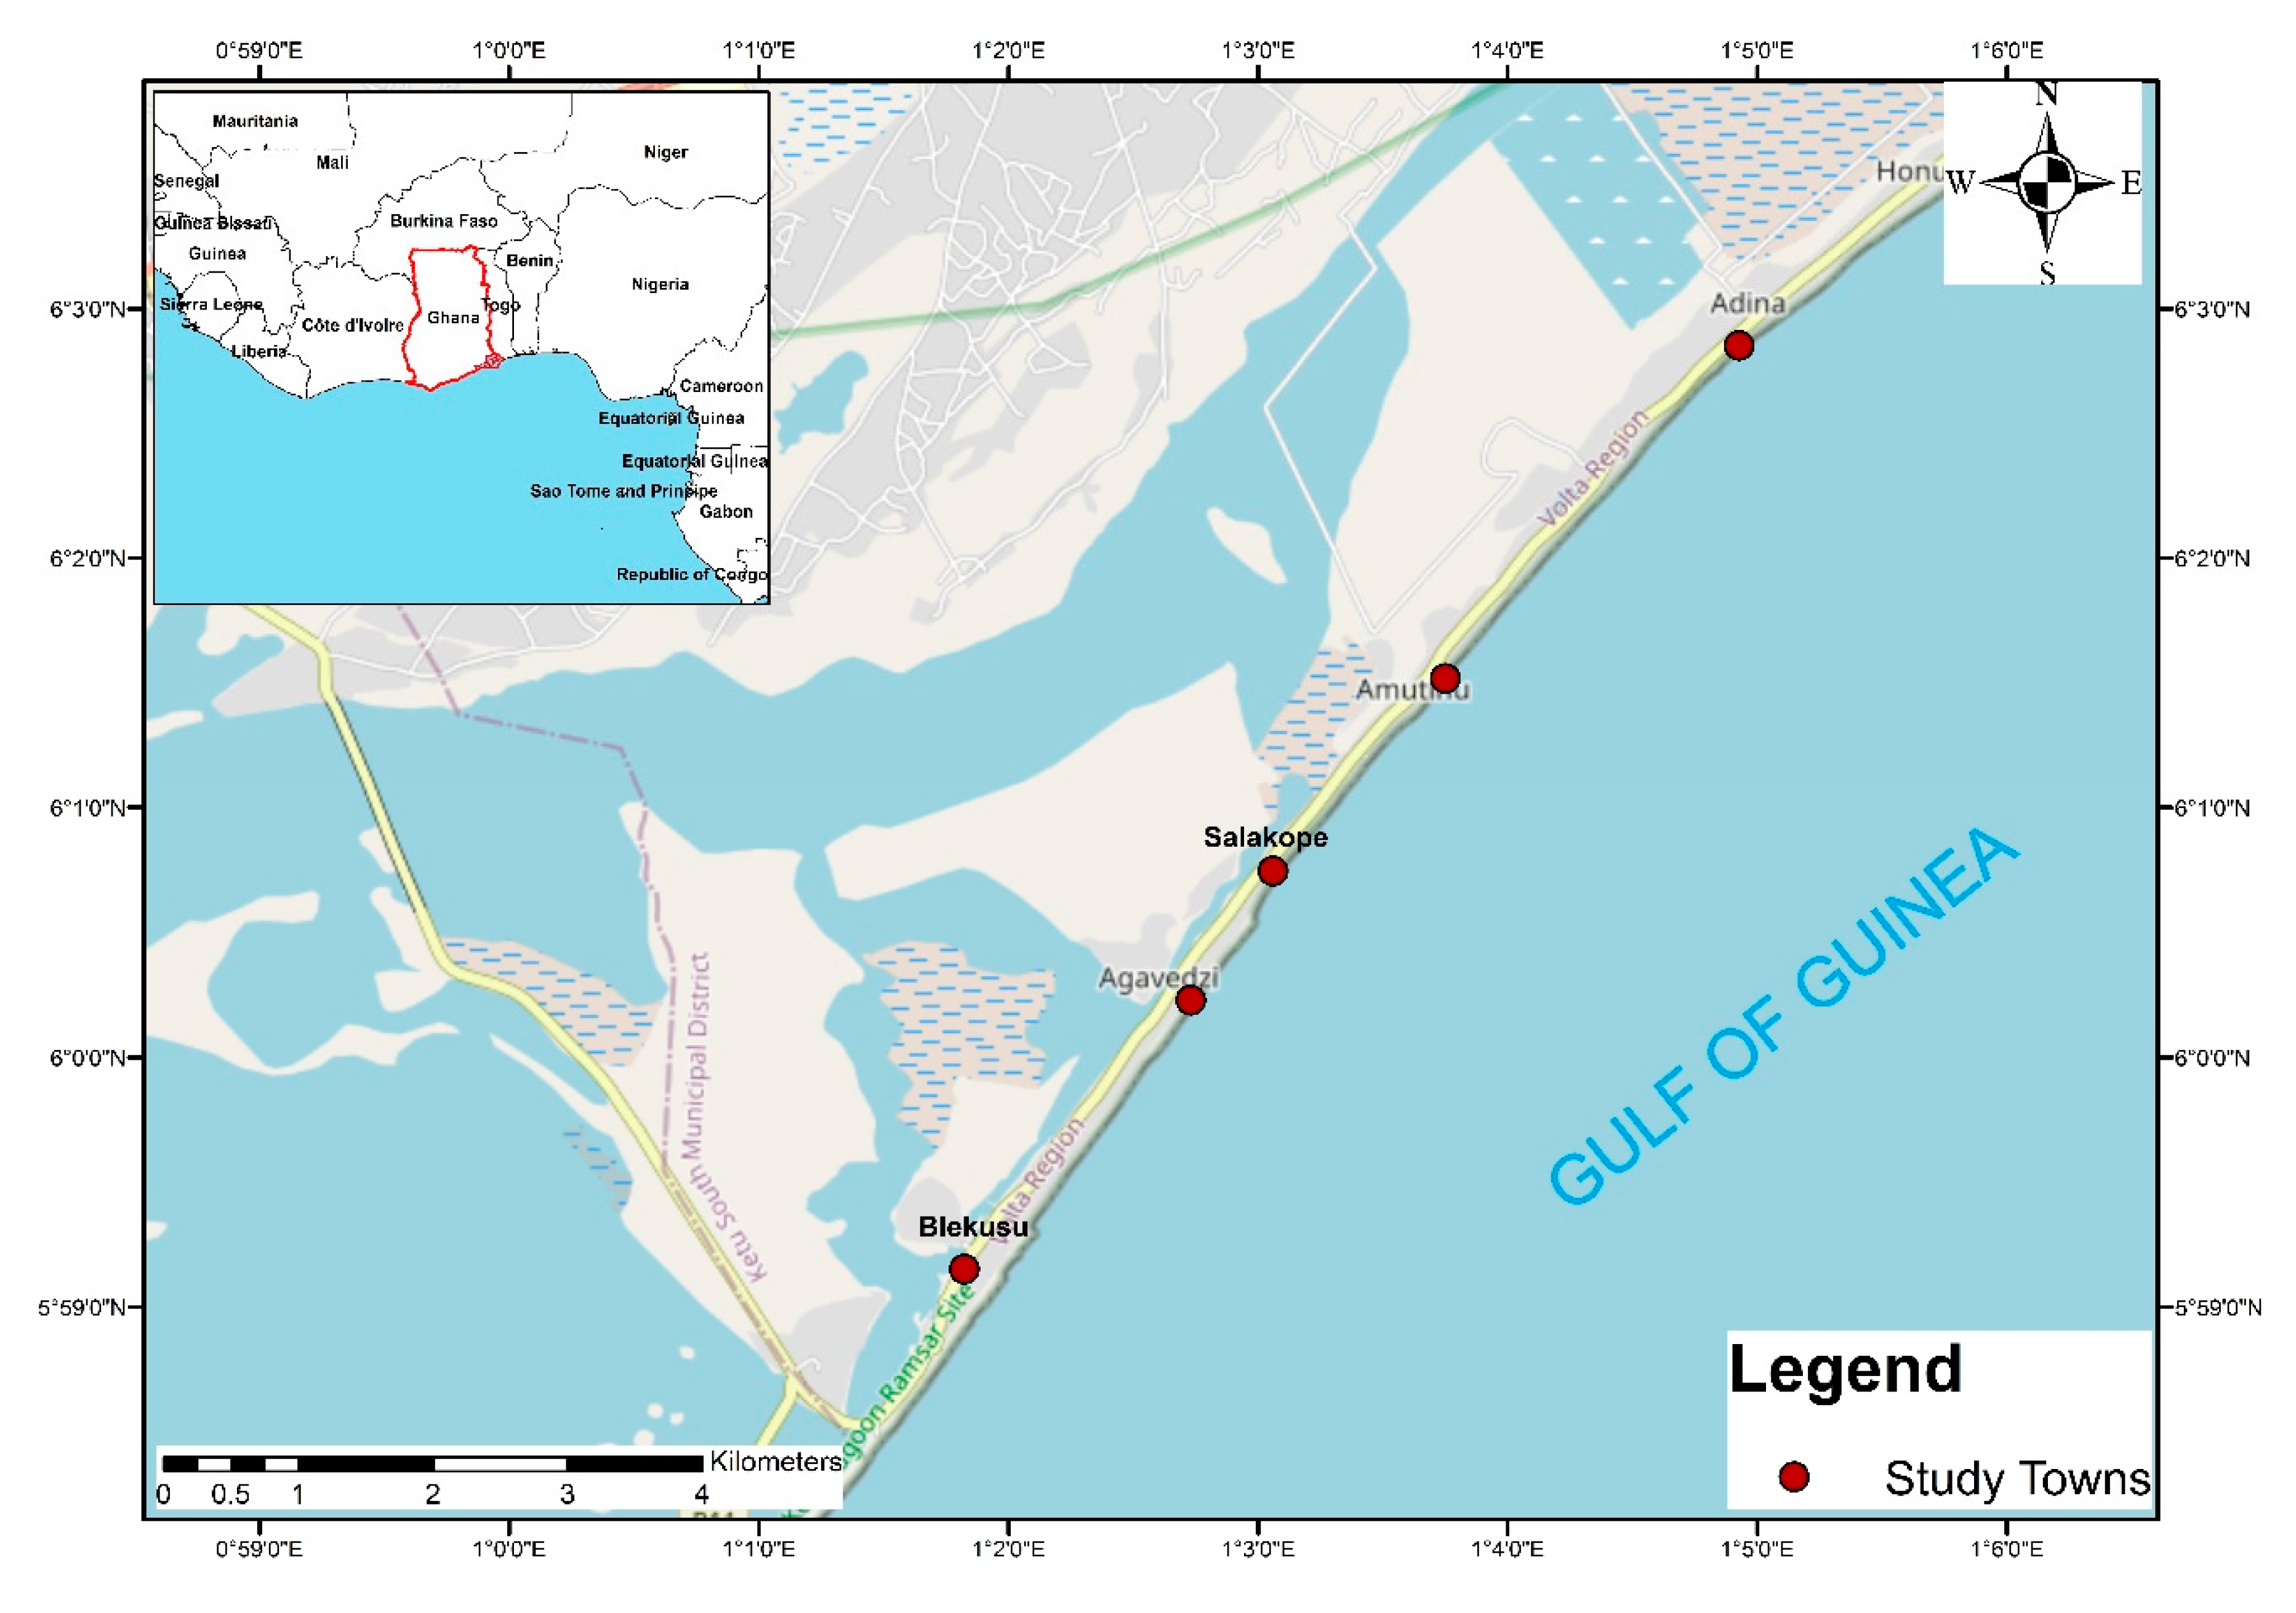
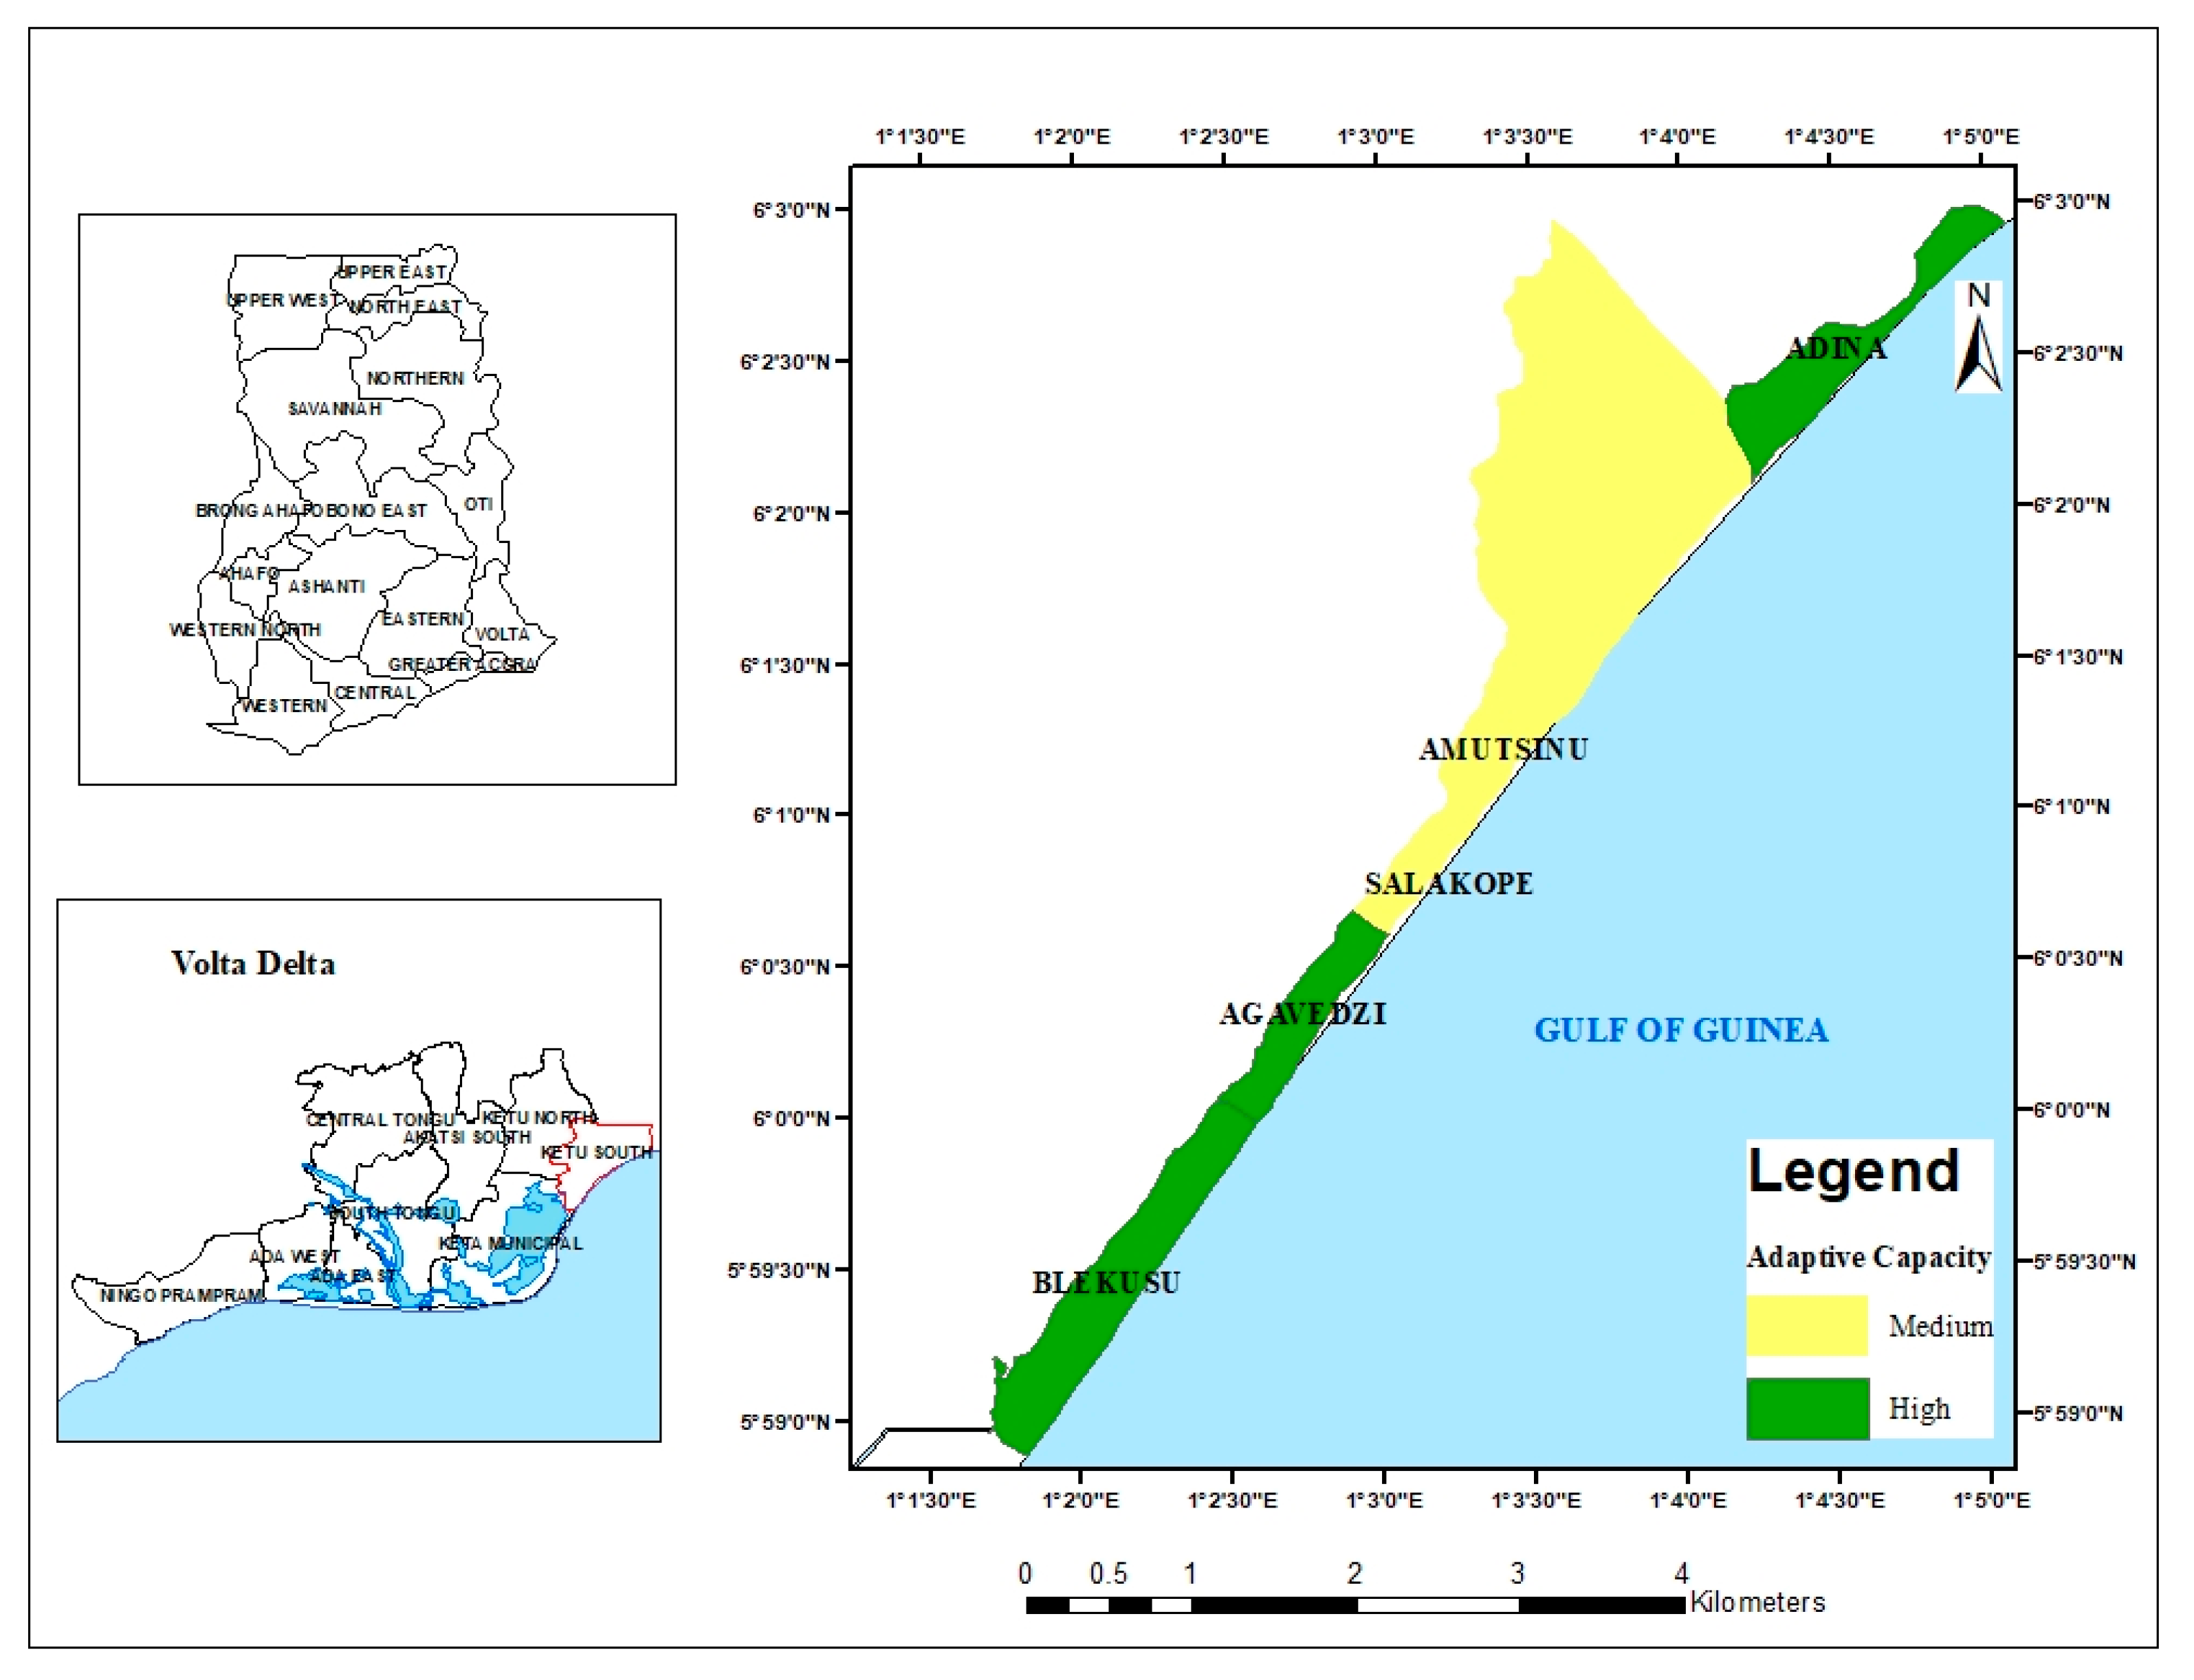
2.1. Study Area

Ketu South Municipality (Figure 2) is located between 6°3′ N and 6°10′ N latitude and 1°6′ E and 1°11′ E longitude. It shares borders on the east with the Republic of Togo, on the west with Keta Municipality, on the north by Ketu North District, and on the south by the Gulf of Guinea. With a total population of 102,905 (2020 population projection, Volta Region), the Municipality covers around 779 km2, accounting for 3.8% of the Volta Region land area [54].
The coast of Ketu South Municipality is located on Ghana’s eastern coast and contains valuable resources such as wetlands (particularly mangroves and marsh lands), lagoons, living marine resources (fisheries), minerals (salt and sand), and groundwater, which would have a significant impact on the municipality’s economy when properly managed. However, the coastline has been classified as being particularly vulnerable to sea-level rise in terms of physical vulnerability; with one meter of sea-level rise, half of the shore can be inundated [10]. In addition, the Ketu South municipal coastal area is a deltaic area with eight major communities wedged between the Keta Lagoon, salt marshes, and the sea, making it prone to sea flooding, lagoon overflows, and heavy rainfalls. Furthermore, the area is already subjected to frequent storm surges and high tidal wave flooding, which has a negative influence on the people and their economic activities [26,55].

2.2. Data Collection

A mixed-method and GIS research approaches were deployed for this study. In line with the mixed-method approach, exploratory sequential research design was adopted for the study. The first phase of the research was qualitative, using Focus Group Discussions (FGDs) as a Participatory Rural Appraisal (PRA) to explore and gain insight and identify local indicators that contribute to the vulnerability of the communities to coastal flooding, and also to map recent flood extents in the various communities. PRA is an approach that allows local communities to share, evaluate, and improve their knowledge on the phenomenon, as well as plan and act [47,48,56,57]. The study was carried out from January to March 2021. In all, nine FGDs were conducted, with a maximum of two in each of the study communities. The groups involved flood victims and community members who supported in rescuing those affected by flood disasters. Following this was a household survey using a structured interview guide, which was developed and pre-tested to collect data on the identified indicators contributing to vulnerability during the PRA. An iterative technique was used to develop the structured interview guide, such that information received from the PRA was used to enhance the structured interview instrument.
Based on the results from the qualitative studies, communities including Blekusu, Agavedzi, Amutsinu, Salakope, and Adina were identified as being regularly exposed to flood events, hence they were selected for the quantitative studies. Population data on the selected communities were collected from the municipal office of the Ghana Statistical office. The population sizes for Adina, Amutsinu, Agavedzi, Blekusu, and Salakope were 1637, 217, 798, 1698, and 200, respectively. The total population size of the five communities was 4550: the target population size. Using Krejcie et al.’s [58] table (Table 1) for sample size calculation, a sample size of 357 was arrived at and was distributed among the communities using the probability proportional to size (PPS) sampling procedure [59,60].
The sample size for each of the community is as follows:
Blekusu = 1698 4550 × 357 = 133
Agavedzi = 798 4550 × 357 = 62
Adina = 1637 4550 × 357 = 128
Amutsinu = 217 4550 × 357 = 17
Salakope = 200 4550 × 357 = 15
The growing demand for research required the development of an efficient method for calculating the sample size required to be representative of a specific target population. The National Education Association used the formula:
S X 2 N P ( 1 P ) d 2 ( N 1 ) + X 2 P   ( 1 P )
for the sample size determination in Krejcie et al.’s [58] table, which is widely used; where:
S = Required Sample Size,
X = Z value (e.g., 1.96 for 95% confidence level),
N = Population size,
P = Population proportion (expressed as decimal)
(assumed to be 0.5 (50%) since this would provide the maximum sample size), and
d = Degree of accuracy (5%), expressed as a proportion (0.5): the margin of error.
Using the systematic sampling technique, every third housing structure was selected and, in each structure, the first household that was met by the research team was interviewed if the household head was available and willing to be interviewed. The structured interviews were therefore administered to the household heads. Before the interviews, the household heads were briefed on the objectives of the study. They were also provided the option of agreeing or refusing to be interviewed at any point in time of the interview. The household heads were further assured of confidentiality and anonymity of the study such that their submissions during the interviews would not be disclosed to any third party. Questions asked during the structured interviews bordered on household demographics, socioeconomic factors, flood characteristics, as well as adaptation measures in the study area.

2.3. Data Analysis

2.3.1. Determination of Indices for Vulnerability

In the determination of vulnerability indices, this study used variables from the survey data as indicators (Table 2). Similar to Yankson et al. [3] and Chakraborty et al. [61], the variables were summarised using percentages and averages (Table 3, Table 4 and Table 5).
Following Yankson et al. [3], the standardization method (min-max) used to develop vulnerability indices at community levels was adopted. The method transforms each indicator into scores that range between 0 and 1. The procedure used by Yankson et al. [3] was followed to standardize each indicator as follows:
I s c = S S m i n S m a x S m i n
where:
  • I s c is the standardized index for each community (c),
  • S is observed value for each community, and
  • S m a x and S m i n are the observed maximum and minimum values respectively.
The mean index, for each of the factors, sensitivity, exposure, or adaptive capacity, was determined using the following formula:
f I S C , m e a n = 1 n I S C
where f refers to either exposure (E), sensitivity (S), or adaptive capacity (A) index, and n is the total number of indicators for the factor.
Following [30,44,45] composite community vulnerability indices were finally determined using the geometric aggregation method (multiplication), as follows:
V = E S C
where:
V = Composite community vulnerability index,
E = Exposure sub-index,
S = Sensitivity sub-index, and
C = Adaptive capacity sub-index.
Following Cutter et al. [16], Balica et al. [30], and Bathi & Das [42], the values of the vulnerability factors were aggregated without weighting. Weighting is done to solve the problem of aggregating indicators with different dimensions (units) and magnitude. However, this problem can be addressed with standardization of the individual indicators [62], and this has been done in the min-max standardization steps above.
The min-max method used to develop the indices transforms the indicator scores between zero (0) and one (1), with 0 being the worst score and 1 being the best score. Following Yankson et al. [3], exposure and sensitivity were ranked as high (≥0.30), medium (0.18–0.29), and low (<0.18); and potential impact was ranked as high (≥0.7) and medium (0.5–0.69). According to Weis et al. [63], since potential impact (exposure + sensitivity) and the composite vulnerability indices are aggregated from the main vulnerability factors, no absolute conclusion can be drawn on their scores; the correct conclusions are relative statements for the communities. Hence, the composite vulnerability scores were ranked using relative statements after [3]; a score of 0.67–1 is highly vulnerable, 0.34–0.66 vulnerable, and 0–0.33 least vulnerable.

2.3.2. Determination of Predictors of Relocation

Negative log-log regression was applied in STATA 16 to examine the predictors of relocation decisions. This type of regression was applied because the outcome of the response variable, relocation, is dichotomous, “No” or “Yes” and more than 50% of the responses were “No”, which is not affirmative. A negative log-log regression model is suitable for a dichotomous response variable that has 55% or more of responses that are not affirmative [64].
The independent variables used for the analyses were selected based on practical significance and theoretical relevance [39,42,54]. The variables included flood duration in houses, number of livelihoods of household heads, and sea defence preference. The analysis also controlled for theoretically relevant compositional factors and contextual factors [64,65]. The compositional factors included gender of household head, age of household head, household size, education, and monthly income of household head, while the contextual factors included communities such as Adina, Agavedzi, and Blekusu. Amutsinu and Salakope were considered as part of Adina since their sample sizes were too small for the analysis. The compositional and contextual factors were controlled in the model, taking into consideration that these factors might affect the responses on the predictor variables [64,65].
In the analysis, a 95% confidence interval was employed, and the level of statistical significance was set at 0.05. The results were reported as odd ratios (OR). An OR of 1 means that the predictor does not affect the odds of relocation, OR > 1 means that the predictor is associated with higher odds of a relocation decision, and OR < 1 means that the predictor is associated with lower odds of a relocation decision.

2.4. Ethical Considerations

Ethical clearance for the study was provided by the University of Cape Coast’s Institutional Review Board (UCCIRB). The ethical approval identification number is UCCIRB/CANS/2021/15.
Table 2. Indicators used for developing the vulnerability indices.
ComponentsIndicatorsDescription
ExposureFlood frequency
Average flood frequency in community
Average flood frequency in households
Flood frequency measures the return period of flood events in the communities.
Average flood durationFlood duration is the number of days the flood takes to recede in the communities.
Flood depth
Percentage of households with flood depth at waist height
Flood depth determines the height of flood from the ground level to the water surface, the higher the depth the greater the degree of damage [66].
Flood magnitude
Percentage of households that reported flood magnitude as more
Flood magnitude was measured based on the perception of the respondents, and this is classified as less, medium, or more.
Flood impacts
Percentage of households who have experienced house property damage
Percentage of households who have experienced livelihood impacts
Percentage of households who had experienced impacts on water source
Percentage of households who experienced impacts on food source
Percentage of households who experienced health impacts
Flood impacts were measured at household levels in the dimension of house property damage, livelihood loss, water and food source impacts, and health impacts, as identified in the qualitative studies.
SensitivityPercentage of female-headed householdsStudies have demonstrated that the female populations have lower chances of gaining access to resources and information during and after a disaster, and this had had a negative impact on their physical and mental health. It is also widely documented that women have higher mortality and poverty rates in disaster occurrences, and studies have found that the female population and female-headed households have positive and significant statistical effects or relation to the severity of social vulnerability of a locality [16,29,55,67,68].
Average household sizeIn high-density areas, there is less probability of evacuation and a higher risk of death [66].
Number of children <5 yearsThe young, that is, children under five (5) years of age, are most often unable to respond to disasters without assistance [56,57], and they are more susceptible to significant physical and psychological impacts [69,70,71]. Children who have inadequate support from family are usually disadvantaged when they have to respond to a disaster [72].
Number of elderlies >65 yearsElderly groups, even if they are not poor or physically weak, are more likely to lack the physical and economic resources necessary to respond to a disaster efficiently and effectively [72]. Besides the physical challenges that evacuation and relocation bring, elderly people become depressed about leaving their own homes to stay in a group quarter or a rescue place.
Number of disablesThe mentally or physically disabled have a lesser capability to respond to a disaster effectively, as they require additional assistance to prepare for and recover from disasters. Disaster managers need to target areas with more disabled people, for early evacuation and also for disaster preparation measures [59,60,73].
Number of womenConsidering factors such as domestic responsibilities, women are, in a way, less able to respond appropriately to a crisis. Their domestic responsibilities and status may restrict their ability to respond quickly in terms of evacuation to rescue grounds or seeking relief on time in the advent of a disaster [71,72].
Adaptive CapacityPercentage of households that receive early warning information on floodThe availability of early warning systems in a community provides an opportunity for disaster preparedness, early warnings, and emergency information, which in extent substantially reduce the vulnerability of the exposed population to a hazard, including saving lives and minimizing potential injuries and property loss [74].
Percentage of households that were aware of recent flood before floodingFlood awareness reduces flood risk [3].
Percentage of households that have community support to address flood riskSocietal groups involved in flood disasters are critical to manage the effects of the disaster in the absence of official state agencies. In comparison to communities without evidence of civil society flood mitigation/adaptation, a community having evidence of civil society flood mitigation/adaptation was judged as better equipped [3].
Percentage of households that receive government interventionFlood victims’ access to any type of support might be a crucial adaptation technique. Households that reported receiving support from their local government, friends, and family networks were considered to be more adaptable than those who did not [3].
Recovery
Percentage of households that are satisfied with government intervention
Percentage of households that recovers to the previous efficient state after a flood
Percentage of households that have flood insurance
Percentage of households with multiple sources of income
The need to recover after a disaster necessitates long-term rehabilitation efforts that are influenced by the underlying socioeconomic processes and structural limitations. The recovery of an individual or a society is influenced by capital re-accumulation processes and external interventions [75]. In [75], income, government interventions, and number of businesses (livelihoods), among others, are identified as the determinants for recovery after a disaster.
Percentage of households with information assetsOwnership of household assets, information, and communication gadgets (e.g., televisions, radio and mobile phones) makes a household better off in receiving and processing information on imminent hazards, and also in preparation for and evacuating from a hazard [17]. Televisions, radios, and mobile phones are important in mediating socioeconomic vulnerability. They act as a medium of information access, and their usage does not necessarily require a high literacy level or formal education [76].
Percentage of households with transportation assetsLack of transportation assets is an important aspect that increases the vulnerability of an individual or a social group. Empirically, we find evidence that the lack of transportation assets resulted in unnecessary suffering for persons living in poverty or near poverty in the central region of New Orleans, who did not have privately owned vehicles or other means of transportation to leave their homes to safer grounds [23].
Percentage of literate household headsHouseholds with limited education are usually less proficient in reading and are therefore less likely to access emergency information if they are not assisted. They are also more subjected to income fluctuations due to unsecured employment and are less able to manage risk [77].
Average incomeLow-income people are economically weak and are affected by disasters disproportionately. It is identified that they are unable to afford assets or generate income that can help them prepare for a disaster or recover after a disaster [16,59].
Table 3. Indicators for exposure index.
IndicatorsMaxMinAdinaAmutsinuSalakopeAgavedziBlekusu
Average flood frequency in community (per annum)5.53.653.655.185.54.234.69
Average flood frequency in households (per annum)5.753.0673.134.295.753.663.067
Average flood duration (days)22.196.0622.1911.4126.0612.5318.64
Percentage of households with flood depth at waist height29.0388.2471.4388.2487.5029.0381.20
Percentage of households that reported flood magnitude as more81.9567.7474.6076.4775.0067.7481.95
Percentage of households who have experienced house property damage88.7164.6669.8476.4775.0088.7164.66
Percentage of households who have experienced livelihood impacts87.5067.6785.7176.4787.5072.5867.67
Percentage of households who had experienced impact on water source42.868.0642.8623.5325.008.0611.28
Percentage of households who experienced impact on food source94.1281.2592.0694.1281.2588.7174.44
Percentage of households who experienced health impacts68.7534.9234.9252.9468.7558.0644.36
Table 4. Indicators for sensitivity index.
IndicatorsMaxMinAdinaAmutsinuSalakopeAgavedziBlekusu
Percentage of female headed households82.3556.3556.3582.3581.2559.6861.65
Average household size12.189.6310.5912.1814.639.639.66
Number of children <5 years24137214374695241
Number of elderlies >65 years17113111131652171
Number of disables92343353992
Number of women569794597997240569
Table 5. Indicators for adaptive capacity index.
IndicatorsMinMaxAdinaAmutsinuSalakopeAgavedziBlekusu
Percentage of households that receive early warning information on flood18.8053.9753.9723.5331.2527.4218.80
Percentage of households that were aware of recent flood prior to flooding0.0022.5811.1117.650.0022.5812.78
Percentage of households that have community support to address flood risk0.006.356.350.000.000.006.02
Percentage of households that receive government intervention0.0038.352.380.000.0011.2938.35
Percentage of households that are satisfied with government intervention0.0018.802.380.000.009.6818.80
Percentage of households that recovers to the previous efficient state after a flood0.0053.9753.9741.1875.0037.1049.62
Percentage of households that have flood insurance03.762.380003.759398
Percentage of households with multiple sources of income073.6871.4352.9456.2567.7473.68
Percentage of households with information assets092.0692.0688.2410087.1087.22
Percentage of households with transportation assets35.2951.8840.4835.2937.551.6151.88

3. Results

3.1. Sociodemographic Characteristics of Survey Respondents (Household Heads)

Figure 3 illustrates the demographics of the respondents (household heads), revealing that 38.7% of the 354 respondents were male household heads and 61.3 percent were female household heads. The most common age group, accounting for 37.6% of the total, was over 60 years old, followed by 35% between 40 and 59 years old, and 27.4% between 20 and 39 years old. This indicates that a large proportion of household heads exposed to flood events were of an economically inactive age group. In addition, the majority of respondents (71.8%) were married, with just a small percentage (3.1%) divorced, 4.2% single, and 20.9% widowed. The level of educational attainment among respondents was mainly basic education, with 59% of the respondents attaining that, while 29.4% had no formal education, 7.9% had secondary education, and just a few (3.7%) had higher education.

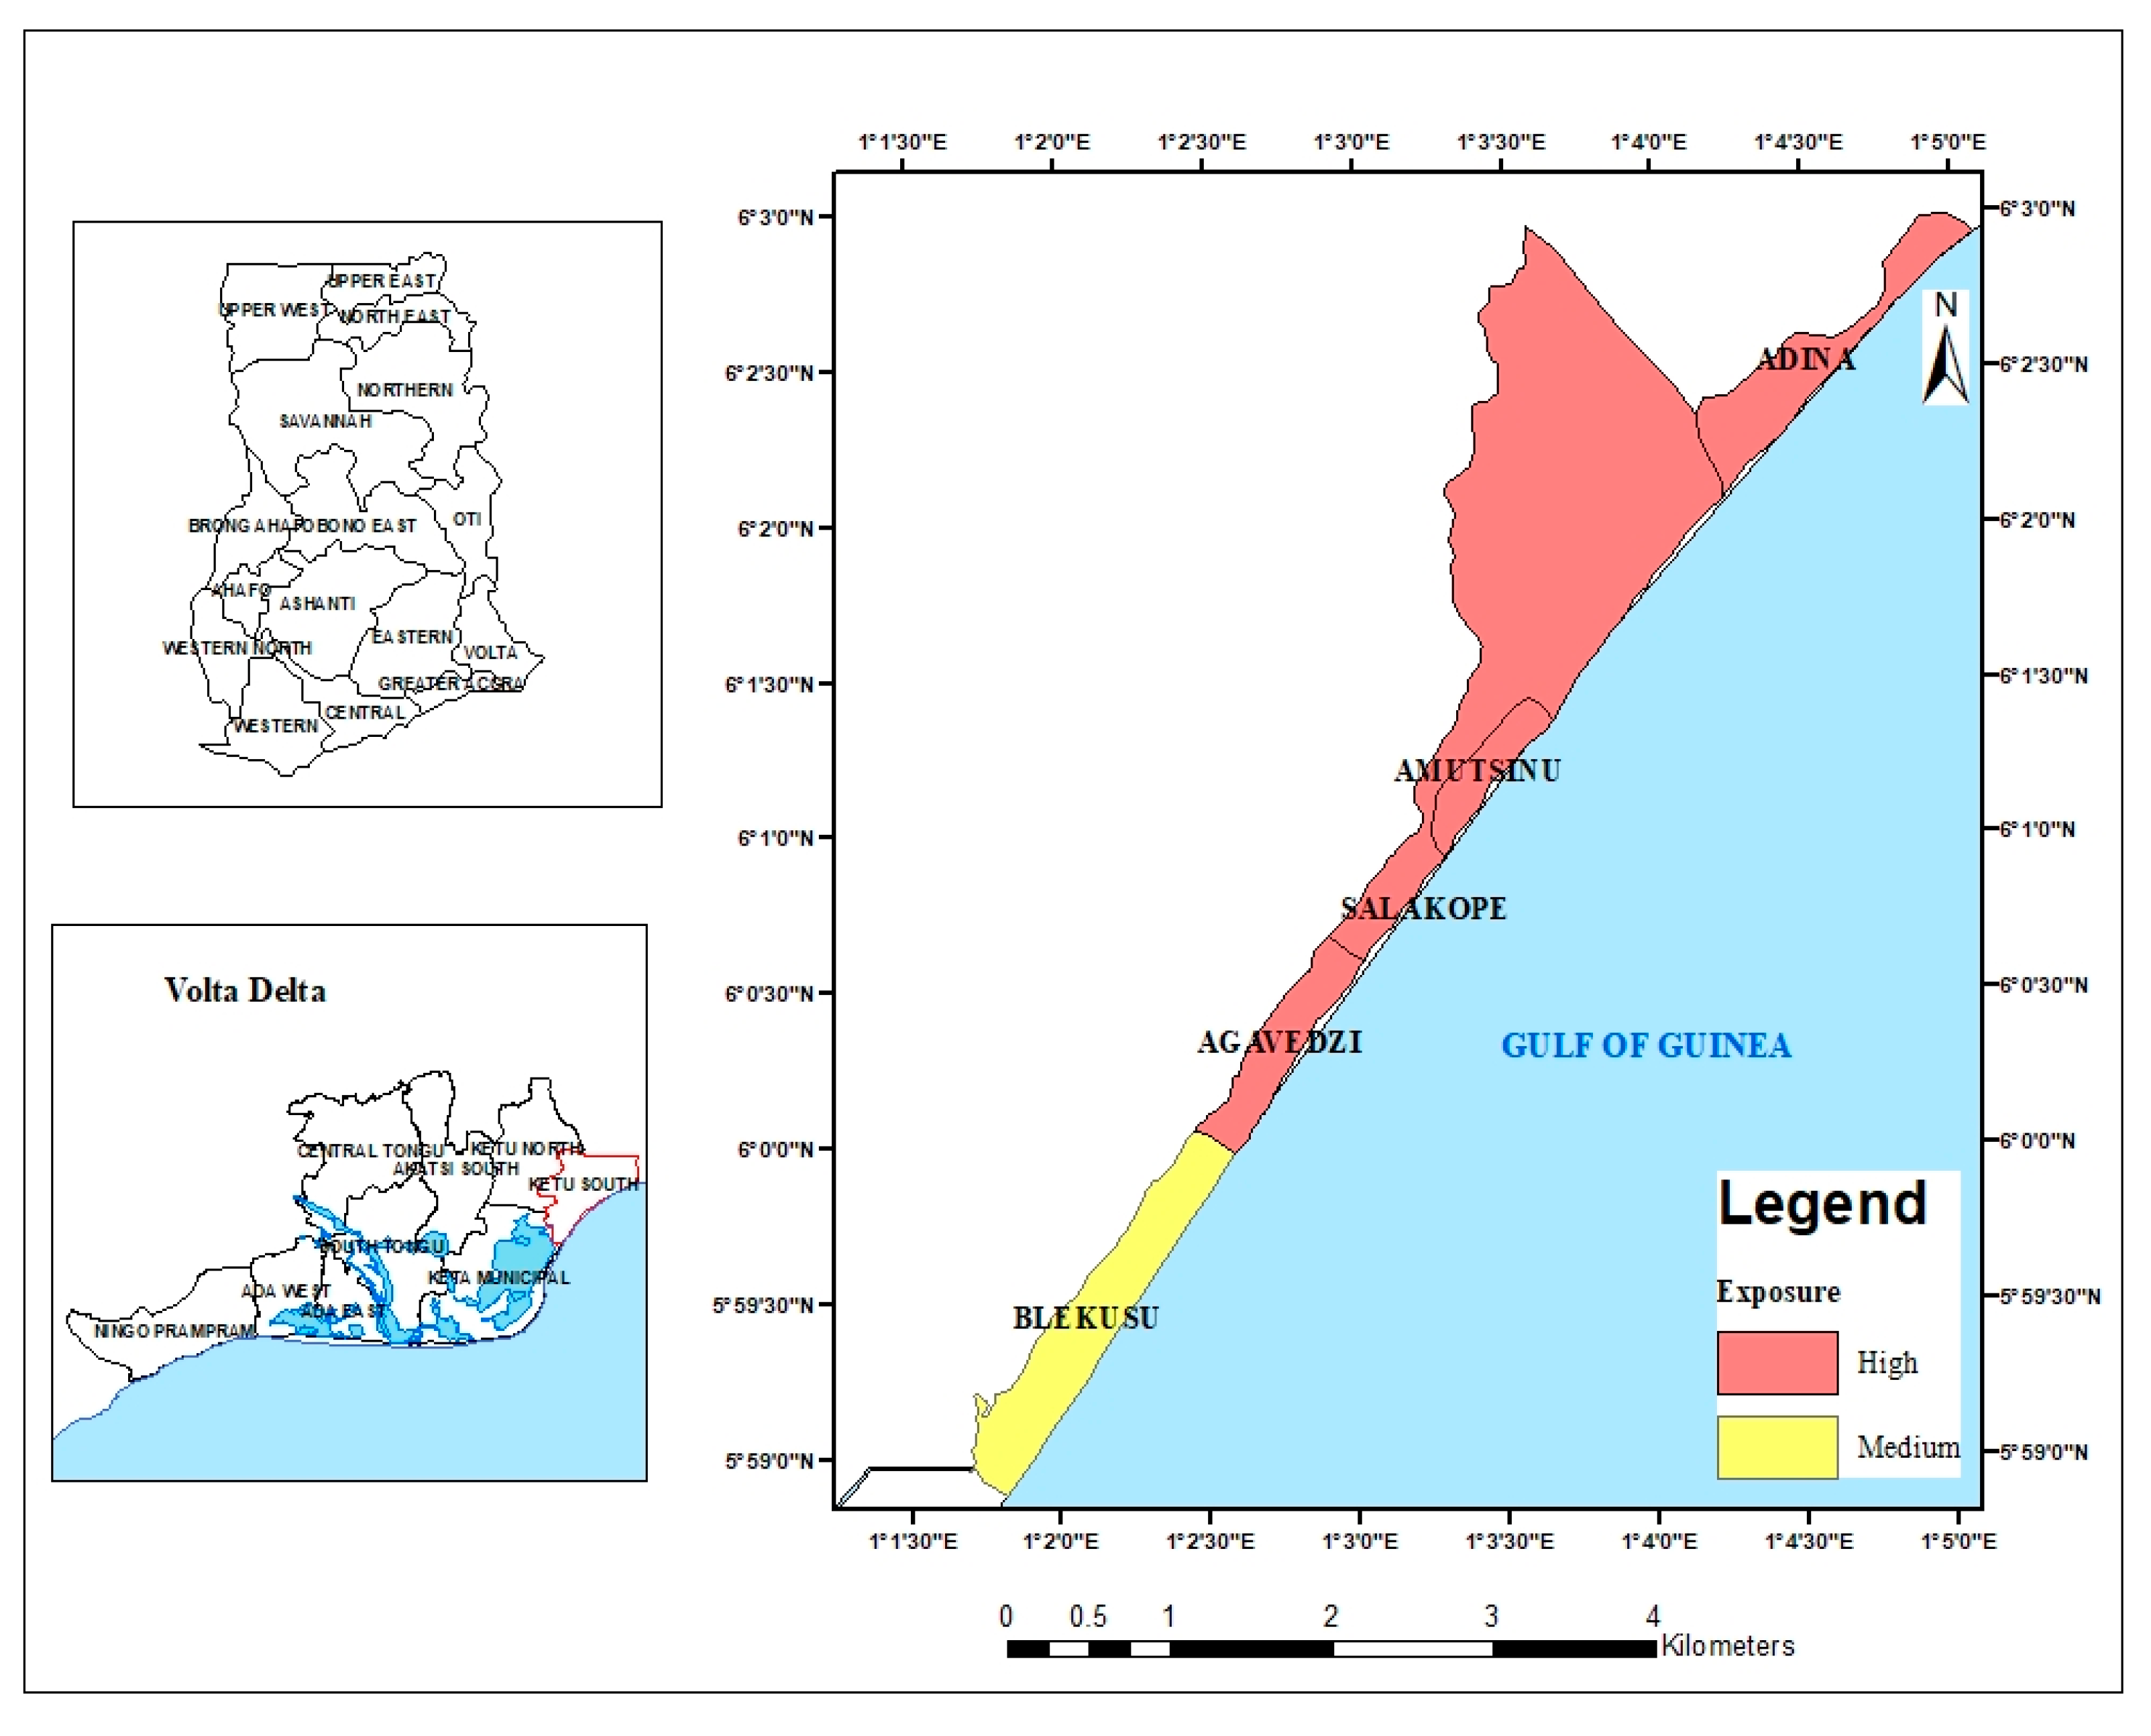
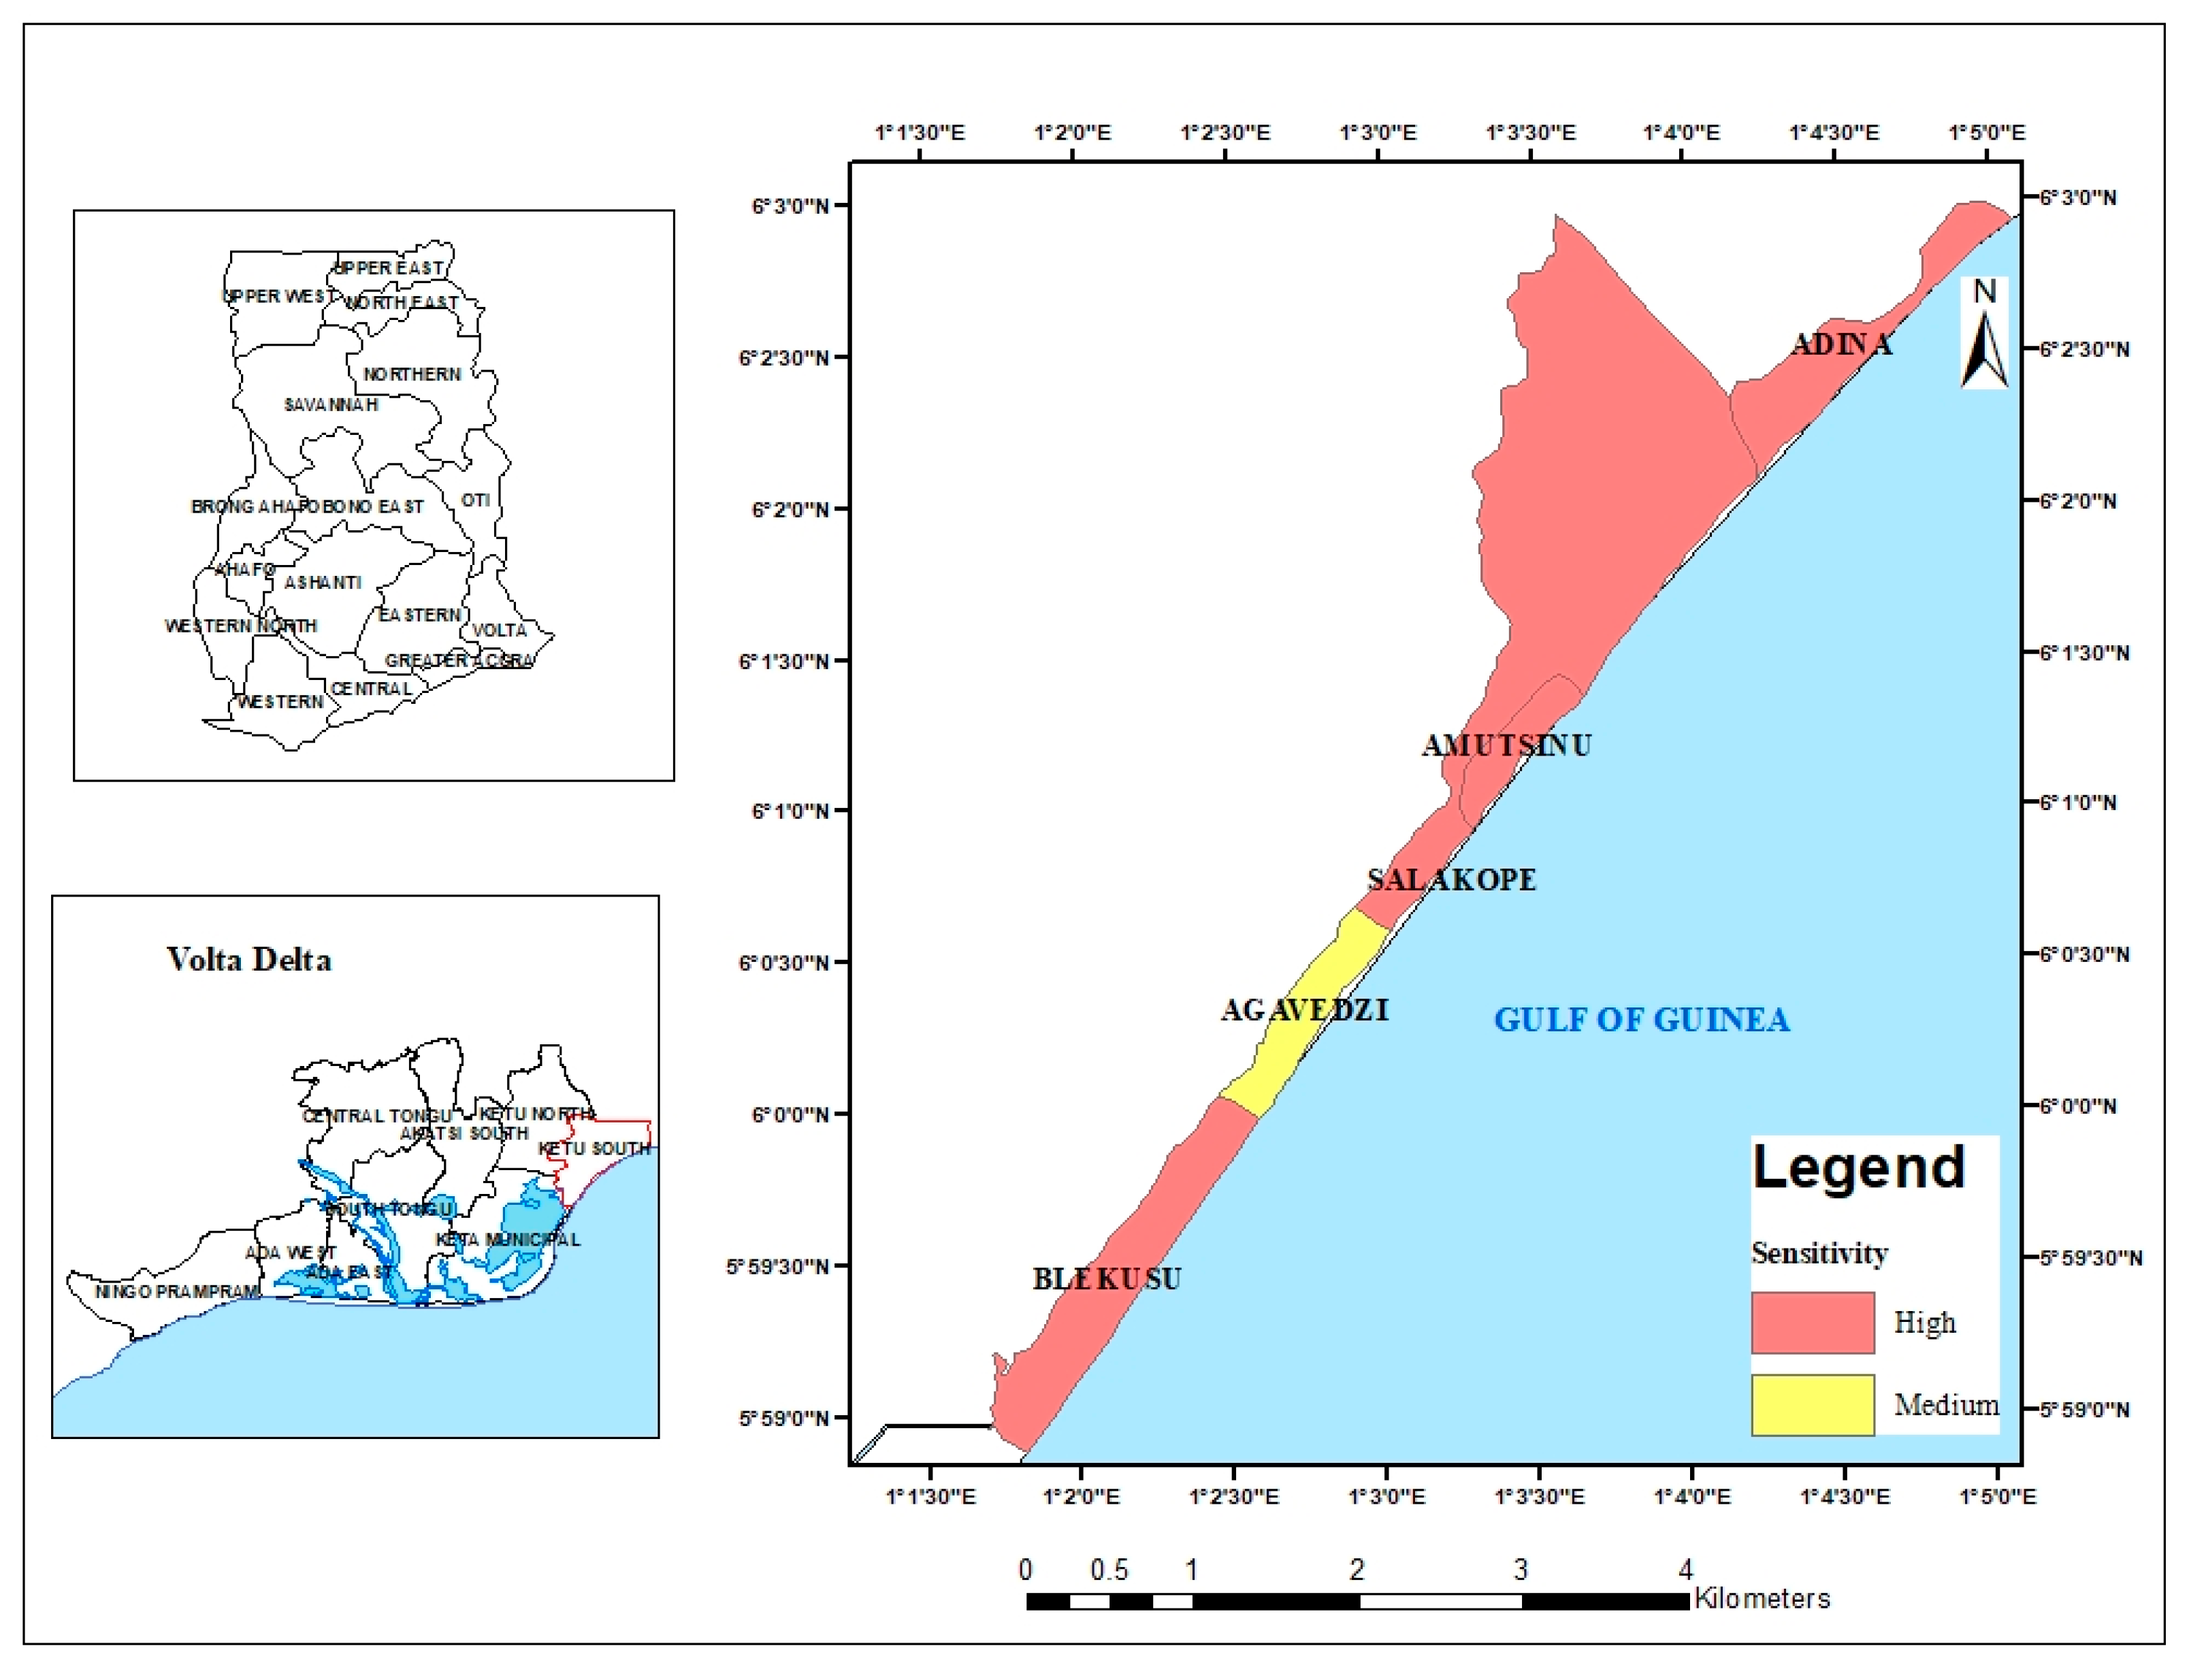
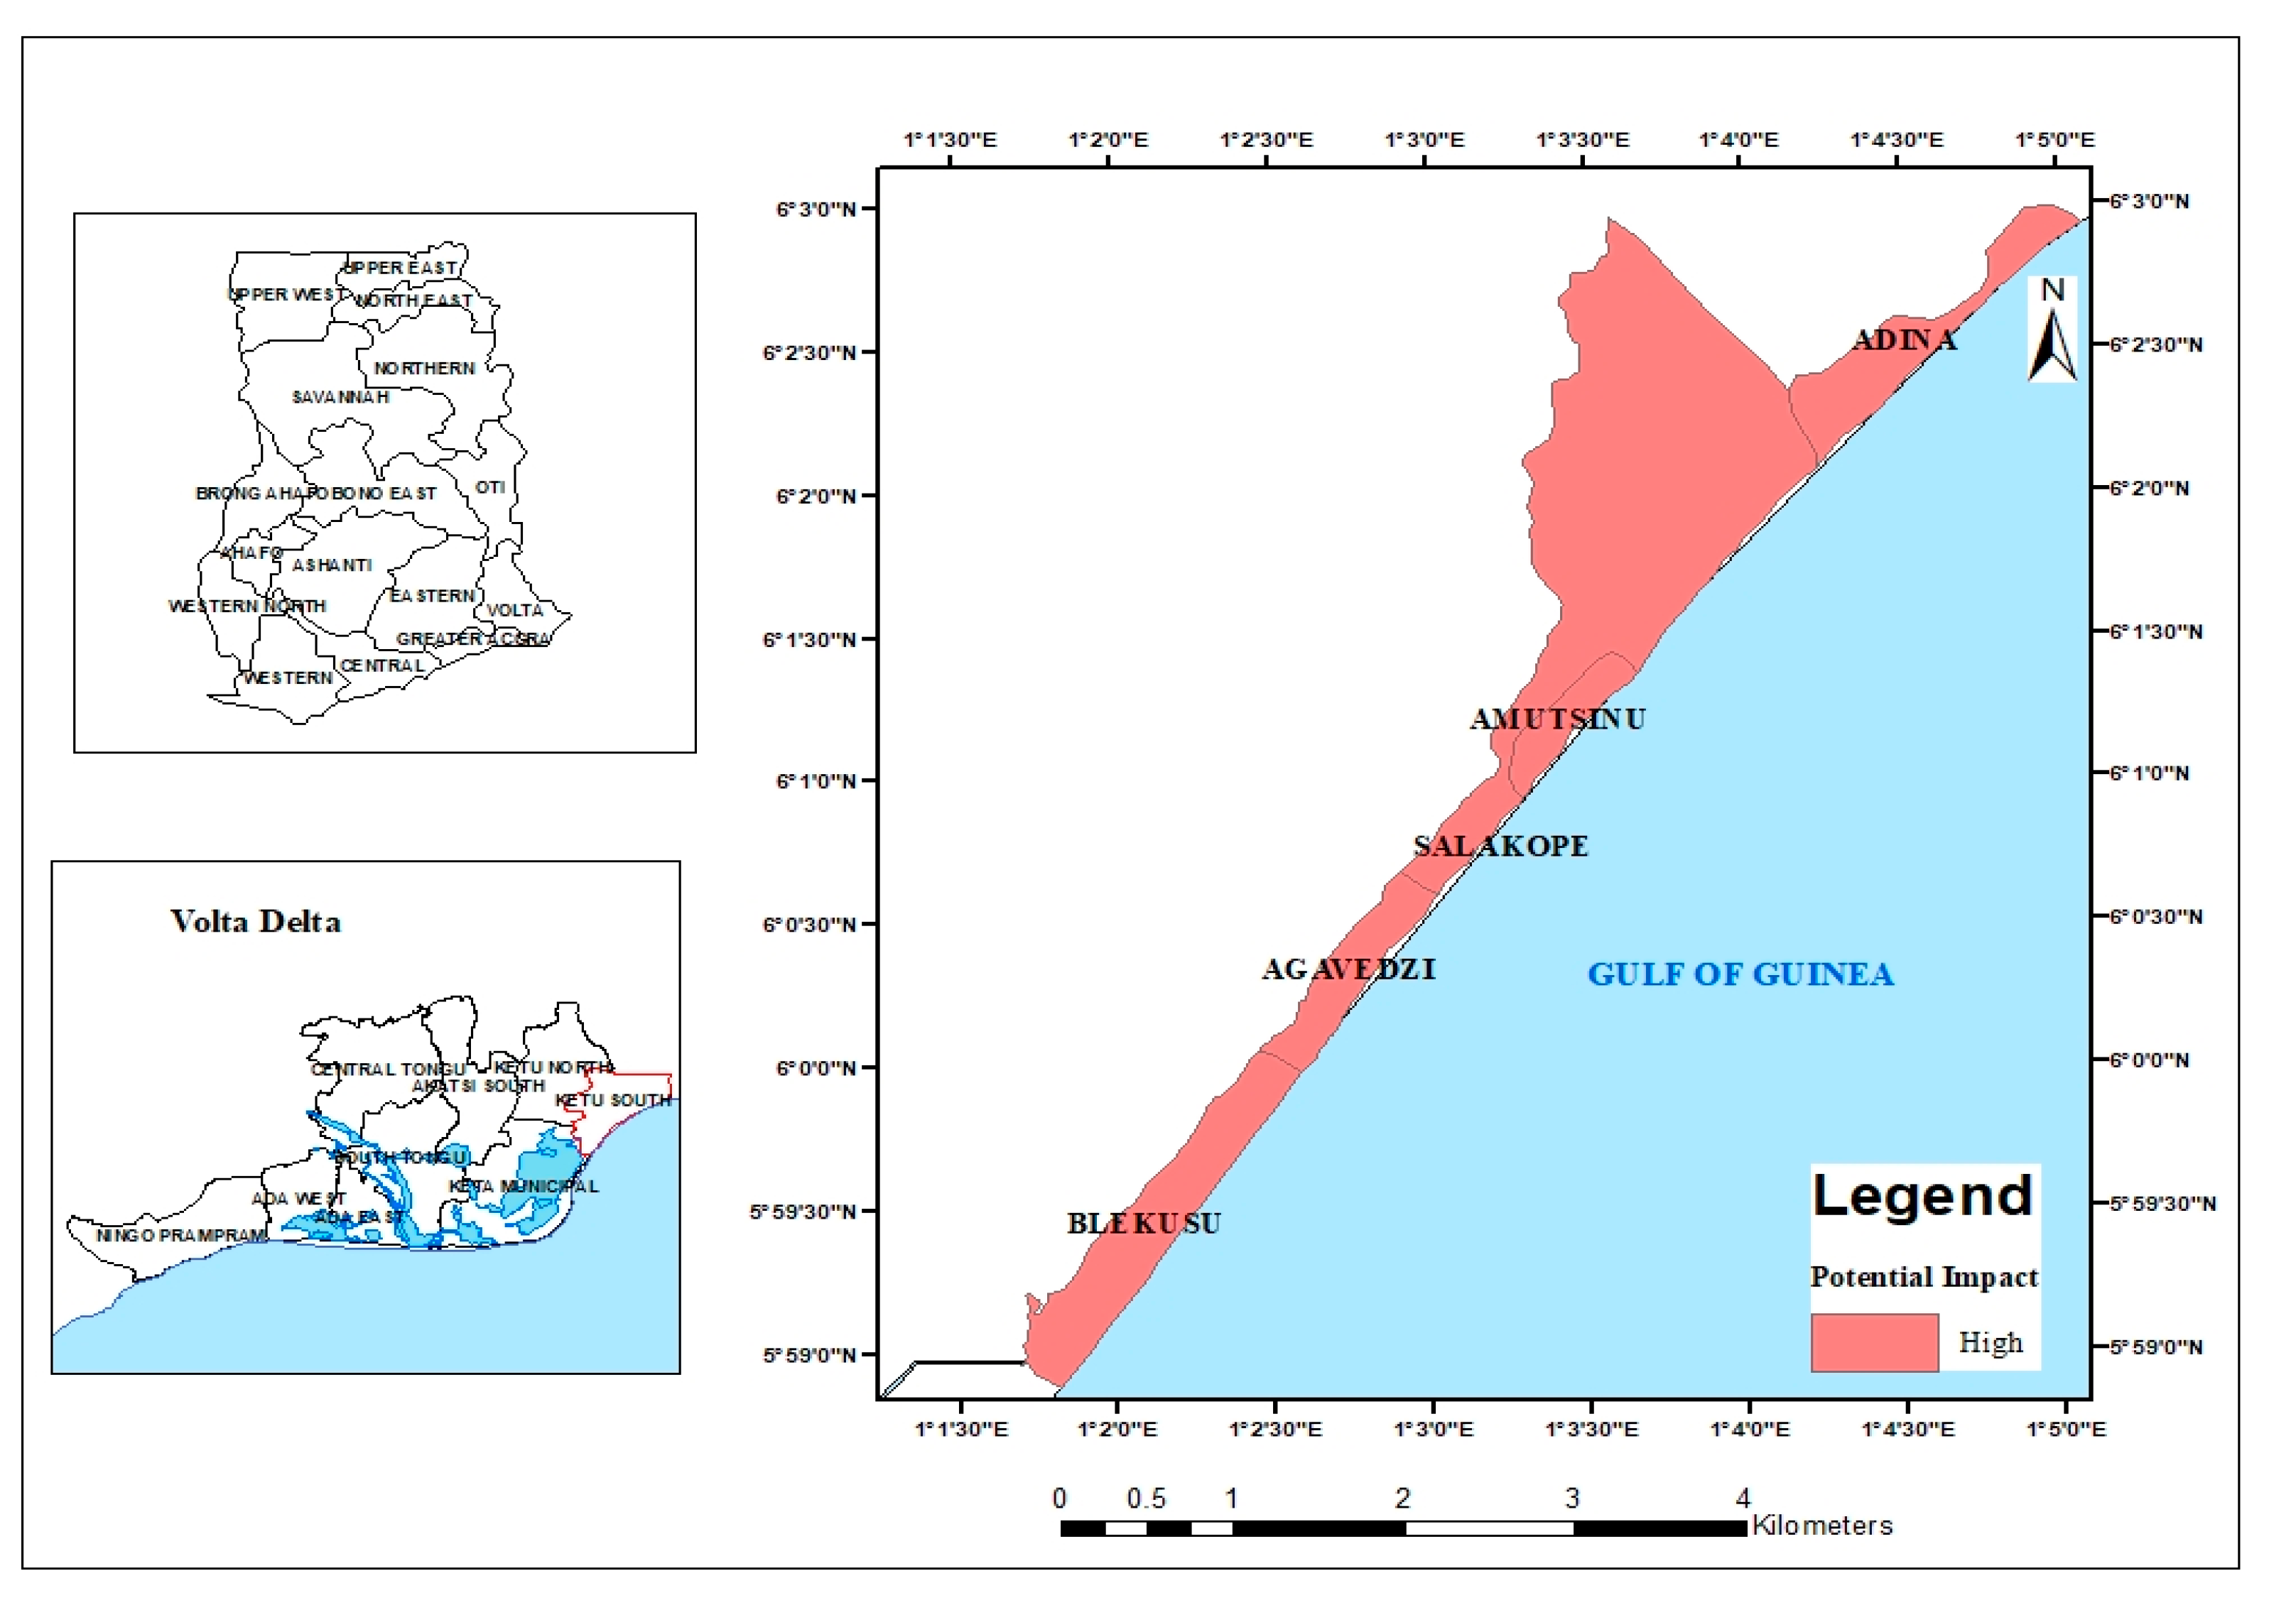
3.2. Vulnerability Indices for the Exposed Communities

Table 6 presents flood exposure and sensitivity indices for the communities as well as the potential impact, adaptive capacity, and composite vulnerability indices. Adina, Amutsinu, Salakope, and Agavedzi scored high, 0.48, 0.51, 0.54, and 0.44, respectively, while Blekusu had a medium score, 0.23 of flood exposure. From the table, Adina, Salakope, Amutsinu, and Blekusu have high scores for sensitivity, 0.51, 0.51, 0.33, and 0.7, respectively, while Agavedzi recorded medium sensitivity: 0.23. In Table 2, results revealed that Blekusu had a higher number of children (241), the aged (171), and women (569). Adina followed suit with 214 children, 111 aged, and 459 women. These two communities, therefore, recorded higher sensitivity indices, as stated above.
Table 6 also presents the potential impact indices of the communities. Potential impact is a combination of the flood exposure index and sensitivity to understand the level of impact a community would face from a flood hazard. From the table, Salakope has the highest potential impact of 1.05, with the rest, Adina, Amutsinu, Agavedzi, and Blekusu, recording high potential impacts at 0.99, 0.85, 0.63, and 0.93, respectively. The high potential impact recorded for the communities is an indication of a high level of exposure and sensitivity to flood hazards in the communities.
The adaptive capacity index ranges from 0.37 to 0.95, as presented in the table. Blekusu, Adina, and Agavedzi had higher adaptive capacity, 0.95, 0.68, and 0.65, respectively, while the other communities, Amutsinu and Salakope, had the lowest scores, 0.37 and 0.43, respectively. A higher percentage of responses on having institutional (government and community institutional) supports, access to early warning information, formal education, information assets, transportation assets, recovery to a previous efficient state, and higher average income levels for Blekusu, Agavedzi, and Adina (Table 3) are the main contributory factors to their high score on adaptive capacity, as compared to the other communities.
The table also presents the composite vulnerability scores for the communities. Salakope and Amutsinu scored 0.64 and 0.45, respectively, indicating vulnerability scores higher than Adina, Agavedzi, and Blekusu, which had lesser vulnerability scores of 0.36, 0.16, and 0.17, respectively.
To enhance the visualization and appreciation of the vulnerability levels across the communities, the vulnerability indices were presented on maps, as illustrated in Figure 4, Figure 5, Figure 6, Figure 7 and Figure 8. Figure 4, Figure 5, Figure 6, Figure 7 and Figure 8 show the exposure, sensitivity, potential impact, adaptive capacity, and composite vulnerability levels, respectively, for the various communities.

3.3. Determinants of Relocation Adaptation Option

Table 7 presents the predictors for relocation, with their probability values, confidence intervals (CI), odd ratios (OR), and probability parameters. The values of the probability parameters presented in the table include: Akaike information criterion (AIC) = 0.653236, Bayesian information criterion (BIC) = −1784.577, Log pseudolikelihood = 99.622777052, Residual df = 338, (1/df) Deviance = 0.5894838, and (1/df) Pearson = 0.7939348.
In the table, the probability values for flood duration, livelihood, and sea defence preference were significant at p = 0.003, p = 0.003, and p = 0.00 respectively, hence these variables were the predictors for relocation in the communities.
The table demonstrates that flood duration, a continuous variable (OR = 1.009646, p < 0.0001), in households is more likely to influence relocation decision. Livelihood (OR = 0.5704749, p < 0.0001), a categorical variable, where two (2) livelihoods are being compared with one (1) livelihood, a reference variable, indicates that respondents with two (2) livelihoods were 43% less likely to relocate as compared to respondents with one (1) livelihood. The third predictor, sea defence preference (OR = 0.18, p < 0.0001), is a binary variable (Yes or No) where “No” responses were treated as a reference variable indicating that respondents who preferred sea defence for protection were 82% less likely to make a relocation decision, as compared to respondents who did not prefer sea defence structures.
In the table, the compositional factors included gender of household head, age of household head, household size, education, and monthly income of household head, as well as the contextual factors including communities such as Adina, Agavedzi, and Blekusu, which were controlled for in the model; it had probability values that were not significant (p > 0.0001).

4. Discussion

4.1. Community Vulnerability Levels

Recognizing which spatial scales are more vulnerable to flooding, and where this vulnerability may be reduced more easily, might help decision-makers prioritize flood protection measures in local and regional areas [30]. In this study, community vulnerability indices were developed at community levels to identify more and less vulnerable communities, based on the IPCC vulnerability factors.
Although these particular communities have been previously identified as vulnerable [26], the specific type of actions to implement remained unclear. Using the IPCC vulnerability factors, including exposure, sensitivity, potential impacts, and adaptive capacity, to develop vulnerability indices at community levels resulted in differential vulnerability scores across the studied communities. The variation in the vulnerability levels could be attributed to the inequality of socioeconomic characteristics of the studied communities and the differences in their flood exposure levels. According to Wongbusarakum & Loper [79], no one threshold defines whether a community is vulnerable to climate change; as a result, social indicators can assist in determining where limited resources should be invested.
This study found that vulnerability levels in the dimension of sensitivity, exposure, and adaptive capacity varied across the studied communities. This finding is directly in line with the findings of Yankson et al. [3], which demonstrated that flood-prone communities in the Greater Accra Metropolitan Area of Ghana exhibited different levels of vulnerability with respect to their exposure, sensitivity, and adaptive capacity. Similar findings were also reported in a previous study of flood-prone rural municipalities of Bosnia and Herzegovina [80].
It was found in this study that, in communities such as Adina, Salakope, Amutsinu, and Blekusu, sensitivity to coastal floods was high, but that Agavedzi had medium sensitivity. A higher number of people with disability, female-headed households, dependent age groups, women, and larger household sizes were the contributory factors to the high sensitivity recorded in these four communities (Table 4). It is worth discussing that the communities with high sensitivity are demographically more vulnerable than Agavedzi, which recorded medium sensitivity. Demographically, vulnerable groups are individuals who are more vulnerable than others in a locality due to their specific demographic or socioeconomic traits [79]. For example, it is reported in Owusu (2016) that, in many countries, women’s societal roles restrict their ability to adapt to climate change, and their obligations for childcare, water collection, and cooking fuel collection often increase their sensitivity to climate change.
In the case of exposure, Agavedzi, Adina, Salakope, and Amutsinu had high scores, with Blekusu recording a medium score. Higher frequency of flood, with higher responses on high flood depth, magnitude, and impacts (such as household property damage, livelihood impact, food source impact, water source impact, and health impacts) are the contributory factors to the high scores for exposure in the communities (Table 1). In a previous study [81], similar local indicators were found as the contributory factors for the high exposure of flood-prone areas in West Bengal, India.
According to Scheuer & Haase [82], flood vulnerability is determined by the quantity and value of elements at risk, their susceptibility, and their level of exposure to the hazard. This implies that communities found with higher exposure scores have higher populations and elements exposed to higher flood magnitude. These communities also suffer more negative impacts from the flood events than the community recording medium exposure. Empirically, this finding can be explained by the qualitative study, which explains that Blekusu is protected with sea defence structures, minimizing its exposure to flood impacts, while the other communities are left unprotected.
When the two vulnerability components (sensitivity and exposure) were combined, all the communities had a high potential impact, with Salakope recording the highest. Contrary to the findings of Sitaula [80], which illustrated that sensitivity indices were the major determinant of the high scores of potential impact in Rural Municipalities of Bosnia and Herzegovina, this study demonstrated that the determinant of high potential scores alternate between sensitivity and exposure, depending on the community. For example, Salakope had a sensitivity score of 0.51 and an exposure score of 0.54, which indicates that exposure contributed slightly more to the high potential impact than sensitivity. Also, Blekusu had a sensitivity score of 0.70 and an exposure score of 0.23, indicating that sensitivity is the major determinant of the high potential impact.
Despite the high scores of potential impacts recorded for all the communities, Adina, Agavedzi, and Blekusu had their overall vulnerability positions remediated with high adaptive capacity, unlike Salakope and Amutsinu, which had medium adaptive capacity. The differences in their potential impact and adaptive capacity resulted in varied composite vulnerability scores across the communities. This finding is consistent with Yankson et al. [3], where all the communities studied exhibited different levels of vulnerability in the Greater Accra Metropolis, Ghana.
Contributing to the literature, these findings illustrate how complex vulnerability is, and that there are various levels of exposure, sensitivity, and adaptive capacity that need to be explored in various locations to understand the overall vulnerability levels. This understanding is crucial to designing effective adaptation strategies that are robust and suitable for affected communities.

4.2. Predictors of Relocation

The value of AIC = 0.653236 in the results demonstrates that the model’s goodness of fit is less than 2, indicating there is substantial evidence to support the fact that the model is almost as good as the best model. According to Fabozzi et al. [83], “if the AIC is less than 2, this indicates there is substantial evidence to support the candidate model (i.e., the candidate model is almost as good as the best model); between 4 and 7, this indicates that the candidate model has considerably less support; greater than 10, this indicates that there is essentially no support for the candidate model”.
Evacuation and relocation are the most effective measures for vulnerable communities to avoid disasters and can ensure the safety of life and properties; thus, it is necessary to identify the factors that influence residents’ willingness to evacuate and relocate from hazard zones [84]. The last objective of this study was to identify the predictors of relocation in flood-prone communities in Ketu South Municipal, Ghana.
The findings indicate that the residents’ relocation decisions were not simple. The predictors that influence their decision interplay between physical and economic factors, while compositional and contextual factors (control variables) were not significant predictors. The result from modelling the determinants of relocation as an adaptation option revealed that flood duration in households, number of livelihoods, and sea defence preference are the significant predictors of relocation in the study area; their probability values were significant (p < 0.0001).
In line with the findings of Buchori et al. [85], the residents were willing to relocate due to flood duration in the households. The odd ratio for flood duration recorded was 1.009646, which implies that the longer the flood duration in a household, the higher the likelihood for the respondent to make a relocation decision. This also agrees with the findings of Xu et al. [86], which demonstrated that every one-unit increase in severity of earthquake disaster in China corresponds to increase in the odds of willingness to evacuate.
In the case of livelihood, it was found that the respondents with two livelihoods were 43% less likely to relocate as compared to respondents with one livelihood. This suggests that livelihood can be considered an essential asset that influences relocation adaptation measures in hazard zones. This is consistent with the findings of Addo et al. [28], which demonstrate that voluntary and permanent relocation were overlooked by most flood victims due to fear of losing income-generating ventures that serve as sources of livelihood in the Sekondi-Takoradi Metropolis in Ghana. In addition, it can be argued that respondents with multiple livelihoods possess wealth that can help them accommodate flood disasters, as compared to respondents with one source of livelihood. Wealth improves one’s ability to plan for and endure losses in the event of an emergency, and vulnerability is thought to be exacerbated by a lack of wealth [17]. The wealth of a household is characterized by income sources, quality of the housing structure, and possession of household assets [17].
It was also found that sea defence preference plays a strong role in predicting willingness to relocate. The odd ratio recorded for this variable, 0.18, implies that respondents that prefer sea defence for protection are 81% less likely to make relocation decisions, as compared to respondents that do not prefer sea defence.
The compositional and the contextual factors that were controlled in the model had probability values that were not significant. This implies that the likelihood of a respondent to agree to a relocation decision in the study area is not based on gender, age, household size, education, monthly income, or the community in which the respondent resides. This finding is consistent with findings in other studies [42,54], where contextual factors such as communities and social dimensions did not influence relocation decisions. Similarly, Seebauer & Winkler [87] found that a relocation decision is made exclusively within households, regardless of their neighbours’ actions or influence. There has also been a similar outcome on the compositional factors (household characteristics), especially gender and its association with willingness to relocate. Xu et al. [86] found that gender and other household characteristics that were used as control variables in their study were not significantly related to willingness to relocate from a hazard zone in Sichuan Province, China.
However, other previous studies [72,74,88,89] have demonstrated contradictory outcomes to these findings. In these studies, compositional factors such as average income, and contextual factors such as place dependence (community bond), were significant influential factors for relocation aside from hazard severity and types of livelihoods or occupations.

5. Conclusions

Community vulnerability indices were constructed based on the IPCC vulnerability factors: exposure, sensitivity, potential impacts, and adaptive capacity. The communities had different scores, with some recording high and some medium for all the aspects of vulnerability. The study found that Adina, Salakope, Amutsinu, and Blekusu had high sensitivity scores, while Agavedzi had a medium score. A higher number of female-headed households, elderlies above 65 years, children below five years, women, and larger household sizes are the contributing factors to the high scores for the four communities (Table 4).
With the exposure component of vulnerability, Agavedzi, Adina, Salakope, and Amutsinu had high scores, with Blekusu recording a medium score. A higher frequency of flood exposure, with higher responses on high flood depth, magnitude, and impacts in the dimension of household property damage, livelihood, food and water sources, and health impacts are the contributing factors to high scores for exposure in the communities recording high exposure indices (Table 3).
The combination of sensitivity and exposure scores resulted in high potential impact scores across the communities, with Salakope recording the highest. However, with adaptive capacity, Salakope and Amutsinu recorded medium scores, while Adina, Agavedzi, and Blekusu recorded high scores, with Blekusu recording the highest. Despite the high scores of potential impacts recorded for the communities, Adina, Agavedzi, and Blekusu had their overall vulnerability positions remediated with high adaptive capacity, unlike Salakope and Amutsinu, which had medium adaptive capacity. The findings on the overall community vulnerability scores are as follows: Salakope had the highest composite vulnerability score 0.62, followed by Amutsinu, 0.50, with the rest of the communities Adina, Agavedzi, and Blekusu recording the lowest composite vulnerability scores: 0.31, 0.04, and −0.01, respectively.
Lastly, the study examined the predictors of relocation decisions at the household level, and it was found that flood duration, number of livelihoods, and sea defence preference were the main predictors, while compositional factors (control variables), such as gender of household head, age of household head, household size, education, and monthly income of household head, were not significant predictors of relocation decisions in the communities. Contextual factors (control variables), such as the communities, were also not significant in the result. Households with a longer flood duration are more likely to agree to relocation decisions than households that experience a shorter duration of a flood. Also, households with multiple sources of livelihood, as well as households that prefer sea defence structures, are less likely to relocate. However, the likelihood of a respondent to agree to a relocation decision is not based on gender, age, household size, education, monthly income, or the community in which the respondent resides, since these factors were not significant predictors of relocation.
These findings suggest that communities that were exposed to coastal flooding would suffer impacts disproportionately, based on the varied vulnerability levels they exhibit. Hence, it is recommended that stakeholders, such as National Disaster Management Organization (NADMO) and concerned Non-Governmental Organizations (NGOs), strengthen the adaptive capacity of the communities by providing early warning systems, increasing the scope of interventions to the vulnerable communities that receive fewer interventions, and increasing flood risk awareness about sea-level rise effects on coastal communities.
To address the sensitivity of the communities to coastal flooding, flood disaster risk reduction programs organized by governmental institutions, NADMO, and NGOs should focus on locating and giving priority to households with age-dependent groups, female household heads, and low levels of education, disability, and low wealth levels. The study found that these factors influence the sensitivity of households and communities to coastal flooding.
Nonetheless, if relocation policies are being implemented, NADMO and other stakeholders should first target households that experience longer flood duration and have only one livelihood, since they are more willing to relocate than the others that experience shorter flood duration, have multiple livelihoods, and prefer sea defence structures for protection.
It is also recommended that the severity of post-event impacts of coastal floods on the communities and the economic value of facilities and elements that are exposed to flood hazards are assessed. This will help in adopting robust adaptation options for the communities.

Author Contributions

Conceptualization, D.B.; methodology, D.B. and P.A.D.M.; formal analysis, D.B., E.K.B. and P.A.D.M.; validation, P.A.D.M. and S.K.M.A.; writing—original draft preparation, D.B.; writing—review and editing, P.A.D.M., S.K.M.A., M.M.M. and D.W.A.; supervision, P.A.D.M. and S.K.M.A. All authors have read and agreed to the published version of the manuscript.

Funding

This study is part of an MPhil project at the University of Cape Coast, Ghana, funded by the World Bank Africa Centre of Excellence in Coastal Resilience (ACECoR) Project (World Bank ACE Grant Number 6389-G).

Institutional Review Board Statement

Ethical clearance for the study was provided by the University of Cape Coast’s Institutional Review Board (UCCIRB). The ethical approval identification number is UCCIRB/CANS/2021/15.

Informed Consent Statement

Informed consent was acquired from all subjects who participated in the study, following the UCCIRB’s guidelines.

Data Availability Statement

The policies of UCCIRB policies do not support the sharing of the survey data publicly.

Acknowledgments

The authors would like to express their gratitude to the World Bank for financing this study and also to the field assistants; Breeze Babanawo, James Macho Akligo, Michael Shitor, Dan Etse Agbayiza, and Gad Atsu Agbayiza, who supported with the data collection for the study.

Conflicts of Interest

The authors declare no conflict of interest.

References

  1. Owusu, M. Gender Vulnerability to Climate Change and Livelihood Security in Urban Slum Communities in Accra, Ghana. Ph.D. Thesis, The University of Adelaide, Adelaide, Australia, 2017. [Google Scholar]
  2. Osman, A.; Nyarko, B.K.; Mariwah, S. Vulnerability and risk levels of communities within Ankobra estuary of Ghana. Int. J. Disaster Risk Reduct. 2016, 19, 133–144. [Google Scholar] [CrossRef]
  3. Yankson, P.W.K.; Owusu, A.B.; Owusu, G.; Boakye-Danquah, J.; Tetteh, J.D. Assessment of coastal communities’ vulnerability to floods using indicator-based approach: A case study of Greater Accra Metropolitan Area, Ghana. Nat. Hazards 2017, 89, 661–689. [Google Scholar] [CrossRef]
  4. Mcgranahan, G.; Balk, D.; Mcgranahan, G.; Bartlett, S. The rising tide: Assessing the risks of climate change and human settlements in low elevation coastal Zones. Environ. Urban. 2007, 19, 17–37. [Google Scholar] [CrossRef]
  5. Sterr, H. Assessment of vulnerability and adaptation to sea-level rise for the coastal zone of Germany. J. Coast. Res. 2008, 24, 380–393. [Google Scholar] [CrossRef]
  6. IPCC. IPCC Fourth Assessment Report: Climate Change 2007 (AR4)—Synthesis Report; IPCC: Geneva, Szwitzerland, 2007; Volume 2099, p. 104. [Google Scholar]
  7. Woodworth, P.L.; White, N.J.; Jevrejeva, S.; Holgate, S.J.; Church, J.A. Evidence for the accelerations of sea level on multi-decade. Int. J. Climatol. J. R. Meteorol. Soc. 2009, 789, 777–789. [Google Scholar] [CrossRef]
  8. Mensah, C.; Kabo-bah, A.T.; Mortey, E. Assessing The Effects of Climate Change on Sea Level Rise Along the Gulf Of Guinea. J. Energy Nat. Resour. Manag. 2017, 4, 15–22. [Google Scholar] [CrossRef]
  9. Church, J.A.; White, N.J. A 20th century acceleration in global sea-level rise. Geophys. Res. Lett. 2006, 33, 94–97. [Google Scholar] [CrossRef]
  10. Boateng, I.; Wiafe, G.; Jayson-Quashigah, P.N. Mapping vulnerability and risk of Ghana’s coastline to sea level rise. Mar. Geod. 2017, 40, 23–39. [Google Scholar] [CrossRef]
  11. Aboagye, D.; Attakora-Amaniampong, E.; Owusu-Sekyere, E. Place-based assessment of intersection of biophysical and social vulnerability to flooding in Accra, Ghana. Int. J. Appl. Geospat. Res. 2020, 11, 55–68. [Google Scholar] [CrossRef]
  12. Aksha, S.K.; Juran, L.; Resler, L.M.; Zhang, Y. An Analysis of Social Vulnerability to Natural Hazards in Nepal Using a Modified Social Vulnerability Index. Int. J. Disaster Risk Sci. 2019, 10, 103–116. [Google Scholar] [CrossRef] [Green Version]
  13. Grinsted, A.; Christensen, J.H. The transient sensitivity of sea level rise. Ocean Sci. Discuss. 2020, 17, 1–5. [Google Scholar] [CrossRef]
  14. Wu, S.; Yarnal, B.; Fisher, A. Vulnerability of coastal communities to sea-level rise: A case study of Cape May County, New Jersey, USA. Clim. Res. 2002, 22, 255–270. [Google Scholar] [CrossRef] [Green Version]
  15. Sendai Framework. Sendai framework for disaster risk reduction 2015–2030. Aust. J. Emerg. Manag. 2015, 30, 9–10. [Google Scholar]
  16. Cutter, S.L.; Boruff, B.J.; Shirley, W.L. Social vulnerability to environmental hazards. Soc. Sci. Q. 2003, 84, 242–261. [Google Scholar] [CrossRef]
  17. Felsenstein, D.; Lichter, M. Social and economic vulnerability of coastal communities to sea-level rise and extreme flooding. Nat. Hazards 2014, 71, 463–491. [Google Scholar] [CrossRef]
  18. Munji, C.A.; Bele, M.Y.; Nkwatoh, A.F.; Idinoba, M.E.; Somorin, O.A.; Sonwa, D.J. Vulnerability to coastal flooding and response strategies: The case of settlements in Cameroon mangrove forests. Environ. Dev. 2013, 5, 54–72. [Google Scholar] [CrossRef]
  19. Birkmann, J. Risk and vulnerability indicators at different scales: Applicability, usefulness and policy implications. Environ. Hazards 2007, 7, 20–31. [Google Scholar] [CrossRef]
  20. Birkmann, J.; Wisner, B. Measuring the Unmeasurable: The Challenge of Vulnerability; UNU-EHS: Bonn, Germany, 2006; Volume 5, Available online: http://www.ihdp.unu.edu/file/get/3962.pdf (accessed on 5 January 2022).
  21. Wisner, B. Vulnerability as Concept, Model, Metric, and Tool. In Oxford Research Encyclopedia of Natural Hazard Science; Oxford University Press: Oxford, UK, 2016. [Google Scholar] [CrossRef] [Green Version]
  22. Cutter, S.L. Vulnerability to environmental hazards. Prog. Hum. Geogr. 1996, 20, 529–539. [Google Scholar] [CrossRef]
  23. Kelly, P.M.; Adger, W.N. Theory and practice in assessing vulnerability to climate change and Facilitating adaptation. Clim. Chang. 2000, 47, 325–352. [Google Scholar] [CrossRef]
  24. Schneider, S.H.; Semenov, S.; Patwardhan, A.; Burton, I.; Magadza, C.H.D.; Oppenheimer, M.; Yamin, F. Assessing key vulnerabilities and the risk from climate change. In Climate Change 2007: Impacts, Adaptation and Vulnerability; Contribution of Working Group II to the Fourth Assessment Report of the Intergovernmental Panel on Climate Change; Parry, M.L., Canziani, O.F., Palutikof, J.P., van der Linden, P.J., Hanson, C.E., Eds.; Cambridge University Press: Cambridge, UK, 2007; pp. 779–810. [Google Scholar]
  25. Fuessel, H.M. Vulnerability in Climate Change Research: A Comprehensive Conceptual Framework. 2005. Available online: https://escholarship.org/content/qt8993z6nm/qt8993z6nm.pdf (accessed on 5 January 2022).
  26. Boateng, I. An assessment of the physical impacts of sea-level rise and coastal adaptation: A case study of the eastern coast of Ghana. Clim. Chang. 2012, 114, 273–293. [Google Scholar] [CrossRef]
  27. Balaganesh, G.; Malhotra, R.; Sendhil, R.; Sirohi, S.; Maiti, S.; Ponnusamy, K.; Sharma, A.K. Development of composite vulnerability index and district level mapping of climate change induced drought in Tamil Nadu, India. Ecol. Indic. 2020, 113, 106197. [Google Scholar] [CrossRef]
  28. Addo, K.A.; Nicholls, R.J.; Codjoe, S.N.A.; Abu, M. A biophysical and socioeconomic review of the Volta delta, Ghana. J. Coast. Res. 2018, 34, 1216–1226. [Google Scholar] [CrossRef] [Green Version]
  29. Noy, I.; Yonson, R. Economic vulnerability and resilience to natural hazards: A survey of concepts and measurements. Sustainability 2018, 10, 2850. [Google Scholar] [CrossRef] [Green Version]
  30. Balica, S.F.; Wright, N.G.; Van der Meulen, F. A flood vulnerability index for coastal cities and its use in assessing climate change impacts. Nat. Hazards 2012, 64, 73–105. [Google Scholar] [CrossRef] [Green Version]
  31. Dolan, A.H.; Walker, I.J. Understanding vulnerability of coastal communities to climate change related risks. J. Coast. Res. 2006, 1316–1323. [Google Scholar]
  32. Brouwer, R.; Akter, S.; Brander, L.; Haque, E. Socioeconomic vulnerability and adaptation to environmental risk: A case study of climate change and flooding in Bangladesh. Risk Anal. Int. J. 2007, 27, 313–326. [Google Scholar] [CrossRef] [PubMed] [Green Version]
  33. Balica, S.F.; Douben, N.; Wright, N.G. Flood vulnerability indices at varying spatial scales. Water Sci. Technol. 2009, 60, 2571–2580. [Google Scholar] [CrossRef] [Green Version]
  34. Marshall, N.A.; Marshall, P.A.; Tamelander, J.; Obura, D.; Malleret-King, D.; Cinner, J.E. A Framework for Social Adaptation to Climate Change: Sustaining Tropical Coastal Communitites [Sic] and Industries; Iucn: Grand, Switzerland, 2010. [Google Scholar]
  35. Talukder, B.; Hipel, K.W.; van Loon, G.W. Developing composite indicators for agricultural sustainability assessment: Effect of normalization and aggregation techniques. Resources 2017, 6, 66. [Google Scholar] [CrossRef] [Green Version]
  36. Hahn, M.B.; Riederer, A.M.; Foster, S.O. The Livelihood Vulnerability Index: A pragmatic approach to assessing risks from climate variability and change—A case study in Mozambique. Glob. Environ. Chang. 2009, 19, 74–88. [Google Scholar] [CrossRef]
  37. Dinh, Q.; Balica, S.; Popescu, I.; Jonoski, A. Climate change impact on flood hazard, vulnerability and risk of the Long Xuyen Quadrangle in the Mekong Delta. Int. J. River Basin Manag. 2012, 10, 103–120. [Google Scholar] [CrossRef]
  38. Hinkel, J. “Indicators of vulnerability and adaptive capacity”: Towards a clarification of the science–policy interface. Glob. Environ. Chang. 2011, 21, 198–208. [Google Scholar] [CrossRef]
  39. Moreira, L.L.; de Brito, M.M.; Kobiyama, M. Effects of different normalization, aggregation, and classification methods on the construction of flood vulnerability indexes. Water 2021, 13, 98. [Google Scholar] [CrossRef]
  40. Sajeva, M.; Gatelli, D.; Tarantola, S.; Hollanders, H. Methodology Report on European Innovation Scoreboard; European Comission: Brussels, Belgium, 2005. [Google Scholar]
  41. Qasim, A.W. United Nations Development Programme (UNDP). Human Development Report 2013. Pak. Dev. Rev. 2013, 52, 95–96. [Google Scholar] [CrossRef] [Green Version]
  42. Bathi, J.R.; Das, H.S. Vulnerability of coastal communities from storm surge and flood disasters. Int. J. Environ. Res. Public Health 2016, 13, 239. [Google Scholar] [CrossRef]
  43. Frigerio, I.; Ventura, S.; Strigaro, D.; Mattavelli, M.; De Amicis, M.; Mugnano, S.; Boffi, M. A GIS-based approach to identify the spatial variability of social vulnerability to seismic hazard in Italy. Appl. Geogr. 2016, 74, 12–22. [Google Scholar] [CrossRef]
  44. Cutter, S.L.; Barnes, L.; Berry, M.; Burton, C.; Evans, E.; Tate, E.; Webb, J. A place-based model for understanding community resilience to natural disasters. Glob. Environ. Chang. 2008, 18, 598–606. [Google Scholar] [CrossRef]
  45. Choi, H. Assessment of aggregation frameworks for composite indicators in measuring flood vulnerability to climate change. Sci. Rep. 2019, 9, 1–14. [Google Scholar]
  46. Tompkins, E.L.; Vincent, K.; Nicholls, R.J.; Suckall, N. Documenting the state of adaptation for the global stocktake of the Paris Agreement. Wiley Interdiscip. Rev. Clim. Chang. 2018, 9, 1–9. [Google Scholar] [CrossRef] [Green Version]
  47. Nicholls, R.J. Adaptation Options for Coastal Areas and Infrastructure: An Analysis for 2030. 2007. Available online: https://www.unfccc.int/files/cooperation_and_support/financial_mechanism/application/pdf/nicholls.pdf (accessed on 5 January 2022).
  48. Bukvic, A.; Zhu, H.; Lavoie, R.; Becker, A. The role of proximity to waterfront in residents’ relocation decision-making post-Hurricane Sandy. Ocean Coast. Manag. 2018, 154, 8–19. [Google Scholar] [CrossRef]
  49. Williams, S.J. Sea-level rise implications for coastal regions. J. Coast. Res. 2013, 63, 184–196. [Google Scholar] [CrossRef]
  50. Bukvic, A.; Smith, A.; Zhang, A. Evaluating drivers of coastal relocation in Hurricane Sandy affected communities. Int. J. Disaster Risk Reduct. 2015, 13, 215–228. [Google Scholar] [CrossRef]
  51. Abel, N.; Gorddard, R.; Harman, B.; Leitch, A.; Langridge, J.; Ryan, A.; Heyenga, S. Sea level rise, coastal development and planned retreat: Analytical framework, governance principles and an Australian case study. Environ. Sci. Policy 2011, 14, 279–288. [Google Scholar] [CrossRef]
  52. Browne, E.; Siegel, P. No Regrets Approach to Human Vulnerability to Climate Change GEQ Heltberg Siegel Jorgensen 2009 Related Papers. 2010. Available online: https://www.academia.edu/5641848/No_Regrets_Approach_to_Human_Vulnerability_to_Climate_Change_GEQ_Heltberg_Siegel_Jorgensen_2009 (accessed on 5 January 2022).
  53. Messner, F.; Meyer, V. Flood Damage, Vulnerability and Risk Perception—Challenges for Flood Damage Research; Springer: Berlin/Heidelberg, Germany, 2005. [Google Scholar]
  54. Allan, A.; Hissen, N.F.; Ghosh, A.; Samling, C.L.; Tagoe, C.A.; Nelson, W.; Mensah, A.; Salehin, M.; Mondal, S.; Spray, C. Stakeholder Mapping for Adaptation in Deltas. 2015, p. 89. Available online: https://generic.wordpress.soton.ac.uk/deccma/wp-content/uploads/sites/181/2017/07/D1.1.2_Stakeholder-mapping-Fast-Track.pdf (accessed on 5 January 2022).
  55. Cazcarro, I.; Arto, I.; Hazra, S.; Bhattacharya, R.N.; Osei-Wusu Adjei, P.; Ofori-Danson, P.K.; Asenso, J.K.; Amponsah, S.K.; Khondker, B.; Raihan, S.; et al. Biophysical and socioeconomic state and links of deltaic areas vulnerable to climate change: Volta (Ghana), Mahanadi (India) and Ganges-Brahmaputra-Meghna (India and Bangladesh). Sustainability 2018, 10, 893. [Google Scholar] [CrossRef] [Green Version]
  56. Chambers, R. The Origins and Practice of Rural Appraisal. World Dev. 1994, 22, 953–969. Available online: http://www.ircwash.org/sites/default/files/125-94OR-16929.pdf (accessed on 5 January 2022). [CrossRef] [Green Version]
  57. Ahsan, N.; Warner, J. The Socioeconomic Vulnerability Index: A Pragmatic Approach for Assessing Climate Change Led Risks–A Case Study in the South-Western Coastal Bangladesh; Elsevier: Amsterdam, The Netherlands, 2014; Available online: https://www.sciencedirect.com/science/article/pii/S221242091300071X (accessed on 5 January 2022).
  58. Krejcie, R.V.; Morgan, D.W. “Determining sample Size for Research Activities”, Educational and Psychological Measurement. Int. J. Employ. Stud. 1996, 18, 89–123. [Google Scholar]
  59. Yansaneh, I.S. An analysis of cost issues for surveys in developing and transition countries. In Household Sample Surveys in Developing and Transition Countries; 2005; pp. 253–266. Available online: http://unstats.un.org/unsd/hhsurveys/pdf/Household_surveys.pdf (accessed on 5 January 2022).
  60. Antwi, E.K.; Boakye-Danquah, J.; Barima Owusu, A.; Loh, S.K.; Mensah, R.; Boafo, Y.A.; Apronti, P.T. Community vulnerability assessment index for flood prone savannah agro-ecological zone: A case study of Wa West District, Ghana. Weather. Clim. Extrem. 2015, 10, 56–69. [Google Scholar] [CrossRef] [Green Version]
  61. Chakraborty, L.; Rus, H.; Henstra, D.; Thistlethwaite, J.; Scott, D. A place-based socioeconomic status index: Measuring social vulnerability to flood hazards in the context of environmental justice. Int. J. Disaster Risk Reduct. 2020, 43, 101394. [Google Scholar] [CrossRef]
  62. Lee, Y.J. Social vulnerability indicators as a sustainable planning tool. Environ. Impact Assess. Rev. 2014, 44, 31–42. [Google Scholar] [CrossRef]
  63. Weis, S.W.M.; Agostini, V.N.; Roth, L.M.; Gilmer, B.; Schill, S.R.; Knowles, J.E.; Blyther, R. Assessing vulnerability: An integrated approach for mapping adaptive capacity, sensitivity, and exposure. Clim. Chang. 2016, 136, 615–629. [Google Scholar] [CrossRef] [Green Version]
  64. Armah, F.A.; Ekumah, B.; Yawson, D.O.; Odoi, J.O.; Afitiri, A.R.; Nyieku, F.E. Predictive Probabilities of Access to Clean Cooking: Evidence from the Demographic and Health Surveys in 31 Countries in Sub-Saharan Africa. Environ. Justice 2019, 12, 118–131. [Google Scholar] [CrossRef] [Green Version]
  65. Bukvic, A.; Owen, G. Attitudes towards relocation following Hurricane Sandy: Should we stay or should we go? Disasters 2017, 41, 101–123. [Google Scholar] [CrossRef] [PubMed]
  66. Hadipour, V.; Vafaie, F.; Kerle, N. An indicator-based approach to assess social vulnerability of coastal areas to sea-level rise and flooding: A case study of Bandar Abbas city, Iran. Ocean. Coast. Manag. 2020, 188, 105077. [Google Scholar] [CrossRef]
  67. Wood, N.J.; Burton, C.G.; Cutter, S.L. Community variations in social vulnerability to Cascadia-related tsunamis in the U.S. Pacific Northwest. Nat. Hazards 2010, 52, 369–389. [Google Scholar] [CrossRef] [Green Version]
  68. Zhang, X.; Yi, L.; Zhao, D. Community-based disaster management: A review of progress in China. Nat. Hazards 2013, 65, 2215–2239. [Google Scholar] [CrossRef]
  69. Clark, G.E.; Moser, S. Assessing the Vulnerability of Coastal Communities to Extreme Storms: The Case of Revere, MA, USA. Mitig. Adapt. Strateg. Glob. Chang. 1998, 3, 59–82. [Google Scholar] [CrossRef]
  70. Chen, W.; Cutter, S.L.; Emrich, C.T.; Shi, P. Measuring social vulnerability to natural hazards in the Yangtze River Delta region, China. Int. J. Disaster Risk Sci. 2013, 4, 169–181. [Google Scholar] [CrossRef] [Green Version]
  71. Enarson, E. Through women’s eyes: A gendered research agenda for disaster social science. Disasters 1998, 22, 157–173. [Google Scholar] [CrossRef]
  72. Morrow, B.H. Identifying and mapping community vulnerability. Disasters 1999, 23, 1–18. [Google Scholar] [CrossRef]
  73. IPCC. Climate Change 2014 Synthesis Report_AR5 FINAL; IPCC: Geneva, Switzerland, 2014. [Google Scholar]
  74. Sufri, S.; Dwirahmadi, F.; Phung, D.; Rutherford, S. A systematic review of Community Engagement (CE) in Disaster Early Warning Systems (EWSs). Prog. Disaster Sci. 2020, 5, 100058. [Google Scholar] [CrossRef]
  75. Jordan, E.; Javernick-Will, A. Indicators of Community Recovery: Content Analysis and Delphi Approach. Nat. Hazards Rev. 2013, 14, 21–28. [Google Scholar] [CrossRef]
  76. Noble, I.R.; Huq, S.; Anokhin, Y.A.; Carmin, J.; Goudou, D.; Lansigan, F.P.; Osman-Elasha, B.A.V. Adaptation needs and options. In Climate Change 2014: Impacts, Adaptation, and Vulnerability. Part A: Global and Sectoral Aspects; Contribution of Working Group II to the Fifth Assessment Report of the Intergovernmental Panel on Climate Change; Cambridge University Press: Cambridge, UK, 2014; pp. 833–868. [Google Scholar]
  77. World Bank. World Development Report 2000/2001: Attacking Poverty; The World Bank: Washington, DC, USA, 2000; Available online: https://www.ipcc.ch/site/assets/uploads/2018/02/WGIIAR5-Chap14_FINAL.pdf (accessed on 10 January 2022).
  78. Schmidt-Thomé, P.; Greiving, S. European Climate Vulnerabilities and Adaptation: A Spatial Planning Perspective; John Wiley & Sons: Hoboken, NJ, USA, 2013. [Google Scholar]
  79. Wongbusarakum, S.; Loper, C. Indicators to assess community—Level social vulnerability to climate change. In NOAA Document, April; 2011; pp. 1–41. Available online: https://reefresilience.org/pdf/SocMon_Climate_change_guidlelines_FINAL_april_2011.pdf (accessed on 10 January 2022).
  80. Žurovec, O.; Čadro, S.; Sitaula, B.K. Quantitative Assessment of Vulnerability to Climate Change in Rural Municipalities of Bosnia and Herzegovina. Sustainability 2017, 9, 1208. [Google Scholar] [CrossRef] [Green Version]
  81. Das, M.; Chattopadhyay, A.; Basu, R. Spatial flood potential mapping with flood probability and exposure indicators of flood vulnerability: A case study from West Bengal, India. Int. J. Georesources Environ. 2017, 3, 85–93. [Google Scholar]
  82. Scheuer, S.; Haase, D. Exploring multicriteria flood vulnerability by integrating economic, social and ecological dimensions of flood risk and coping capacity: From a starting point view towards an end point view of vulnerability. Nat. Hazards 2011, 58, 731–751. [Google Scholar] [CrossRef]
  83. Fabozzi, F.J.; Focardi, S.M.; Rachev, S.T.; Arshanapalli, B.G. The Basics of Financial Econometrics: Tools, Concepts, and Asset Management Applications; John Wiley & Sons: Hoboken, NJ, USA, 2014. [Google Scholar]
  84. Zhou, W.; Ma, Z.; Guo, S.; Deng, X.; Xu, D. Livelihood capital, evacuation and relocation willingness of residents in earthquake-stricken areas of rural China. Saf. Sci. 2021, 141, 105350. [Google Scholar] [CrossRef]
  85. Buchori, I.; Pramitasari, A.; Pangi, P.; Sugiri, A.; Maryono, M. International Journal of Disaster Risk Reduction Factors distinguishing the decision to migrate from the flooded and inundated community of Sayung, Demak: A suburban area of Semarang City, Indonesia. Int. J. Disaster Risk Reduct. 2021, 52, 101946. [Google Scholar] [CrossRef]
  86. Xu, D.; Peng, L.; Liu, S.; Su, C.; Wang, X. Influences of Sense of Place on Farming Households’ Relocation Willingness in Areas Threatened by Geological Disasters: Evidence from China. Int. J. Disaster Risk Sci. 2017, 8, 16–32. [Google Scholar] [CrossRef]
  87. Seebauer, S.; Winkler, C. Should I stay or should I go? Factors in household decisions for or against relocation from a flood risk area. Glob. Environ. Chang. 2020, 60, 102018. [Google Scholar] [CrossRef]
  88. Vincent, K.; Cull, T. A Household Social Vulnerability Index (HSVI) for Evaluating Adaptation Projects in Developing Countries. Available online: https://www.semanticscholar.org/paper/A-Household-Social-Vulnerability-Index-%28HSVI%29-for-Vincent-Cull/1166265e6df595c90fcca96be504bd0b68ce1802 (accessed on 10 January 2022).
  89. Correll, R.M.; Lam, N.S.N.; Mihunov, V.V.; Zou, L.; Cai, H. Economics over Risk: Flooding Is Not Considerations on a Vulnerable Coast. Ann. Am. Assoc. Geogr. 2021, 111, 300–315. [Google Scholar] [CrossRef]
Figure 2. A map of the study area.
Sustainability 14 05698 g002
Figure 3. Sociodemographic characteristics of survey respondents (household heads).
Sustainability 14 05698 g003
Figure 4. Flood exposure levels for the communities.
Sustainability 14 05698 g004
Figure 5. Flood sensitivity levels for the communities.
Sustainability 14 05698 g005
Figure 6. Potential Impact for the communities.
Sustainability 14 05698 g006
Figure 7. Composite vulnerability for the communities.
Sustainability 14 05698 g007
Figure 8. Adaptive capacity levels for the communities.
Sustainability 14 05698 g008
Table 1. Normalization methods.
MethodEquationDescriptionReferences
Ranking N i a s = R a n k ( X i a s ) Uses on ordinal variables that can be converted to quantitative variables.[34,36]
Z scores Z = x µ σ Transforms all indicators values to a single scale with a mean of 0 and a standard deviation of 1.[36,37]
Min–max I s c = S S m i n S m a x S m i n Rescales indicator values between 0 (worst rank) and 1 (best rank).[3,36]
Distance to target N i a s = X i a s T a r g e t   X i a s Rescales values between 0 and 1. It is the ratio of the value of the indicator to its maximum value.[34,36]
Table 6. Indices of sensitivity, exposure, potential impact, adaptive capacity, and composite vulnerability.
CommunitySensitivityExposurePotential ImpactAdaptive CapacityCommunity Vulnerability
Adina0.510.480.990.680.36
Amutsinu0.330.510.850.370.45
Salakope0.510.541.050.430.64
Agavedzi0.230.440.680.630.16
Blekusu0.700.230.930.950.1
Exposure and Sensitivity is ranked as high (≥0.30), medium (0.18–0.29) and low (<0.18), potential impact is ranked as high (≥0.7) and medium (0.5–0.69), and composite vulnerability classifications, a score of 0.67; 1 is highly vulnerable, 0.34–0.66 vulnerable, and 0–0.33 least vulnerable, after Yankson et al. [3] and Schmidt-Thomé & Greiving [78].
Table 7. Negative log-log regression model, illustrating the relationship between explanatory and dependent variables (relocation adaptation option).
VariablePredictors + Compositional and Contextual Factors
ORSEp ValueConfidence Interval
Flood duration1.0096460.00330710.0031.0031851.016148
Livelihoods (ref: 1 livelihood)
2 livelihoods0.57047490.10863010.0030.39278090.8285577
Sea defence (ref: No)
Yes0.18793530.03494850.0000.13053250.2705814
Age of household head (ref: 20–30)
40–591.0673890.21570250.320.7183041.586124
60+0.89819230.1996318−0.480.58100741.388535
Gender of household head (ref: male)
Female1.3778110.28341031.560.92066292.061951
House size (ref: 1–4)
5–71.2827950.39628040.810.70017132.350228
Above 81.1041630.3076610.360.63952351.906381
Education (ref: No education)
Basic school1.1198960.22315490.570.75781591.654975
Secondary school and above1.5446110.4532590.1380.86903592.745366
Monthly Income (ref: <100)
100–4001.0246140.1999090.120.69901341.501881
500–9001.6914490.55156991.610.8926643.205014
1000 and above0.95767960.3090339−0.130.50879841.802581
Community (ref: Adina)
Agavedzi1.0893870.15609240.320.64765221.832408
Blekusu0.88193460.1560924−0.710.62342371.24764
Probabilities Parameters
AIC0.653236Residual df338
BIC−1784.577(1/df) Deviaance0.5894838
Log pseudolikelihood−99.622777052(1/df) Pearson0.7939348
Publisher’s Note: MDPI stays neutral with regard to jurisdictional claims in published maps and institutional affiliations.

