Article

Investigation of Combined Heating and Cooling Systems with Short- and Long-Term Storages

1
Department of Energy and Process Engineering, Norwegian University of Science and Technology, 7491 Trondheim, Norway
2
Norconsult AS, 1338 Sandvika, Norway
*
Author to whom correspondence should be addressed.
Sustainability 2022, 14(9), 5709; https://doi.org/10.3390/su14095709
Submission received: 3 March 2022 / Revised: 2 May 2022 / Accepted: 4 May 2022 / Published: 9 May 2022

Abstract

:
Modern buildings in cold climates, like Norway, may have simultaneous heating and cooling demands. For these buildings, integrated heating and cooling systems with heat pumps, as well as short-term and long-term thermal storage, are promising solutions. Furthermore, combining this integrated system with renewables aids in the transition to future sustainable building energy systems. However, cost-effectively designing and operating such a complicated system is challenging and rarely addressed. Therefore, this research proposed an integrated heating and cooling system that incorporated a short-term water tank and a long-term borehole thermal storage. Meanwhile, three operating modes: heating, cooling, and free cooling were defined based on different heating and cooling load conditions. A detailed system model was developed in MATLAB using heat pump manufacture data as well as simulated and measured building loads. Following that, sensitivity studies were performed to investigate the impacts of ground properties, thermal storage size, setpoint temperature, heat pump characteristics, and load conditions. The findings identified the crucial factors that influence the system’s overall energy efficiency and the functioning of the key system components. Particularly, it revealed that low cooling to heating ratios caused an imbalance in charging and discharging, further reducing the ground temperature and degrading the heat pump’s performance.

1. Introduction

The buildings sector is accountable for 40% of the total energy use [1,2] and 40% of the direct and indirect CO2 emissions in the world [3]. The overall energy use in both residential and commercial buildings has increased from 2010 to 2020 in most regions of the world and is following a projected upward trend until 2050 [1]. To tackle the growing demand for thermal energy while not relying on fossil fuels, modern building energy systems must be integrated with renewable energies. Meanwhile, other solutions, such as short- and long-term thermal storage and combining the heating and cooling systems, could be effective in harnessing these renewable energies. Especially in the situation where heating and cooling energy are simultaneously required. Many buildings have a heating or cooling dominated demand profile depending on the climate and season with frequent hours of mixed load during the year. Therefore, the simultaneity of heating and cooling demand is another aspect to be considered when designing building energy systems [4,5]. Utilizing heat pumps allows the coupling of heating and cooling sides, resulting in simultaneous production of heating and cooling energy with lower power input [4].
Heat pump-based technologies can be coupled with available renewable energy sources such as geothermal energy to simultaneously cover both heating and cooling demands [6,7]. A ground source heat pump (GSHP) uses the groundwater or material as the heat source or sink [1,8,9]. Below certain depths, the ground temperature is more stable and suitable for heat pumps. For heating applications in the winter, the ground serves as a heat source with a temperature higher than the surrounds, while in summer thermal energy can be stored in the ground for long periods despite the low specific heat of the ground material [8,9,10]. A typical model of a GSHP system includes ground heat exchangers (GHEs), heat pump units, distribution networks, as well as heating and cooling users, and may additionally include short- and long-term thermal storage units and auxiliary systems. The design of each component is associated with various degrees of simplification, assumptions, and physical constraints. Therefore, the design parameters of components can affect the efficiency of the whole system. Since the building’s energy systems are developed based on the thermal load of the building and the system exergy efficiency, the design of GSHP must consider improved system efficiency at any combination of loads for better energy saving [4,8]. This can be done by efficient design and parametric analysis of the components and their interconnection as a system. There is a considerable amount of research on the design and performance analysis of heating and cooling energy systems [6,11,12,13,14,15,16,17]. A critical review of borehole thermal energy storage (BTES) systems showed that undersized BTES will lead to a higher heat transfer rate due to a greater temperature gradient [8]. Sarbu et al. performed a general review of GSHP technologies for the heating and cooling of buildings. The ground coupled heat pump (GCHP) was found more suitable for mix load profiles than other GSHP solutions if effectively designed in accordance with the physical and local requirements [7]. Hino et al. [11] proposed a ground loop water system connected to a solar/air source heat pump system and tested it with one simplified air conditioning unit. They drew the same conclusion as [7] from the numerical analysis of a daily cycle of GCHP operation [11]. Sircar et al. studied the performance of a GCHP system in India with focus on various load scenarios representing seasonal changes. They concluded that a higher coefficient of performance (COP) can be achieved in cooling dominated scenario [13]. Rui et al. developed an integrated GSHP model using the finite element method to model the GHE and the thermal piles in detail, and C++ to connect the component models. The heat pump was modelled based on capacity and power data provided by the manufacturers. In a case study of an existing system in London, they found high fitness between the simulation and measured data. Their study concluded that the effect of thermal pile distances on the system performance becomes more significant in heating or cooling only because of continuously heating or cooling the ground leading to imbalance in ground temperature [14]. A case study of an integrated heating and cooling system including long- and short-term TES for a building in Oslo, Norway, was performed in [12]. The component models were developed in Modelica. The mismatch between the heat extraction from the ground in the winter and heat injection from solar collectors led to a decrease in ground temperature and consequently a decrease in the long-term performance of the system [12]. To avoid this problem they suggested either installing more solar collectors or inputting more auxiliary heat from the local district heating grid [12]. Ferrantelli et al. presented a calculation procedure for design of the BTES yield per length of piles that was tested on a heating application for a commercial building using IDA-ICE to couple the heat pump model with heat transfer processes. Parametric study of long-term operation of the system showed that the heat extraction rate was not directly related to evaporator load [17]. Their study also confirmed the significant reduction of BTES size when long term thermal storage was included [17]. Shin et al. proposed an arrangement for a simultaneous heating and cooling system with focus on operation control strategies and the impact of user side system [4]. The components of the system were sized via conventional methods and the operation strategy was focused on controlling the temperatures at short-term thermal storages. A simulation of a winter month in Korea was performed in TRANSYS. Although qualitative, the study confirmed the energy and economic advantages the proposed operation strategy.
Most of the studies showed that GSHP could be more suitable than conventional systems for residential and commercial buildings [3,4,7]. However, the large-scale implementation of such systems is still hardly possible. Due to many complex variables involved in the physical analysis of such energy systems, specific physical models are often only applicable to specific systems. There are well-established methods for sizing each element of a complex energy system stand alone. Some studies addressed a more efficient combination of elements, although for specific application and demand profiles. However, the energy-efficient design of an energy system relies on the proper sizing of each component concerning the rest of the system and the long-term operation strategy of the system. How to size the main components of a heat pump-based energy system with the integration of short- and long-term storage has not yet been well explored. Geothermal building energy systems require more flexible and transferable design methods able to identify issues such as ground temperature changes, thermo-physical properties of the ground, design constraints and variables, and sizing of the components [18,19,20,21]. In this regard, a general method for the preliminary design of heat pump-based building energy systems is very much needed. In this study, general and integrated heating and cooling systems are described and analyzed. The main components considered were a heat pump, borehole long-term thermal storage, and hot water storage tank (HWST) as short-term thermal storage. The dynamic heat transfer models were developed in MATLAB. This analysis aimed to investigate the most influencing parameters in sizing and overall efficiency improvement of the energy system considering several load combinations.
The structure of this paper is as follows. The description of the energy system is given in Section 2. In Section 3 methods for modelling the system parts are explained. An integrated model of the system and operation strategies are described in Section 4. Sensitivity analysis is introduced in Section 5. Results are presented in Section 6, followed by a discussion in Section 7, with the main conclusions of the research in Section 8.

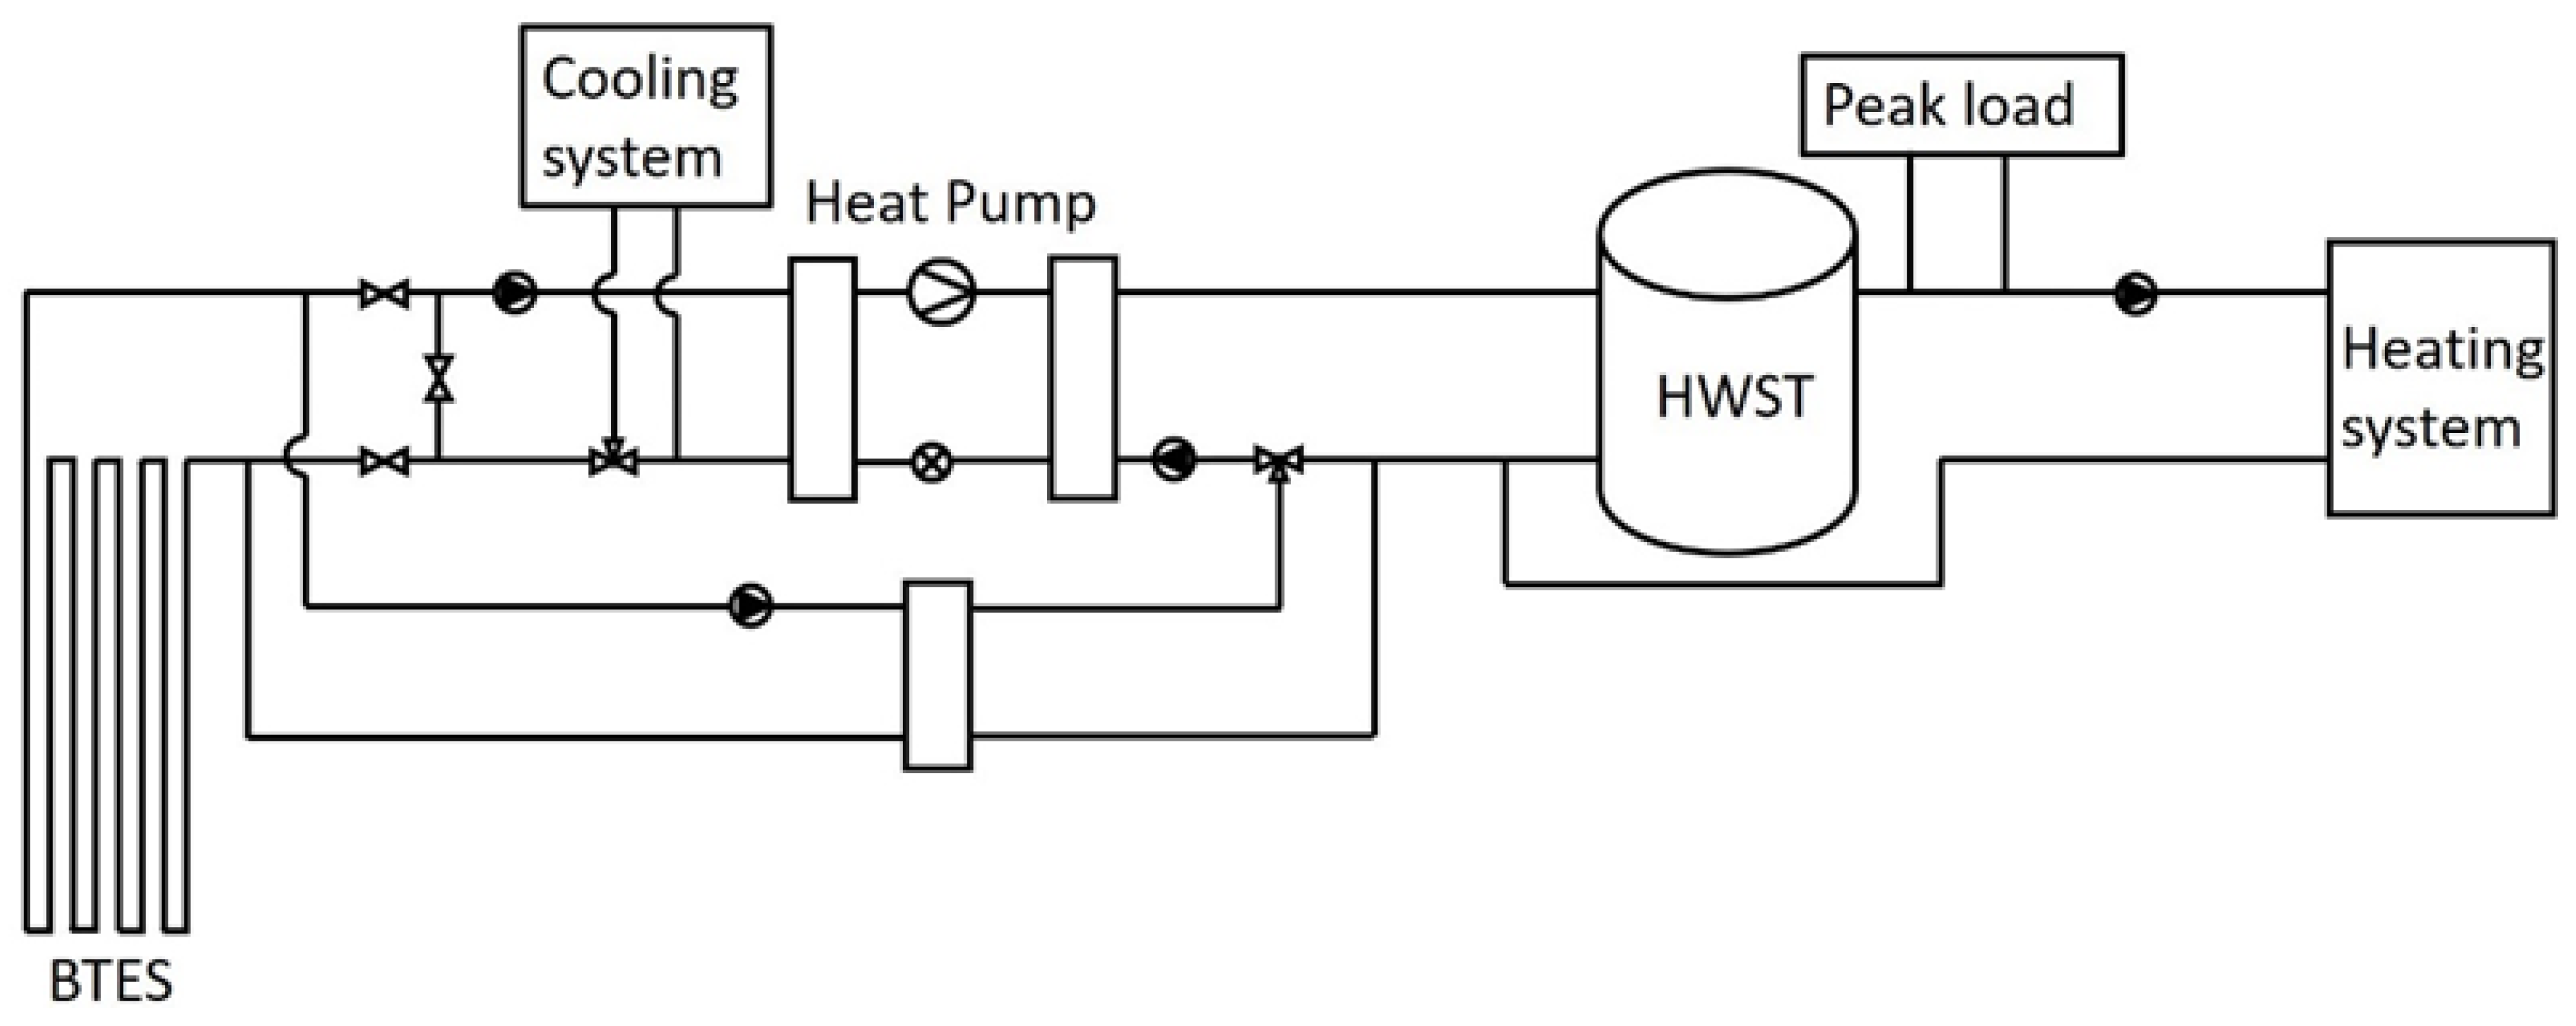
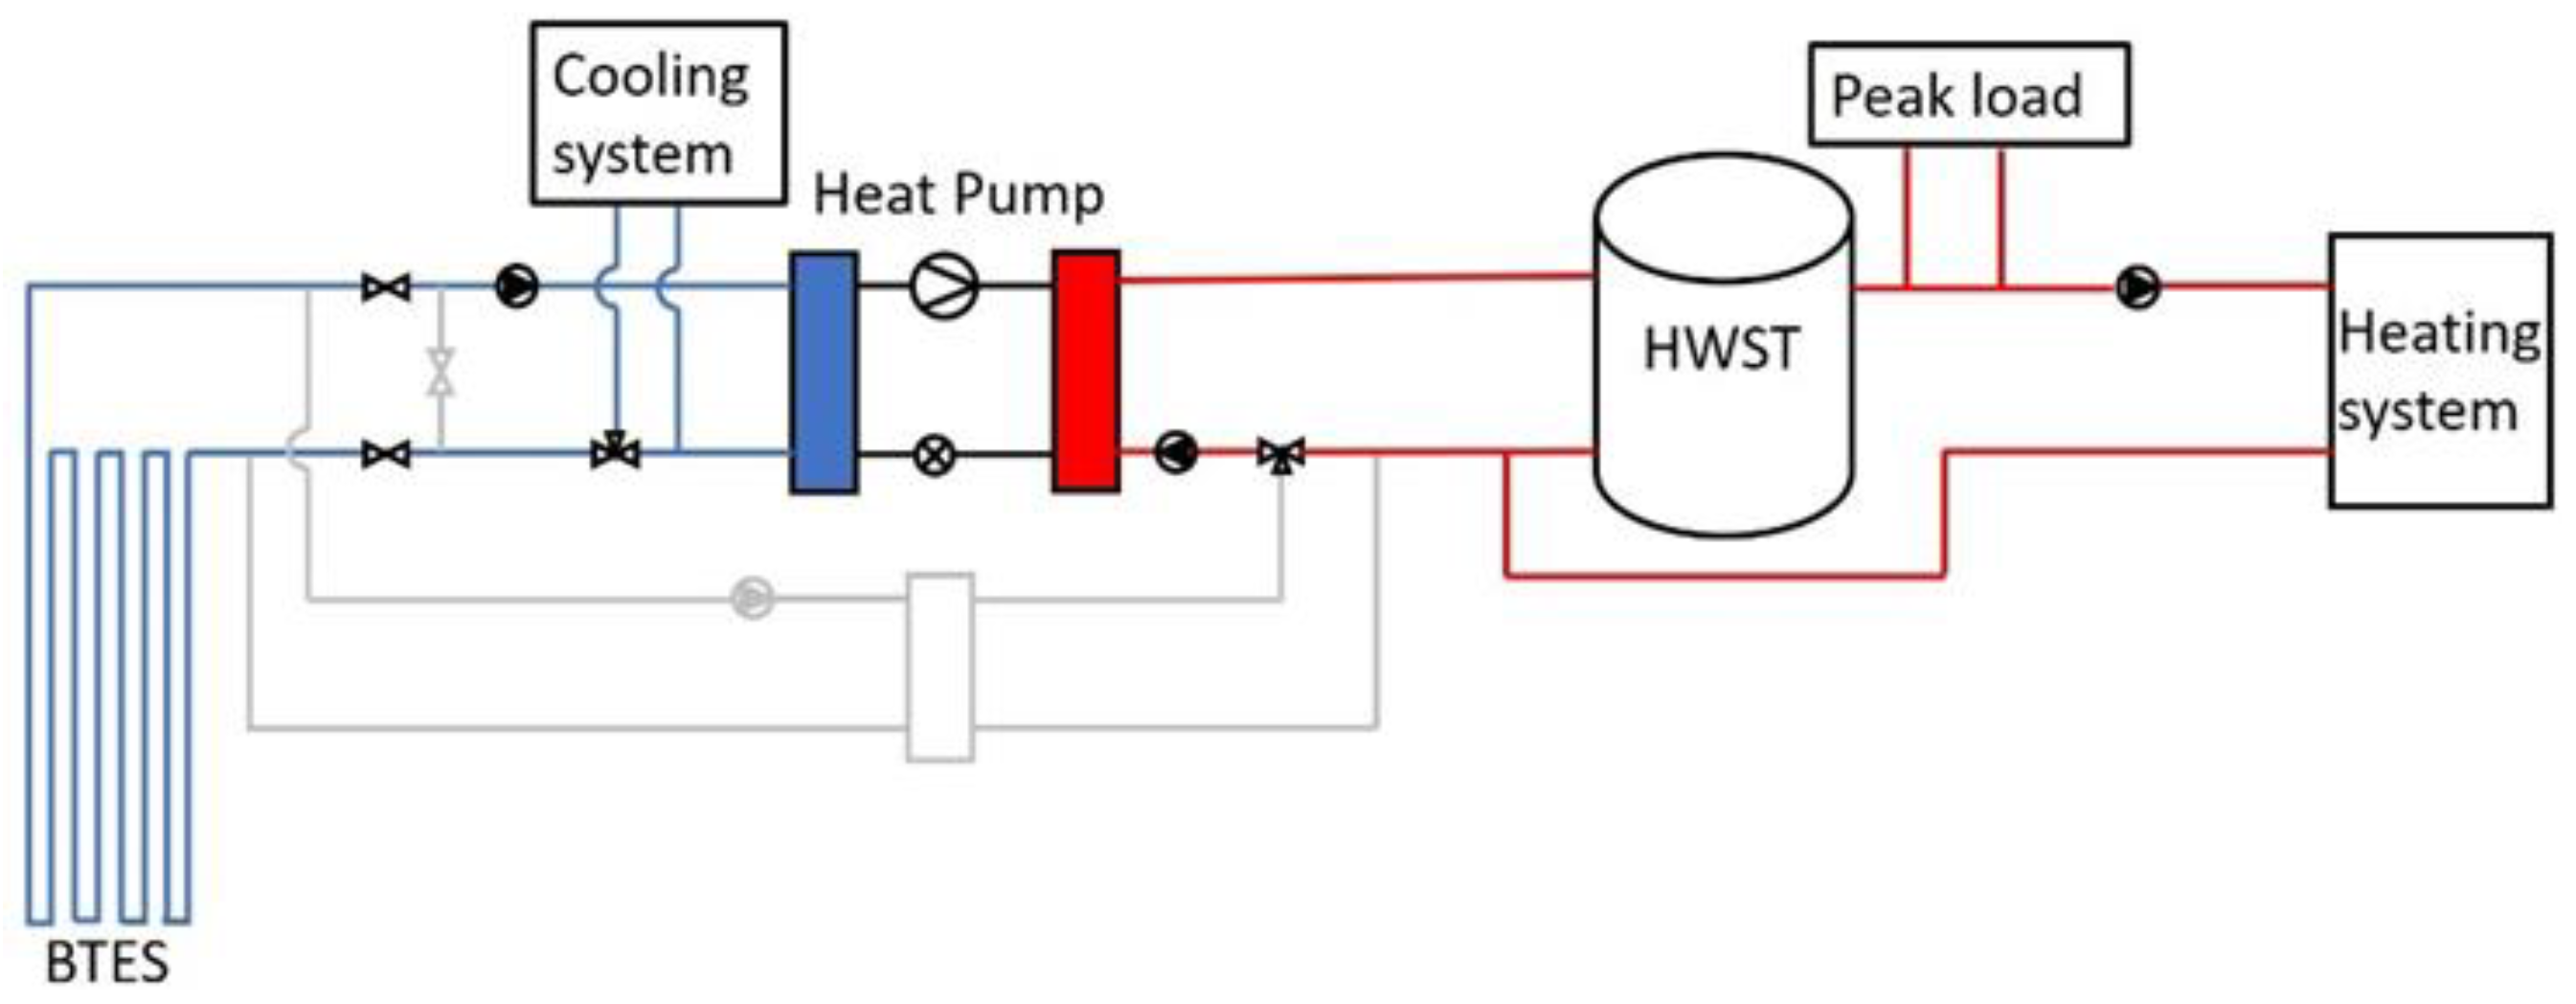
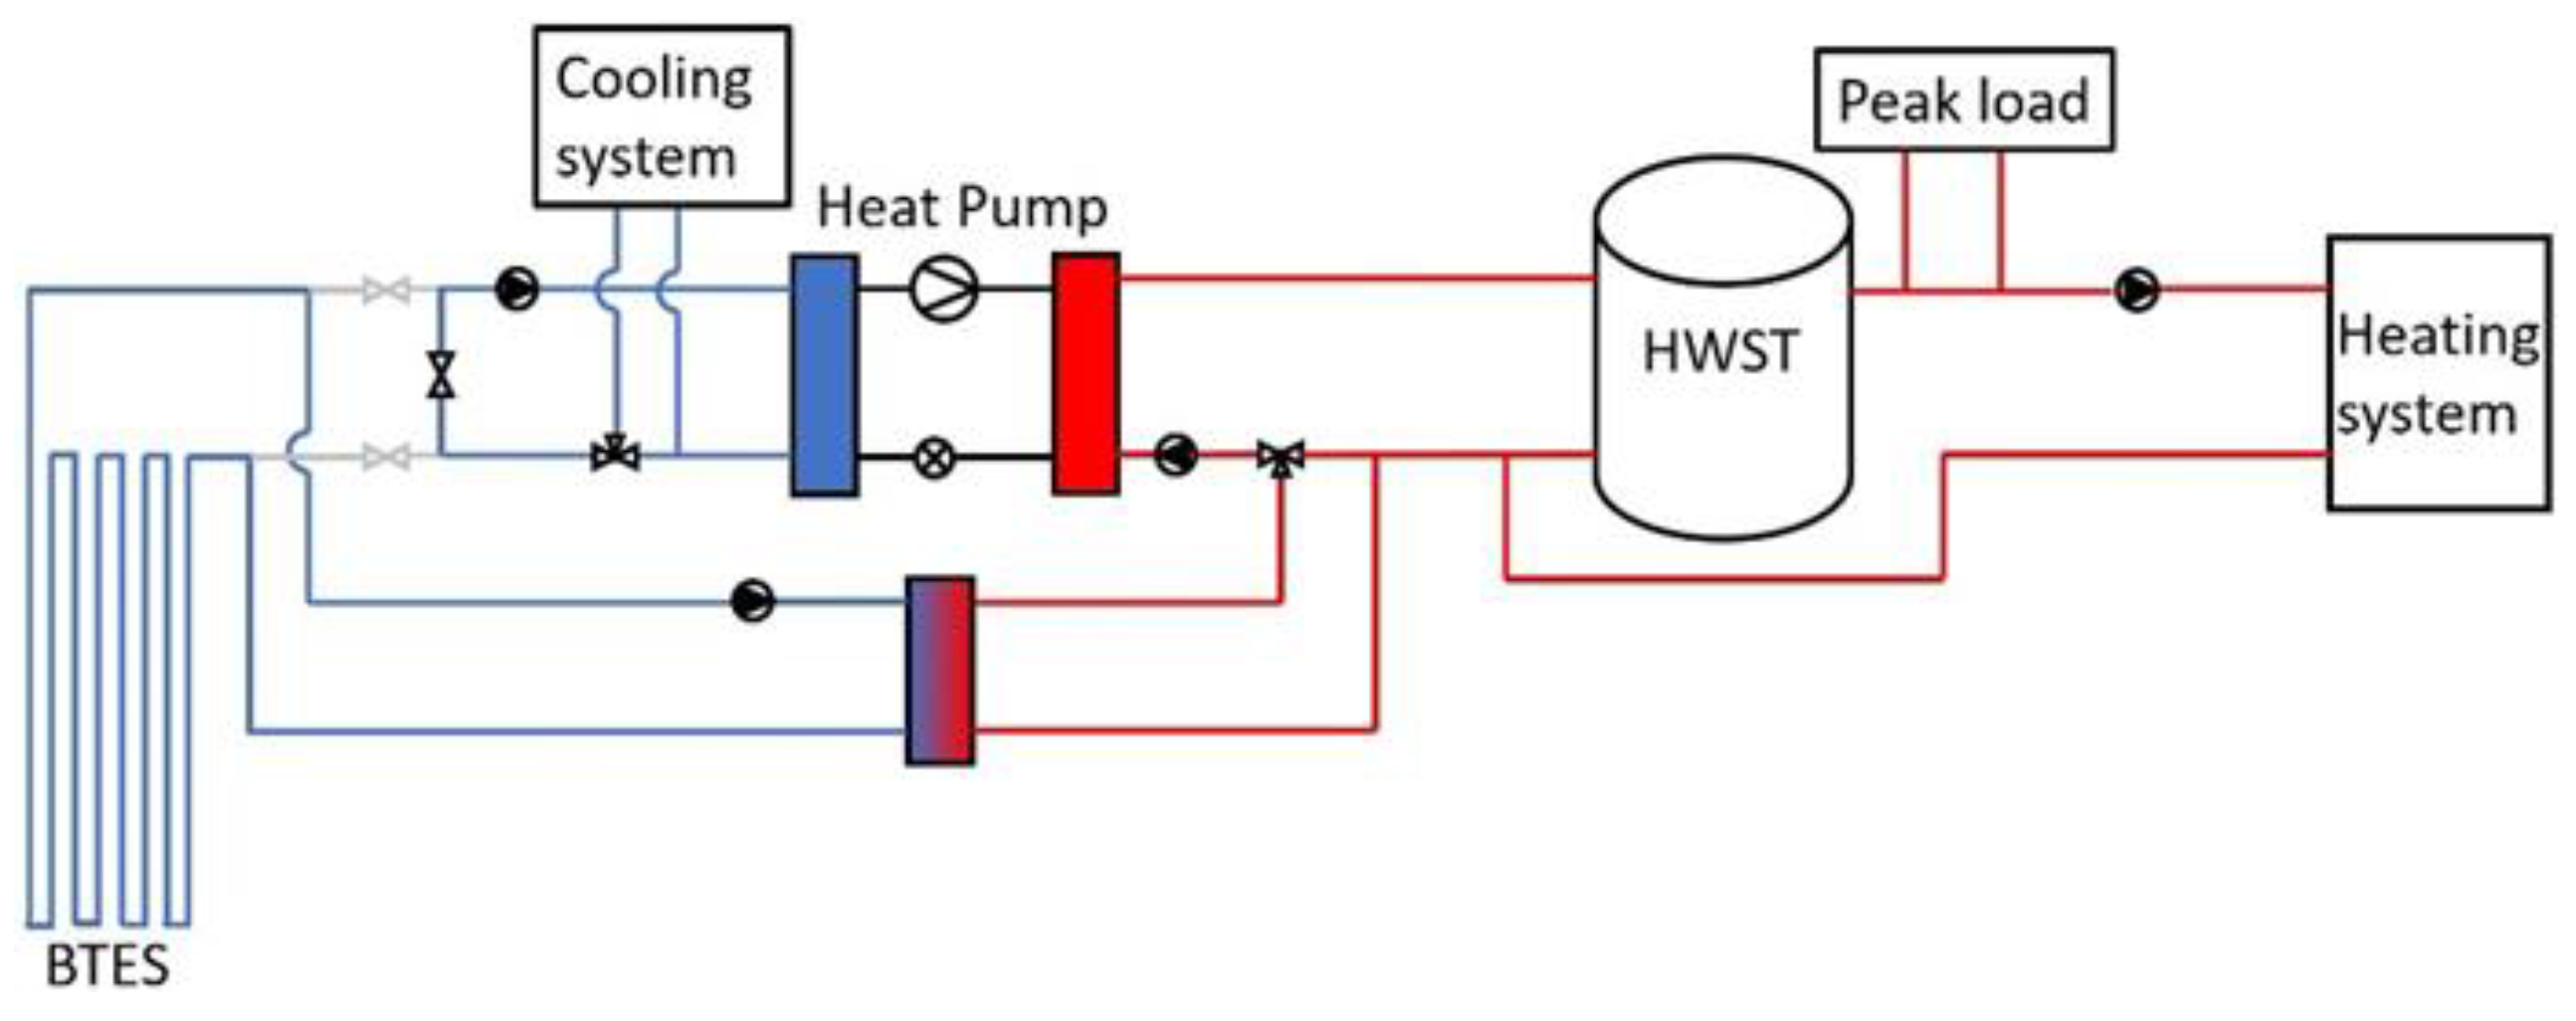
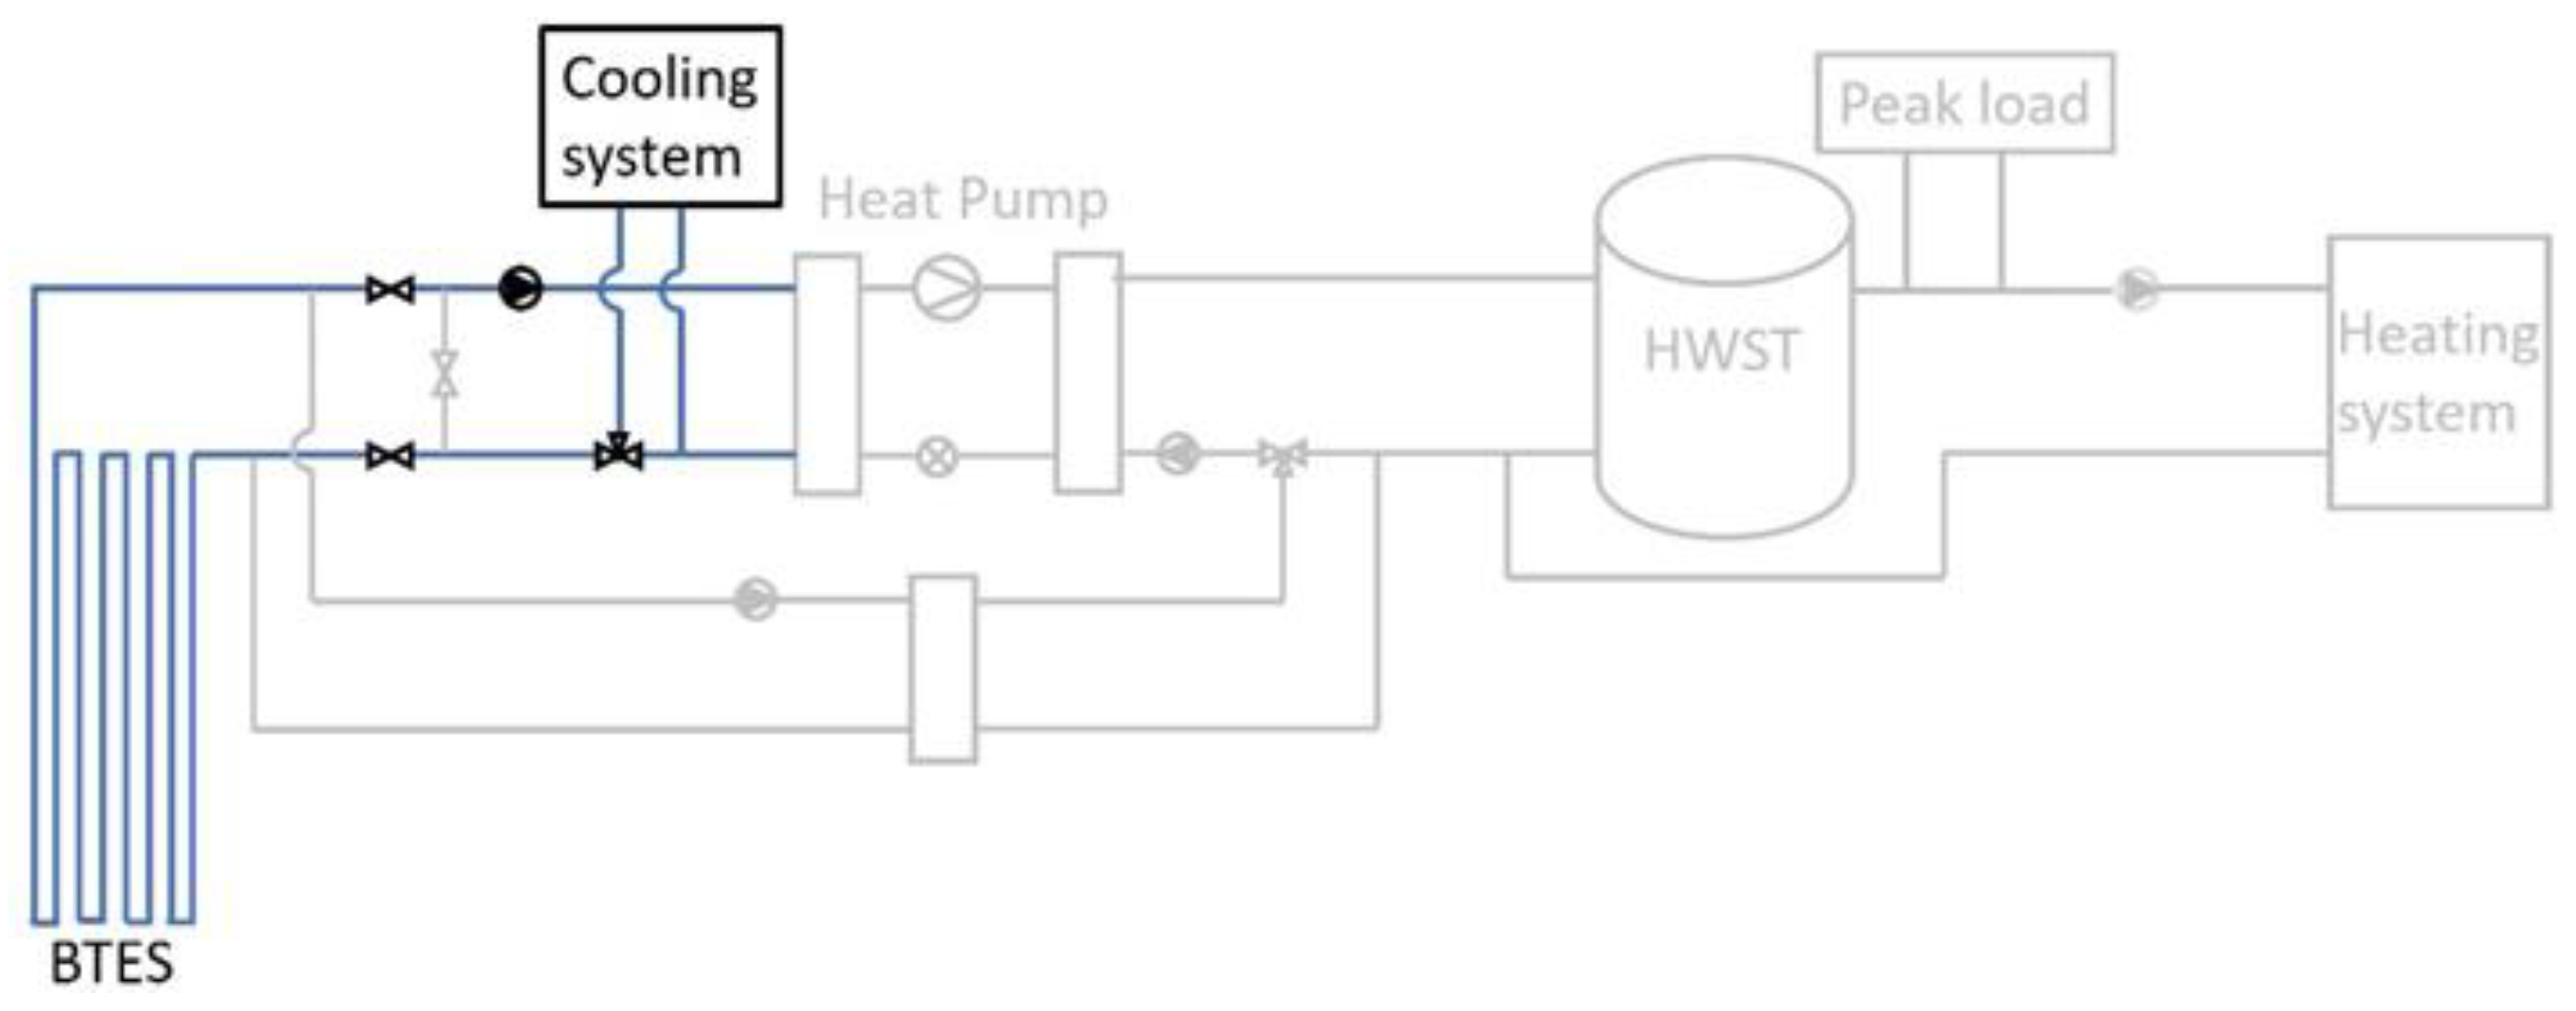
2. System Description

The system considered in this study consisted of a heat pump, substations, an HWST, and a BTES to meet the overall heating and cooling demands of a target user, as shown in Figure 1. The heating system where the heat was provided by the thermal energy system was supplied to cover the heating demands such as space heating, heating of ventilation air, and heating of domestic hot water. These loads were assembled into one large heating demand as the system input. The same was applied to the cooling demand which consisted of process cooling and cooling of the ventilation air. Heat sources for the heat pump could be the cooling load from the cooling system or BTES. The heating energy supplied by the heat pump was primarily stored in the HWST. Surplus heat, which was not immediately utilized or stored in the HWST, was stored in BTES via a heat exchanger. The heating system received the required heating energy from the HWST. The minimum temperature for the heating system was set to 50 °C. A district heating connection was also considered as an auxiliary heating unit for the peak load coverage if a necessary temperature lift was required.
Hourly values of annual heating and cooling loads were calculated and measured in advance because these are necessary as the inputs to the model. The model was tested for two targeted users with distinct demand characteristics to study the transferability of the model outcomes. Data for Load 1 was calibrated based on the thermal demands of the barracks of a military base, while data for Load 2 was collected from the simulation of a hospital energy system in Norway. These data included the values for the whole demand of the substation based on the occupant’s behavior and outdoor temperature. The two loads and their distributions are presented in Figure 2 and Figure 3.
The first user had relatively high and constant heating and cooling demand throughout the year. This user was named Load 1 and the values were generated in advance to resemble the total energy demands of the military base. The second user had fewer total annual energy demands. The heating and cooling demands did not overlap. This user was named Load 2 and its values were obtained from the energy consumption records of a hospital. Table 1 presents key information for the users. The ratio of total cooling demand to heating demand α was introduced to include the combination of loads in the assessment. As the base case, Load 1 was characterized by a higher peak heating load and larger α value while Load 2 had a larger peak cooling load and a lower α value.

3. Methods

In this section, the approaches chosen for the sizing of each component of the system are described. The dynamic thermal balance model of the system developed in MATLAB is explained. Further, a sensitivity analysis of the key parameters of the system is presented.

3.1. Heat Pump Model

A heat pump consists of a closed vapor compression cycle including two heat exchangers as the condenser and evaporator and a compressor. Heat pump models can be obtained from parametric modelling of the refrigerant cycle in which each of the components of the heat pump must be designed by employing physical relations. On the other hand, empirical heat pump models are developed from the records of the capacities and power in relation to one or several operating conditions [22,23,24]. The heat pump model used for this study was based on simulation data generated from the compressor manufacturer BITZER [25]. The data was idealized and was not affected by the layout and installation of the actual system. Nominal capacities were derived as functions of evaporation temperature T o , compressor discharge temperature T d , and nominal cooling capacity Q ˙ c p , e v as follows:
Q ˙ c p , e v = q 1 + q 2 T o + q 3 T o 2 + q 4 T o 3 + q 5 T d 3 + q 6 T d + q 7 T d T o + q 8 T d T o 2
Q ˙ c p , c d = C 1 + C 2 T d + C 3 T o + C 4 Q ˙ c p , e v + C 5 T d T o + C 6 Q ˙ c p , e v T d + C 7 T o 2 + C 8 Q ˙ c p , e v T o
P c p = p 1 + p 2 T o + p 3 T d + p 4 Q ˙ c p , e v T d + p 5 T o 2 + p 6 Q ˙ c p , e v 2 T d + p 7 Q ˙ c p , e v + p 8 Q ˙ c p , e v 2 T o
T c = a 1 + a 2 T o + a 3 T o 2 + a 4 T d + a 5 T d T o + a 6 T o 3 + a 7 T d 2 + a 8 T d T o 2
Coefficients in Equations (1)–(4) were obtained from the regression analyses of data from the BITZER software [25]. For each of the two profiles, a heat pump was selected with the specifications listed in Table 2.
The evaporation temperature T o and compressor discharge temperature T d were defined as:
T d = T s e t , h e a t i n g + Δ T c d
T o = T s e t , c o o l i n g + Δ T e v
where Δ T c d and Δ T e v were the assumed minimum temperature differences of the secondary side and refrigerant. The inlet temperatures on the secondary sides were calculated in the system model. The outlet temperatures on the secondary sides were set as an input to the heat pump model.
The partial operation of the heat pump was calculated by considering actual loads on the evaporator and condenser. The actual evaporator load was calculated according to the operation mode of the system. The calculation of the actual evaporator load is presented in the next section. The actual condenser load was determined based on the real-time storing capacity of the HWST. The mass flow rate of the water circulating on the condenser side was determined by Equation (7).
m ˙ c = Q ˙ a c t u a l , c d c p , w a t e r Δ T h p
where Δ T h p is the estimated 40 K temperature drop between the condenser inlet and outlet of the condenser. The cooling and heating part loads were defined as the ratios of actual loads to nominal capacities. To consider the load simultaneity between cooling and heating part loads, the highest was chosen as the overall part load via Equations (8)–(10).
p l h e a t i n g = Q ˙ a c t u a l , c d Q ˙ c p , c d  
p l c o o l i n g = Q ˙ a c t u a l , e v Q ˙ c p , e v
p l = max p l h e a t i n g , p l c o o l i n g
According to the technical data from the manufacturer, the actual capacity of the compressors chosen was controlled with step-less capacity control in the 10–100% and 50–100% range for Load 1 and Load 2, respectively [26]. There were no limitations set regarding step regulation or a minimum speed regulation for the part load, hence it was assumed that the compressor can operate at any part load between zero and one. The coefficient of performance (COP) was calculated by Equations (11)–(13).
C O P h e a t i n g = Q ˙ a c t u a l , c d P a c t u a l  
C O P c o o l i n g = Q ˙ a c t u a l , e v P a c t u a l
C O P o v e r a l l = Q ˙ a c t u a l , c d + Q ˙ a c t u a l , e v P a c t u a l
Besides the COP of the heat pump stand-alone, the total coefficient of performance of the system C O P t o t a l , s y s t e m in Equation (14) was also examined to represent the overall annual efficiency of the heat pump-based energy system. Hence, the annual energy input from peak load and storage units was considered.
C O P t o t a l , s y s t e m = E a c t u a l , c d + E a c t u a l , e v + E B T E S + E H W S T E c o m p r e s s o r + E p e a k  

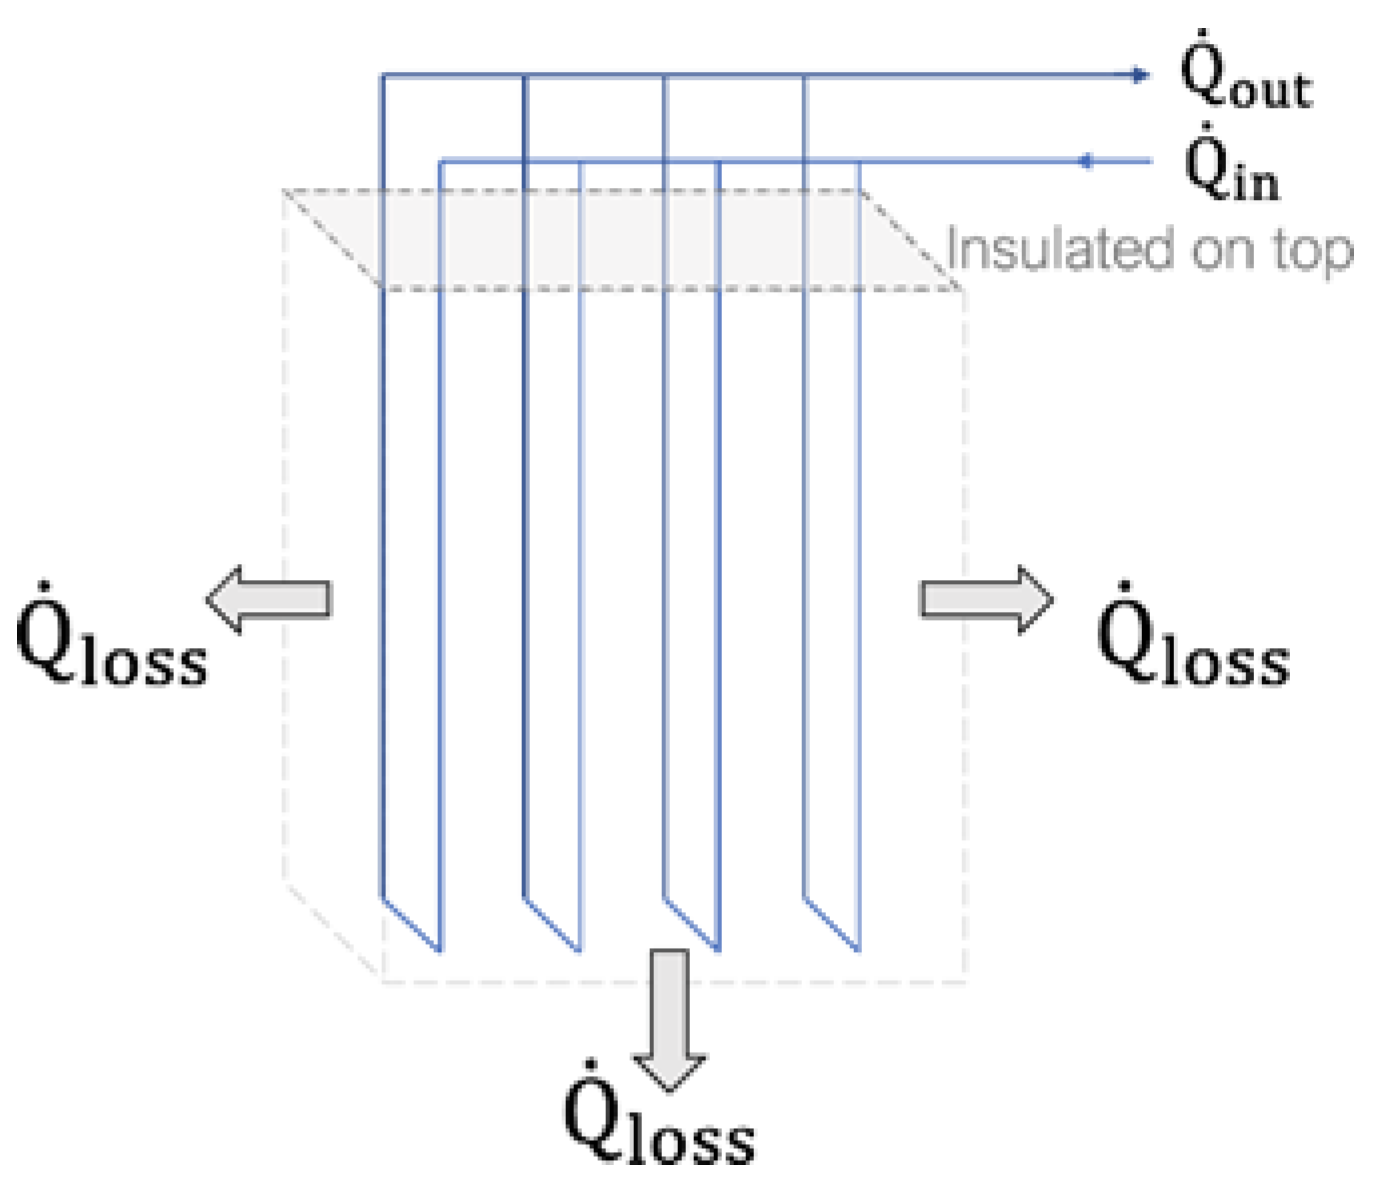
3.2. Borehole Thermal Energy Storage Model

The geothermal energy was extracted from the ground by heat exchangers in vertical boreholes. Several models were developed for heat transport inside and outside the borehole. These models have revealed the importance of the thermal response of ground heat exchangers in design procedures [10,15,17,27,28,29]. Moreover, adequate knowledge of local geology and thermal properties of the ground is demanded to optimize the storage process under various conditions [1,3,4,7,10]. For sizing the borehole configuration, an Energy Earth Designer (EED) evaluation was carried out to assess the thermal properties of the ground and heat carrier fluid in relation to the thermal loads and sizing dimensions [30]. The assessment was performed considering the heat pump evaporation load and annual demands as inputs. Furthermore, input data for ground, borehole, and heat carrier fluid properties were considered. Inputs for the ground were thermal conductivity, heat extraction rate, and heat capacity. Data for the borehole model consisted of thermal conductivity of single U-pipes and the grout, thickness of the grout, borehole spacing and depth. Moreover, the thermal conductivity, specific heat, and density of the heat carrier fluid were assumed as inputs [31]. The ground properties are assumed from typical values in Norway [32,33]. The thermal properties of the ground are presented in Table 3.
The sizing of the BTES was performed by considering the nominal capacity of the evaporator and heat extraction rate per meter from the ground to calculate the total length of boreholes using Equation (15).
L t o t a l , b o r e h o l e = Q ˙ c p , e v Q ˙ g  
The number of boreholes was then decided by dividing the total length of effective boreholes by the chosen length for the boreholes. The BTES configuration was modelled as a control volume using a deterministic dynamic approach. The main parts of the BTES were single U-tube pipes, the borehole with filling material, and the surrounding ground. To simplify the geometry of the borehole field a square configuration was considered. A control volume approach presented in Figure 4 was used for the thermal model of the borehole storage. The physical boundaries of the BTES were set by considering a 10-m distance from the borehole field’s outermost layer to the undisturbed ground on the bottom and sides. The upper boundary was assumed to be insulated and located one meter below the ground. Ferrantelli et al. investigated the surface boundary conditions of boreholes. They concluded that the surface temperature effect is more significant for lower depths up to nearly one meter [34].
Equation (16) represents the thermal energy flow balance used to model the system. The term Q ˙ l o s s e s takes the thermal conductivities of heat carrier fluid, U-pipe, grout, and soil into account as series equivalent.
d E b o r e h o l e d t = Q ˙ i n Q ˙ o u t Q ˙ l o s s e s  

3.3. Thermal Storage Tank Model

Using an HWST in the system often makes the operation of the integrated heat pump system to be controlled and optimized simpler [4]. HWSTs can be separated into two categories based on the utilization purpose. The first category is the tank that intends to reduce or dampen the disturbances from one unit to another. The other category of the tank intends to provide independent operation for a part of the system from heat pump operation [35]. The role of HWST in the present study is to enable the supply of heating energy independent of heat pump operation. The sizing approaches of the HWSTs addressed in the literature are diverse. Depending on the usage profile and composition of the energy system different methods can be adopted [36,37,38]. Design guidelines consider a unit of storage volume per kilowatt of energy input depending on the source type. For the heat pump, it is usually considered 20–30 L/kW. The volume of the HWST used in this study was calculated based on the expected maximum energy coverage of the HWST in Equation (17):
V H W S T = Q ˙ h e a t i n g   s y s t e m , d e s i g n ρ c p Δ T m a x  
where Q h e a t i n g   s y s t e m , d e s i g n is the design heat rate. The design heat rate was chosen to correspond to the highest heat demand for 90% of the hours of a year. The design heat rate for Load 1 and Load 2 was 60% and 90% of the maximum heat demand, respectively.
HWST was modelled by dividing the water in the tanks into two identical horizontal sections. These sections were assumed to have a uniform temperature with the inlet and outlet of the tanks at the tank top and bottom. Internal heat exchange between the sections was neglected. Thermal stratification was simplified by assuming a maximum 40 K temperature difference between two sections and linearly reducing when the temperature at the upper section falls below 60 °C [39,40]. The thermal energy balance in the tank was calculated by summation of the ins and outflows and heat losses to ambient due to conduction. A constant overall heat transfer coefficient of 0.22 W/m2∙K between the HWST and surrounds was assumed. The energy balance is presented in Equation (18):
d E H W S T d t = Q ˙ a c t u a l , c d Q ˙ h e a t i n g   s y s t e m Q ˙ l o s s e s  

3.4. Substation Model

The substation model for the heating system in this study was developed by considering heat supply from the hot water tank with district heating acting as the peak load covering unit in Equation (19):
Q ˙ h e a t i n g   d e m a n d = Q ˙ H W S T + Q ˙ p e a k  
Peak load kicks in when the temperature of the water from the hot water tank drops below 50 °C and/or when the tank heat rate does not cover the required heat rate. A maximum of 40 K temperature drop in the heating system was assumed to estimate the mass flow rate in the heating system. The substation model for the cooling system was similarly developed by considering a maximum 5 K temperature gain from the cooling system to calculate the flow rate in the cooling system.

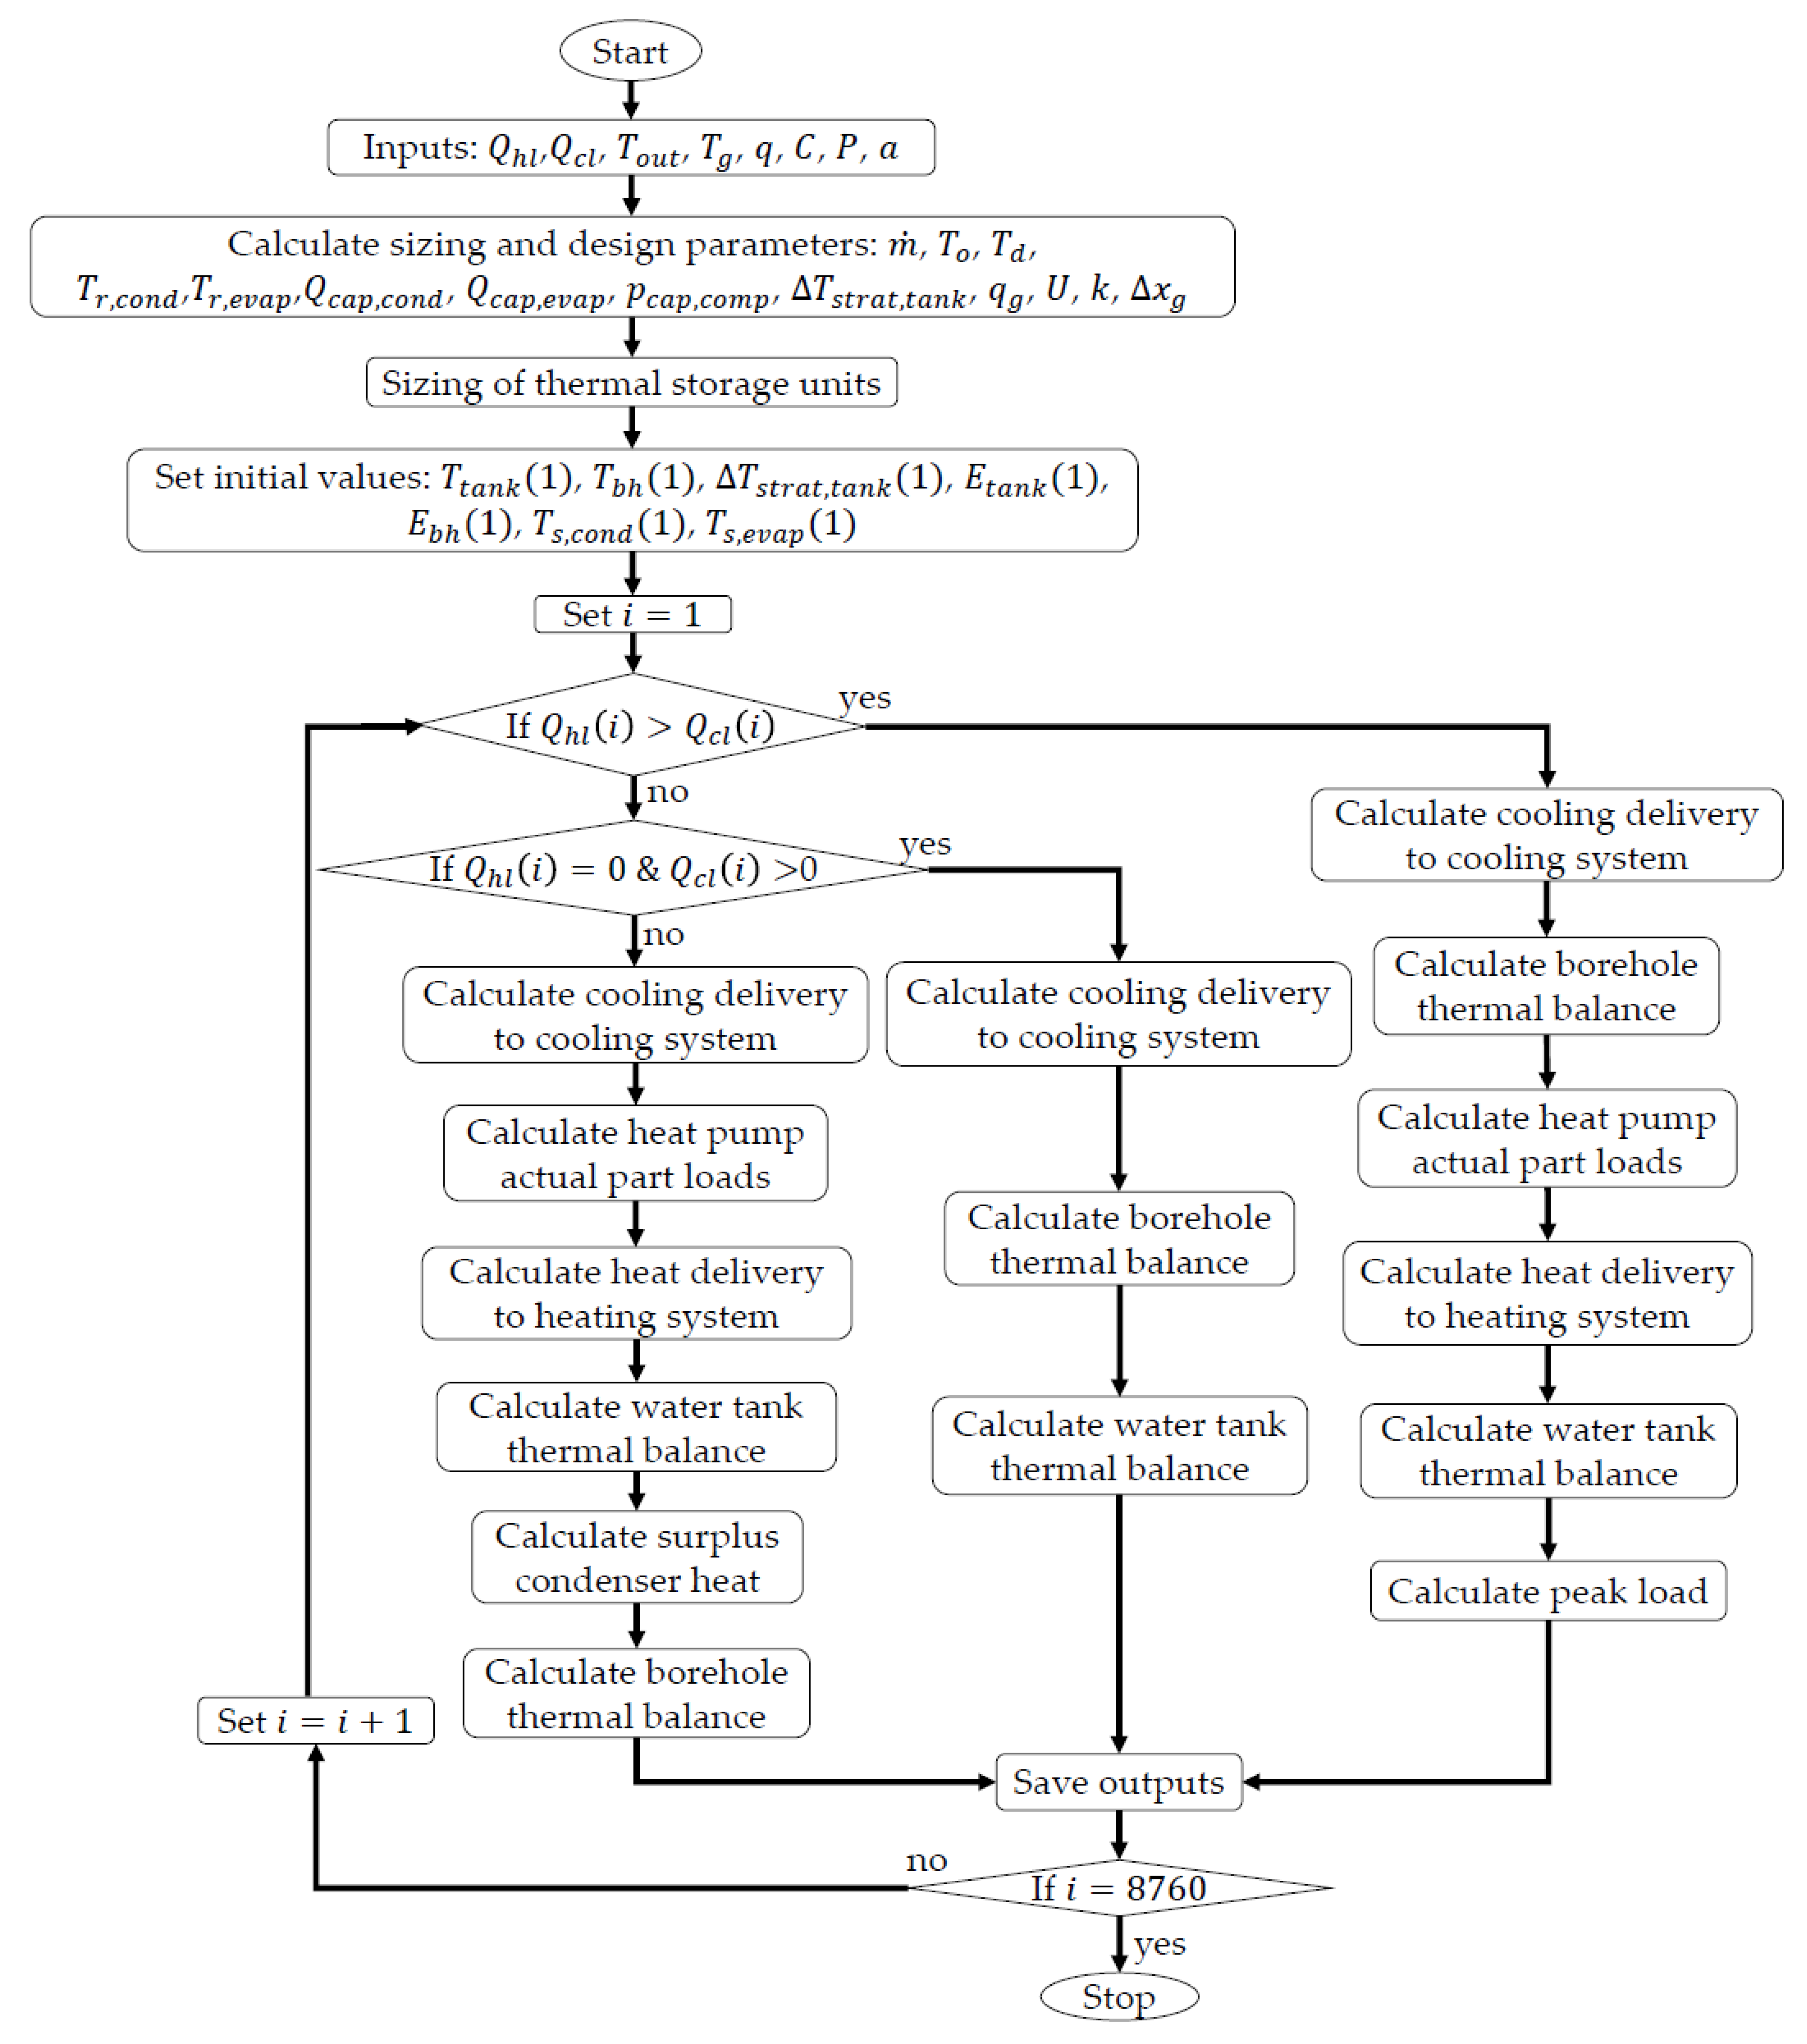
4. Integrated System Model

The models of the system components were connected to establish the dynamic model of the integrated heating and cooling system that was described in Section 2. Heating and cooling loads, as well as heat pump operating temperature range and performance coefficients, were provided as input for simulations. Since the heating and cooling loads were provided on an hourly basis, the model was discretized on an hourly basis. Distribution heat losses and hydraulic components were not considered in the model. The energy system had three operating modes depending on the heating and cooling demands.
Heating mode: The system operates in heating mode when the heating demand is larger than the cooling demand. The heat pump extracts energy from the ground. The BTES were used as a heat source for the heat pump. The actual evaporator load was calculated from the borehole extraction heat rate. The return brine from the evaporator was sent to the cooling system. The condenser heat was sent to HWST. Figure 5 shows the system connections of this mode.
Cooling mode: The system operates in cooling mode when the cooling demand is larger than the heating demand. The heat pump is connected to the cooling system as a heat source. Therefore, the actual evaporator load was considered based on the cooling demand. The condenser heat rate in this mode is higher than the heating demand. Depending on the energy level of the HWST there could be a surplus heat on the condenser side of the system. The ground acts as a heat sink where the excess condenser heat was delivered to the BTES. Figure 6 shows the system connections of this mode.
Free cooling: The system operates in free cooling mode when the heating demand is zero. The heat pump in this mode is off. The only flow of energy is from the cooling system to BTES. Figure 7 shows the system connections of this mode.
The flow chart shown in Figure 8 depicts the implementation of the data in each operation mode. The process starts by importing the hourly heating and cooling loads, outdoor temperature, ground initial temperature, and coefficients for heat pump equations to calculate design parameters such as mass flow rates, heat pump temperatures and capacities. Meanwhile, the BTES design parameters including ground extraction rate, heat transfer coefficients, and borehole distancing are sized and imported from the Energy Earth Designer software. The annual simulation process starts by setting the initial values. An “if” condition loop distinguishes between the operation modes described above. In all modes, first, the cooling load side is processed. In heating mode, the BTES thermal balance is checked after cooling demand is supplied for regulating the actual heat pump part loads. Then the heating side is simulated starting with the calculation of supply source composition. In this stage, the thermal balance of the HWST is checked to assess the required peak load. In cooling mode, after cooling delivery the heat pump actual loads are calculated. The heating side is then calculated similarly to the cooling mode except that the surplus condenser heat is also calculated in the cooling mode. Finally, the thermal balance at BTES is processed. In free-cooling mode, after cooling delivery the thermal balance of BTES and HWST is simulated. The “if” condition is applied every hour for a year and the data is stored on each iteration. For long-term simulation, at the beginning of each year, the variables and initial values are updated.

5. Sizing and Performance Analysis

The response of the system model to changes in the design parameters was studied by a One-At-a-Time sensitivity analysis. The sensitivity analysis was performed to assess the impact of the selected series of parameters on the sizing and performance outputs of the system [41,42,43]. The sizing variables considered for investigation were volume, total effective length, and maximum heat extraction rate of BTES as well as the energy coverage rate of HWST. The performance indicators considered were C O P o v e r a l l and C O P t o t a l , s y s t e m . A 20% increase and a decrease were applied to the parameters listed in Table 4 to assess the impact of each parameter on the targeted sizing and performance variables. The changes were applied to one parameter at a time. The only exception was the heat pump performance coefficients which were changed by 10% because of the valid capacity range of the chosen heat pumps.

6. Results

The result of this study is presented in three parts. First, the model described in previous sections was tested on both Load 1 and Load 2 to reveal the main annual performance characteristics of the system. Then the result of the sensitivity analysis is reviewed. Finally, the performance analysis of the 10-year operation of the system is presented.

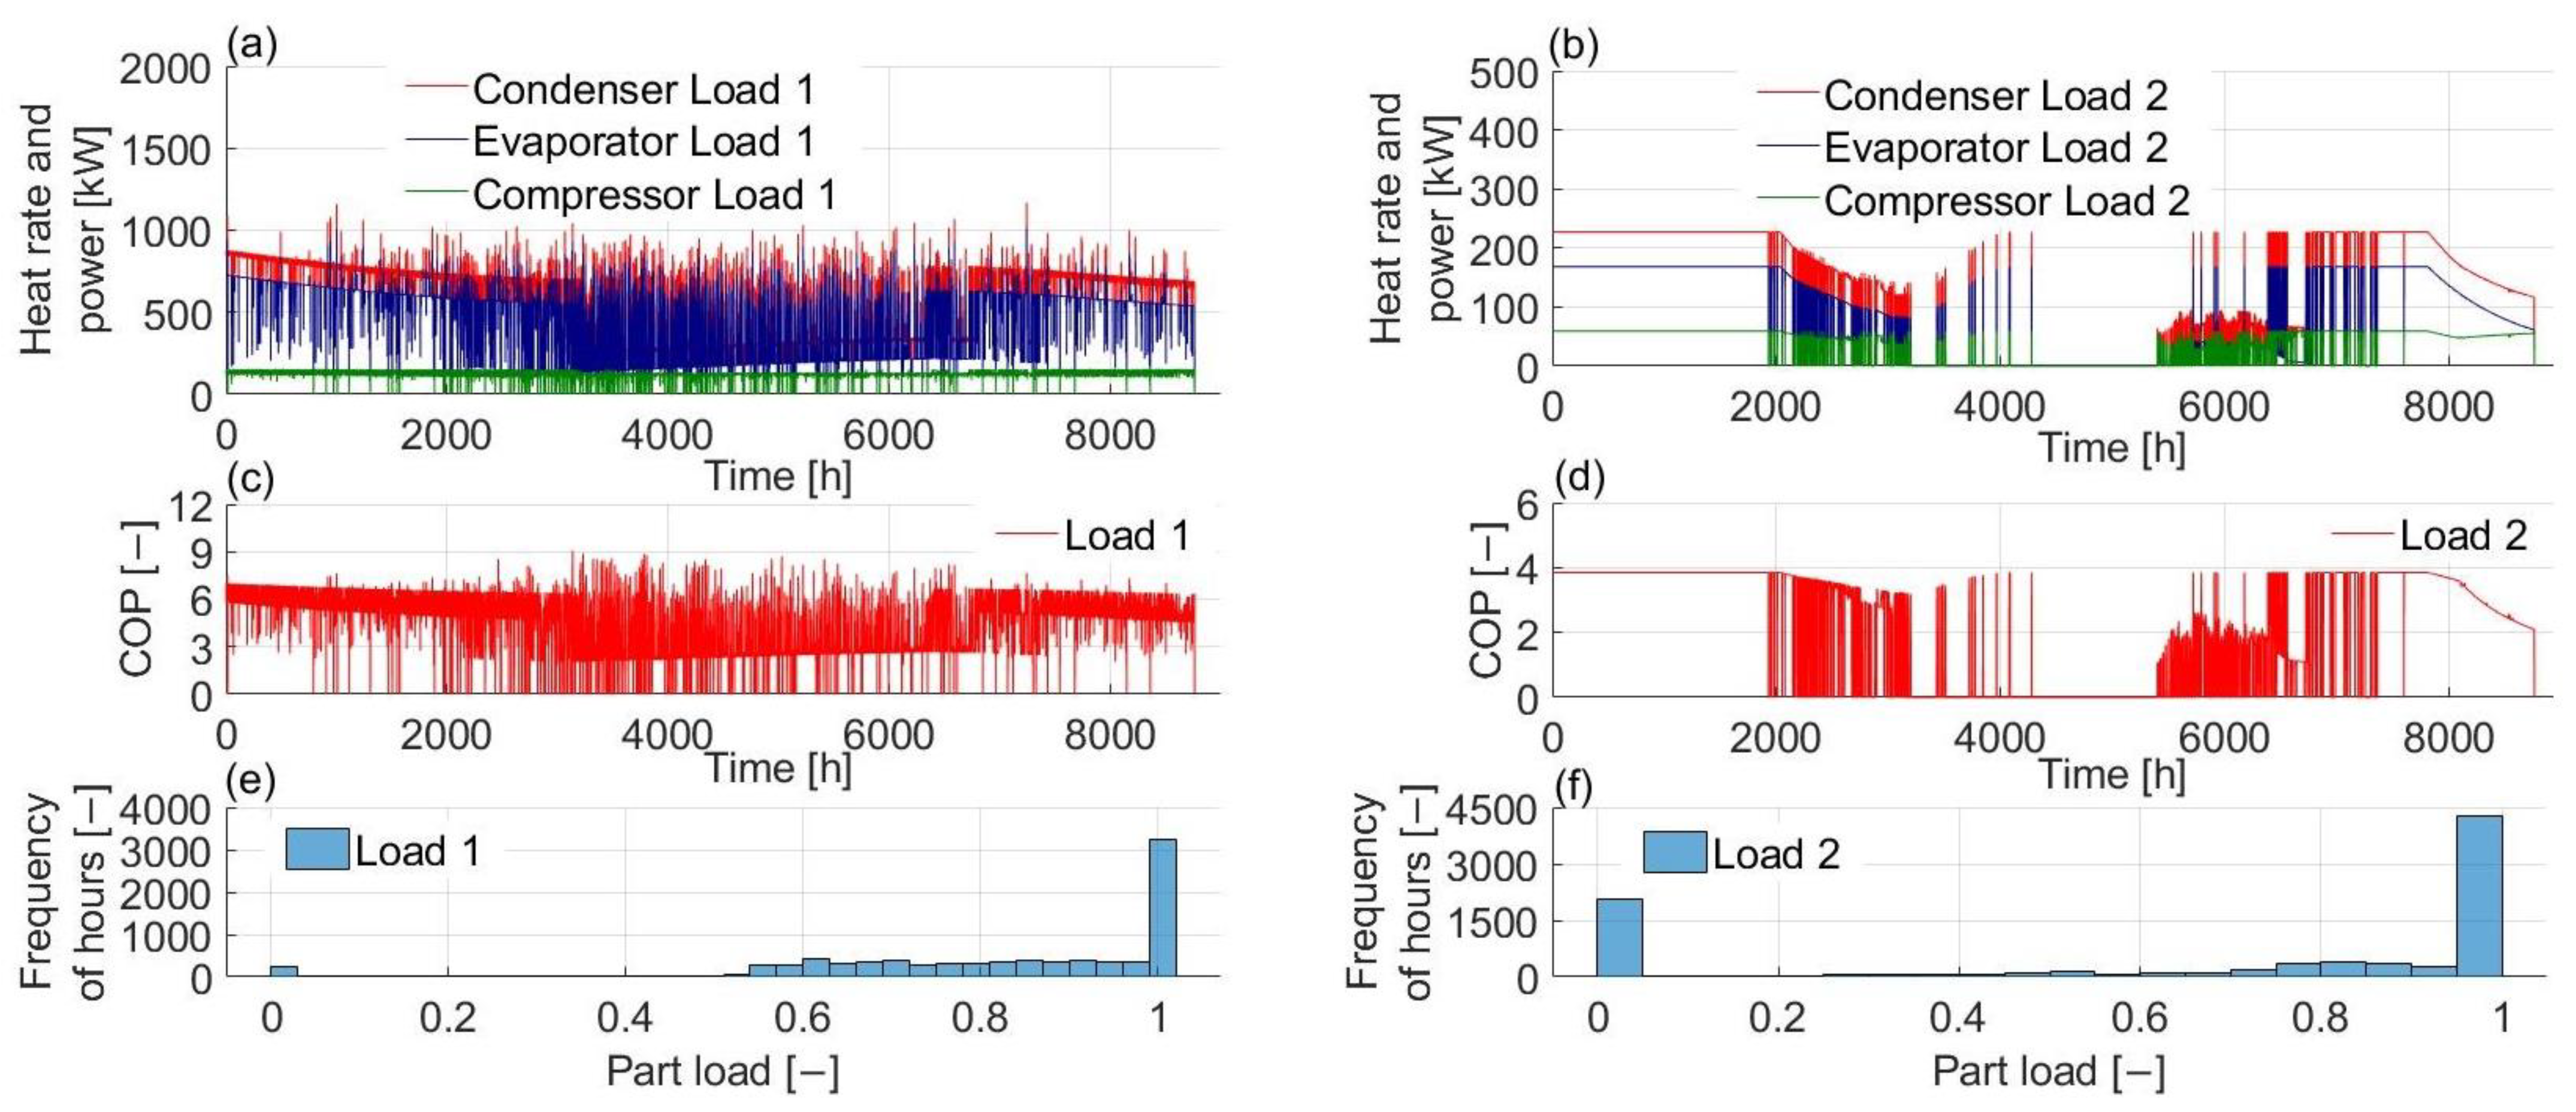
6.1. Annual Performance Analysis

The initial temperature of BTES and HWST was set to 8.5 °C and 40 °C, respectively. The overall results of the test on Load 1 and Load 2 for a one-year operation are summarized in Table 5.
C O P t o t a l , s y s t e m Figure 9 shows the hourly thermal performance of BTES in a one-year operation. Generally, temperature oscillations of Load 1 were less than Load 2. This could be due to the presence of cooling demand throughout the year. In the first 3000 h and last 2500 h of the year, the system was operating mostly in heating mode. Therefore, the BTES temperature was decreasing due to heat extraction from the ground. In cooling mode operation with Load 1 BTES was charged with surplus heat from the condenser. However, due to generally high heat demands, as well as a large HWST volume and undersized heat pump, with BTES charging in cooling mode operation with Load 1 the heat injection from that source was not enough to recover the temperature to the initial level. Cooling demands of Load 2 were supplied only in free cooling mode. Hence, the charging rate and consequent temperature uplift of BTES was higher for Load 2. The heating mode operation of Load 2 was characterized as the heating only condition. Therefore, in this mode BTES was not charged by heat gain from the cooling system. As a result, the heat extraction rate in heating mode in Load 2 was higher than Load 1.
The energy balance of the low-temperature side of the system on a monthly scale in Figure 10 shows the magnitude of the energy flows. For Load 1, in the first four months as well as the last three months, evaporator load was more than cooling demand because of the higher load on the condenser. On the other hand, in the rest of the year, higher cooling demand and surplus heat of the condenser recovered the BTES energy levels to positive. For Load 2, in the first and last third of the year when the system was operating in heating mode, the heat rate of BTES was minus and in the second third the cooling system injected energy into the BTES.
The hourly performance of HWST is given in Figure 11. For Load 2 the temperature drops to 40 °C in less heat demanding hours while for Load 1, due to less operation time in free cooling mode, charging was performed for more hours. For both Load 1 and Load 2, the cumulative charge and discharge rates were identical which indicates the energy balance of the component.
The monthly combination of heating energy supplied to the heating system is shown in Figure 12. HWST was able to cover a maximum of 75% and a minimum of 45% of the monthly demand for Load 1. In warmer months due to lower accumulated energy in the HWST, peak load contribution was higher. For Load 2, due to the operation of the system for several consecutive hours in free cooling mode, the HWST was not charged sufficiently to cover the demands of the 6th and 7th months while for the rest of the year the water tank covered between 55% to 92% of the monthly heat demand.
The actual loads on evaporator and condenser as well as actual compressor power are shown in Figure 13. The effect of BTES temperature with Load 1 on the heat pump actual loads and consequently COP is evident. As the temperature of BTES was decreased the heat pump performance was decreased with the same trend. Given the size of the heat pumps chosen for the system, the heat pump operated in full load for most of the year. The lowest partial operation hours were mostly in heating mode. This could be due to reducing the BTES heat extraction capacity and the high charging capacity of the water tank. For Load 2, in the heating mode operation, the heat pump operated with full capacity for the first part of the year. In the last 1000 h of the year, when operating in heating mode, the performance of the heat pump sharply decreased because of the low BTES temperature.

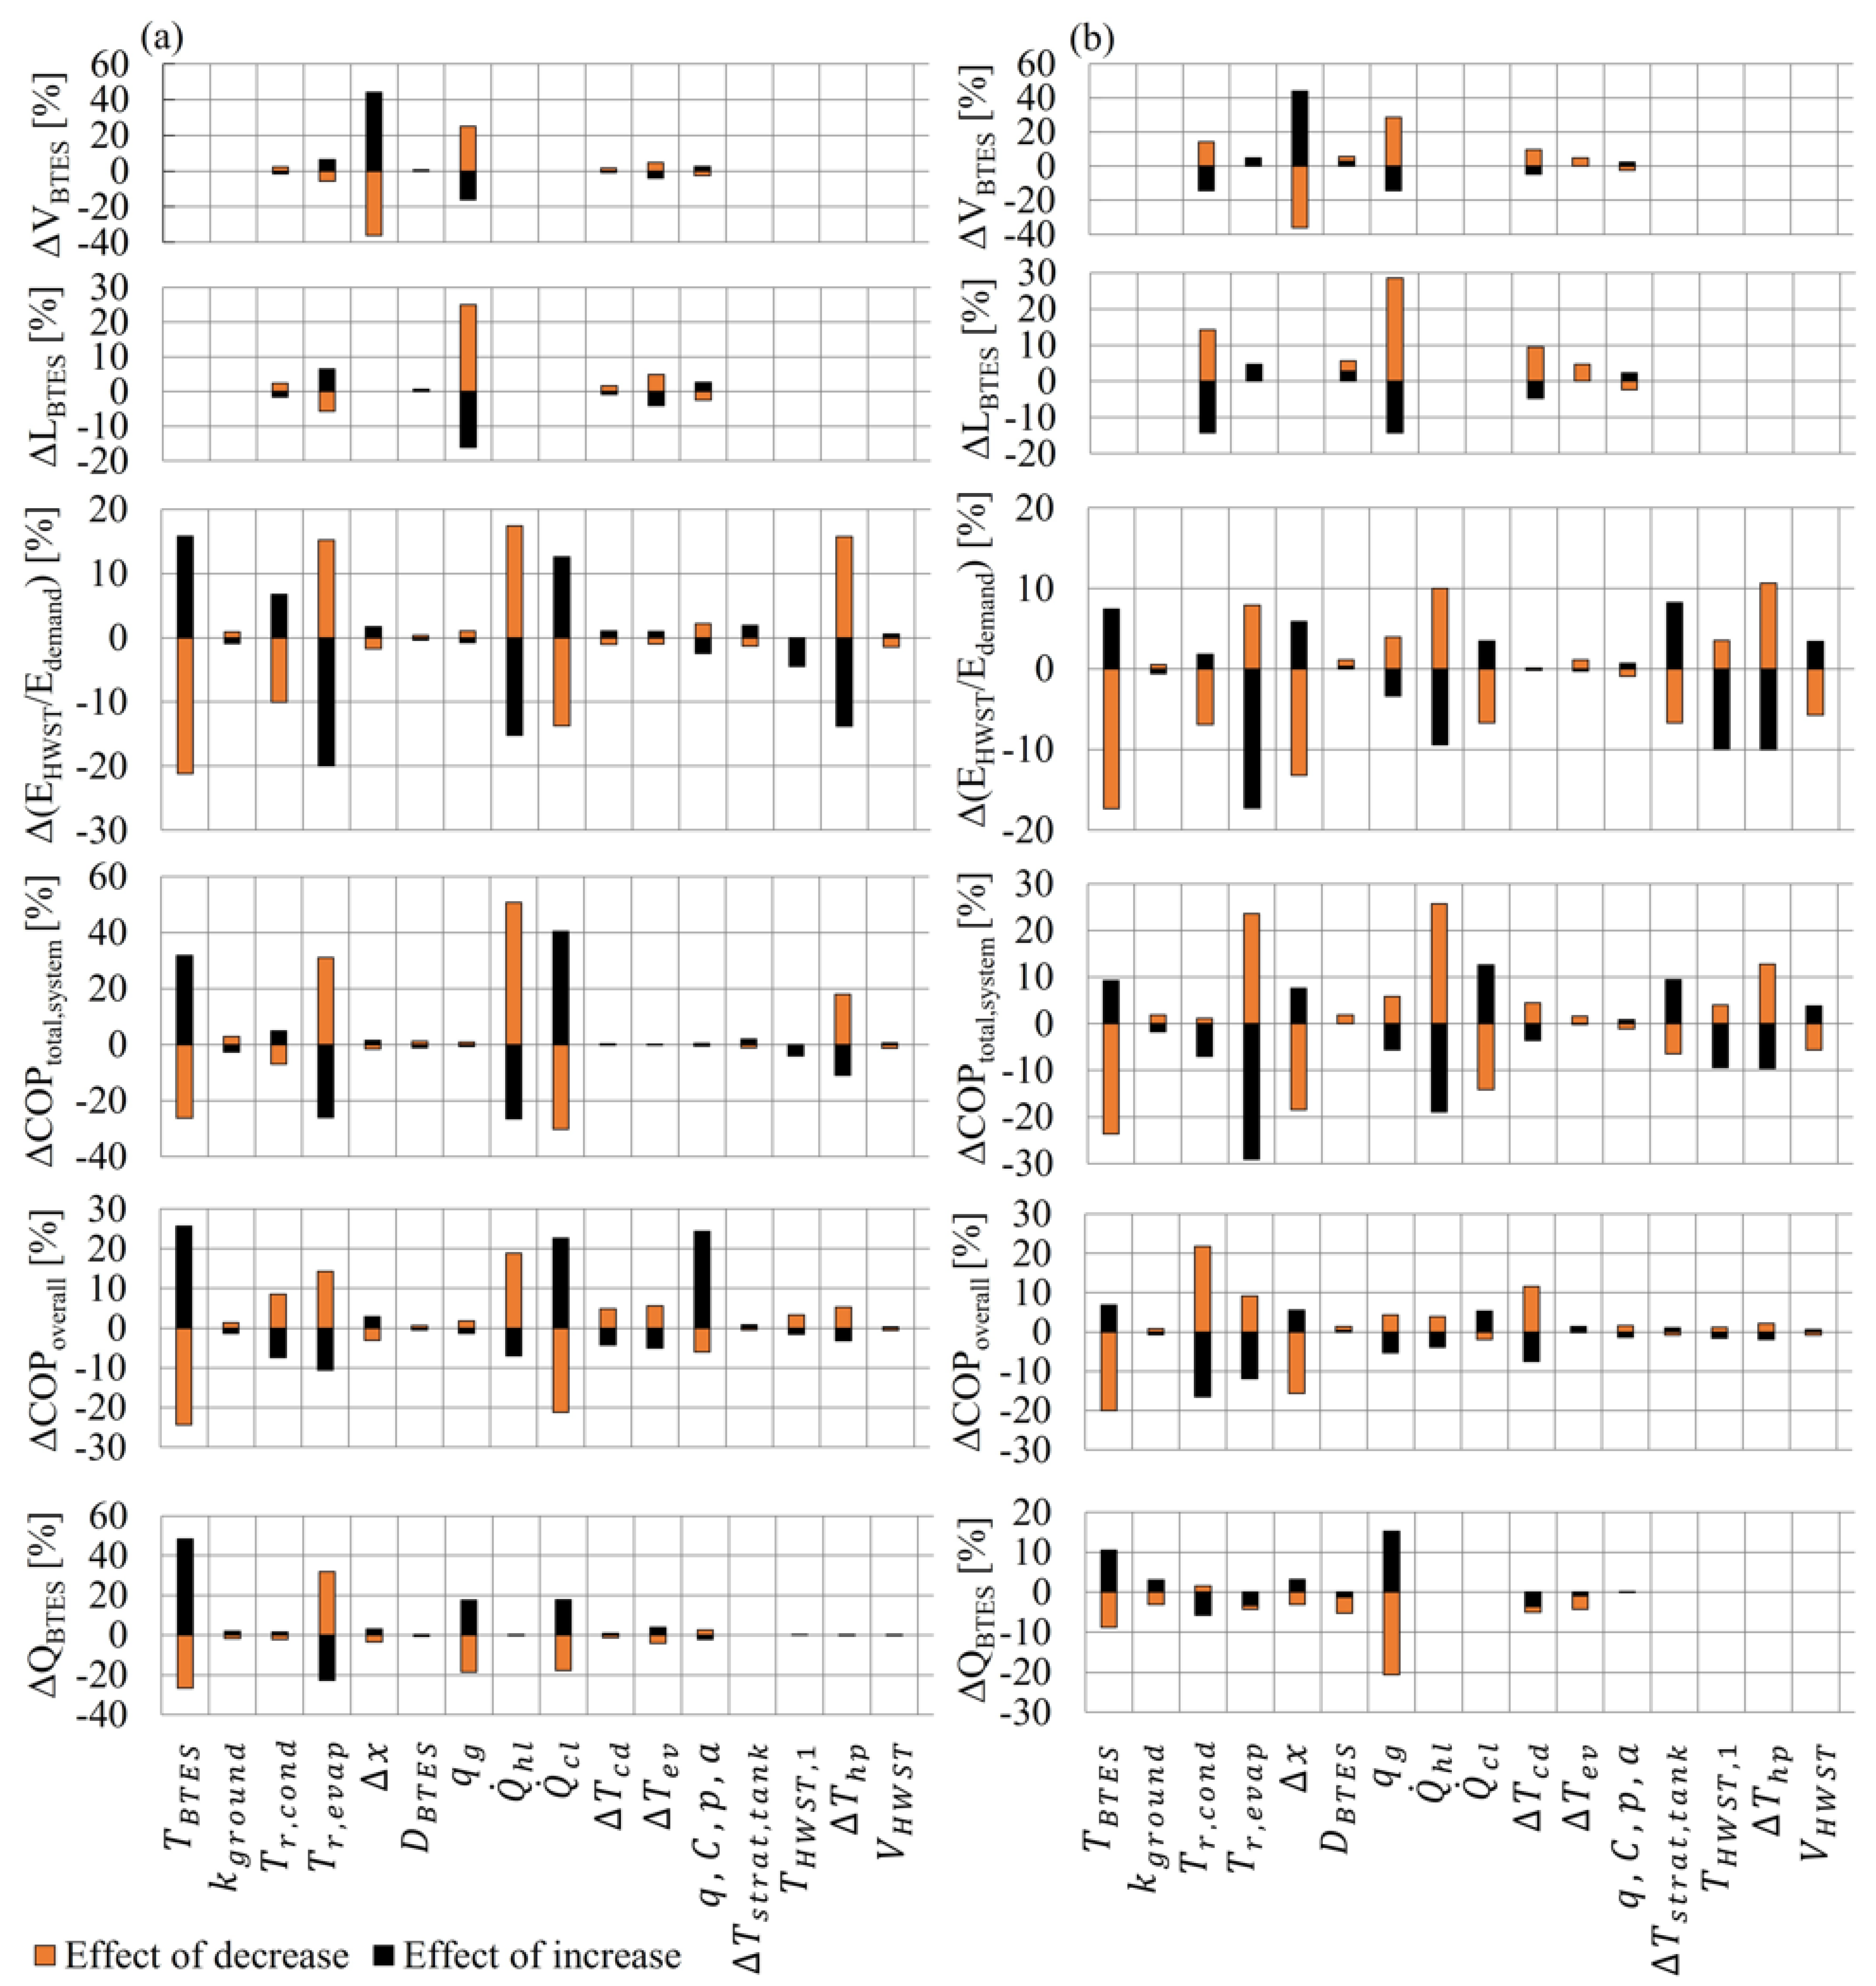
6.2. Sensitivity Analysis

The influence of one-at-a-time changing of 16 parameters on six sizing and performance values is depicted in Figure 14a for Load 1 and Figure 14b for Load 2.
Among the tested parameters, only the impact of borehole pipe distances and the ground heat extraction rate on the volume of BTES were considerable. Temperature setpoints for the secondary sides of the heat pump together with the heat pump design parameters Δ T c d ,   Δ T e v and the performance coefficients, had a smaller effect on the volume of BTES.
The dependence of the effective length of the borehole pipes on the ground heat extraction rate was the only significant uncertainty for both Load 1 and Load 2. However, for Load 2 the temperature of the water at the condenser side and Δ T c d caused approximately 10% change in the total length of the borehole. The reason behind this dependency was found in the change in the evaporator operation regime that resulted in a change in the size of BTES. The influence of other parameters such as evaporator secondary side temperature setpoint, depth of boreholes, Δ T e v , and heat pump performance coefficients were relatively insignificant.
The initial temperature of BTES, the water temperature at the condenser side, demand magnitudes, and temperature difference at the condenser side on the total amount of heating energy covered by HWST were the most sensitive design parameters of HWST operated with Load 1. HWST coverage was affected by more parameters for Load 2. Due to the utilization of a smaller HWST unit and therefore being more prone to thermal disturbance thermal stratification, the volume of the HWST, and the initial temperature of HWST, the heat coverage of Load 2 changed by nearly 10%. Borehole pipe distances and water temperature at the evaporator side had a larger impact on HWST energy coverage for Load 2 compared to Load 1. The reason for this change was the effect of these parameters on the BTES extraction rate and the condenser actual load. Unlike Load 1, due to non-overlapping energy thermal demand profiles for Load 2, the impact of change in cooling demand and water temperature at the condenser side was less significant.
Changes in both heating and cooling demands, the water temperature at the evaporator side, initial temperature of BTES, and the temperature difference at the condenser side had the largest impact on C O P t o t a l , s y s t e m for both Load 1 and Load 2. For Load 2, borehole pipe distance, water tank stratification, and initial temperature of the water tank had a considerable impact on C O P t o t a l , s y s t e m .
The initial temperature of BTES, magnitudes of demands, and heat pump performance coefficients had the strongest impact on C O P o v e r a l l for Load 1. Regarding Load 2, the initial temperature of BTES, the water temperature at the evaporator and condenser sides, borehole pipe distance, and Δ T c d were the most impactful parameters.
The maximum heat extraction rate per meter from BTES was affected by changing the initial temperature of BTES, the water temperature at the evaporator side, the ground heat extraction rate, and the cooling demand for Load 1. However, for Load 2 only the impact of the initial temperature of BTES and the ground heat extraction rate were significant, while ground conductivity, the water temperature at the evaporator and condenser sides, Δ T c d ,   Δ T e v , borehole pipe distances, and depth of borehole pipes had a minor impact.

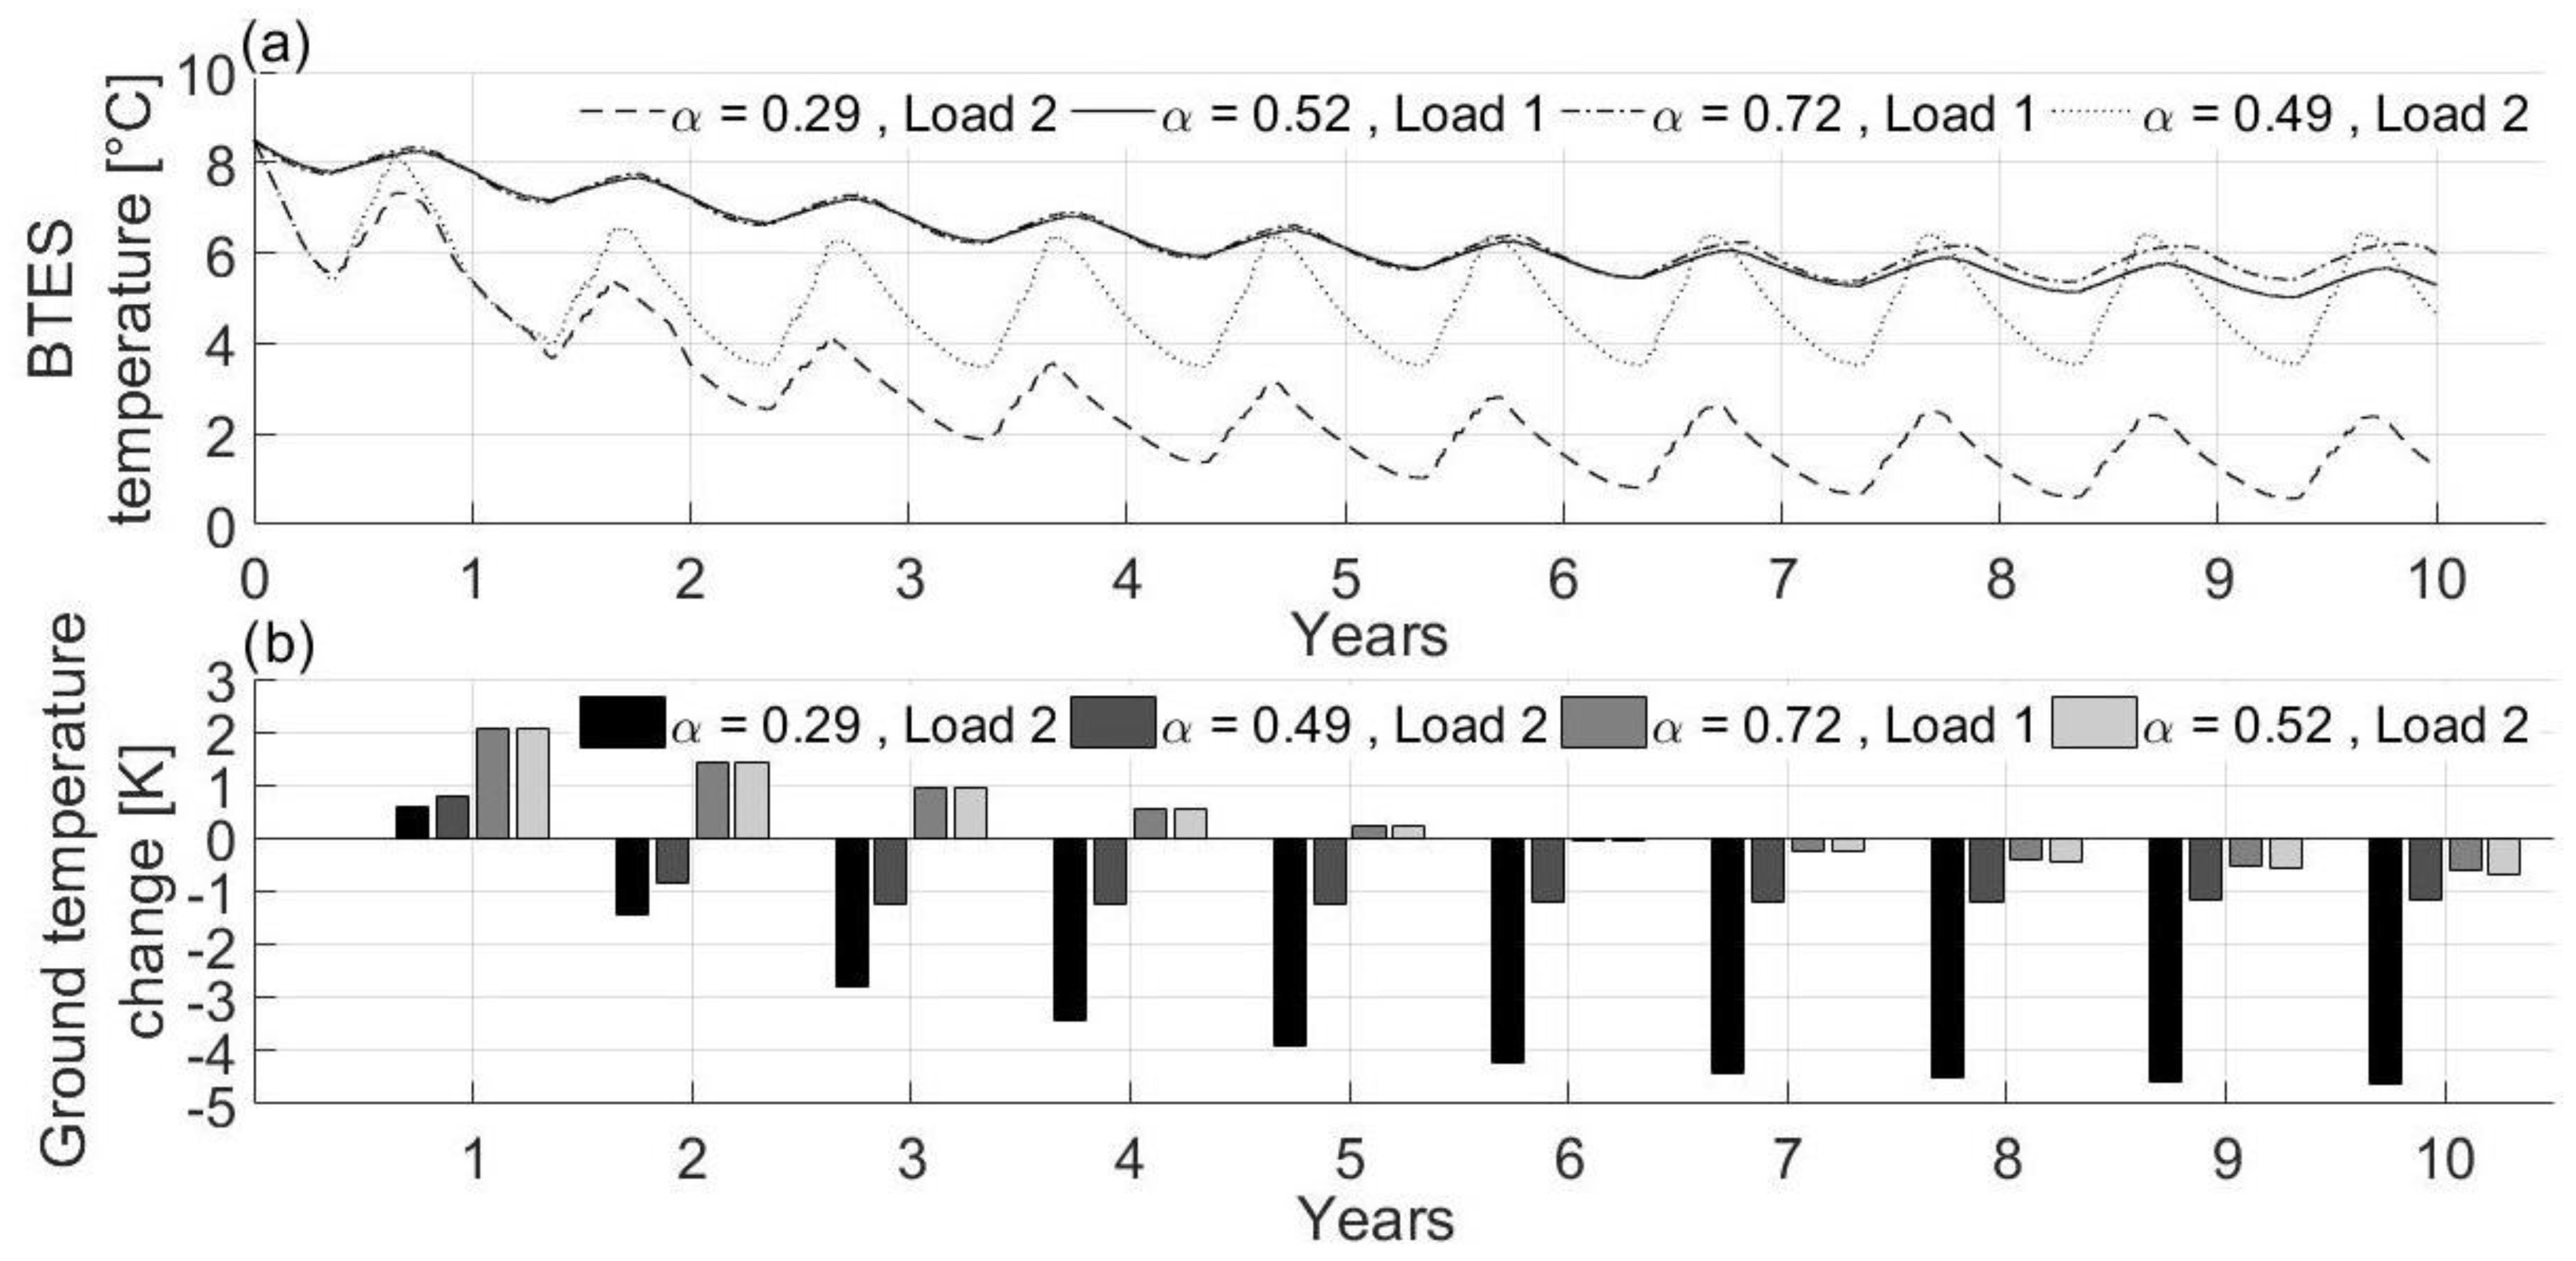
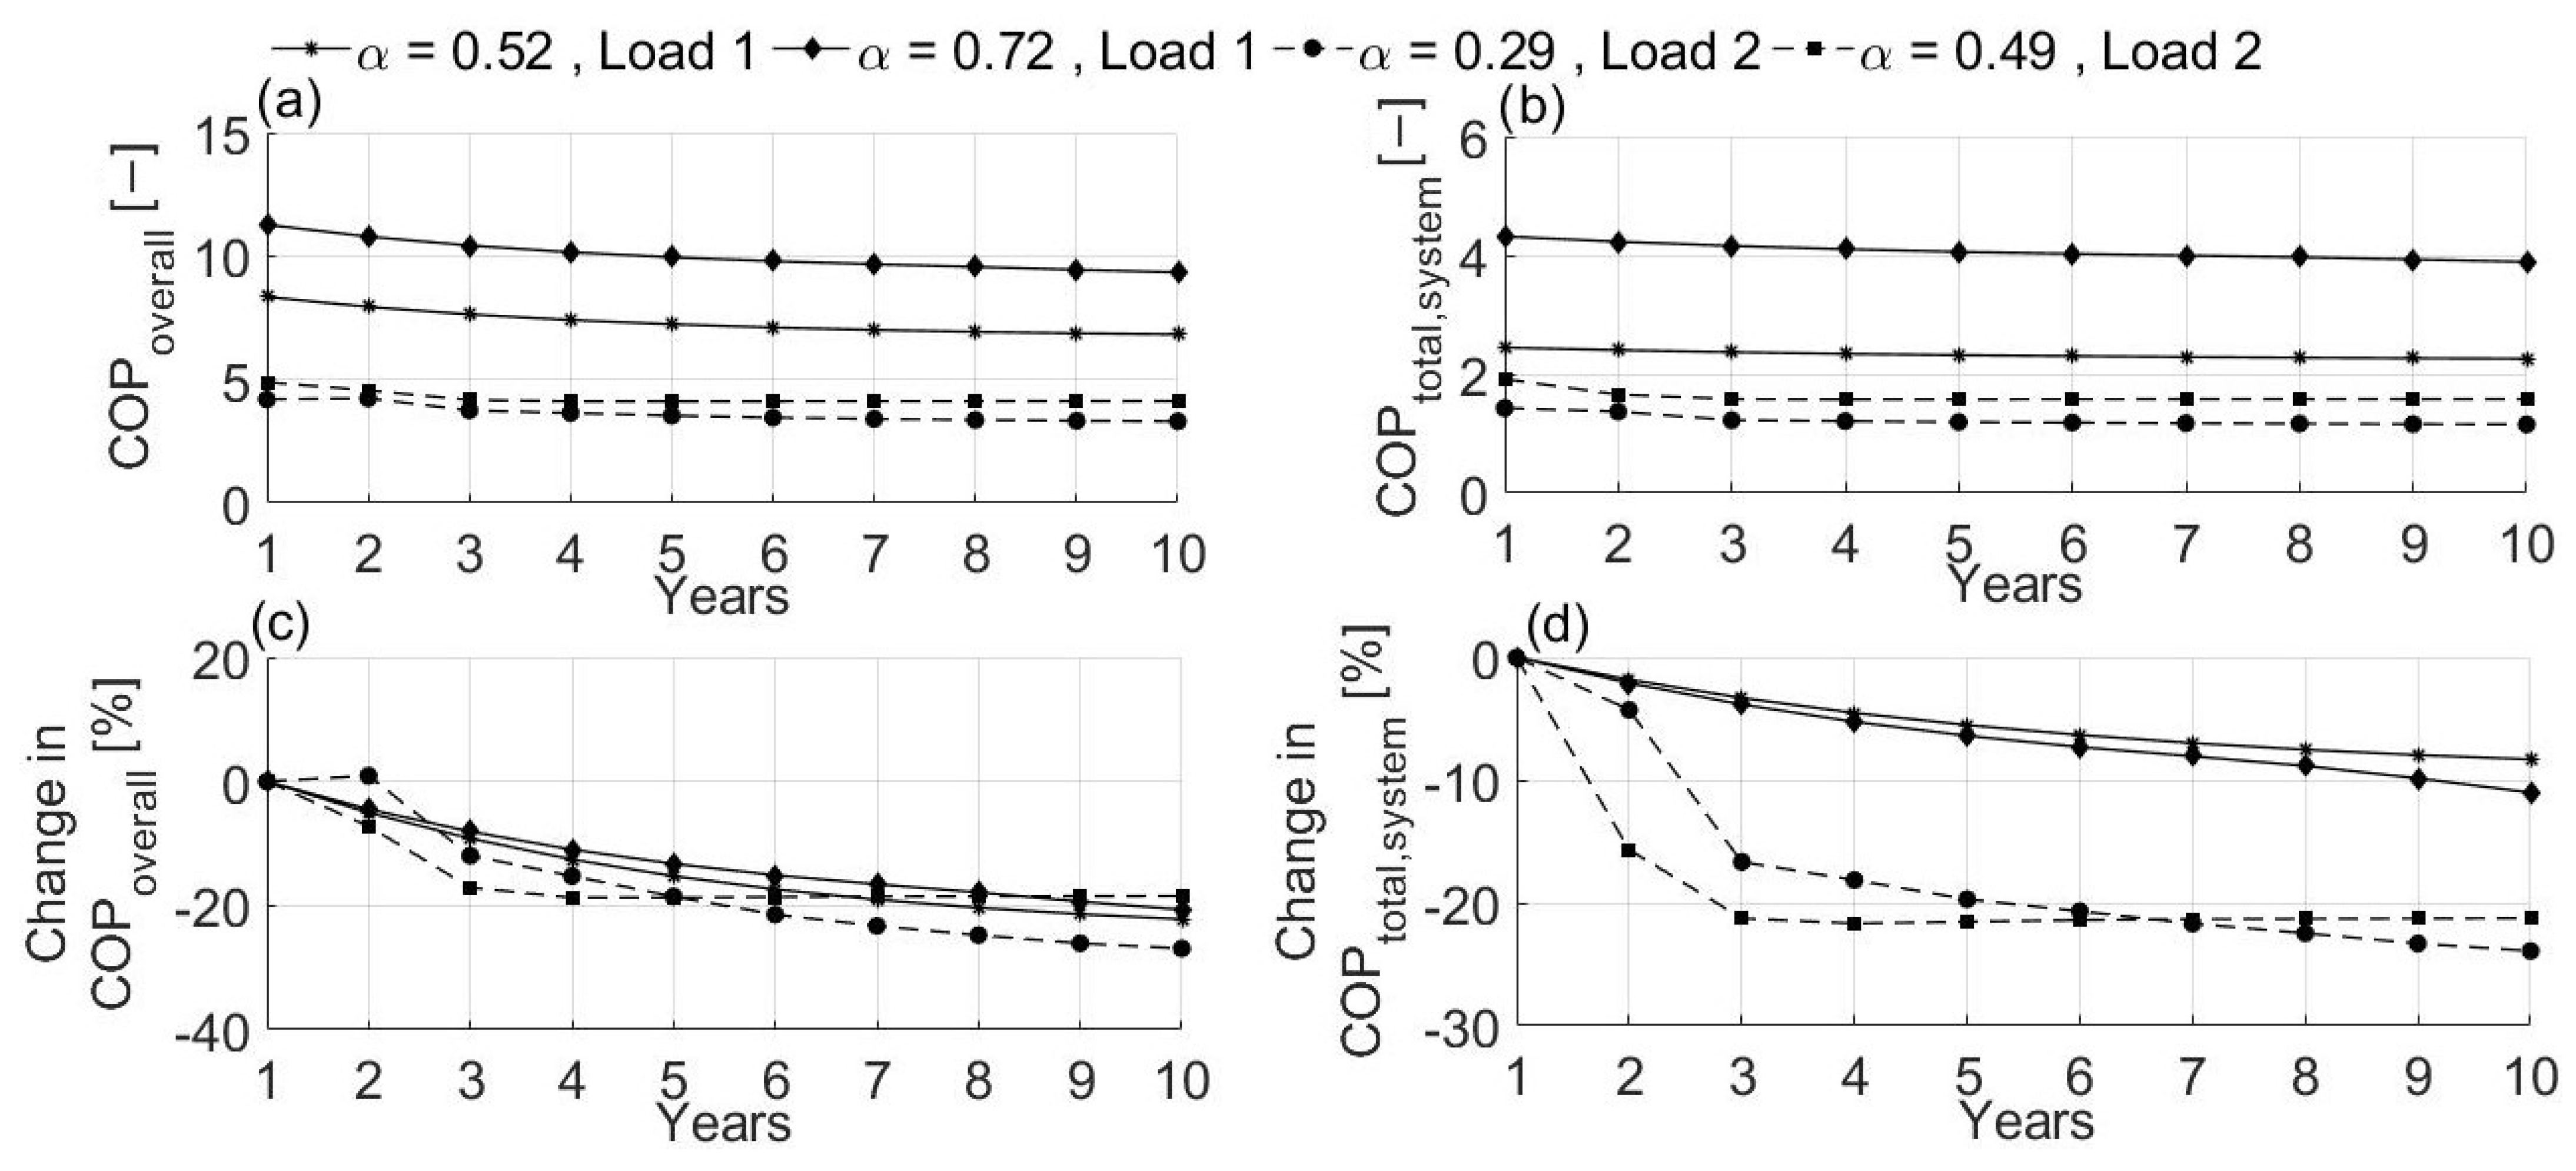
6.3. Long-Term Operation of the System

The projection of the operation of the system in 10 years was simulated to analyze the long-term performance of BTES. The simulation was performed on both users Load 1 and Load 2 under the same design conditions for all the components. Besides the base-case loads with α value being 0.52 for Load 1 and 0.29 for Load 2, the simulation was done for an alternative scenario with an increased α value of 0.20 for both Load 1 and Load 2.
As shown in Figure 15, for the base-case loads, the temperature of BTES decreased for approximately 6 years before reaching a stable annual evolution. This period decreased for the alternative cases to less than 5 years for Load 1 and almost 3 years for Load 2. The impact of the increase in cooling to heating load ratio on ground temperature changes showed that with an increased α the temperature of the ground was less reduced.
System performance coefficients are shown in Figure 16. The simulation with Load 1 resulted in a constant decrease in C O P o v e r a l l and C O P t o t a l , s y s t e m up to 20% and roughly 10%, respectively. The 10-year operation with Load 2 showed a 26% and 18% reduction of C O P O v e r a l l , while, the rate of change after the sixth year with   α = 0.29 and the fourth year with   α = 0.49 was insignificant. Reduction in C O P t o t a l , s y s t e m for Load 2 was also evident. With   α = 0.29, the C O P t o t a l , s y s t e m constantly decreased by up to 23% after the tenth year while with   α = 0.49 the reduction nearly stopped after three years with a 21% reduction.

7. Discussion

The model presented in this study was aimed at the analysis of the sizing and thermal performance of cooling and heating building energy systems. The focus was on the annual and 10-year study of the system with hourly time intervals. Therefore, some affecting aspects such as hydraulic flow distribution and control as well as the detailed structural design of components and distribution losses were not presented. The model was tested for two distinct combinations and magnitudes of thermal loads. Results of the annual analysis reflected the expected thermal energy supply performance of the system within an acceptable range. Sensitivity analysis showed the parameters which affected the sizing and performance of the system the most. Ground properties were found to be an important factor for the volume and effective length of boreholes. Temperature setpoints of heat pumps together with the intensity of thermal demands had a large impact on the water tank heat coverage ratio. For Load 2 with the lower total annual demands, the HWST energy coverage and C O P t o t a l , s y s t e m were more influenced by the HWST design parameters such as thermal stratification and volume. Changing the initial temperature of the BTES largely affected C O P o v e r a l l , thereby indicating the dependence of the system operation on the BTES temperatures. The temperature levels of heat pump refrigerant had a small effect on C O P o v e r a l l , while the water temperature set points had a larger impact. For Load 2 with a smaller BTES size, the effect of the borehole pipe distances was more significant due to increased heat loss. The effects of changing cooling load, the ground heat extraction rate, the initial temperature of the BTES, and the cooling brine temperature set point were considerable on the annual energy extracted from BTES. Further investigation of the 10-year operation showed that with a smaller cooling to heating ratio, the ground temperature would decrease more and consequently the C O P o v e r a l l and C O P t o t a l , s y s t e m would decrease in the long term. Higher heat rate extracted from the cooling system together with a lower load on the evaporator in the heating mode would induce higher available surplus heat and thereby improve the temperature profiles.
One of the limitations of this study is that typical ground conditions in Norway were used, while ground properties vary with locations. For specified cases with detailed ground property data available, it is suggested to substitute the available data with these typical values in the proposed models, whereby more convincing results can be achieved.

8. Conclusions

Due to the complexity as well as the high installation cost of the integrated cooling and heating energy systems, the sizing and performance analysis of such systems was the designated goal of this study. Sizing approaches for components of a heat pump-based building energy system including heat pump, BTES, and HWST as well as the dynamic thermal energy balance of the system were introduced and implemented in MATLAB. The model was tested for two profiles with completely different energy demand profiles and a sensitivity analysis on the design parameters was applied. Two definitions of the COP were introduced, one for heat pump stand-alone and one considering thermal energy storage units. It was found that the low ratio between cooling and heating loads plays an important role in the long-term performance of the system by increasing the ground temperature reduction rate over the years. In general, efficiency reduction for the smaller system was sharper. However, in the long term, the smaller system could reach the balance sooner than the bigger system. The setpoint temperatures and working temperature range of the heat pump were other sources of the system imbalance. Therefore, as a further study, detailed temperature and exergy analyses at the component level with consideration of the hydraulic aspect of such a system could give a clearer perspective of the performance efficiency of these systems.
In conclusion, the novel contribution of this study is that it provides a general method to support the cost-effective design and operation of integrated heating and cooling systems with heat pumps, as well as short-term and long-term thermal storage, especially for areas with cold climates, like Norway.

Author Contributions

Conceptualization, N.N., M.S., V.E. and T.T.H.; methodology, N.N., M.S., V.E. and T.T.H.; software, M.S. and N.N.; validation, M.S., N.N. and Y.L.; formal analysis, M.S., V.E., T.T.H. and N.N.; investigation, N.N., M.S. and T.T.H.; resources, N.N. and T.T.H.; data curation, N.N., M.S., V.E. and T.T.H.; writing—original draft preparation, M.S., N.N. and V.E.; writing—review and editing, M.S., N.N. and H.L.; visualization, M.S., V.E., Y.L. and N.N.; supervision, N.N. and T.T.H.; project administration, N.N.; funding acquisition, T.T.H. and N.N. All authors have read and agreed to the published version of the manuscript.

Funding

This research was funded by the Norwegian Research project under the EnergiX project for Innovation in industry and business with the title Integrated heating and cooling systems for hospital buildings with the targets for minimum total energy use, the grant number 269327.

Informed Consent Statement

Not applicable.

Data Availability Statement

Not applicable.

Acknowledgments

The authors gratefully acknowledge the support from the Research Council of Norway through the research project Integrated heating and cooling systems for hospital buildings with the targets for minimum total energy use under the EnergiX program. Further, the authors gratefully acknowledge the collaboration with Norconsult AS.

Conflicts of Interest

The authors declare no conflict of interest.

Nomenclature

Variables and Abbreviations
α Cooling to heating ratio (−)
Q ˙ Heat rate (W)
T Temperature (°C)
tTime (s)
P Compressor power (W)
m ˙ Mass flow rate (kg/s)
p l Part load ratio (−)
c p Specific heat capacity (J/kg.K)
E Energy (J)
L Length (m)
V Volume (m3)
ρ Density (kg/m3)
k Thermal conductivity (W/m.K)
Δ x Distance (m)
q g Ground heat extraction rate (W)
D Depth (m)
COPCoefficient of performance
GCHPGround coupled heat pump
GSHPGround source heat pump
GHEGround heat exchanger
HWSTHot water storage tank
BTESBorehole thermal energy storage
Subscript
cpCapacity
evEvaporator
cdCondenser
setSetpoint
hpHeat pump
maxMaximum
gGround
hlHeating load
clcooling load
rReturn
sSupply
stratStratification

References

  1. Soltani, M.; Kashkooli, F.M.; Dehghani-Sanij, A.; Kazemi, A.; Bordbar, N.; Farshchi, M.; Elmi, M.; Gharali, K.; Dusseault, M.B. A comprehensive study of geothermal heating and cooling systems. Sustain. Cities Soc. 2019, 44, 793–818. [Google Scholar] [CrossRef]
  2. Eswiasi, A.; Mukhopadhyaya, P. Critical review on efficiency of ground heat exchangers in heat pump systems. Clean Technol. 2020, 2, 204–224. [Google Scholar] [CrossRef]
  3. Ahmadi, M.H.; Ahmadi, M.A.; Sadaghiani, M.S.; Ghazvini, M.; Shahriar, S.; Alhuyi Nazari, M. Ground source heat pump carbon emissions and ground-source heat pump systems for heating and cooling of buildings: A review. Environ. Prog. Sustain. Energy 2018, 37, 1241–1265. [Google Scholar] [CrossRef]
  4. Shin, D.U.; Ryu, S.R.; Kim, K.W. Simultaneous heating and cooling system with thermal storage tanks considering energy efficiency and operation method of the system. Energy Build. 2019, 205, 109518. [Google Scholar] [CrossRef]
  5. Byrne, P.; Ghoubali, R. Exergy analysis of heat pumps for simultaneous heating and cooling. Appl. Therm. Eng. 2019, 149, 414–424. [Google Scholar] [CrossRef]
  6. Rice, C.K.; Murphy, R.W.; Baxter, V.D. Design approach and performance analysis of a small integrated heat pump (IHP) for net zero energy homes (NEH). In Proceedings of the International Refrigeration and Air Conditioning Conference, West Lafayette, IN, USA, 14–17 July 2008. [Google Scholar]
  7. Sarbu, I.; Sebarchievici, C. General review of ground-source heat pump systems for heating and cooling of buildings. Energy Build. 2014, 70, 441–454. [Google Scholar] [CrossRef]
  8. Lanahan, M.; Tabares-Velasco, P.C. Seasonal thermal-energy storage: A critical review on btes systems, modeling, and system design for higher system efficiency. Energies 2017, 10, 743. [Google Scholar] [CrossRef] [Green Version]
  9. Moradi, A.; Smits, K.M.; Massey, J.; Cihan, A.; McCartney, J. Impact of coupled heat transfer and water flow on soil borehole thermal energy storage (sbtes) systems: Experimental and modeling investigation. Geothermics 2015, 57, 56–72. [Google Scholar] [CrossRef] [Green Version]
  10. Beier, R.A. Thermal response tests on deep borehole heat exchangers with geothermal gradient. Appl. Therm. Eng. 2020, 115447. [Google Scholar] [CrossRef]
  11. Hino, T.; Ooka, R. Integrated utilization of renewable energy by 2-stage heat pump system. In Proceedings of the Conference of the Air Conditioning and Sanitary Engineering Society, Nagoya, Japan, 12–14 September 2018; pp. 1–4. [Google Scholar]
  12. Rohde, D.; Andresen, T.; Nord, N. Analysis of an integrated heating and cooling system for a building complex with focus on long–term thermal storage. Appl. Therm. Eng. 2018, 145, 791–803. [Google Scholar] [CrossRef]
  13. Sircar, A.; Shah, M.; Vaidya, D.; Dhale, S.; Sahajpal, S.; Yadav, K.; Garg, S.; Sarkar, P.; Sharma, S.; Mishra, T. Performance simulation of ground source heat pump system based on low enthalpy geothermal systems. Emerg. Trends Chem. Eng. 2017, 4, 1–12. [Google Scholar]
  14. Rui, Y.; Garber, D.; Yin, M. Modelling ground source heat pump system by an integrated simulation programme. Appl. Therm. Eng. 2018, 134, 450–459. [Google Scholar] [CrossRef]
  15. Sarbu, I.; Sebarchievici, C. Using ground-source heat pump systems for heating/cooling of buildings. In Advances in Geothermal Energy; Books on Demand: Norderstedt, Germany, 2016. [Google Scholar] [CrossRef] [Green Version]
  16. Liu, X.; Malhotra, M.; Im, P. Performance analysis of ground source heat pump demonstration projects in the united states, In Proceedings of the 12th IEA Heat Pump Conference, Rotterdam, The Netherlands, 15–18 May 2017.
  17. Ferrantelli, A.; Fadejev, J.; Kurnitski, J. A tabulated sizing method for the early stage design of geothermal energy piles including thermal storage. Energy Build. 2020, 223, 110178. [Google Scholar] [CrossRef]
  18. Li, H.; Nord, N. Transition to the 4th generation district heating- possibilities, bottlenecks, and challenges. Energy Procedia 2018, 149, 483–498. [Google Scholar] [CrossRef]
  19. Li, H.; Hou, J.; Hong, T.; Ding, Y.; Nord, N. Energy, economic, and environmental analysis of integration of thermal energy storage into district heating systems using waste heat from data centres. Energy 2021, 219, 119582. [Google Scholar] [CrossRef]
  20. Li, H.; Hou, J.; Hong, T.; Nord, N. Distinguish between the economic optimal and lowest distribution temperatures for heat-prosumer-based district heating systems with short-term thermal energy storage. Energy 2022, 248, 123601. [Google Scholar] [CrossRef]
  21. Li, H.; Hou, J.; Tian, Z.; Hong, T.; Nord, N.; Rohde, D. Optimize heat prosumers’ economic performance under current heating price models by using water tank thermal energy storage. Energy 2022, 239, 122103. [Google Scholar] [CrossRef]
  22. Cimmino, M.; Wetter, M. Modelling of heat pumps with calibrated parameters based on manufacturer data. In Proceedings of the 12th International Modelica Conference, Prague, Czech Republic, 15–17 May 2017; pp. 219–226. [Google Scholar]
  23. Kinab, E.; Fau, A.; Marchio, D.; Rivière, P. Model of a reversible heat pump for part load energy based optimization design. In Proceedings of the Conference Clima 2007 WellBeing Indoors, Helsinki, Finland, 10–14 June 2007. [Google Scholar]
  24. Fuentes, E.; Waddicor, D.; Fannan, M.O.; Salom, J. Improved methodology for testing the part load performance of water-to-water heat pumps, In Proceedings of the 12th IEA Heat Pump Conference, Rotterdam, The Netherlands, 15–18 May 2017.
  25. Bitzer Software. Available online: https://www.Bitzer.De/websoftware/ (accessed on 3 May 2022).
  26. Bitzer Software 6.17.0: Selection-Software for the Reliable Selection of Products from the Broad Product Range of Bitzer. Available online: https://www.bitzer.de/gb/en/ (accessed on 3 May 2022).
  27. Skarphagen, H.; Banks, D.; Frengstad, B.S.; Gether, H. Design considerations for borehole thermal energy storage (btes): A review with emphasis on convective heat transfer. Geofluids 2019, 2019, 4961781. [Google Scholar] [CrossRef]
  28. Ahmadfard, M.; Bernier, M. A review of vertical ground heat exchanger sizing tools including an inter-model comparison. Renew. Sustain. Energy Rev. 2019, 110, 247–265. [Google Scholar] [CrossRef]
  29. Javed, S.; Spitler, J. Calculation of borehole thermal resistance. In Advances in Ground-Source Heat Pump Systems; Elsevier: Amsterdam, The Netherlands, 2016; pp. 63–95. [Google Scholar]
  30. Persson, T.; Stavset, O.; Ramstad, R.K.; Alonso, M.J.; Lorenz, K. Software for modelling and simulation of ground source heating and cooling systems; SINTEF Energi AS: Trondheim, Norway, 2016. [Google Scholar]
  31. Hellström, G.; Sanner, B.; Earth Energy Designer. User’s Manual, Version 2. 2000. Available online: https://www.buildingphysics.com/manuals/eed.pdf (accessed on 3 May 2022).
  32. Giordano, N.; Chicco, J.; Mandrone, G.; Verdoya, M.; Wheeler, W.H. Comparing transient and steady-state methods for the thermal conductivity characterization of a borehole heat exchanger field in Bergen, Norway. Environ. Earth Sci. 2019, 78, 460. [Google Scholar] [CrossRef]
  33. Ramstad, R.K.; Midttømme, K.; Liebel, H.T.; Frengstad, B.S.; Willemoes-Wissing, B. Thermal conductivity map of the oslo region based on thermal diffusivity measurements of rock core samples. Bull. Eng. Geol. Environ. 2015, 74, 1275–1286. [Google Scholar] [CrossRef]
  34. Ferrantelli, A.; Fadejev, J.; Kurnitski, J. Energy pile field simulation in large buildings: Validation of surface boundary assumptions. Energies 2019, 12, 770. [Google Scholar] [CrossRef] [Green Version]
  35. Faanes, A.; Skogestad, S. Buffer tank design for acceptable control performance. Ind. Eng. Chem. Res. 2003, 42, 2198–2208. [Google Scholar] [CrossRef] [Green Version]
  36. Rahman, A.; Fumo, N.; Smith, A.D. Simplified modeling of thermal storage tank for distributed energy heat recovery applications, In Proceedings of the ASME 2015 9th International Conference on Energy Sustainability collocated with the ASME 2015 Power Conference, the ASME 2015 13th International Conference on Fuel Cell Science, Engineering and Technology, and the ASME 2015 Nuclear Forum, San Diego, CA, USA, 28 June–2 July 2015; Volume 2.
  37. Campos-Celador, Á.; Diarce, G.; Larrinaga, P.; García-Romero, A.M. A simple method for the design of thermal energy storage systems. Energy Storage 2020, 2, e140. [Google Scholar] [CrossRef]
  38. Cadau, N.; De Lorenzi, A.; Gambarotta, A.; Morini, M.; Rossi, M. Development and analysis of a multi-node dynamic model for the simulation of stratified thermal energy storage. Energies 2019, 12, 4275. [Google Scholar] [CrossRef] [Green Version]
  39. Abdelhak, O.; Mhiri, H.; Bournot, P. CFD analysis of thermal stratification in domestic hot water storage tank during dynamic mode. In Building Simulation; Springer: Berlin/Heidelberg, Germany, 2015; Volume 8, pp. 421–429. [Google Scholar]
  40. Chandra, Y.P.; Matuska, T. Stratification analysis of domestic hot water storage tanks: A comprehensive review. Energy Build. 2019, 187, 110–131. [Google Scholar] [CrossRef]
  41. Fernández, M.; Eguía, P.; Granada, E.; Febrero, L. Sensitivity analysis of a vertical geothermal heat exchanger dynamic simulation: Calibration and error determination. Geothermics 2017, 70, 249–259. [Google Scholar] [CrossRef]
  42. Han, C.; Yu, X.B. Sensitivity analysis of a vertical geothermal heat pump system. Appl. Energy 2016, 170, 148–160. [Google Scholar] [CrossRef] [Green Version]
  43. Bonanos, A.; Votyakov, E.V. Sensitivity analysis for thermocline thermal storage tank design. Renew. Energy 2016, 99, 764–771. [Google Scholar] [CrossRef]
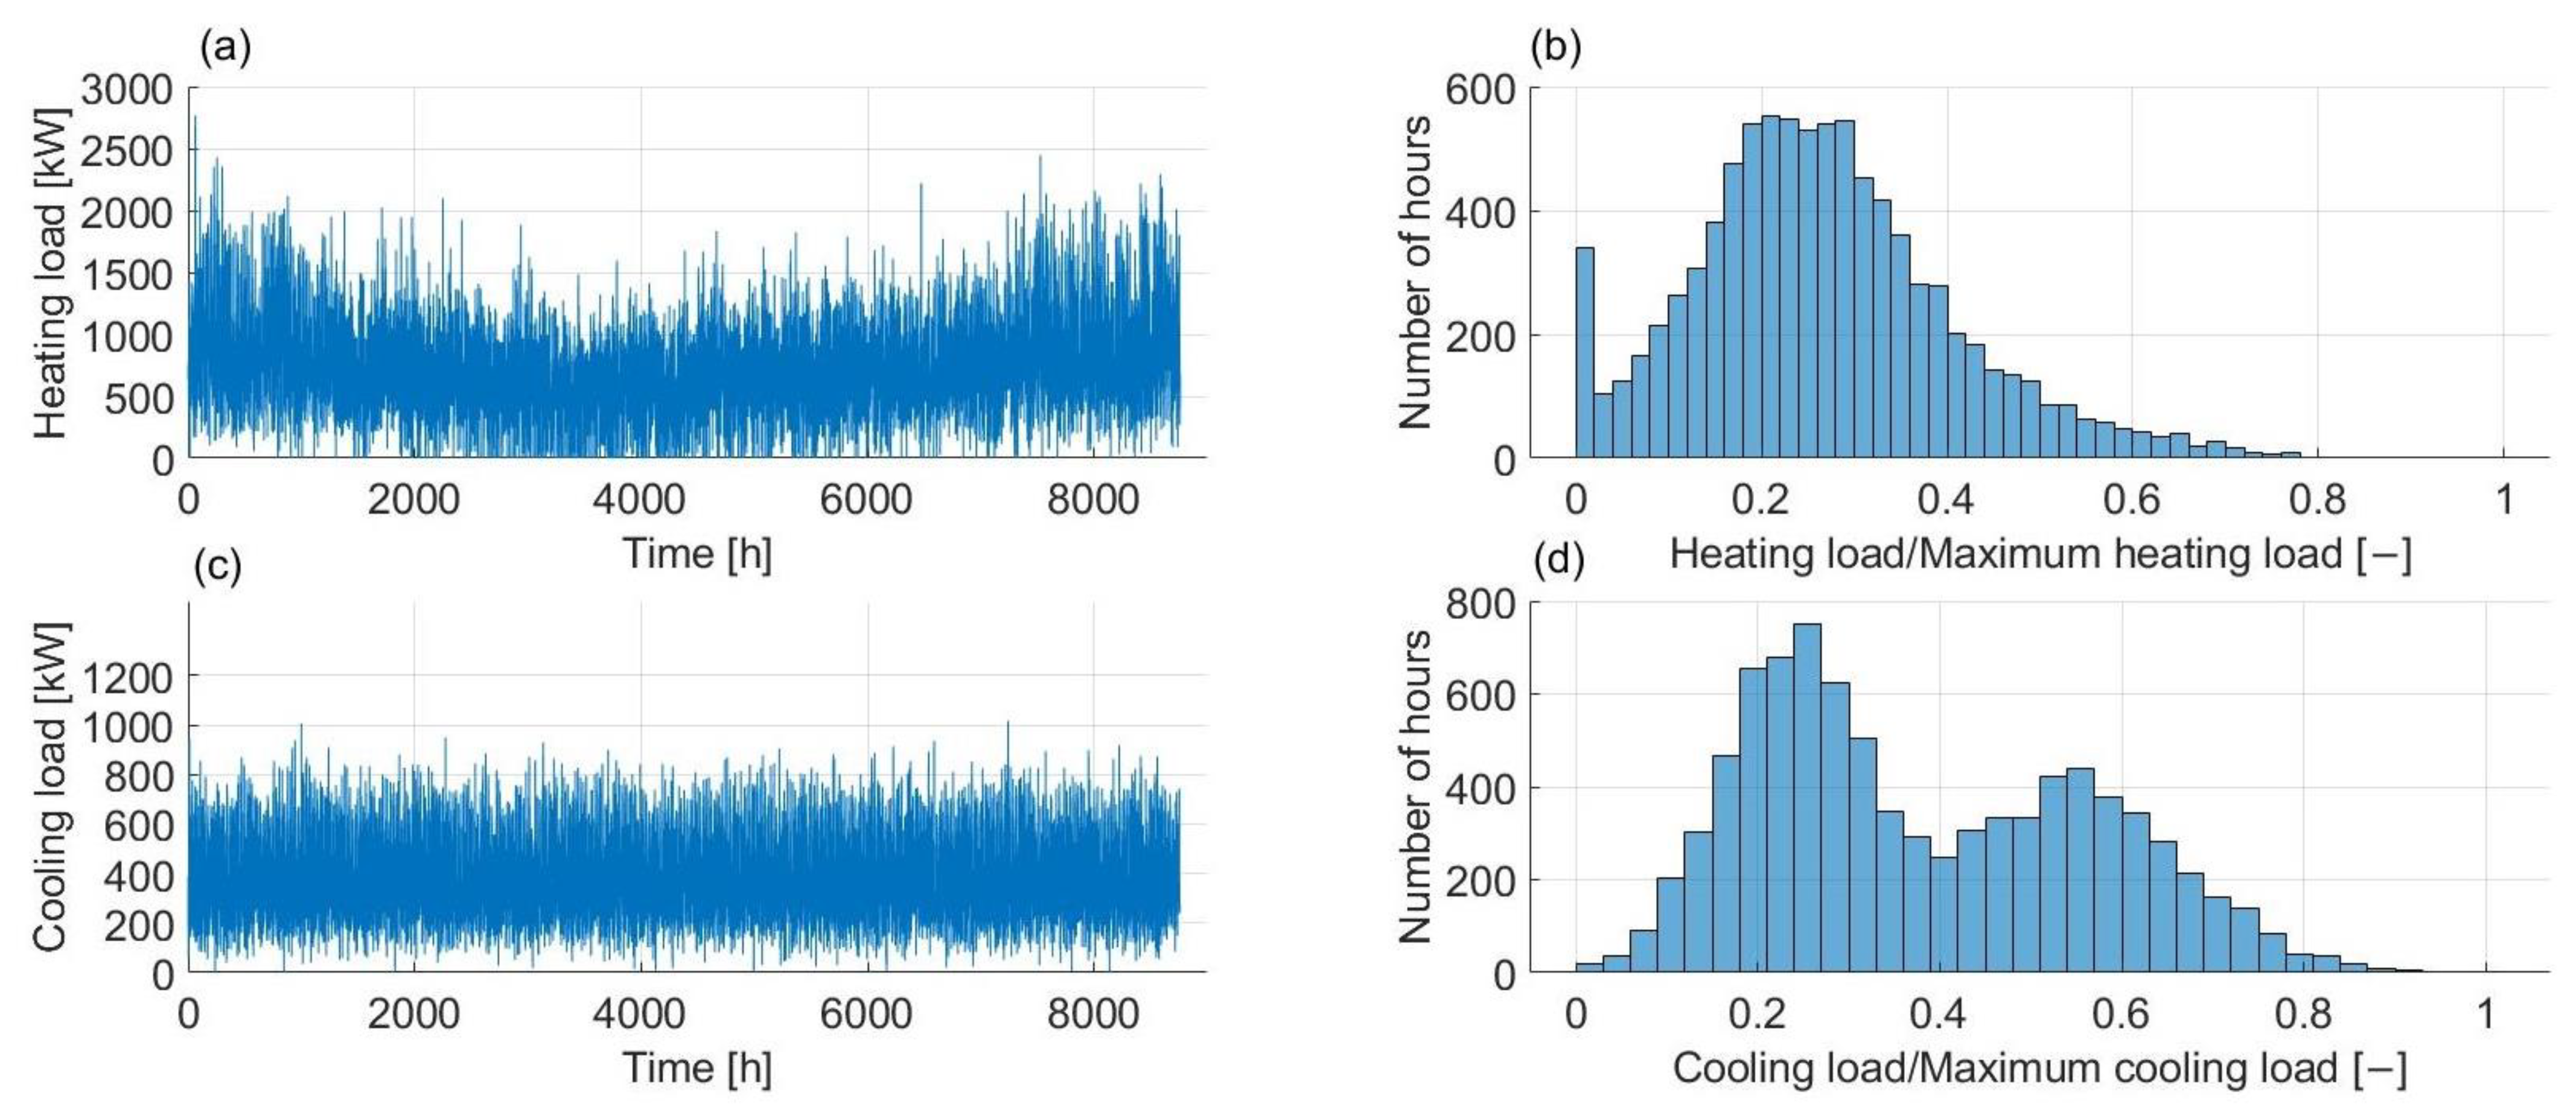
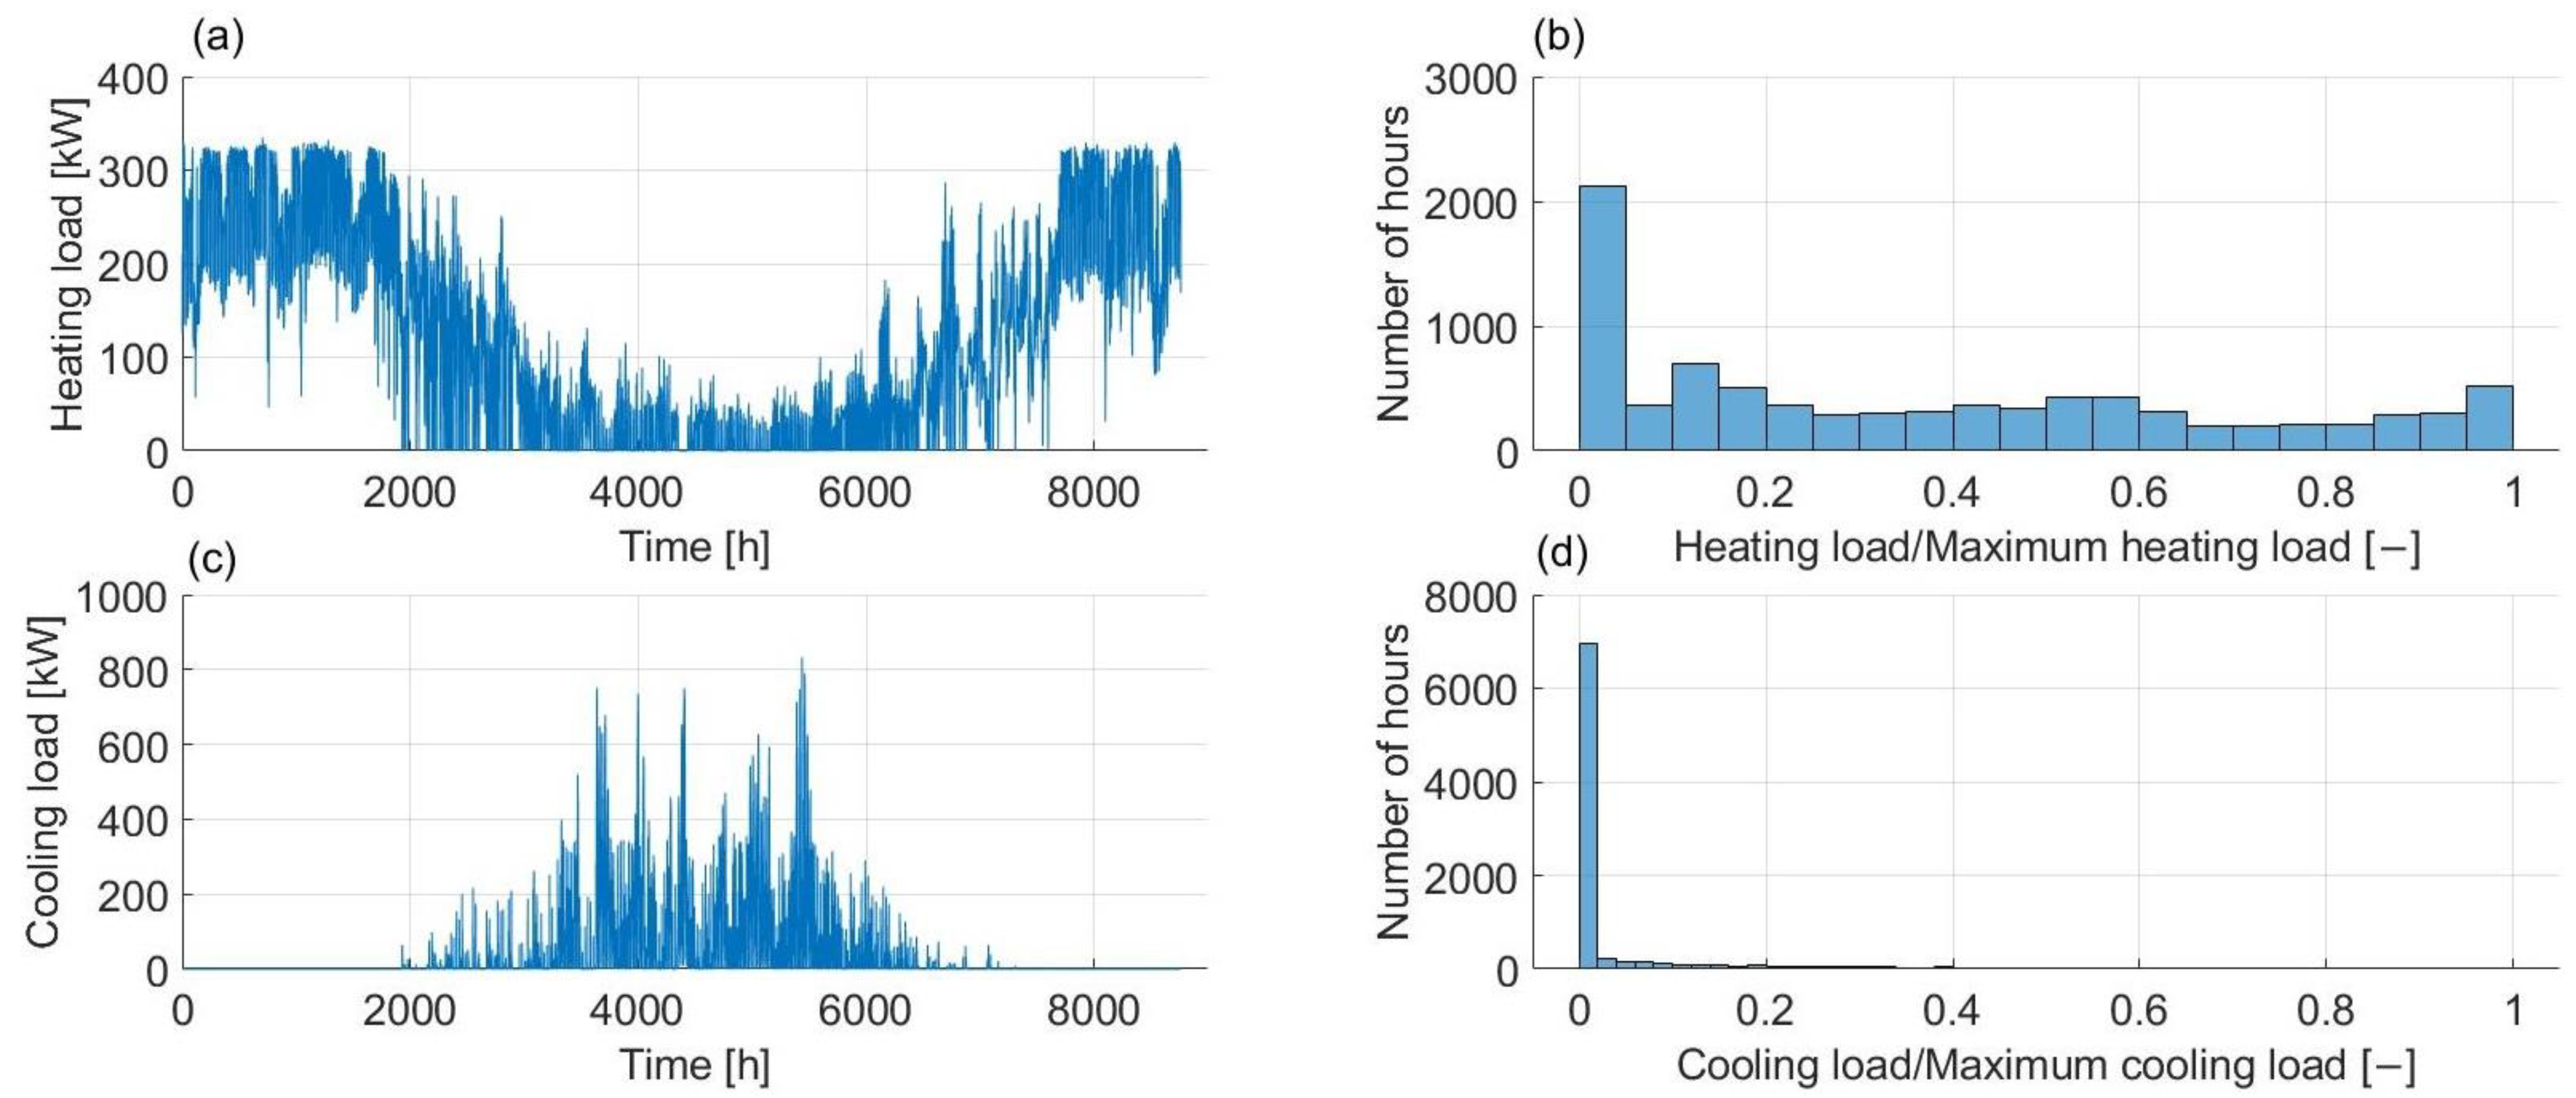
Figure 1. Simplified overview of the integrated heating and cooling system.
Sustainability 14 05709 g001
Figure 2. Load 1 energy profile. (a) Hourly heating demand, (b) partial load frequency of heating demand, (c) hourly cooling demand, (d) partial load frequency of cooling demand.
Sustainability 14 05709 g002
Figure 3. Load 2 energy profile. (a) Hourly heating demand, (b) partial load frequency of heating demand, (c) hourly cooling demand, (d) partial load frequency of cooling demand.
Sustainability 14 05709 g003
Figure 4. Simplified scheme of borehole configuration.
Sustainability 14 05709 g004
Figure 5. System configuration in heating mode.
Sustainability 14 05709 g005
Figure 6. System configuration in cooling mode.
Sustainability 14 05709 g006
Figure 7. System configuration in the free-cooling mode.
Sustainability 14 05709 g007
Figure 8. Flow chart of system model implementation.
Sustainability 14 05709 g008
Figure 9. (a) BTES temperature, (b) heat rate per length of BTES for Load 2, (c) cumulative heat rates per length of BTES, (d) heat rate per length of BTES for Load 1.
Sustainability 14 05709 g009
Figure 10. Energy balance of the low-temperature side of the system. (a) Load 1, (b) Load 2.
Sustainability 14 05709 g010
Figure 11. (a) HWST temperature, (b) HWST heat rate for Load 2, (c) HWST cumulative heat rates, (d) HWST heat rate for Load 1.
Sustainability 14 05709 g011
Figure 12. Heating system supply combinations. (a) Load 1, (b) Load 2.
Sustainability 14 05709 g012
Figure 13. (a) Heat pump actual loads for Load 1, (b) heat pump actual loads for Load 2, (c) COP for Load 1 (d) COP for Load 2, (e) part load frequency hours for Load 1, (f) part load frequency hours for Load 2.
Sustainability 14 05709 g013
Figure 14. Sensitivity analysis report for (a) Load 1, (b) Load 2.
Sustainability 14 05709 g014
Figure 15. (a) Temperature of BTES, (b) ground temperature reduction.
Sustainability 14 05709 g015
Figure 16. Long term performance factors. (a) C O P o v e r a l l , (b) C O P t o t a l , s y s t e m , (c) deviation of C O P o v e r a l l , (d) deviation of C O P t o t a l , s y s t e m .
Sustainability 14 05709 g016
Table 1. Maximum and total heating and cooling demand for the two profiles.
ProfilesDemandMaximum (kW)Total (MWh)α (−)
Load 1Heating276864360.52
Cooling10153386
Load 2Heating334.71073.40.29
Cooling832.5316.2
Table 2. Design characteristics of heat pumps chosen for Load 1 and Load 2.
ProfilesLoad 1Load 2
TypeOSKA95103-K8FE-70Y
Working fluidR717R404A
Evaporation temperature0 °C/2 °C0 °C/2 °C
Condensation temperature25 °C/29 °C40 °C/42 °C
Evaporator capacity1116 kW187 kW
Condenser capacity1248 kW248 kW
COP (nominal/Carnot)9.40/13.024.06/8.15
Table 3. Ground and BTES thermophysical properties from the Energy Earth Designer software.
ParameterValue
Ground heat extraction rate (W/m)30
Ground thermal conductivity (W/m∙K)3.5
The average temperature of the unaffected ground (°C)6
Length to the unaffected ground (m)10
Borehole depth (m)300
Ground material density (kg/m3)2800
Ground heat capacity (kJ/kg·K)0.85
Heat carrier fluid density (kg/m3)971
Heat carrier fluid heat capacity (kJ/kg·K)4.298
The center-to-center distance between boreholes (m)6
Borehole diameter (mm)110
U-pipe diameter (mm)32
U-pipe thermal conductivity (W/m·K)0.42
Filling material thermal conductivity (W/m·K)0.6
Heat carrier fluid thermal conductivity (W/m·K)0.43
Table 4. Parameters for sensitivity analysis.
ParameterUnitBase ValueChange
Borehole storage initial temperature T B T E S °C8.5±20%
Ground conductivity k g r o u n d W/(m·K)2.6±20%
Temperature setpoint for heating side T r , c o n d °C50/55±20%
Temperature setpoint for cooling side T r , e v a p °C5/7±20%
Borehole pipe distances Δ x m6±20%
Borehole depth D B T E S m300±20%
Ground heat rate Q ˙ g r o u n d W/m30±20%
Heating load Q ˙ h l kW100%±20%
Cooling load Q ˙ c l kW100%±20%
Δ T c d K25±20%
Δ T e v K5±20%
Heat pump performance coefficients q , C , p , a -100%±10%
Δ T s t r a t , t a n k K0–40±20%
HWST initial temperature T H W S T , 1 °C40±20%
Temperature drop around the condenser Δ T h p K40–45±20%
Volume of HWST (Load 1/Load 2) ( V H W S T ) m335.59/6.45±20%
Table 5. Results of the base case for Load 1 and Load 2.
VariableUnitLoad 1Load 2
Average COP (heating/cooling/overall)-4.54/3.57/8.342.20/1.56/5.99
C O P t o t a l , s y s t e m -2.452.01
Borehole storage temperature (max/min/mean)°C8.5/7.78/8.058.5/5.38/6.57
HWST temperature (max/min/mean)°C83.91/42.9/53.4892.56/39.45/58.63
Annual electricity useMWh1117.4303.14
HWST coverage ratio%6165
Annual peak load energyMWh2435.4366.56
Annual surplus heatMWh223.100
Part load operation hoursh59954505
Maximum BTES extraction/injectionW/m−19.51/23.82−28.31/131.69
Maximum tank extraction/injectionkW−1450.7/718.45−162.55/176.69
Volume of HWSTm335.596.45
Total BTES volumem31,339,200226,800
Number of boreholes-12421
Total BTES field aream24464756
Publisher’s Note: MDPI stays neutral with regard to jurisdictional claims in published maps and institutional affiliations.

