
Estimating the Long-Term Effects of National and International Sustainable Transport Policies on Energy Consumption and Emissions of Road Transport Sector of Pakistan

 ,
,  ,
,  ,
, 
 ,
,  and
and
Abstract
:1. Introduction
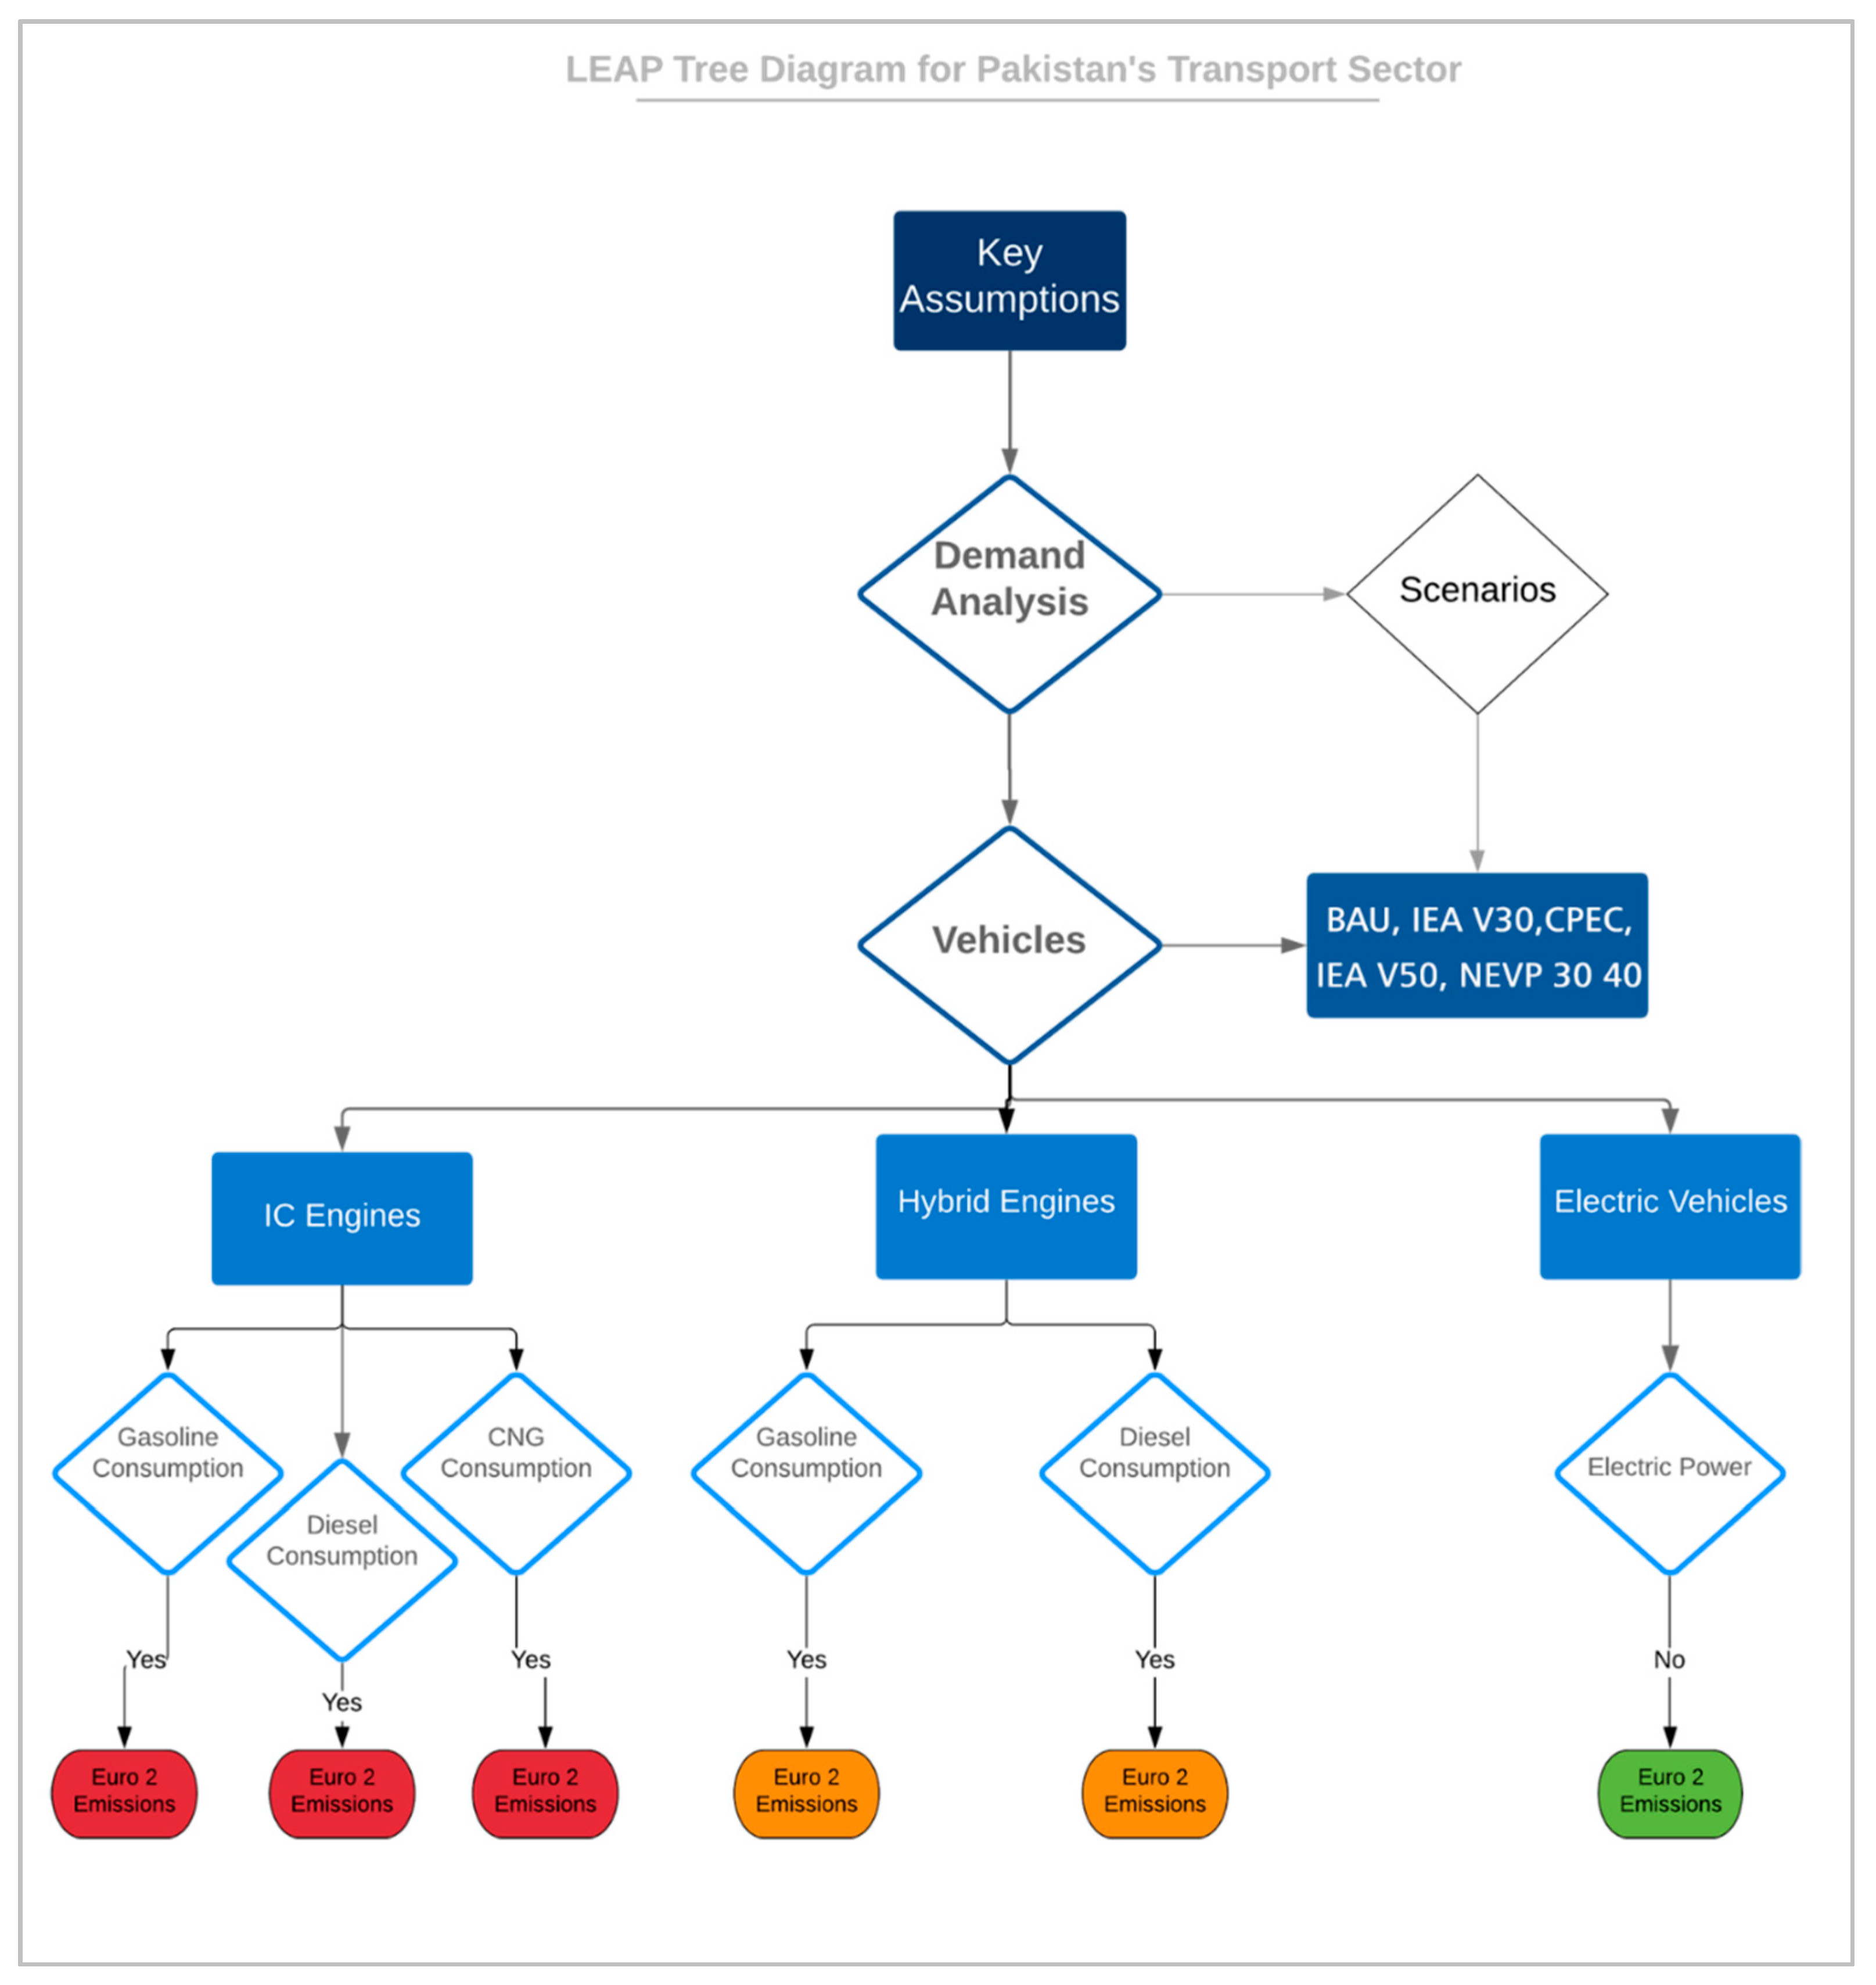
2. Methods
3. Overview of Pakistan’s Transport Sector Energy and Emissions
3.1. Pakistan Transport Sector’s Energy Consumption
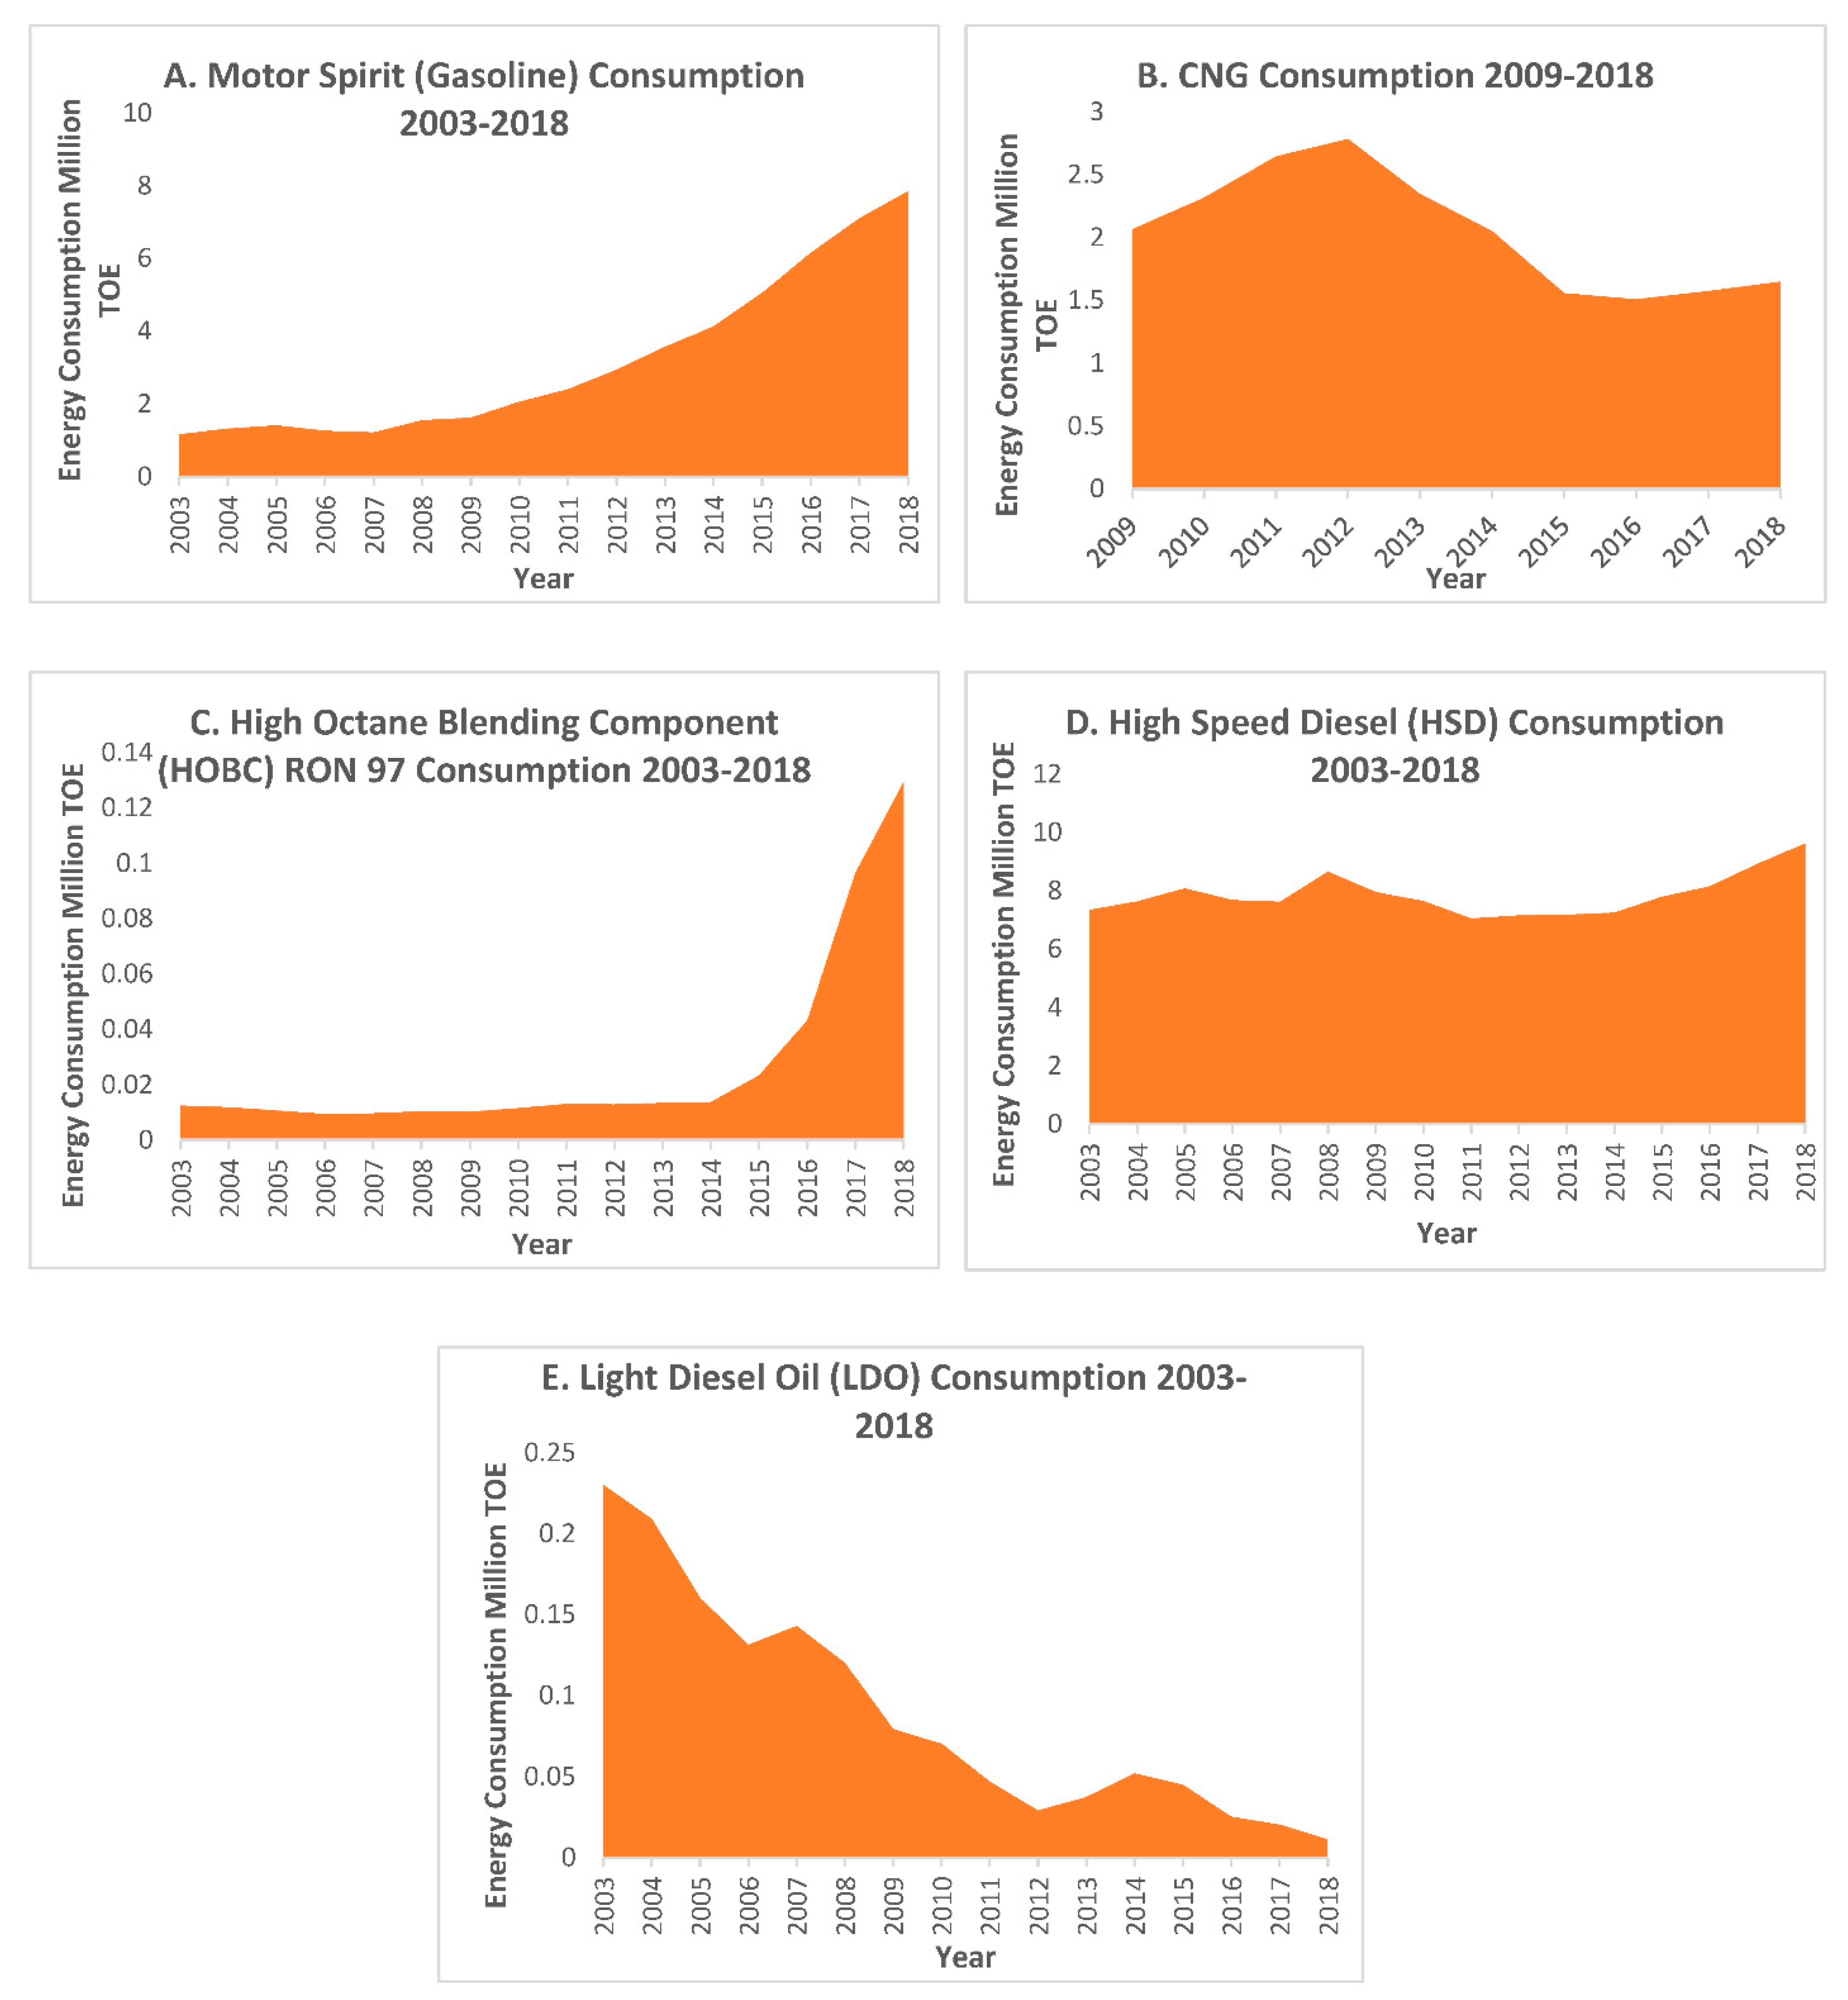
3.2. MS HSD HOBC LDO and CNG Consumption
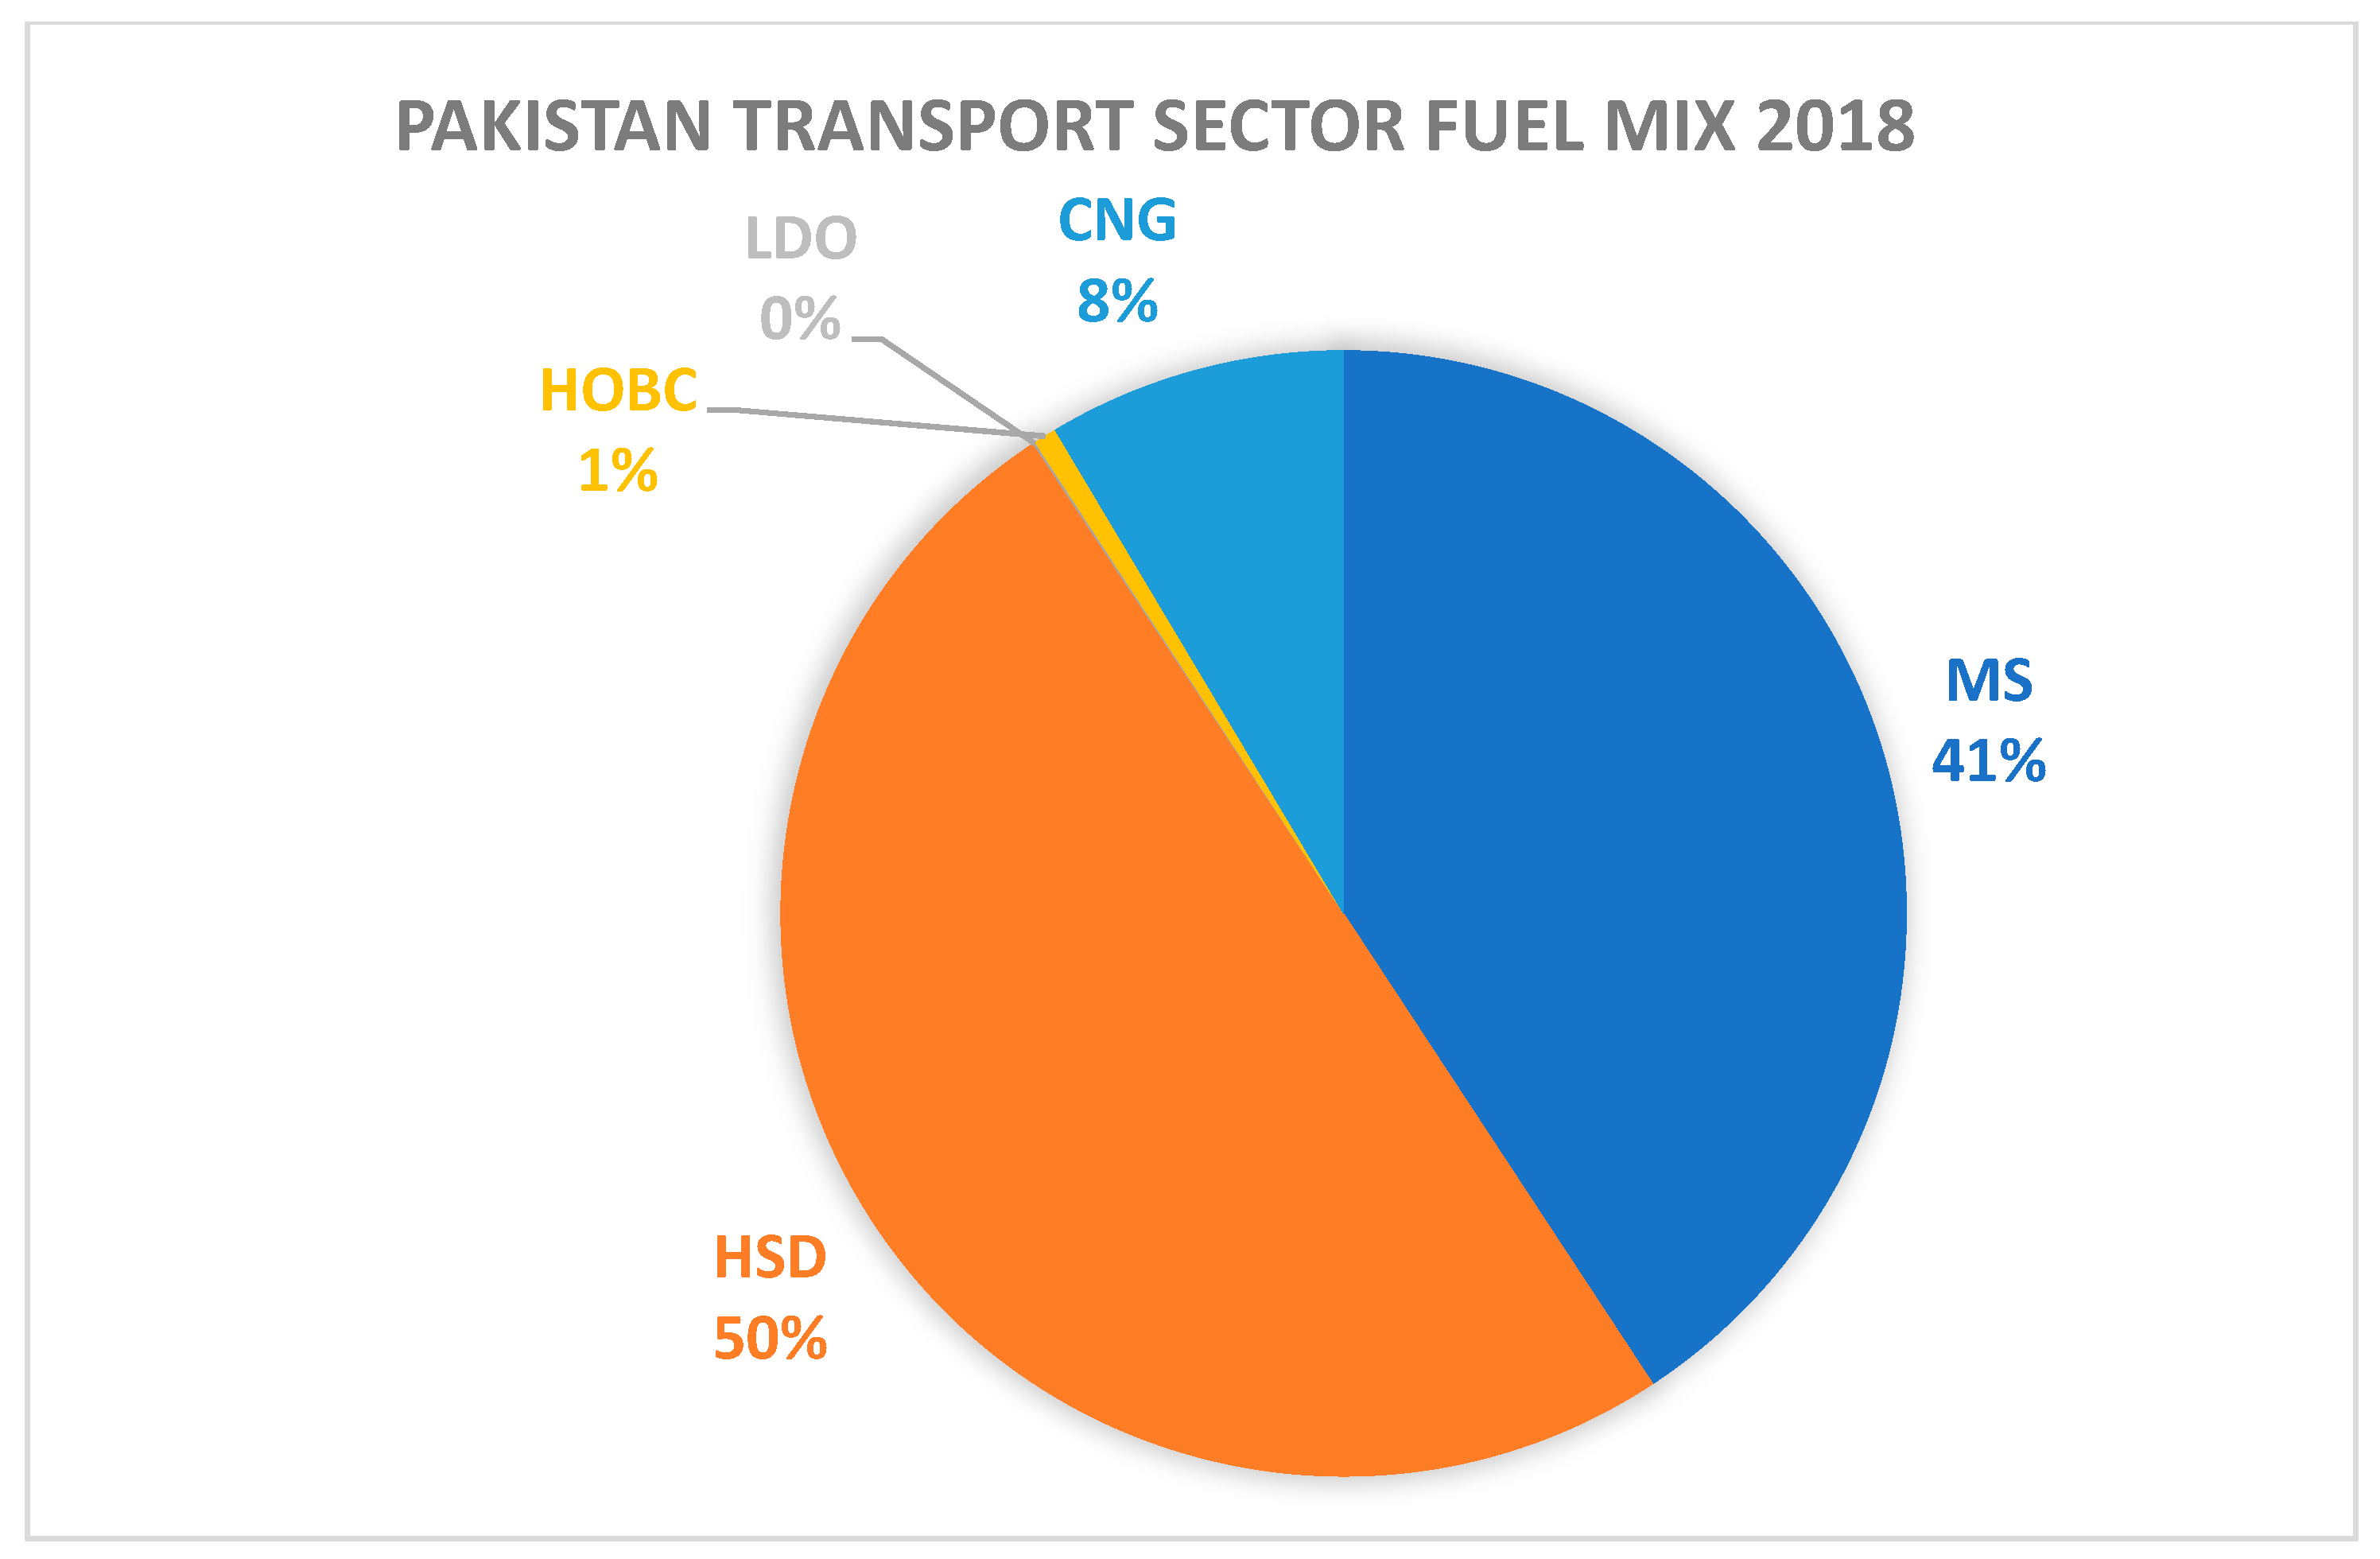
3.3. Pakistan Transport Sector Fuel Mix
3.4. Pakistan’s Current Vehicle Fleet
3.5. CO2 Emissions from Fuel Combustion
4. Results and Discussions
4.1. Business as Usual (BAU) Scenario
4.2. IEA V30 Scenario for Pakistan’s Transport Sector
4.3. IEA V50 Scenario for Pakistan’s Transport Sector
4.4. CPEC 2030 Scenario for Pakistan’s Transport Sector
4.5. Pakistan National EV Policy (NEVP) 2030 and 2040 Scenarios
4.6. Comparison of BAU, IEA V30, IEA V50 and CPEC-2030 Scenarios
5. Conclusions
Author Contributions
Funding
Informed Consent Statement
Acknowledgments
Conflicts of Interest
Nomenclature
| EV | Electric Vehicles |
| COP | Conference of Parties |
| IPCC | International Panel on Climate Change |
| UNFCCC | United Nations Framework Convention on Climate Change |
| IEA | International Energy Agency |
| Li Ion | Lithium Ion (Batteries) |
| INDC | Intended Nationally Determined Contribution |
| GHG | Green House Gases |
| TOE | Tons of Oil Equivalent (Energy) |
| MMT | Million Metric Tons |
| CO2 | Carbon Dioxide |
| SOx | Oxides of Sulphur |
| NOx | Oxides of Nitrogen |
| HC | Hydrocarbons |
| UBHC | Unburnt Hydrocarbons |
| CH4(g) | Methane Gas |
| LEAP | Long-Range Energy Alternate Planning |
| MS | Motor Spirit |
| HSD | High-Speed Diesel |
| HOBC | High-Octane Blending Component |
| LDO | Light Diesel Oil |
| BAU | Business as Usual |
| V30 | Vision 2030 |
| V50 | Vision 2050 |
| CPEC | China Pakistan Economic Corridor |
| PRC | People’s Republic of China |
| NEVP | National Electric Vehicle Policy |
Abbreviations
| Pakistan GDP | $305 Billion |
| Pakistan GDP Per-Capita | $1547.85 |
| Total Energy Consumption | 50.12 TOE |
| Number of Registered Vehicles | 22 million |
| Energy Consumption Share by Transport Sector | 33.93% |
| Pakistan Population | 220 million |
| Pakistan Electricity Supply | 123,118 GWh |
| Pakistan Electricity Demand | 95,530 GWh |
| CO2 From Fuel Combustion | 200 MMT |
| Current renewable Energy Share | 35% (hydel and non hydel |
| Emission Standard used in LEAP for Gasoline, HOBC and HSD CNG | IPCC Tier 1 Default Emission Factor |
References
- International Energy Agency. CO2 Emissions from Fuel Combustion 2019; International Energy Agency: Paris, France, 2018. [Google Scholar]
- Lee, C.H.; Lin, S.H.; Kao, C.L.; Hong, M.Y.; Mr, P.C.H.; Shih, C.L.; Chuang, C.C. Impact of climate change on disaster events in metropolitan cities-trend of disasters reported by Taiwan national medical response and preparedness system. Environ. Res. 2020, 183, 109186. [Google Scholar] [CrossRef] [PubMed]
- Ministry of Climate Change Government of Pakistan. INDC. 2018. Available online: http://www.lead.org.pk/pakindc/aboutindc.html (accessed on 7 April 2022).
- Lin, B.; Raza, M.Y. Analysis of energy related CO2 emissions in Pakistan. J. Clean. Prod. 2019, 219, 981–993. [Google Scholar] [CrossRef]
- Tian, X.; Geng, Y.; Zhong, S.; Wilson, J.; Gao, C.; Chen, W.; Yu, Z.; Hao, H. A bibliometric analysis on trends and characters of carbon emissions from transport sector. Transp. Res. Part D Transp. Environ. 2017, 59, 1–10. [Google Scholar] [CrossRef]
- Azizalrahman, H.; Hasyimi, V. A model for urban sector drivers of carbon emissions. Sustain. Cities Soc. 2018, 44, 46–55. [Google Scholar] [CrossRef]
- Singh, V.; Sahu, S.K.; Kesarkar, A.P.; Biswal, A. Estimation of high resolution emissions from road transport sector in a megacity Delhi. Urban Clim. 2018, 26, 109–120. [Google Scholar] [CrossRef]
- Ministry of Finance, Government of Pakistan. Pakistan Economic Survey 2018–19; Ministry of Finance, Government of Pakistan: Islamabad, Pakistan, 2019; p. 408. [Google Scholar]
- Pakistan Automobile Manufacturer Association. Production and Sale Data of Vehicles. 2018–2019. Available online: https://www.pama.org.pk/annual-sales-production/ (accessed on 28 March 2022).
- Hydrocarbon Development Institute of Pakistan. Pakistan Energy Year Book 2018; Hydrocarbon Development Institute of Pakistan: Islamabad, Pakistan, 2018. [Google Scholar]
- Bakker, S.; Trip, J.J. Policy options to support the adoption of electric vehicles in the urban environment. Transp. Res. Part D Transp. Environ. 2013, 25, 18–23. [Google Scholar] [CrossRef]
- International Energy Agency (IEA). Global EV Outlook 2019; IEA: Paris, France, 2019. [Google Scholar]
- International Energy Agency (IEA). Nordic EV Outlook 2018; IEA: Paris, France, 2018. [Google Scholar]
- International Energy Agency (IEA). The Futre of Trucks, Implications for Energy and Enviroment; IEA: Paris, France, 2018. [Google Scholar]
- Mersky, A.; Sprei, F.; Samaras, C.; Qian, S. Effectiveness of incentives on electric vehicle adoption in Norway. Transp. Res. Part D Transp. Environ. 2016, 46, 56–68. [Google Scholar] [CrossRef] [Green Version]
- Bjerkan, K.Y.; Nørbech, T.E.; Nordtømme, M.E. Incentives for promoting Battery Electric Vehicle (BEV) adoption in Norway. Transp. Res. Part D Transp. Environ. 2016, 43, 169–180. [Google Scholar] [CrossRef] [Green Version]
- Hao, H.; Cheng, X.; Liu, Z.; Zhao, F. Electric vehicles for greenhouse gas reduction in China: A cost-effectiveness analysis. Transp. Res. Part D Transp. Environ. 2017, 56, 68–84. [Google Scholar] [CrossRef]
- Li, Y.; Zhang, Q.; Liu, B.; McLellan, B.; Gao, Y.; Tang, Y. Substitution effect of New-Energy Vehicle Credit Program and Corporate Average Fuel Consumption Regulation for Green-car Subsidy. Energy 2018, 152, 223–236. [Google Scholar] [CrossRef]
- Ou, S.; Lin, Z.; Qi, L.; Li, J.; He, X.; Przesmitzki, S. The dual-credit policy: Quantifying the policy impact on plug-in electric vehicle sales and industry profits in China. Energy Policy 2018, 121, 597–610. [Google Scholar] [CrossRef]
- Zhang, L.; Zhao, Z.; Xin, H.; Chai, J.; Wang, G. Charge pricing model for electric vehicle charging infrastructure public-private partnership projects in China: A system dynamics analysis. J. Clean. Prod. 2018, 199, 321–333. [Google Scholar] [CrossRef]
- Liu, D.; Xiao, B. Exploring the development of electric vehicles under policy incentives: A scenario-based system dynamics model. Energy Policy 2018, 120, 8–23. [Google Scholar] [CrossRef]
- Levinson, R.S.; West, T.H. Impact of public electric vehicle charging infrastructure. Transp. Res. Part D Transp. Environ. 2018, 64, 158–177. [Google Scholar] [CrossRef]
- Motoaki, Y.; Yi, W.; Salisbury, S. Empirical analysis of electric vehicle fast charging under cold temperatures. Energy Policy 2018, 122, 162–168. [Google Scholar] [CrossRef]
- Lee, Y.; Hur, J. A simultaneous approach implenmenting wind-powered electric vehicle charging stations for charging demand dispersion. Renew. Energy 2018, 144, 172–179. [Google Scholar] [CrossRef]
- Flammini, M.G.; Prettico, G.; Julea, A.; Fulli, G.; Mazza, A.; Chicco, G. Statistical characterisation of the real transaction data gathered from electric vehicle charging stations. Electr. Power Syst. Res. 2018, 166, 136–150. [Google Scholar] [CrossRef]
- National Electric Power Regulatory Authority NEPRA. NEPRA Annual Report 2019; National Electric Power Regulatory Authority NEPRA: Korangi, Pakistan, 2020. [Google Scholar]
- Ashfaq, A.; Ianakiev, A. Features of fully integrated renewable energy atlas for Pakistan; wind, solar and cooling. Renew. Sustain. Energy Rev. 2018, 97, 14–27. [Google Scholar] [CrossRef] [Green Version]
- Aized, T.; Shahid, M.; Bhatti, A.A.; Saleem, M.; Anandarajah, G. Energy security and renewable energy policy analysis of Pakistan. Renew. Sustain. Energy Rev. 2018, 84, 155–169. [Google Scholar] [CrossRef]
- Kamran, M. Current status and future success of renewable energy in Pakistan. Renew. Sustain. Energy Rev. 2018, 82, 609–617. [Google Scholar] [CrossRef]
- Nawaz, S.M.N.; Alvi, S. Energy security for socio-economic and environmental sustainability in Pakistan. Heliyon 2018, 4, e00854. [Google Scholar] [CrossRef] [PubMed] [Green Version]
- Rafique, M.M.; Ahmad, G. Targeting sustainable development in Pakistan through planning of integrated energy resources for electricity generation. Electr. J. 2018, 31, 14–19. [Google Scholar] [CrossRef]
- Maqbool, R.; Sudong, Y. Critical success factors for renewable energy projects; empirical evidence from Pakistan. J. Clean. Prod. 2018, 195, 991–1002. [Google Scholar] [CrossRef]
- Sadri, A.; Ardehali, M.; Amirnekooei, K. General procedure for long-term energy-environmental planning for transportation sector of developing countries with limited data based on LEAP (long-range energy alternative planning) and Energy PLAN. Energy 2014, 77, 831–843. [Google Scholar] [CrossRef]
- Hong, S.; Chung, Y.; Kim, J.; Chun, D. Analysis on the level of contribution to the national greenhouse gas reduction target in Korean transportation sector using LEAP model. Renew. Sustain. Energy Rev. 2016, 60, 549–559. [Google Scholar] [CrossRef]
- He, L.-Y.; Chen, Y. Thou shalt drive electric and hybrid vehicles: Scenario analysis on energy saving and emission mitigation for road transportation sector in China. Transp. Policy 2013, 25, 30–40. [Google Scholar] [CrossRef]
- Emodi, N.V.; Emodi, C.C.; Murthy, G.P.; Emodi, A.S.A. Energy policy for low carbon development in Nigeria: A LEAP model application. Renew. Sustain. Energy Rev. 2017, 68, 247–261. [Google Scholar] [CrossRef]
- Azam, M.; Othman, J.; Begum, R.A.; Abdullah, S.M.S.; Nor, N.G.M. Energy consumption and emission projection for the road transport sector in Malaysia: An application of the LEAP model. Environ. Dev. Sustain. 2015, 18, 1027–1047. [Google Scholar] [CrossRef]
- Ministry of Planning, Government of Pakistan. National Development and Reforms Commission, People Republic of China, Long-Term Plan for China-Pakistan Economic Corridor (2017–2030). 2017. Available online: https://www.pc.gov.pk/uploads/cpec/LTP.pdf (accessed on 15 October 2021).


| Source | 2011–2012 | 2012–2013 | 2013–2014 | 2014–2015 | 2015–2016 | 2016–2017 | 2017–2018 | Unit (TOE) |
|---|---|---|---|---|---|---|---|---|
| ACGR | ||||||||
| Aviation Fuel | 489,454 | 481,611 | 501,906 | 427,992 | 477,992 | 499,677 | 473,929 | −0.3% |
| Motor Spirit | 2,893,980 | 3,505,959 | 4,057,635 | 4,984,851 | 6,076,351 | 7,004,423 | 7,847,016 | 17.5% |
| HOBC | 8682 | 9632 | 11,641 | 21,618 | 40,878 | 93,157 | 129,380 | 68.1% |
| E-10 | 15,138 | 9402 | 2720 | 0 | 0 | 0 | 0 | |
| Kerosene | 354 | 185 | 78 | 74 | 59 | 38 | 41 | −25.9% |
| HSD | 6,367,407 | 6,360,708 | 6,308,838 | 6,593,609 | 7,181,583 | 7,834,580 | 8,537,787 | 6.1% |
| LDO | 620 | 96 | 0 | 0 | 715 | 0 | 0 | - |
| Furnace Oil | 2140 | 377 | 651 | 669 | 1509 | 2558 | 426 | 2.5% |
| Electricity * | 81 | 0 | 0 | 0 | 0 | 0 | 0 | |
| CNG | 2,784,591 | 2,345,331 | 2,050,646 | 1,556,505 | 1,508,246 | 1,573,536 | 1,648,649 | −6.8% |
| Total | 12,562,447 | 12,713,301 | 12,934,115 | 13,585,318 | 15,287,333 | 17,007,969 | 18,637,229 | 8% |
| Annual Growth Rate | 4.52% | 1.20% | 1.74% | 5.03% | 12.53% | 11.26% | 9.58% | - |
| Policy Targets 2030 and 2040 | Passenger Vehicles: Electric Sedans and SUVs achieve 30% new sales market share by the end of 2030 and 90% new sales by the end of 2040 2 and 3 Wheeler Vehicles: 50% and 90% new sales by the end of 2030 and 2040 respectively Buses: 50% and 90% new sales by the end of 2030 and 2040 respectively Trucks: 30% and 90% new sales by the end of 2030 and 2040 respectively |
| Federal Govt. Tax Incentives | For new EV registration, only 1% GST as compared with existing 17% For investers, import duty is only 1% on charging equipment For charging stations of EV lower electricity tariffs are provided All the investments of greenfield are applied to manufacturers of EV and those who help to convet their existing setups in the format to be manufacured by the manufacturere of EV |
| Charging Infrastructure Density and Private Investment Opportunities | One fast DC charging station per 3 KM in major cities and dense urban localities DC charging stations on all existing motorways every 15–30 KM Govt. will ensure interrupted power supply on all charging stations on motorways |
| Manufacturer and Other Incentives | State Bank of Pakistan (SBP) will offer lower financing at lower rates to EV manufacturers SBP will set up low markups for leasing EV for public |
| Policy Measures | Average Score | Effectiveness | Efficiency | Feasibility |
|---|---|---|---|---|
| Plugs and sockets lobby based on the standards implemented contry-wide | 4.27 | 4.14 | 4.50 | 4.17 |
| Build-up of Infrastructure and Support | 4.17 | 4.33 | 4.17 | 4.00 |
| Leadership in political aspects | 4.03 | 4.33 | 4.17 | 3.60 |
| Initiatives of Car-sharing with EVs | 4.00 | 4.00 | 3.75 | 4.25 |
| Provide information to business and citizens | 3.83 | 3.83 | 3.83 | 3.83 |
| EV-readiness as a requirement for new property developments | 3.74 | 4.00 | 3.83 | 3.40 |
| Enable roaming between regions (billing) | 3.63 | 3.86 | 3.71 | 3.33 |
| Reserve on-street parking spaces for EVs | 3.61 | 4.00 | 3.67 | 3.17 |
| Toll/congestion fees relaxation for EVs | 3.33 | 4.00 | 3.40 | 2.60 |
| Permission to EVs for drive on bus/taxi lanes | 3.20 | 3.80 | 3.60 | 2.20 |
Publisher’s Note: MDPI stays neutral with regard to jurisdictional claims in published maps and institutional affiliations. |
© 2022 by the authors. Licensee MDPI, Basel, Switzerland. This article is an open access article distributed under the terms and conditions of the Creative Commons Attribution (CC BY) license (https://creativecommons.org/licenses/by/4.0/).
Share and Cite
Asim, M.; Usman, M.; Abbasi, M.S.; Ahmad, S.; Mujtaba, M.A.; Soudagar, M.E.M.; Mohamed, A. Estimating the Long-Term Effects of National and International Sustainable Transport Policies on Energy Consumption and Emissions of Road Transport Sector of Pakistan. Sustainability 2022, 14, 5732. https://doi.org/10.3390/su14095732
Asim M, Usman M, Abbasi MS, Ahmad S, Mujtaba MA, Soudagar MEM, Mohamed A. Estimating the Long-Term Effects of National and International Sustainable Transport Policies on Energy Consumption and Emissions of Road Transport Sector of Pakistan. Sustainability. 2022; 14(9):5732. https://doi.org/10.3390/su14095732
Chicago/Turabian StyleAsim, Muhammad, Muhammad Usman, Muhammad Salman Abbasi, Saad Ahmad, M. A. Mujtaba, Manzoore Elahi M. Soudagar, and Abdullah Mohamed. 2022. "Estimating the Long-Term Effects of National and International Sustainable Transport Policies on Energy Consumption and Emissions of Road Transport Sector of Pakistan" Sustainability 14, no. 9: 5732. https://doi.org/10.3390/su14095732
APA StyleAsim, M., Usman, M., Abbasi, M. S., Ahmad, S., Mujtaba, M. A., Soudagar, M. E. M., & Mohamed, A. (2022). Estimating the Long-Term Effects of National and International Sustainable Transport Policies on Energy Consumption and Emissions of Road Transport Sector of Pakistan. Sustainability, 14(9), 5732. https://doi.org/10.3390/su14095732