Article

Characterization and Thermal Treatment of the Black Mass from Spent Lithium-Ion Batteries

1
SWERIM AB, Aronstorpsvägen 1, SE-974 37 Luleå, Sweden
2
Central Metallurgical Research and Development Institute (CMRDI), Cairo 12422, Egypt
3
INSTM and Chemistry for Technologies Laboratory, Department of Mechanical and Industrial Engineering, University of Brescia, Via Branze 38, 25123 Brescia, Italy
4
INSTM and Dipartimento DICEAM, Università degli Studi Mediterranea di Reggio Calabria, Loc. Feo di Vito, 89122 Reggio Calabria, Italy
5
Department of Geosciences, Environment and Spatial Plannings, Faculty of Sciences, Earth Science Institute-Porto Pole, University of Porto, Rua do Campo Alegre s/n, 4169-007 Porto, Portugal
*
Author to whom correspondence should be addressed.
Sustainability 2023, 15(1), 15; https://doi.org/10.3390/su15010015
Submission received: 11 November 2022 / Revised: 9 December 2022 / Accepted: 14 December 2022 / Published: 20 December 2022
(This article belongs to the Special Issue Sustainable Technologies for Recycling of Lithium-Ion Batteries)

Abstract

:
Recycling lithium-ion batteries is crucial for the environment and the sustainability of primary resources. In this paper, we report on the characterization of two grades of black mass from spent lithium-ion batteries (with typical lithium–nickel–manganese–cobalt oxide cathode compositions) and their behavior during heating trials. This study paves the way for optimizing lithium-ion battery recycling processes by fully characterizing black mass samples before and after heating. A gas release under pyrolytic conditions was detected using a multicomponent mass spectrometer and included dimethyl carbonate, diethyl carbonate, oxygenated hydrocarbons, hydrocarbons, and other miscellaneous gases. This can be attributed to the evaporation of volatile organic compounds, conductive salt, organic polyvinylidene fluoride binder, and an organic separator such as polypropylene. Thermal treatment led to the partial decomposition of the binder into char and newly formed fluorine cuboids. The compaction of the cathode decreased, but the remaining binder limited recycling processes. By heating the black mass samples to 900 °C, the intensity of the X-ray diffraction graphitic carbon peak decreased, and the lithium metal oxides were reduced to their corresponding metals. The graphite in the black mass samples was structurally more disordered than natural graphite but became more ordered when heated.

1. Introduction

The use of lithium-ion batteries (LIBs) is surging rapidly. This is mostly due to the usage of LIBs in electric vehicles (EVs), of which worldwide sales are projected to grow to over 11 million annually by 2030 [1]. The price surge is attributed to the fact that the global capacity of lithium (Li) mines and the ability to process Li into batteries is expected to fall short of the increasing demand due to the predicted growth in EV battery production. Apart from primary resources sustainability, the real policy threat is what comes afterward once we transform the mined Li into batteries. Therefore, the global clean energy transition will have far-reaching consequences regarding mineral demand for the next 20 years. To add to that, there is another concern regarding the most critical metals and their distribution, as is the case for cobalt (Co). The shift towards reducing Co chemistries for batteries shows the displacement of Co growth by nickel (Ni) growth [2]. These elements can only be recovered after mechanical treatment of the pack cells (such as shredding, grinding, heat treatment, and density separation) to obtain a powdered material called black mass (BM) [3]. The process economics depend mostly on the recovery of Co, by far the most valuable element in the battery, and research is ongoing to reduce the amount of Co used [4]. Despite this, recycling is potentially the most promising end-of-life management option because it results in the possibility to reduce the environmental impacts of spent batteries, while simultaneously helping to mitigate price spikes and potential supply disruptions of battery materials by sending the recovered metals back into the battery supply chain [5].
Battery recycling processes generally start with the discharging of the batteries to reduce the hazard level resulting from residual stored energy, which could otherwise activate undesired reactions and lead to overheating. The metals are present as lithium metal oxides (hereafter referred to as LiMeOx), which are the active material in the cathode section, covering an aluminium (Al) foil, and the anode is composed of a copper (Cu) foil coated with graphite. A crucial constituent is an adhesive agent between the Al foil and the active material, which is improved by a polymeric binder, mostly polyvinylidene fluoride (PVDF) [2]. It is worth mentioning that all these components are under the responsibility of the producer regarding the cost of collecting, treating, and recycling, as described by the regulation set in Europe in the Batteries Directive (2006/66/EG). In the document, it is highlighted that for LIBs, a recycling efficiency of at least 50% by mass must be achieved. As part of the European Green Deal, a legislative initiative was proposed in 2020 by the European Commission (EC) to replace the 2006 Battery Directive. New targets for recycling efficiencies are set for 2030, namely a 65% recycling efficiency for LIBs and material recovery rates of 95% for Co, 95% for Cu, 95% for lead (Pb), 95% for Ni, and 70% for Li [6]. Another relevant issue is the specific measures required for hydrofluoric acid (HF) due to the presence of PVDF binder, which acts as a complexing agent for certain metals such as Al and which can lead to different chemical behaviors of these elements. Nonetheless, little has been investigated about the exact behavior of fluorine (F) in such processes and possible measures [7]. Above all, the high energy density and the presence of toxic and flammable substances in LIBs lead to significant safety risks when handling and transporting LIBs. In the European Union (EU), LIBs transported by road, rail, and sea freight is regulated by the Agreement Concerning the International Carriage of Dangerous Goods by Road (ADR), the Regulations Concerning the International Carriage of Dangerous Goods by Rail (RDI), and the International Maritime Dangerous Goods Code (IMDG Code) [6,8].
Thermal pre-treatments are mostly used to remove organic compounds and carbon that can interfere with subsequent processing. Currently, there are two types of thermal treatments in the industry: incineration (in the presence of air that contains oxygen) and pyrolysis (without oxygen). Vacuum pyrolysis has also been applied to decompose cathode active materials and to separate Li and other transitional metals, with further studies focusing on the leaching process to determine the pros and cons of incineration and pyrolysis [9]. The organic components have a high calorific value, and the energy can be reused. The binder, in most cases PVDF, is decomposed at approximately 400 °C and the graphite undergoes an oxidation reaction above 500 °C to form carbon monoxide (CO) or carbon dioxide (CO2). Additionally, active metals such as Li and Co in the material combine to form Li–F bonds and Co–F bonds with lower binding energy, which reduces the surface binding energy of the cathode material. Monitoring the processing temperature is necessary, as the Al residual flakes will become fragile and melt at temperatures above 600 °C and inhibit the recovery of valuable metals in the following steps [10]. Additives have been investigated, for instance with molten salt (AlCl3, NaCl) or with calcium oxide (CaO), as a reaction medium to lower the decomposition temperature of PVDF and as a preventive measure for equipment corrosion caused by HF volatilization [11]. The material characteristics of the thermally treated materials are normally analyzed using thermogravimetric analysis (TGA), and the generated gases during the thermal process are analyzed using infrared spectroscopy. When compared to conventional pyrolysis, microwave-assisted pyrolysis decreases the quantity of produced heavy molecule gases, and short-chain molecules are more likely to be created due to the rapid heating (less control and possible sparks of problematic materials like Al) and disruption of the long-chain molecules into short-chain molecules [12].
Finally, pyrometallurgical approaches use high-temperature furnaces to reduce the LiMeOx at the liquid phase (temperatures above melting point) from LIBs to form an alloy with no passivation/deactivation needed. Generally, the smelting and roasting/calcination steps are the main techniques during processing. While high temperatures for a metal recovery boost more chemical reactions, the evaporation and burning of the electrolytes, binders, and plastics are exothermic, which reduces the energy consumption required for the process. In addition to gases, the products from this process are slags and metallic alloys [13]. The alloys can further be refined by hydrometallurgical processes. The pyrometallurgical approach is applied in several industrial processes, such as the ultra-high-temperature smelting technology (UHT) of Umicore, the roasting–smelting process of Glencore, the high-temperature melting recovery (HTMR) process of Inmetco, and the calcination processes of Sony-Sumitomo and Accurec. In some specific cases, for instance, to cope with the low solubility of Li2CO3, novel advances in pyrometallurgical approaches make use of salt-assisted roasting (chlorination, nitration, and sulfation) [14]. It is evident that to better address the efforts towards spent LIBs having higher recycling rates, it is necessary to have all the information about the starting BM. However, the window of “Search documents” in the Scopus (2022) database with the query “black mass” AND “lithium-ions” AND “batteries” AND “characterisation” in the abstract and/or keywords highlight that, as of 21 September 2022, only four papers specifically devoted to BM characterization have been published.
This study presents a comprehensive characterization undertaken on BM samples and the effect of heat treatment on the chemical composition, morphological structure, and formation of gas species from the volatilization of electrolyte and binder decomposition. The paper occurs in the frame of the ERA-MIN2 program of the EC, namely project NEXT-LIB, which proposes an integrated and innovative approach to maximize valuable material recovery from spent LIBs based on process integration combining innovative mechanical with efficient pyrometallurgical and hydrometallurgical processes.

2. Materials and Methods

2.1. Samples

In this study, two different grades of BM (namely BM1 and BM2) were sourced from a recycling facility where spent LIBs from different types of NMC are treated by dry mechanical processing consisting of two stages of crushing, sieving, and magnetic separation. The outputs from the separation stages consist of different metal concentrates. The BM1 and BM2 samples consist of the undersize (<4.0 mm) fractions from the sieving unit in which cathode active materials (LiMeOx) and anode active materials (graphite) are concentrated.

2.2. Methodology

The thermal treatment of both grades of BM was performed under N2 flow at 550 °C and 650 °C using a Nabertherm muffle furnace (Model N87/H). On the other hand, a home-made reactor consisting of an airtight stainless-steel chamber equipped with on-line multi-component mass spectrometer (Ion-Molecule Reaction (IMR) mass spectrometer, model Airsense 2000, mass range 7–519 amu), a data acquisition computer, and calibration gases was used for detection of gas release from BM2 under pyrolytic conditions. The experimental setup of the reactor has been described elsewhere [15]. The BM was subjected to comprehensive analysis using qualitative and quantitative analytic techniques. Before thermal treatment, the samples were characterized using inductively coupled plasma–optical emission spectrometry (ICP-OES), X-ray fluorescence (XRF), total carbon and total sulphur, X-ray diffraction (XRD), Scanning Electron Microscopy with Energy Dispersive Spectroscopy Analysis (SEM-EDS), petrography (optical and reflectance), and Raman microspectroscopy. To evaluate the effect of thermal treatment on the samples, TGA with Differential Scanning Calorimetry (TGA-DSC), XRF, XRD, SEM-EDS, petrography, Raman microspectroscopy, and multicomponent mass spectrometry was used.
ICP-OES was applied for determining the contents of Li, Co, manganese (Mn), Ni, Al, and Cu, using a PerkinElmer Optima 8000 (PerkinElmer, Waltham, MA, USA). Before analysis, 0.5 g of each sample was dissolved with 20 mL of aqua regia (HNO3:HCl, 3:1) and digested using a CEM SP-D (CEM, Charlotte, NC, USA) microwave digester. The complete digestion of the material was obtained through a procedure programmed on the instrument software in which the following steps were applied: heating the samples from room temperature to 200 °C using a ten-minute thermal ramp and then holding the samples at 200 °C for 20 min (pressure equal to 450 psi, input power = 300 W). The digested mixture was transferred to a 50 mL flask and brought to volume via MilliQ water. After the solubilization process, it was observed that the powder was not fully dissolved. The samples were then centrifuged to separate the liquid from the solid residue. Calibration standards were prepared by diluting a stock multi-elemental standard solution (1000 mg dm−3) in 0.2% nitric acid. The selected emission lines for the investigated metals were as follows: 610.362 nm for Li, 238.892 nm for Co, 257.610 nm for Mn, 221.648 nm for Ni, 396.153 nm for Al, and 327.393 nm for Cu.
The thermal stability of the samples was evaluated by temperature-programmed TGA/DSC (Thermogravimetric Analysis and Differential Scanning Calorimetry) experiments with a STA 409 PC instrument (Netzsch, Selb, Germany). Complementary elemental and oxide analyses were performed by XRF using a hand-held Bruker S1 Titan analyser with a GeoMining program. An average of three repeats was taken for each sample. Each measurement lasted 30 s. The major components (Al and silicon (Si)) were determined as oxides, while the remaining components analyzed were determined as elements. The carbon and sulphur contents were determined by LECO (CS230).
The phase analysis was performed by XRD (Bruker D2 Phaser, Cu Kα radiation at 30 kV and 20 mA). The peak attribution was performed based on the COD (Crystallography Open Database http://www.crystallography.net/cod/; access date 6 November 2021) database of reference compounds. The temperature effect on the XRD analysis, with a change in temperature between 25 °C and 900 °C, was evaluated with a Panalytical Empyrean S-2 diffractometer equipped with a temperature-controlled heat chamber (Anton Paar, Instrumentation), using Cu Kα radiation (1.54056 Å) at 40 kV and 40 mA. The patterns were recorded in step scan mode from 15° to 65° 2-theta angles in steps of 0.02° and a count time of 2 s per step.
For detailed imaging and to obtain semi-quantitative chemical results of the sample particles, SEM-EDS was used. Before analysis, the raw sample particles were mounted on carbon tape and these and the sample polished block were coated with a carbon layer. The SEM-EDS analysis was made at the Centro de Materiais da Universidade do Porto (CEMUP). A high-resolution (Schottky) Environmental Scanning Electron Microscope with X-ray Microanalysis and Backscattered Electron Diffraction Pattern Analysis (FEI Quanta 400 FEG ESEM/EDAX Genesis X4M) was used.
The petrographic analysis of the BM1 and BM2 raw samples and the respective thermal treated samples was performed using a Leica DM4500 P LED reflected-light petrographic microscope with an oil immersion objective and a combined magnification of ×500, controlled by the software Fossil (Hilgers Technisches Büro, Königswinter, Germany). Before petrographic analysis, polished blocks of the samples were prepared based on ISO 7404-2 [16]. On each sample, the mean random reflectance on one hundred graphite particles was calculated following ISO 7404-5 [17]. To calculate the graphite maximum reflectance average, a strontium–titanate standard 5.40 and an yttrium–aluminum–garnet (YAG) standard 0.901 were used for calibration purposes. In this case, the maximum reflectance of 50 particles of each graphite type (dense and flake) was measured on each sample by rotating the stage under polarized light.
Raman microscopy analysis was made using a TXploRA™ (Horiba Scientific) spectrometer to characterize the graphite and to determine the molecular vibrational transformations undergone by graphite after pyrolysis. The spectrometer was calibrated with a Si standard before spectra acquisition commenced. A green line of an Nd:YAG laser ( λ = 532 nm) as the excitation source, a 100× objective lens, an 1800 T grating, and a 50% filter (to prevent thermal decomposition) were used. The integration time was set to ten seconds and 10 cycles. Spectral analyses were conducted on graphite particles with scans extending from 1000 to 2000 cm−1 to encompass the 1st-order peaks of carbonaceous material. Up to 25 spectra were obtained for each sample. After spectra acquisition, the NGSLabSpec program was used for curve deconvolution. A linear baseline was used to subtract the background and a mixed Gaussian–Lorentzian function was used for curve deconvolution. The curve deconvolution was based on several studies from the literature [18,19,20], in which typical peaks associated with carbonaceous material were identified. The curve deconvolution determined the peak position, full-width at half maximum (FWHM), and integrated intensity for each peak. The averages for each sample and, within each sample, each morphological class (dense and flake) were used. However, certain areas in these two morphology types were highly reflective and were subsequently divided into a class of their own, namely ordered.

3. Results and Discussion

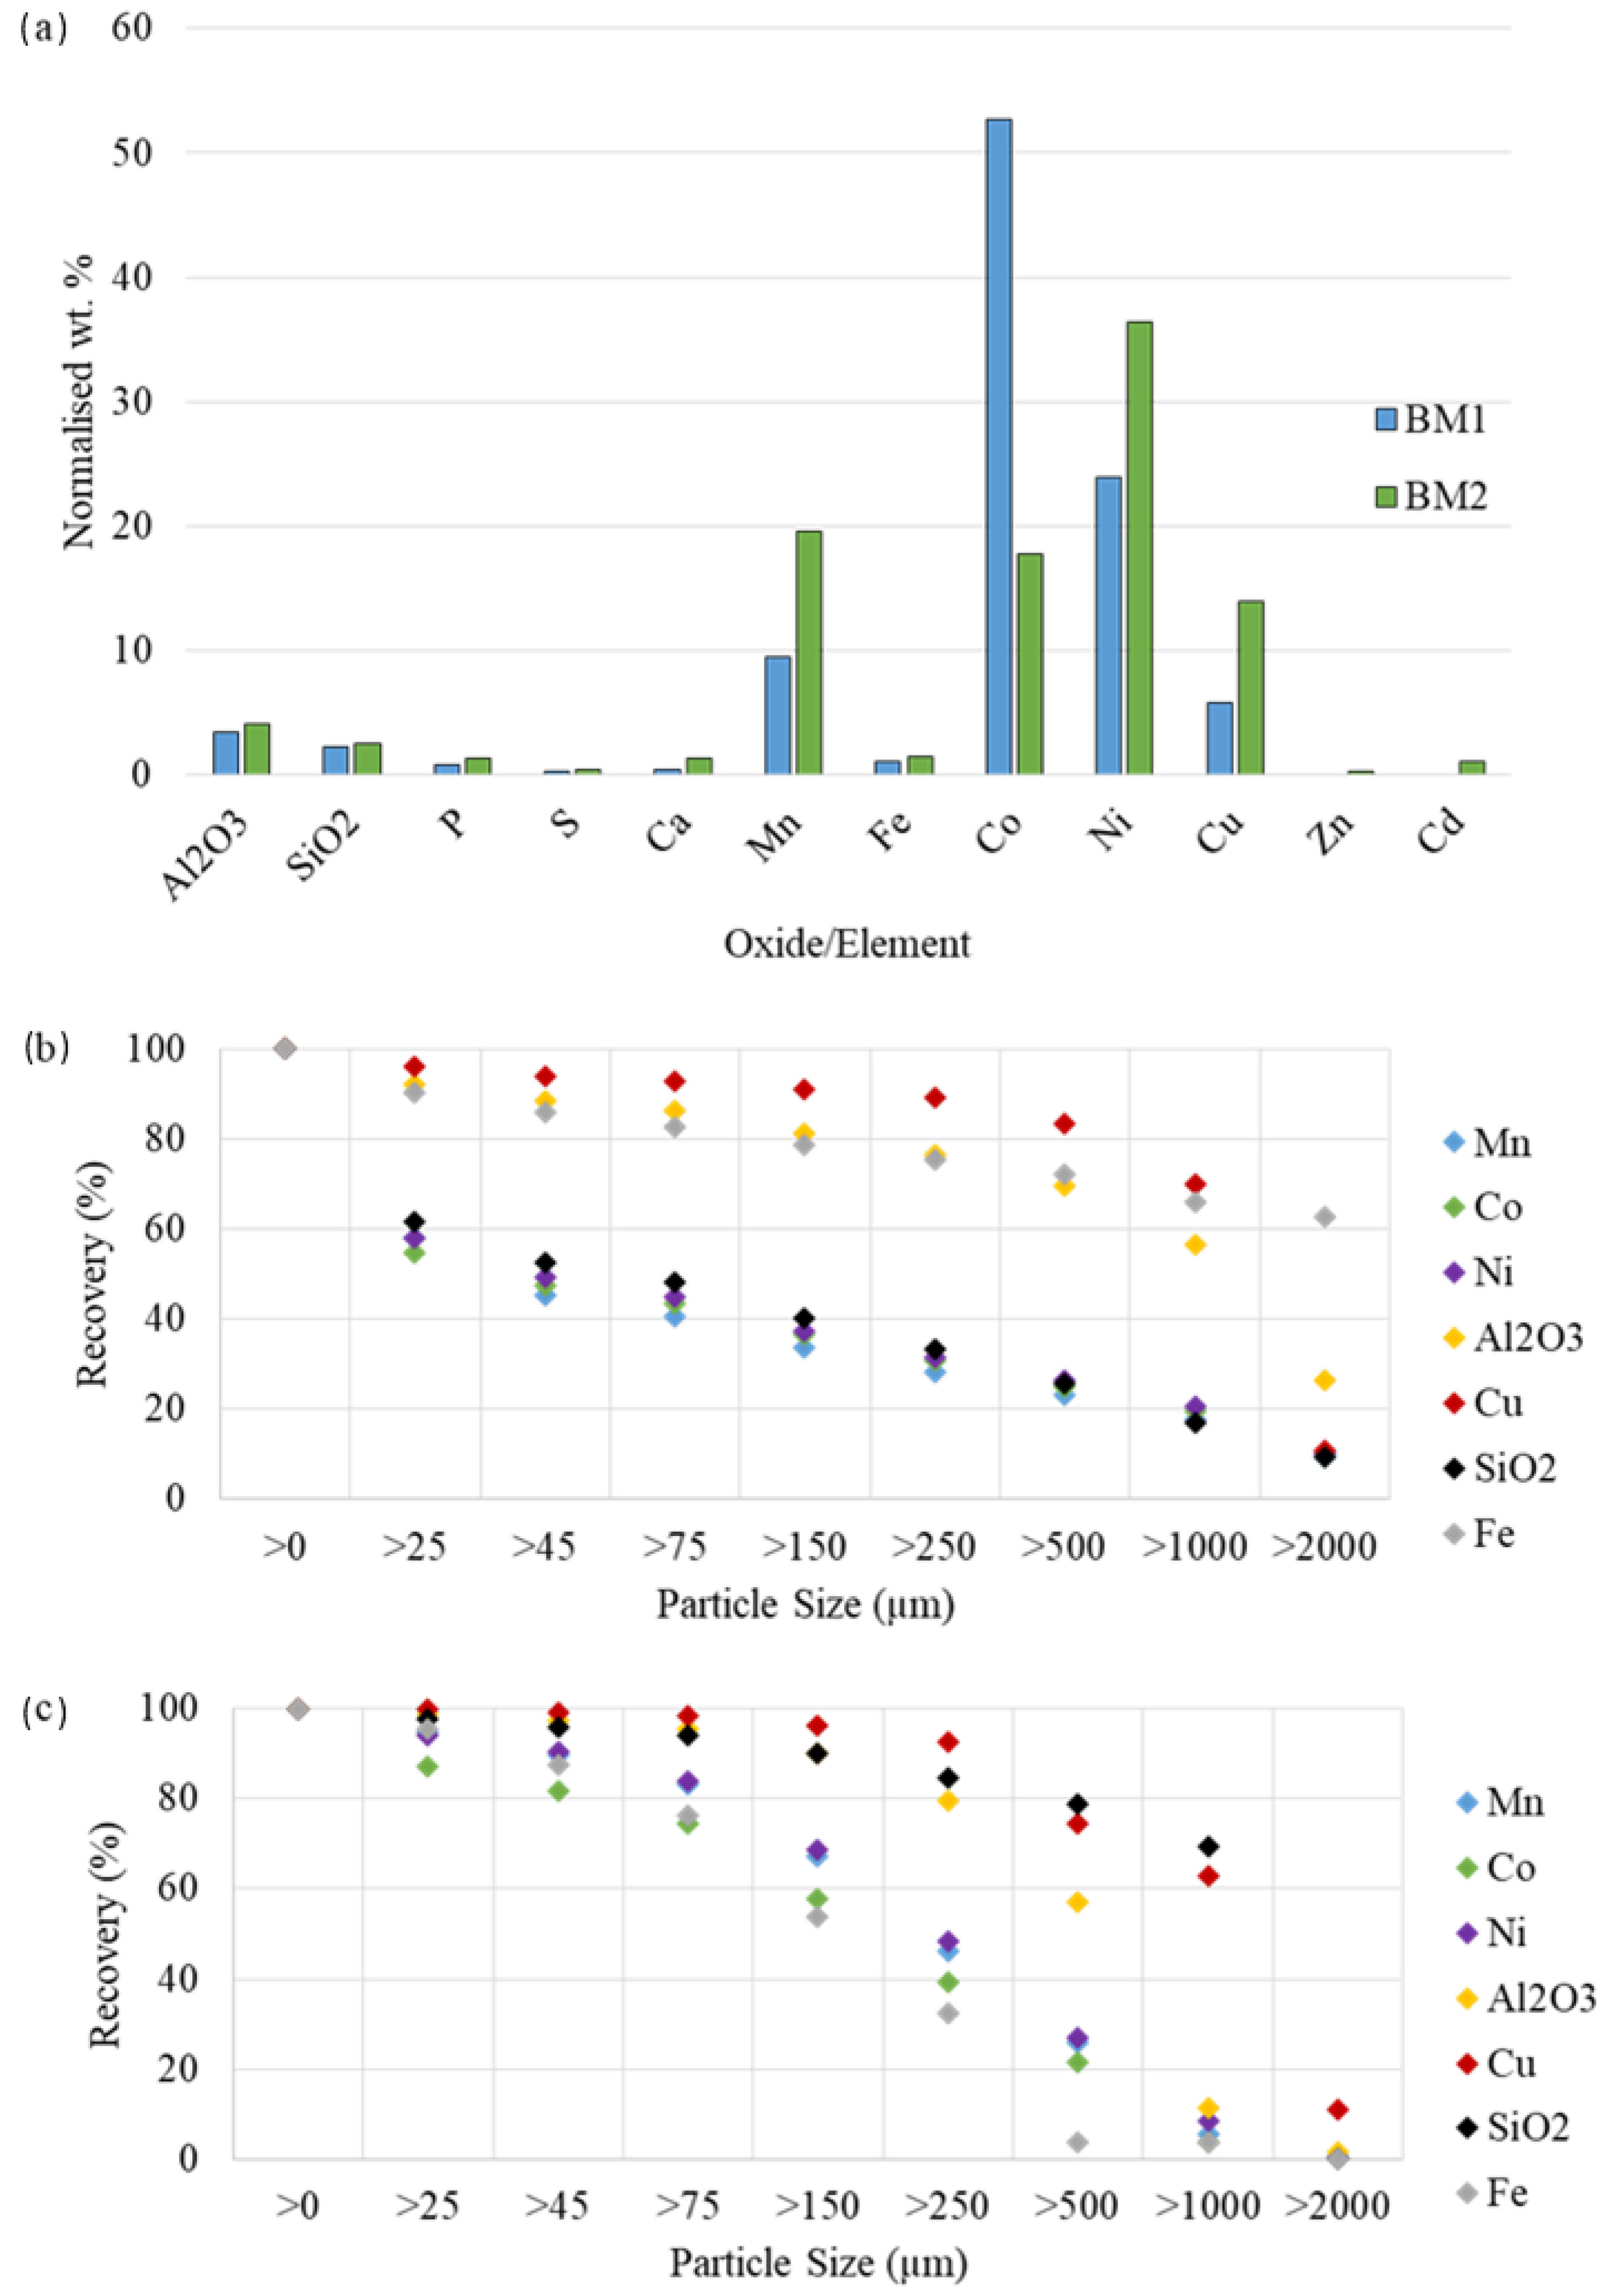
3.1. Characterization of BM As-Received

BM1 and BM2 samples were subjected to comprehensive characterization. The ICP-OES analysis result is given in Table 1 and shows that the BM1 had a higher content of Co compared to BM2, which had higher contents of Ni, Mn, Al, and iron (Fe). The carbon content was analyzed by LECO, and its amount in BM2 was higher than that of BM1. The oxygen associated with cathode metals in addition to the minor content of other oxides such as CaO, MgO, SiO2, and P2O5 were included in the composition of others.
The XRF results using a portable analyzer, as shown in Figure 1a, corroborate the ICP-OES results. The results indicate that the normalized wt.% of Co in the BM1 sample was higher than that of BM2, which confirmed the predominance of LiCoO2 in this sample, as was also observed with petrography and SEM-EDS analyses. The higher percentages of Ni and Mn in BM2 indicated the predominance of LiNiMnCo oxides in this sample. This corresponded to the morphological observations made with petrography and SEM-EDS. Particle size distribution versus recovery graphs, based on the normalized XRF data, are presented in Figure 1b,c. Aluminum (analyzed in the form of Al2O3) and Cu (Figure 1a) were concentrated in the coarser fractions of both BM1 and BM2, because the Al- and Cu foils are ductile and not easily reduced in size during pulverization. Furthermore, Fe was also concentrated in the coarser size fractions of the BM1 sample, while SiO2 was concentrated in the coarser fractions of the BM2 sample. Co, Mn, and Ni were concentrated in the fine fractions of both BM1 and BM2 samples.
The XRD analysis indicated that the chemical elements determined were well-defined in LiNiMnCoO2 phases (LiCoO2, Li2MnO3, LiNiO2) in both grades of BM, as shown in Figure 2. Graphitic carbon was the predominant phase in both cases, while the intensity related to the Co compound LiCoO2 in BM2 was lower than that in BM1. The latter corresponds to ICP-OES and XRF results.
By investigating the morphological structure of BM1 and BM2 using SEM-EDS and petrography, Al and Cu and foils and Cu wires were predominantly found in the larger size fractions, as shown in Figure 3a. The foils were coated with LiMeOx particles, as inferred from the EDS composition rich in Co, Ni, and Mn (Figure 3b) and graphite. Cathode chunks consisted of aluminium foils (Figure 3a), a multitude of small LiMeOx particles composed of lithium cobaltate (Figure 3c), or lithium manganate with variable amounts of Ni and Co (Figure 3d). Liberated LiMeOx particles occurred as fines, while the cathode chunks and fragments were found in the middling size fractions. Anode chunks and discrete graphite particles (Figure 3d) were observed predominantly in the smaller size fractions. C, F, and phosphorus (P) on the surfaces and in between LiMeOx (and graphite) particles were seen as the fingerprint of the PVDF binder (Figure 3c,d). PVDF binder limited the beneficiation of BM, as effective graphite separation techniques, such as froth flotation, rely on surface interactions. Based on shape and color, petrographic analysis of the BM samples revealed three morphological types of LiMeOx particles, and their compositions were established with SEM-EDS analyses. Blue framboidal particles and white framboidal particles were frequently observed in the BM2 sample (Figure 3e) and were composed of LiCoMnNi-, LiMn-, and LiNiCo oxides. Angular particles (Figure 3f), composed of LiCoO2, were dominant in the BM1 sample. Two morphotypes of graphite were identified, namely dense graphite and flake graphite (Figure 3g,h respectively). There was also a miscellaneous category of particles without economic value that included carbonaceous particles (probably organic) that appeared very dark in reflected light but had fluorescence under ultraviolet light, Fe networks encapsulating cathode particles, and Si glass fibers.
The petrographic reflectance analysis results and calculated Raman microspectroscopy results of BM1 and BM2 are listed in Table 2. The raw Raman microspectroscopy data for the G and D peaks (the two major peaks involved in interpreting carbonaceous structure) are listed as supplementary tables. The mean random reflectance of BM1 was higher than BM2, which is an indicator of graphite with different structural ordering. The G D 1   distance for BM2 (average) was smaller than for BM1 due to the low G-band position of the former (1576 cm−1) and, therefore, the presence of larger aromatic clusters [21]. Furthermore, the integrated intensity and FWHM ratios of BM2 (average) are significantly smaller than BM1 due to its broader FWHM and larger integrated intensity of the G peak. These observations indicate that the graphite found in BM1 is structurally more ordered than in BM2. Furthermore, the mean random reflectance of both samples is slightly lower than those reported, for example, for natural graphite from South Africa (6.13) and Poland (6.80) [22,23], but are similar to graphitized coals from China (lowest 4.36) [24]. Regarding the different morphotypes of graphite identified, the maximum reflectance of dense graphite is higher than that of flake graphite in both BM1 and BM2 samples. The maximum reflectance of dense graphite is similar for BM1 and BM2; however, for flake graphite, BM1 is significantly higher than BM2. According to the International Committee for Coal and Organic Petrography’s (ICCP) classification scheme for graphite, semi-graphite, natural coke, and natural char [25], the BM1 dense and flake graphite types and the BM2 dense graphite type are classified as graphite, while the BM2 flake graphite type is classified as semi-graphite. The Raman microspectroscopy data shows more disorder spectra for the BM samples than natural graphite spectra from elsewhere [26]. Four different types of Raman microspectroscopy spectra were observed (Figure 4). Types A and B indicate a disordered carbonaceous structure, while types C and D correspond to a more organized carbonaceous structure (albeit not graphitic). The as-received samples predominantly hosted Type A graphite particles.

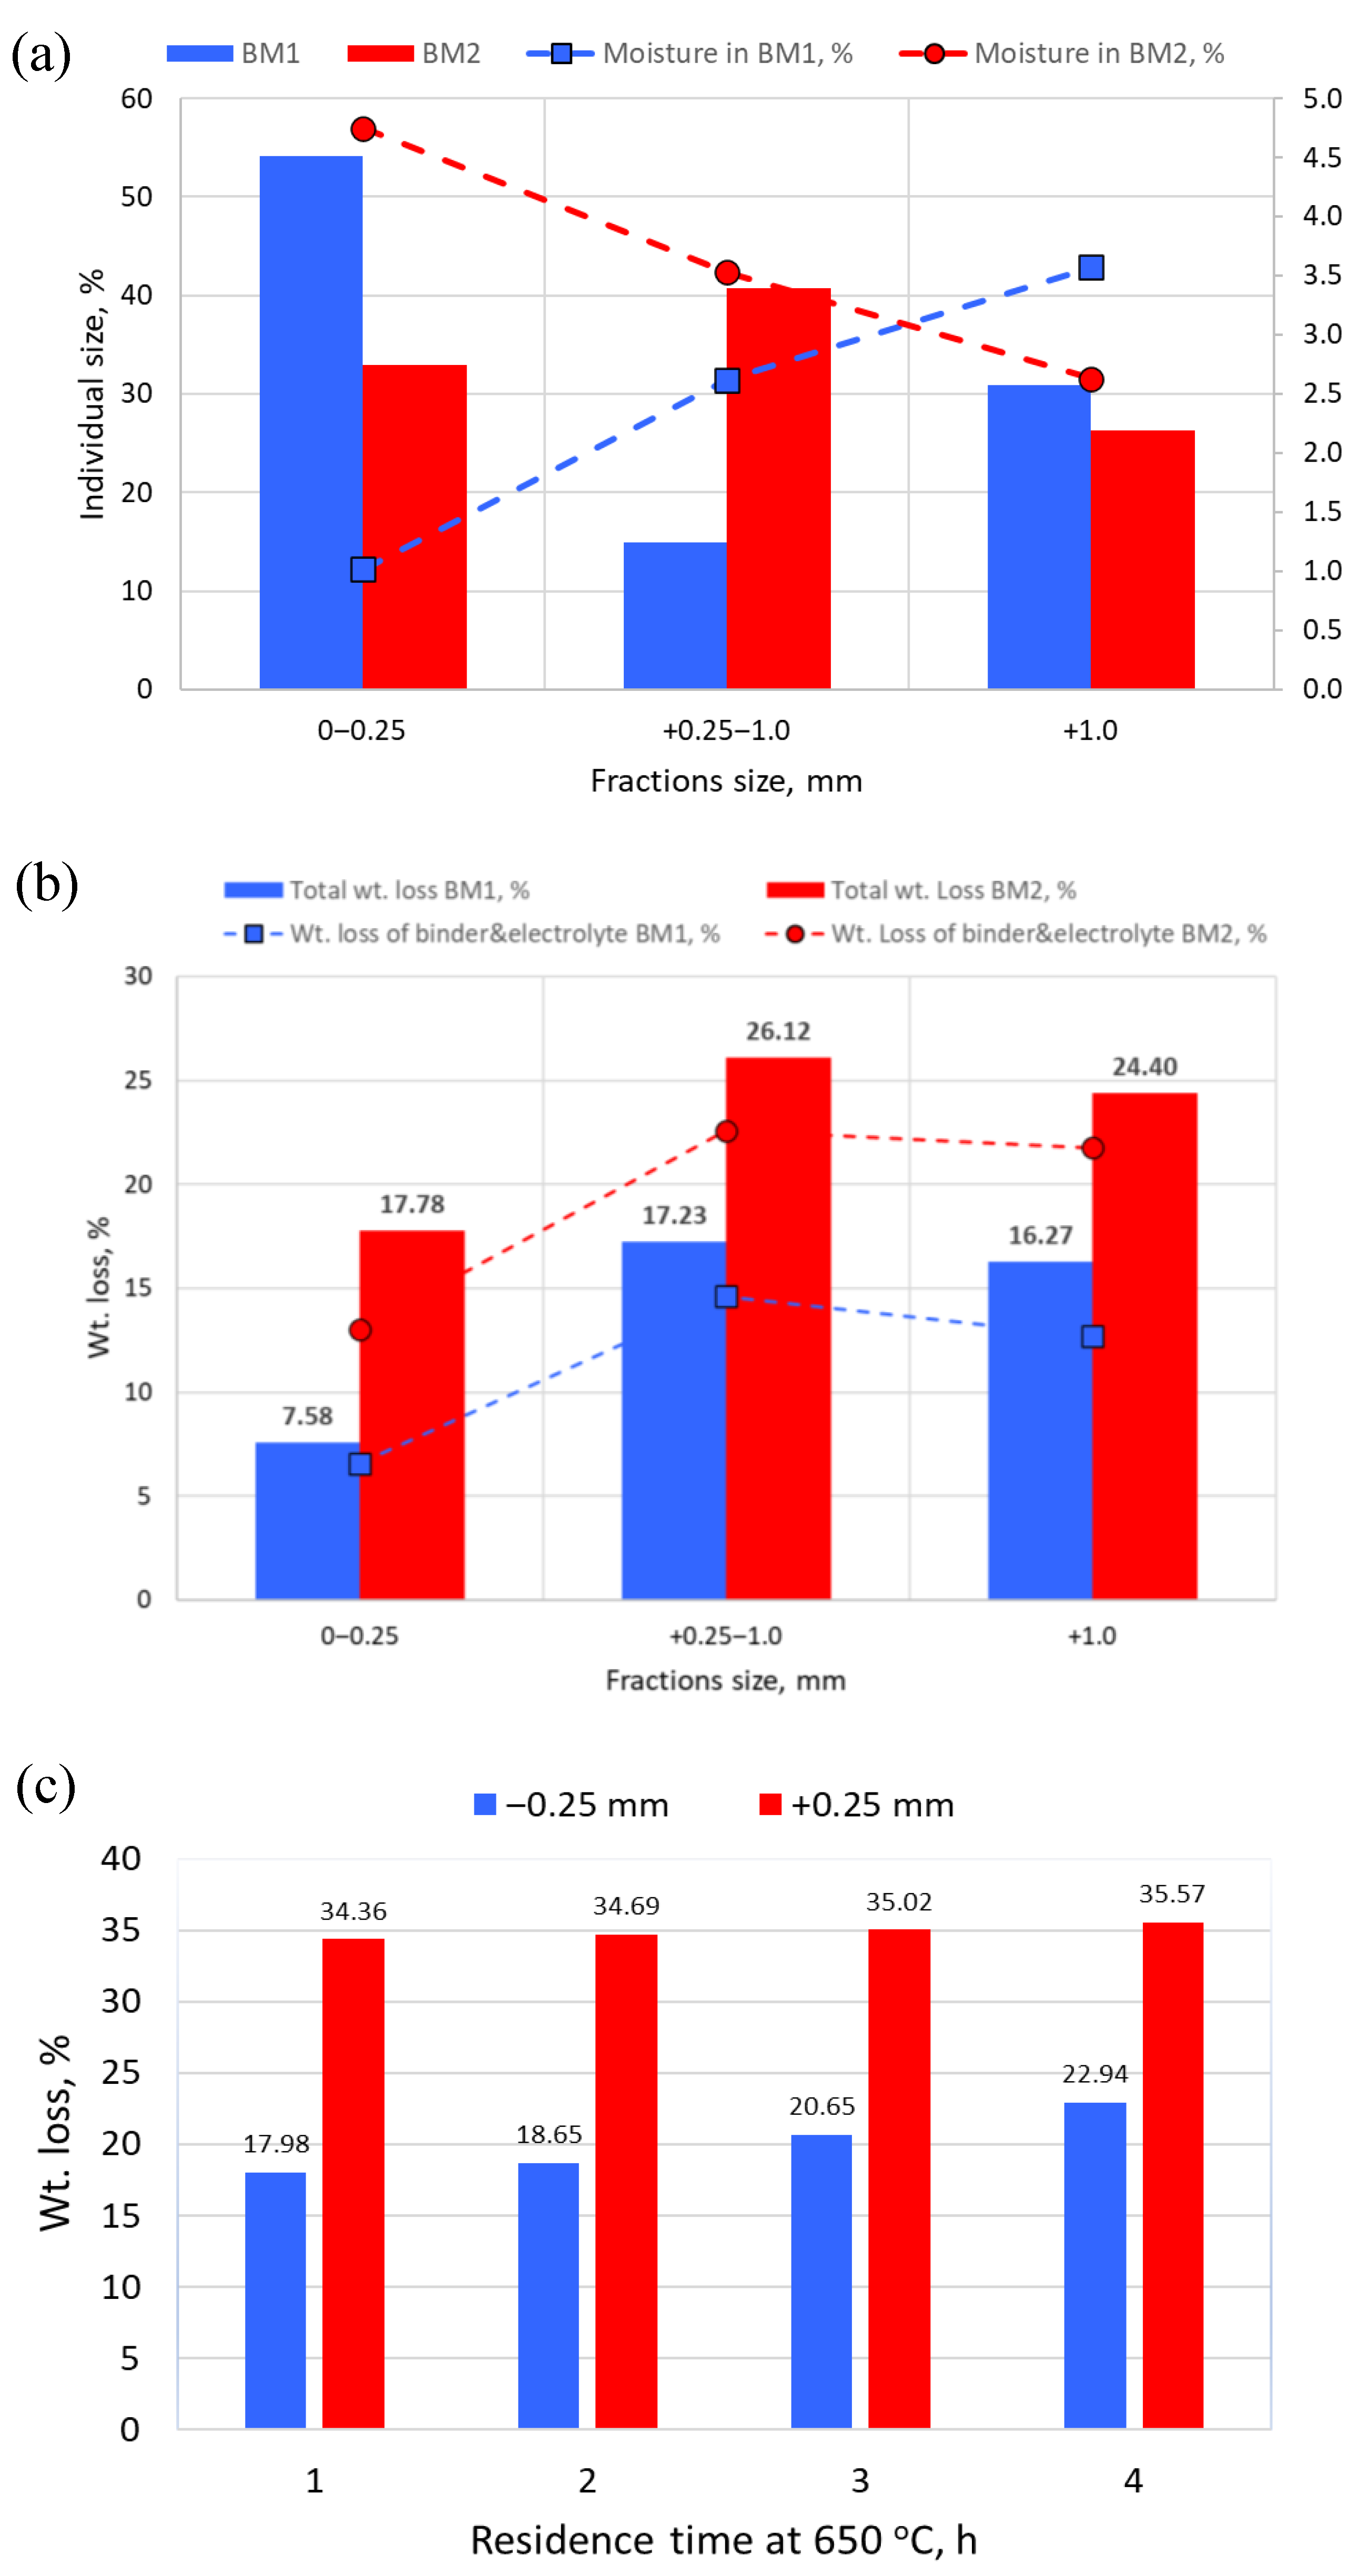
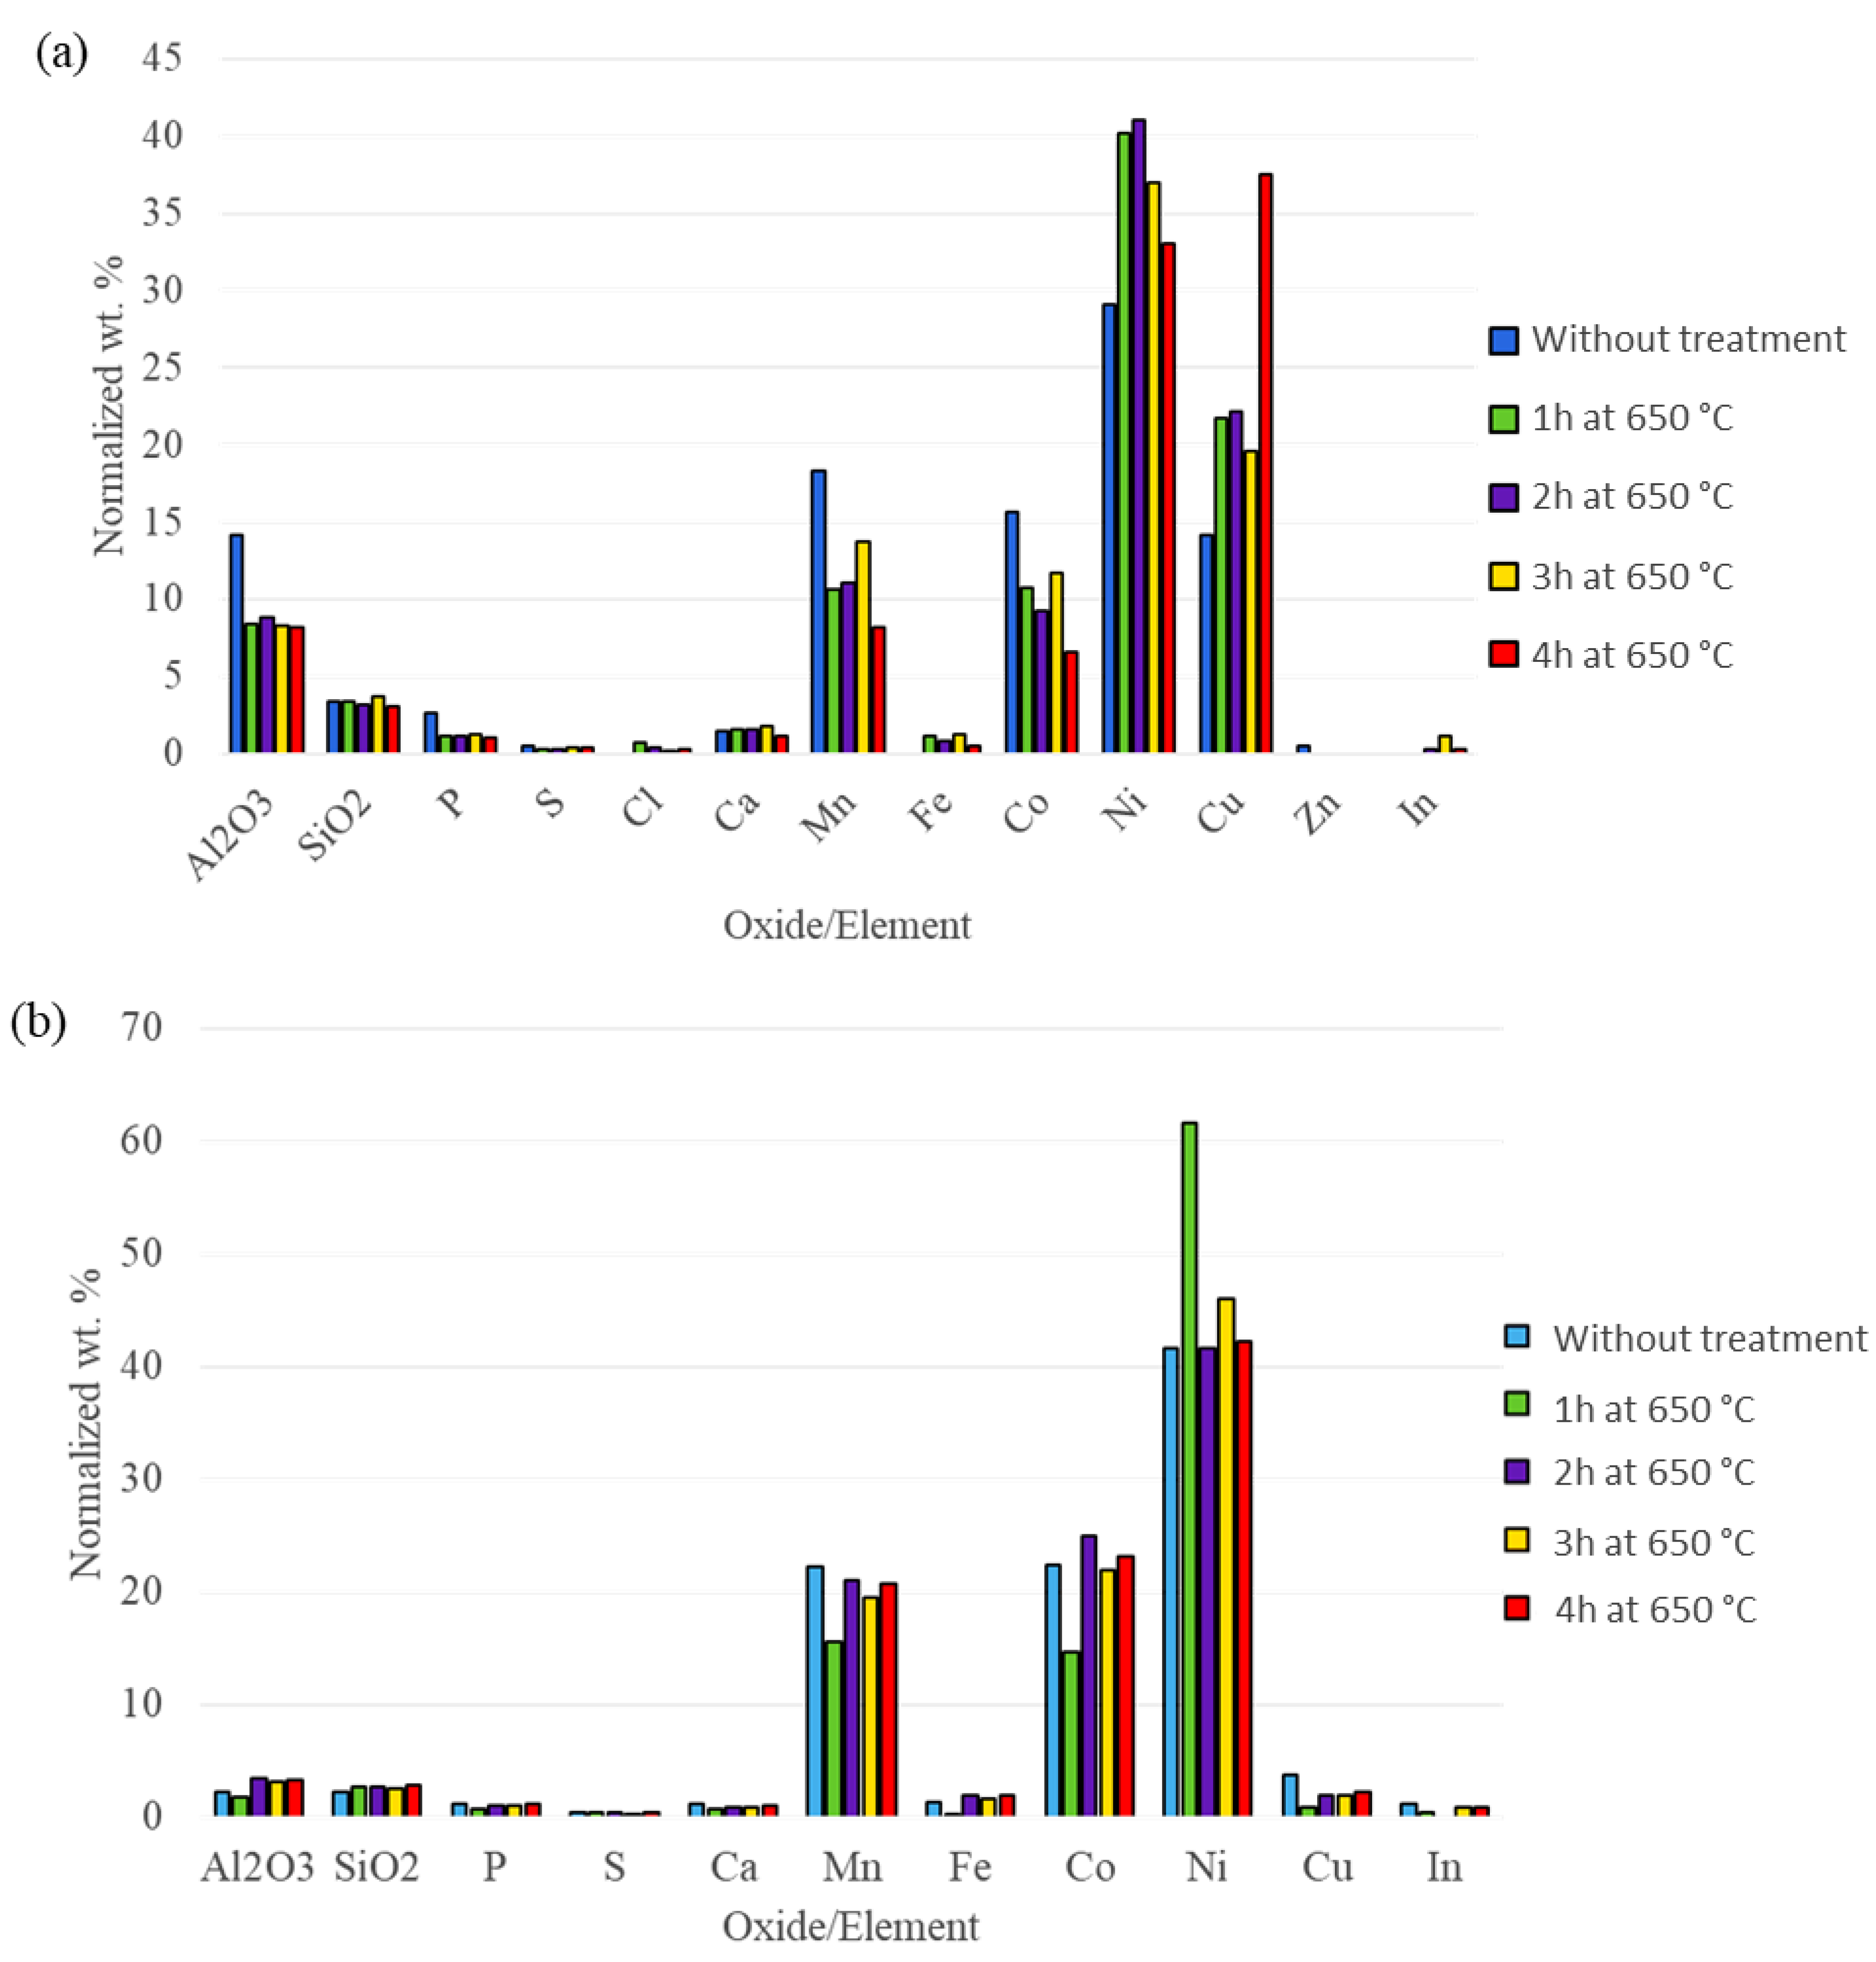
3.2. Effect of Temperature on Mass and Chemical Composition

TGA-DSC analysis was used to study the thermal behavior of BM1 and BM2, as shown in Figure 5 and Figure 6, respectively. The BM1 showed a gradual decrease in mass when heated to 650 °C, and after that, a significant mass loss occurred up to 750 °C when the BM1 was heated in air and up to 850 °C when the BM1 was heated in N2, as shown in Figure 5a,b, respectively. The total mass loss was around 43% in air and 33% in N2. The gradual decrease in mass from room temperature to 650 °C can be attributed to the decomposition of organic compounds, while the sharp increase of mass at temperatures higher than 650 °C can be attributed to the reduction of LiMeOx. The higher mass loss obtained by heating the BM1 sample in the air compared to that in an N2 atmosphere can be attributed to the partial gasification of graphite.
For BM2, a 68% mass loss was obtained in air, as shown in Figure 6. The XRD analysis of the residues after the TGA test indicated the disappearance of graphite and the main LiMeOx phases left in the sample were Al2O3, Li2O, NiO, MnO2, and Co3O4.
XRD analyses conducted on BM1 and BM2 at different temperatures (from room temperature to 900 °C) showed a decrease in the intensity of the peaks at 26.5°, 43.3°, and 54.9°, starting approximately at 500 °C—as shown in Figure 7a,b, which represents the signals emitted by graphitic carbon. The consumption of graphitic carbon and organic substances during heating promotes the formation of volatile species (CO and CO2). The presence of CO and CO2 in the off-gas analyzed by gas chromatography inside the heated chamber confirmed that a carbothermic process took place. In particular, for BM2, the main peaks (dashed lines) attributed to the LiMeOx (LiCo, LiNi and LiMn oxides) decreased their intensity in favor of the formation of their corresponding metals; see Figure 7b.

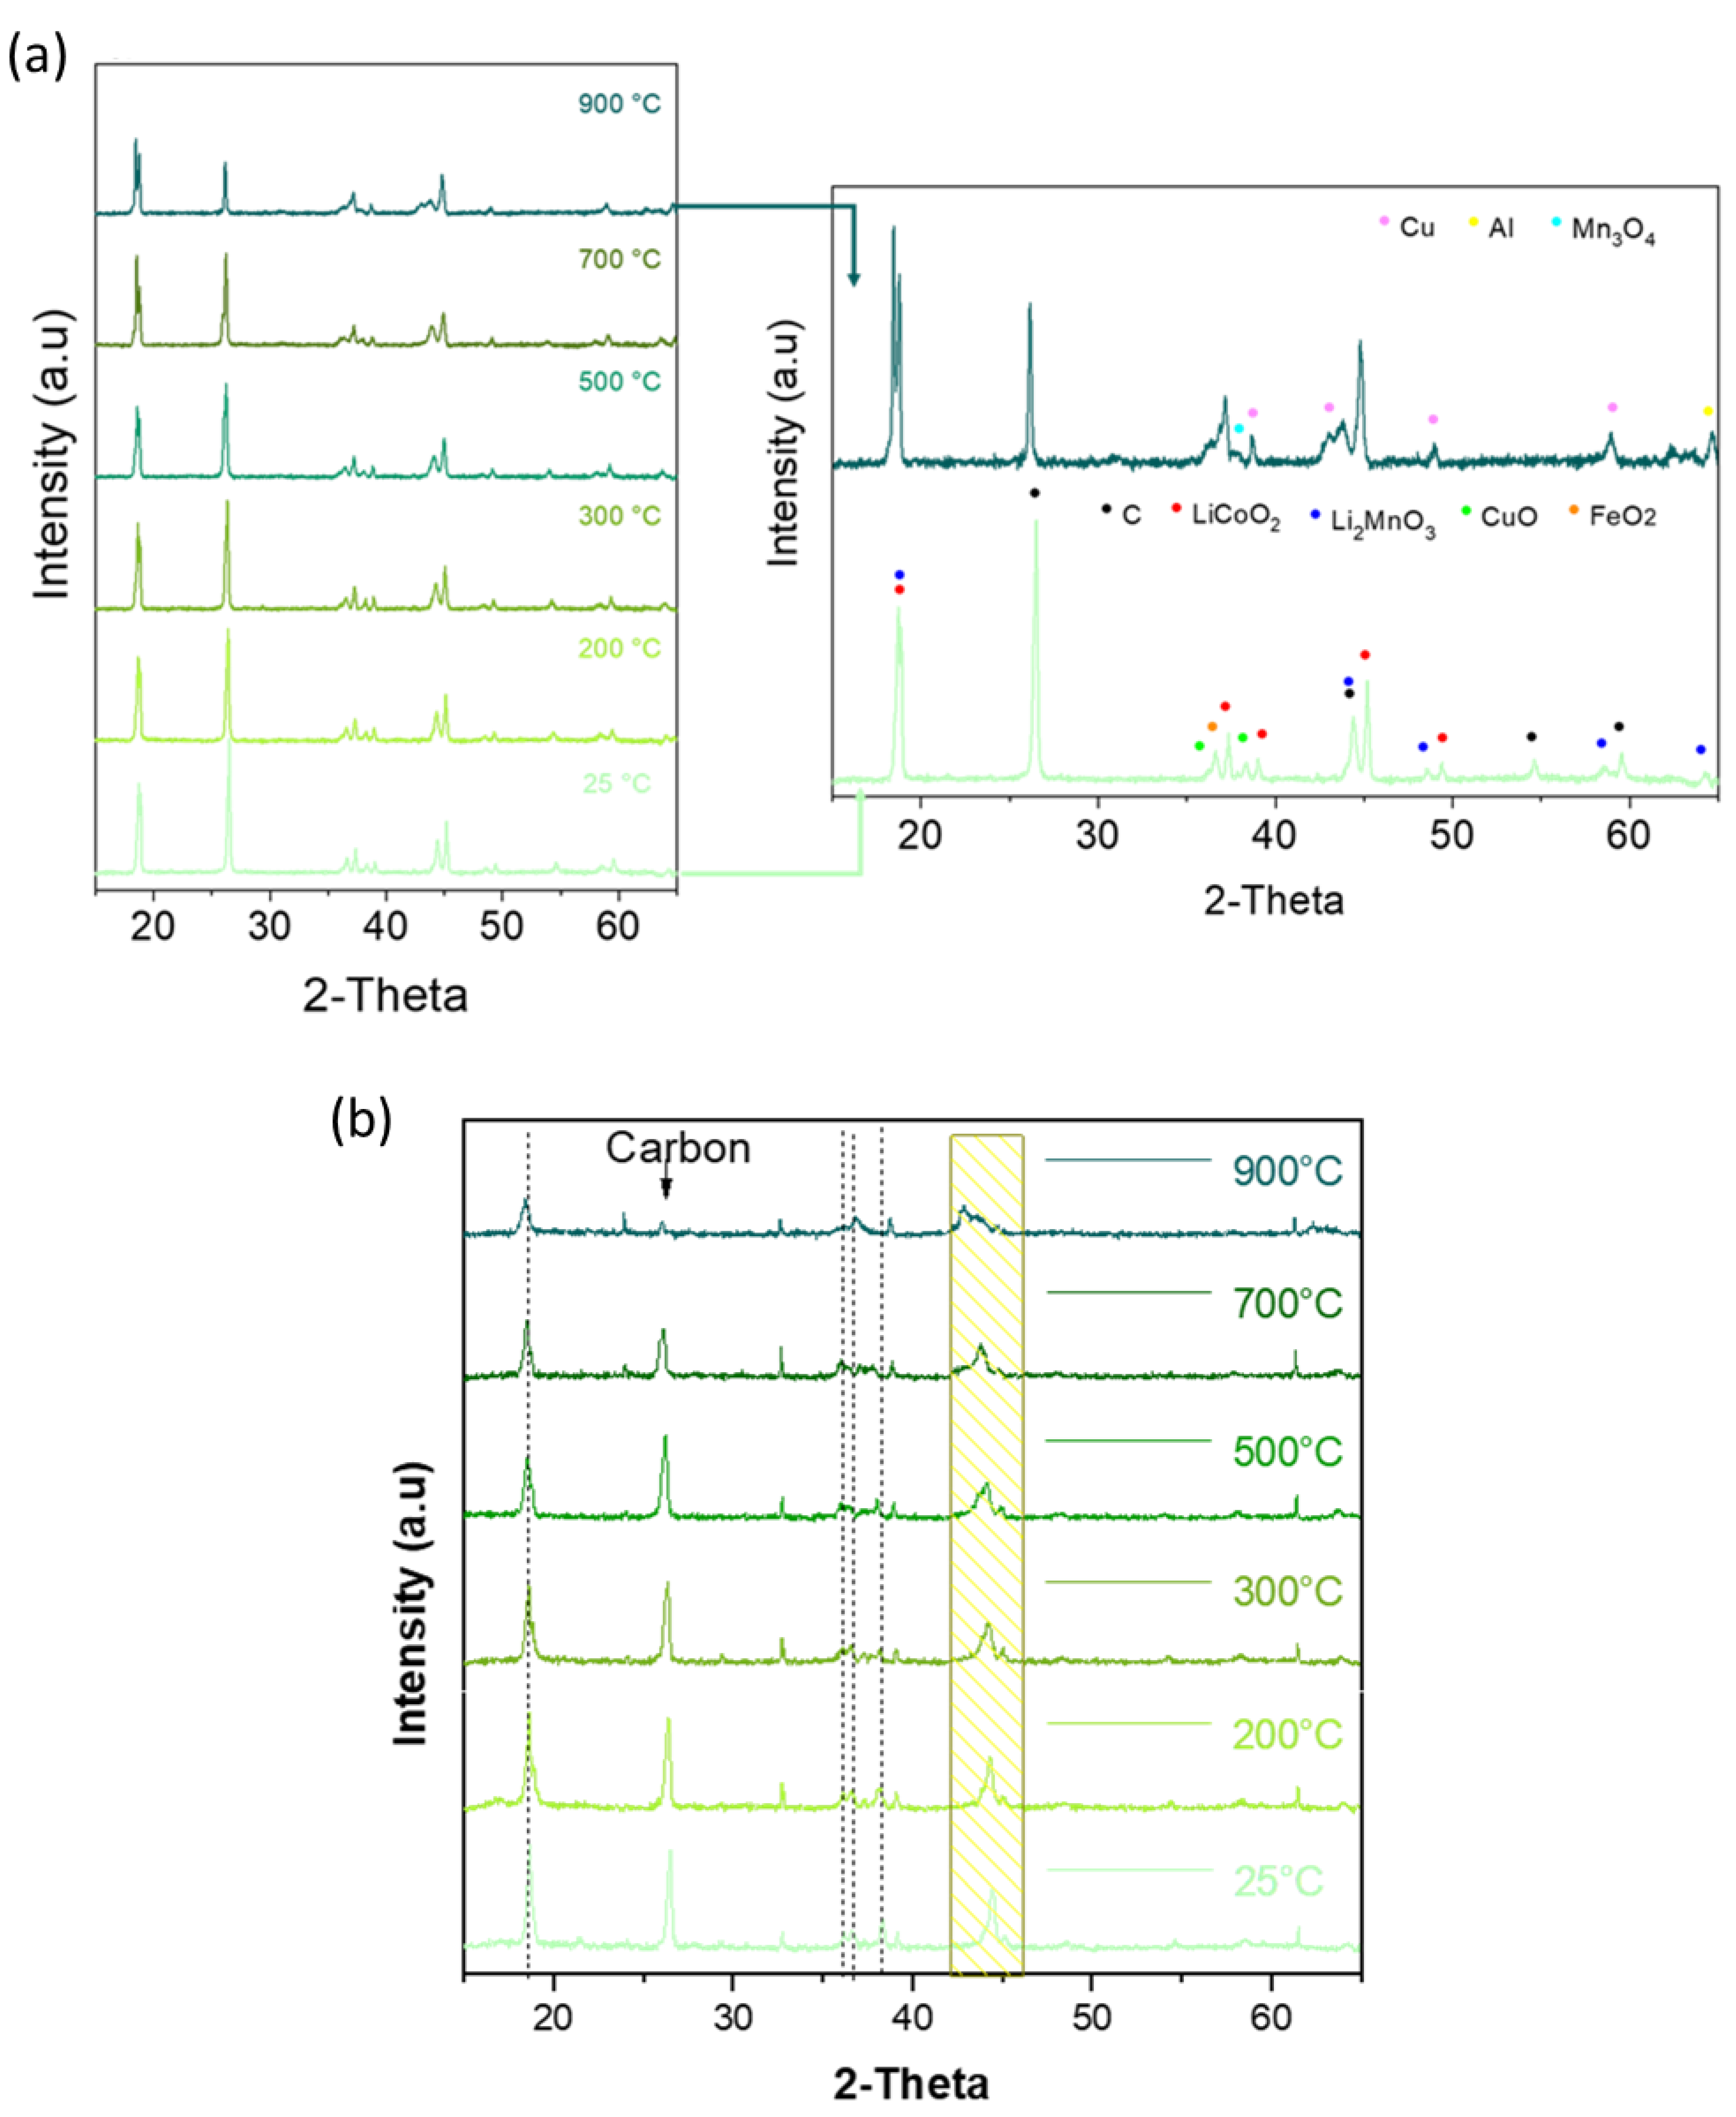
3.3. Heat Treatment of BM

As discussed in previous sections, graphite represents the main component in the BM samples, and its separation from LiMeOx is very complicated. Thermal treatment can help to some extent to destroy the organic binder (most probably PVDF), enabling better separation of graphite and the LiMeOx. To understand the effect of thermal treatment on the morphological structure and binder removal of BM, both grades of BM (BM1 and BM2) were subjected to pyrolysis. Before thermal treatment, the BM samples were dried at 105 °C and then sieved into different size fractions (0–0.25 mm, +0.25–1.0 mm, and +1.0 mm). Visually, it is possible to see that large particles of Cu- and Al foils are concentrated in the coarse fractions, while graphite is concentrated in the finer fractions. The size distribution of each sample is given in Figure 8a, which shows that the distribution of BM1 is shifted towards the finer (0–0.25 mm) and higher middle fractions (+1.0 mm) compared to BM2. In addition, the moisture content was lower in the finer fractions of BM1, and it increased with an increase in particle size, while the opposite was seen in BM2.
The heat treatment of the BM samples was conducted in a Nabertherm muffle furnace in two stages. In the first stage, the three fractions (−0.25 mm, +0.25–1.0 mm, and +1.0 mm) of BM1 and BM2 were heated from room temperature to 550 °C under an N2 atmosphere with a heating rate of 10 °C/min. The samples were kept at 550 °C for 15 min and then cooled to room temperature. In the second stage, only BM2 (−0.25 mm and +0.25 mm) was heated to 650 °C under an N2 atmosphere, and the residence time was varied (1 h, 2 h, 3 h, and 4 h). The thermal treatments at 550 °C and 650 °C were selected based on the TGA results (see Figure 5b and Figure 6), which showed endothermic peaks at this range of temperature. The maximum temperature of thermal treatment was set at 650 °C to avoid the melting of aluminum, which takes place at 660 °C. Previous findings reported by Wang et al. [27] indicated that the effective thermal decomposition of PVDF occurred at 500 °C, while Fu et al. [28] stated that the decomposition of PVDF occurred in the range of 400–550 °C.
Figure 8b shows the mass loss of the different fractions of BM1 and BM2 after thermal treatment at 550 °C for 15 min. The finer fractions (−0.25 mm) showed the lowest mass loss in both types of BM followed by the coarsest fraction (+1.0), while the highest mass loss was exhibited by the middle fraction (+0.25–1.0 mm). By excluding the moisture content from the mass loss, the remaining mass loss was mainly related to the evaporation of electrolyte and the thermal cracking of the binder and plastics in the BM. During heating, fumes started to form at 350 °C, and they became intensive at 450–550 °C. The generated fumes were higher in BM2 than in BM1, which is in line with the obtained mass loss shown in Figure 8b.
By treating the BM2 at 650 °C, the mass loss was slightly increased, with an increase in residence time for the coarser fractions (+0.25 mm), while the increase was more notable for the finer fractions (−0.25 mm), as shown in Figure 8c. The mass loss was higher compared to that obtained at 550 °C for 15 min, which was 13.03% and 22.18% for the finer and coarser fractions, respectively. This may be explained by the higher amount of Cu- and Al foils and coarser fragments of casing plastics in the coarser fractions and the lower amounts of cathode materials, which do not react or would have needed time to do so, whereas in the fine fractions, the higher temperature may have led to higher cracking reactions of the binder, the plastics, and the decomposition of LiMeOx and aluminates. These hypotheses seem to be confirmed by the morphologic and structural transformations observed in the BM components.

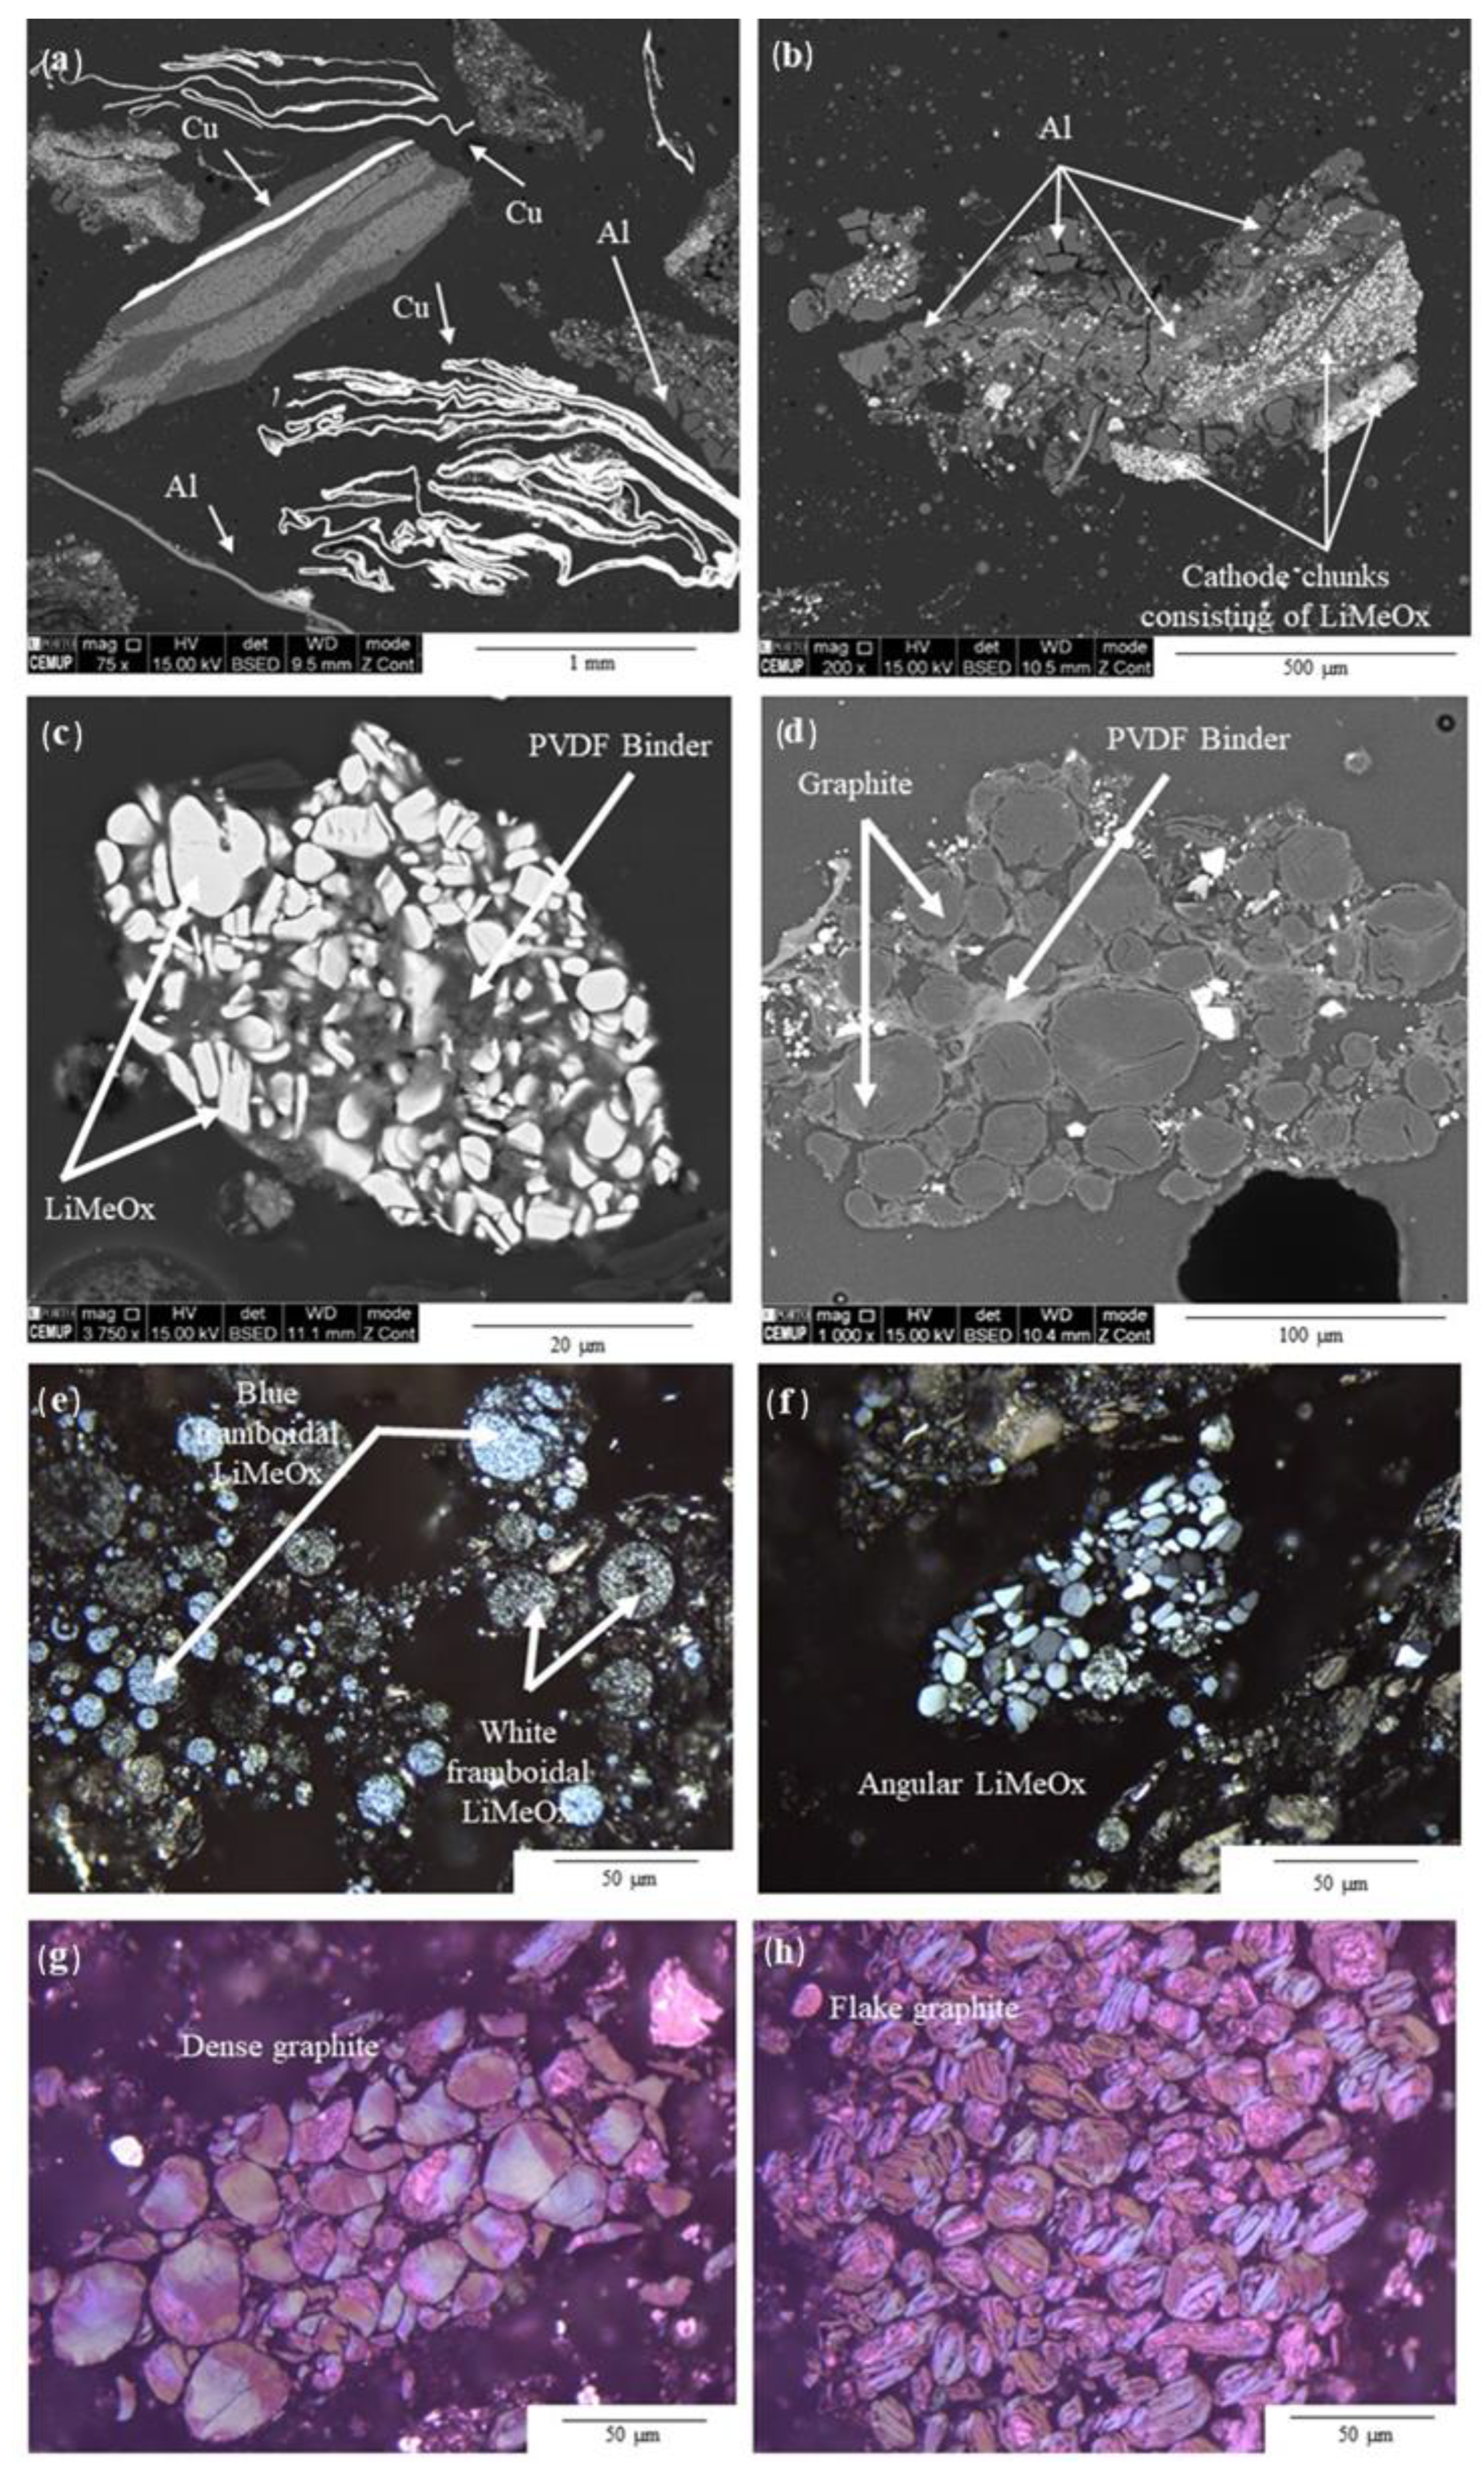
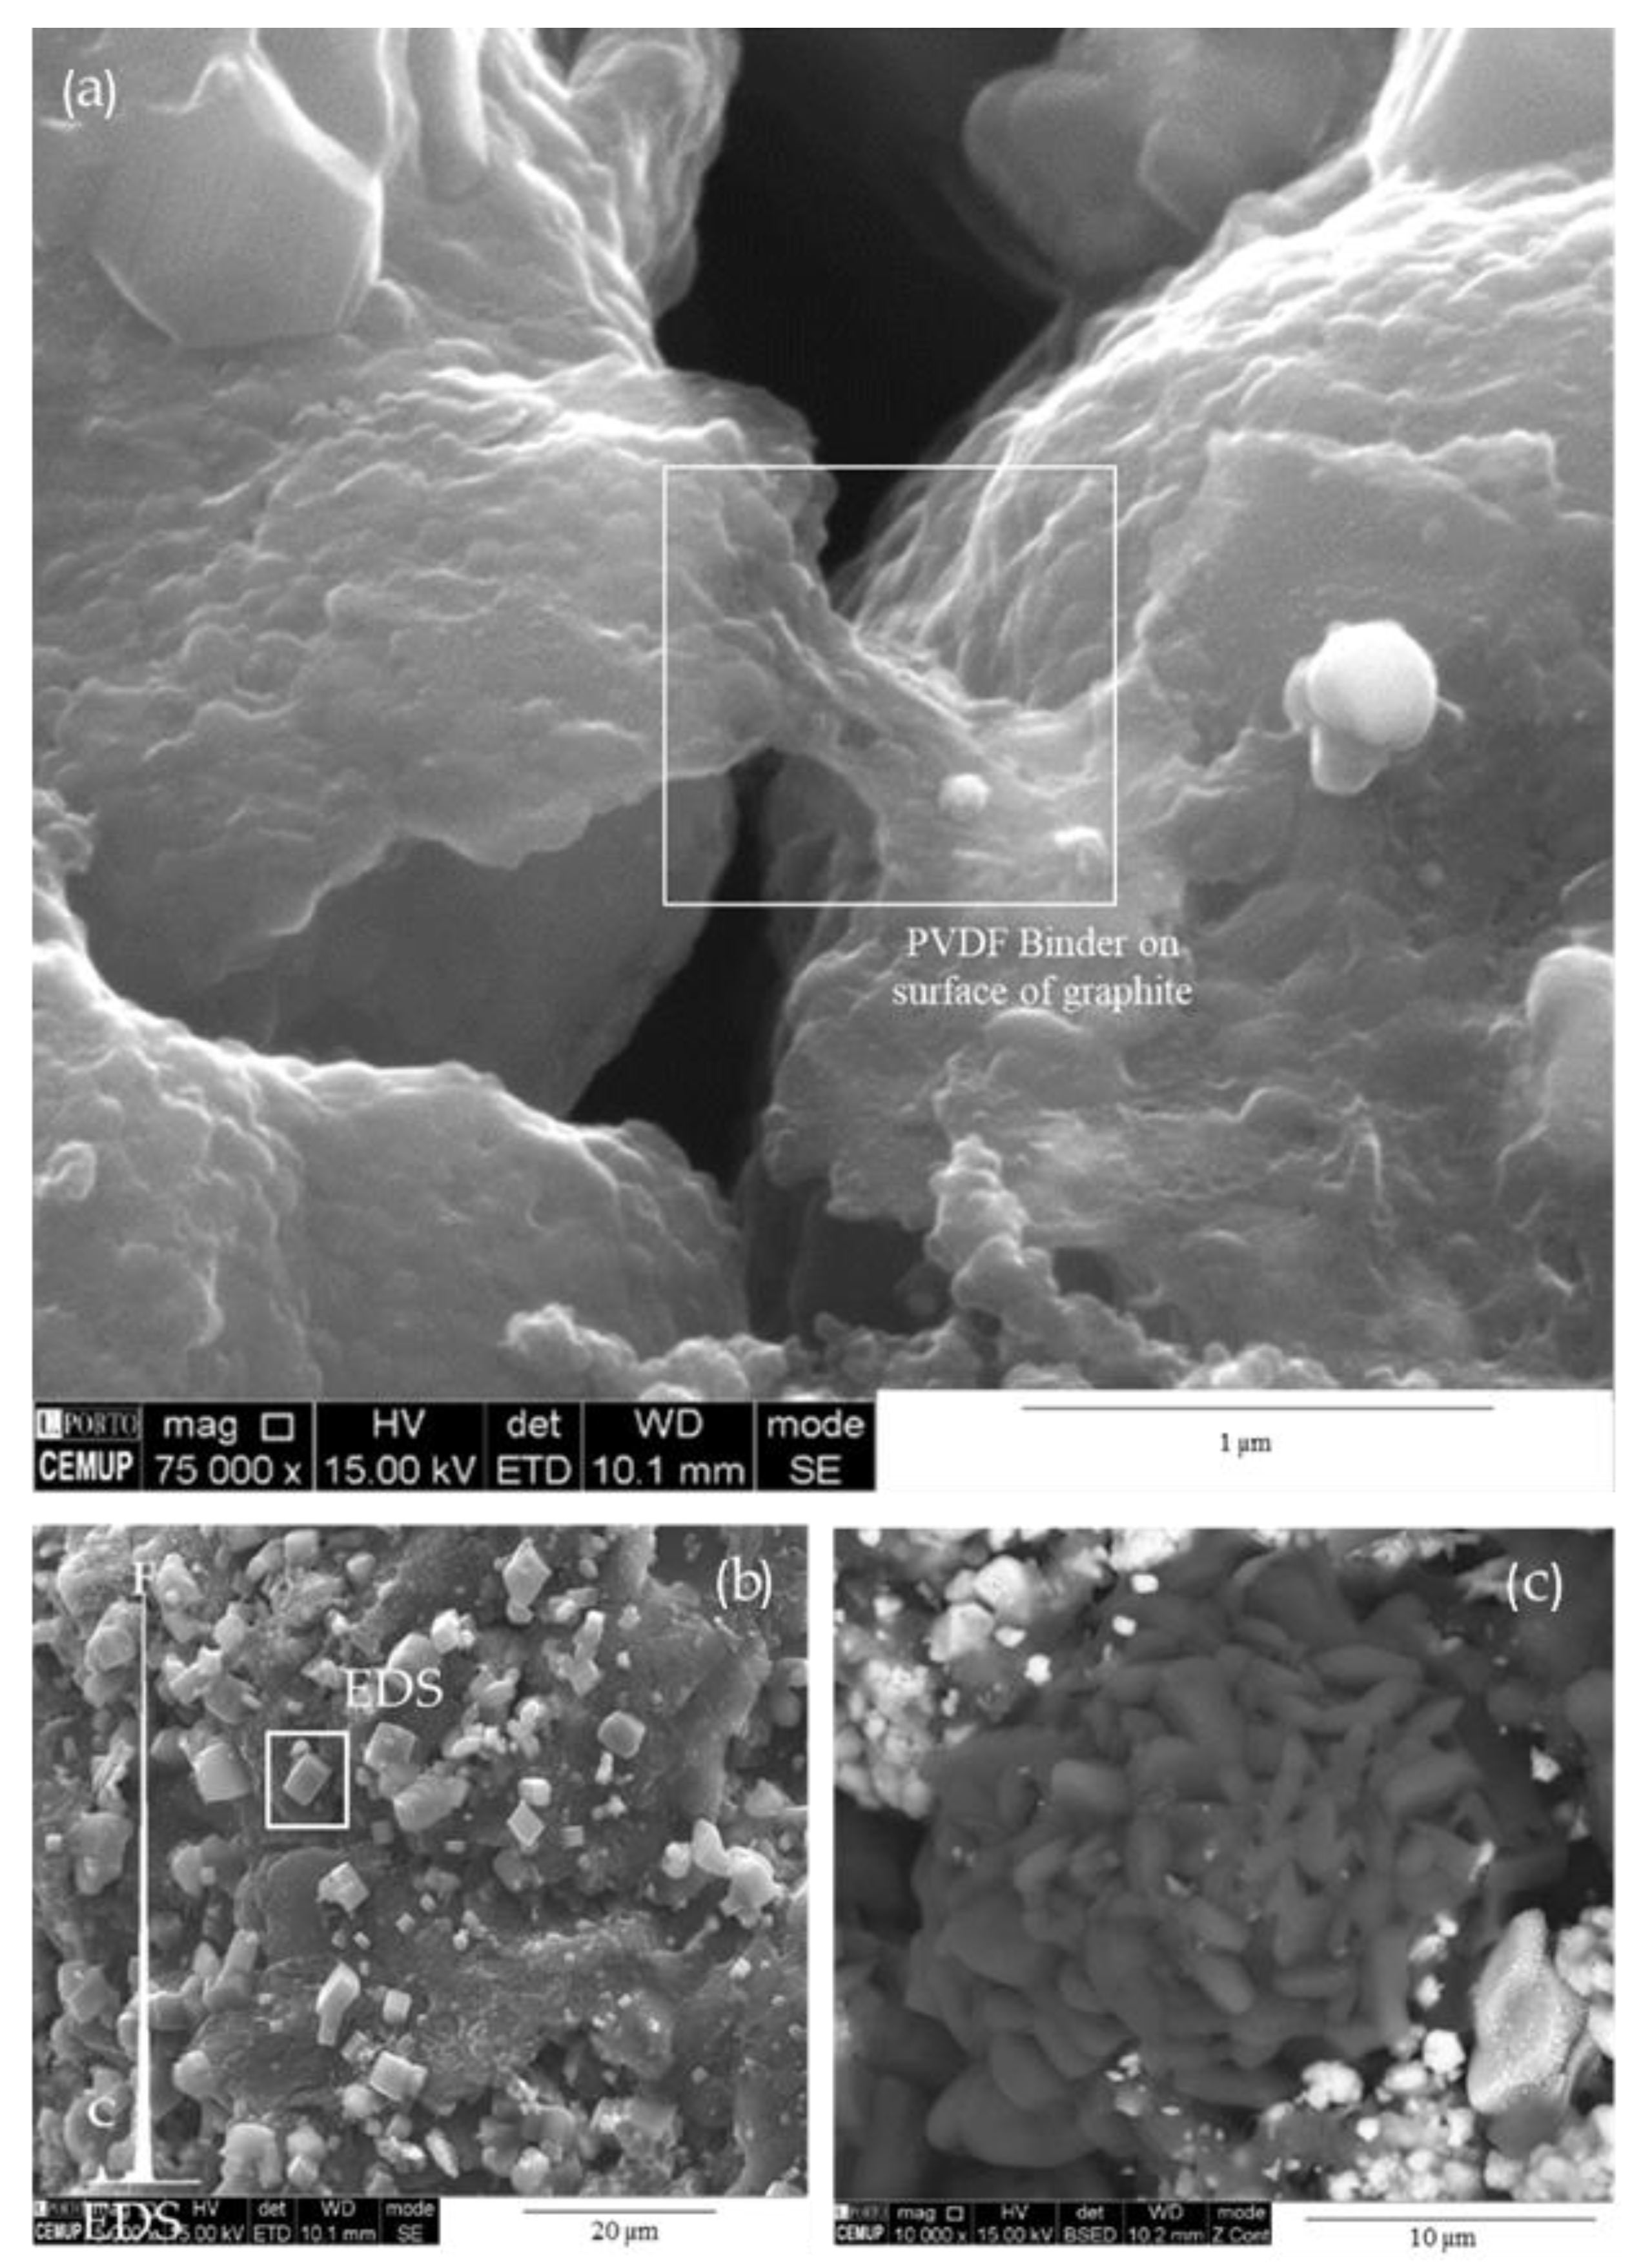
3.4. Morphological and Chemical Characterization of the BM after Pyrolysis

3.4.1. Binder and LiMeOx Morphological and Chemical Transformation

The surfaces of Al- and Cu foils in both BM1 and BM2 were altered by thermal treatment, i.e., micrometric cracks formed at elevated temperatures and LiMeOx was progressively removed with an increase in thermal residence time (Figure 9a,b). The latter is due to the partial removal of PVDF. The LiMeOx in both BM samples was also affected by thermal treatment. Along with an increase in thermal residence time, a decrease in cathode compaction was seen (Figure 9c–e). This was due to the partial removal of PVDF and also due to the decomposition of LiMeOx with temperature. When considering the different morphologies of the LiMeOx described previously, the shape and internal structure changes indicate that these lithium metal oxides were partially decomposed (Figure 9f,g). It was also found under reflected light microscopy that the blue framboidal particles lost their blue color and, together with the white framboidal particles, became more deteriorated upon thermal treatment.
The EDS spectrum in Figure 9f,g shows high Mn peaks in the former and weak Mn peaks and high Ni and Co in the latter, and in both cases, the C peak decreased. This cannot be correlated to the decrease in Ni, Mn, and Co as seen in Figure 10, but a relative enrichment or depletion of an element depended on the behavior of other elements. However, the decomposition of the LiMeOx grains might corroborate the loss of these elements, which may have then been carried out in the gas flow, corroborating the XRD results since the Li metal oxides were depleted after the thermal treatment, and the elements Mn, Ni, and Co formed the respective metals. Further point analysis using SEM-EDS of BM2 after pyrolysis at 650 °C for 4 h is given in the Supplementary Material (Figures S1 and S2).
Graphite seems not to be affected as much as the foils and LiMeOx by thermal treatment. In both BM samples, a slight decrease in anode compaction was seen with thermal treatment, but it was not as pronounced as in the case of the cathode chunks. Along with the increase in thermal residence time, the graphite particles seemed to agglomerate with some white and very shiny particles. This phenomenon might be due to melting and recrystallization.
It was expected that the chemical structure of the PVDF binder attached to the cathode and anode particles would crack upon thermal treatment. However, it was found that in both BM samples, binder remained (Figure 11a), and F was concentrated in cuboids embedded in carbonaceous residue, referred to as char (Figure 11b). This phenomenon can be ascribed to the cracking of PVDF and the evolving of light C–H and C–O, leaving behind C–C–P–S (char), C–F, and the newly formed F cubic crystals. Another type of newly formed minerals were dark framboids (under SEM-BSE mode) composed of C–O, and it is suspected that they are carbonate crystals formed at LiMeOx surfaces under a CO-rich atmosphere (Figure 11c).

3.4.2. Graphite Optical and Physical Transformations

The results of the petrographic graphite reflectance are given in Table 3, and Raman microspectroscopy analyses results are presented in the Supplementary Materials (Tables S1–S3). When considering the differently sized fractions heated to 550 °C for both BM samples, it was seen that the smaller graphite particles had higher mean random and maximum reflectance values than the larger particle sizes. The Raman microspectroscopy analysis showed that the coarse particle sizes predominantly hosted Type A graphite particles. The fine particle sizes mainly had Type B and Type C graphite particles. An increase in thermal residence time in the BM2 sample led to an increase in mean random and maximum reflectance until a maximum was reached; thereafter, it decreased again. This maximum was normally reached at 1 or 2 h. In certain trials, a subsequent spike at 4 h was noted. The Raman microspectroscopy analysis showed that Type B and Type C graphite particles were mainly found in the samples exposed to a prolonged residence time (>1 h). Flake graphite morphological type always had a lower maximum reflectance than the dense graphite morphological type.

3.5. Gas Release from the BM under Pyrolytic Conditions

As described previously in Section 3.3, intensive fumes were formed during the heat treatment of BM2 at 450–550 °C. It is known that the reduction reactions between LiMeOx and graphite cannot take place at such low temperatures. It is therefore believed that the fumes come from the evaporation and/or decomposition of the leftover electrolyte components and the decomposition of organic binder (such as PVDF) and separator (such as PP). By employing a home-made reactor and following a similar procedure as that reported in a previous study [15], the gas released from the BM samples (500 g in a batch), under three different pyrolytic temperatures, namely 120 °C, 300 °C, and 500 °C, in an N2 atmosphere, were analyzed by a multicomponent mass spectrometer. The observed mass losses were 1.3%, 17.8%, and 26.5% at 120 °C, 300 °C, and 500 °C, respectively. The results from the mass spectrometric analysis indicate that various gas species were released during the pyrolytic treatment of the BM. These gas species include electrolyte compounds (such as dimethyl carbonate (DMC) and diethyl carbonate (DEC)), oxygenated hydrocarbons (such as CH2O), hydrocarbons (such as CH4 and C6H6), and other miscellaneous gases (such as HBr, C2N2, HCN, and POF3). The similarity of the gas species released from the BM and those released from LIBs cells reported in another study [15] can mainly be attributed to the similarity in organic compounds in the LIBs cells, which are mainly composed of volatile organic compounds (VOCs), conductive LiPF6 salt, organic binder (notably PVDF), and organic separator (such as PP). Even though most of them could have been released or liberated during the mechanical treatment process for producing BM, some of them could still be left and entrapped in the BM, especially when considering the fineness of the achieved BM. Furthermore, it was observed that the concentrations of the formed gases increased with an increase in the process temperature. This is mainly because a higher temperature can kinetically accelerate the evaporation of VOCs and the decomposition of PVDF and separator materials, as well as the chemical reactions among the derivatives formed from the evaporation and decomposition products. A higher concentration of formed gases at higher temperatures can also be correlated to a higher mass loss. The quantitative data of gaseous species that have been detected by mass spectrometry during the thermal heating of black mass were described elsewhere [15]. The formation of gas species necessitates the need for safety countermeasures during the transportation of end-of-life LIBs and using them as feedstock in the pyrometallurgical and/or hydrometallurgical treatment process.

4. Conclusions

In this study, two different grades of BM were thermally treated and fully investigated in terms of chemical composition and morphological and mineralogical structure. The main findings can be summarized as follows:
  • LiMeOx occurs in the smaller-sized fractions as blue and white framboidal morphologies (LiMn, LiNiCo, and LiCoMnNi oxides) and as angular morphologies (LiCo oxide). BM1 was rich in LiCoO2, while BM2 was rich in LiNiCoMn oxides; however, the major component in both grades of BM was graphite. Thermal treatment led to a decrease in the compaction of the LiMeOx cathodes due to the removal of the PVDF binder and the decomposition of the LiMeOx into their respective metals.
  • Graphite occurs in smaller size fractions as dense or flake morphologies. When compared to natural graphite, the graphite in the BM samples is disordered (based on petrographic and Raman structural analyses), and this indicates that the graphite used in batteries is not necessarily graphitic. Upon thermal treatment, the structure of the graphite becomes more ordered (based on petrographic and Raman structural analyses). The intensity of graphite XRD peaks decreased when heating the BM either in air or in N2 and can be attributed to the reduction of embedded cathodic LiMeOx with graphite.
  • PVDF binder occurs on the surfaces of BM particles and hinders the recycling of BM. When heated, the PVDF partially decomposes into char, but new F cuboids and suspected carbonate crystals are also formed.
  • Al- and Cu foils occur in larger size fractions and deteriorate during thermal treatment of BM.
  • It was possible to detect several gas species during the pyrolytic treatment of the BM including DMC, DEC, oxygenated hydrocarbon (such as CH2O), hydrocarbons (such as CH4 and C6H6), and other miscellaneous gases (such as HBr, C2N2, HCN, and POF3). By increasing the pyrolysis temperature of the BM, higher mass loss and higher gas concentration were monitored.
These findings pave the way for optimizing the recycling of spent LIBs by understanding the changes of mineralogical and morphological structure and chemical transformation during the thermal treatment of black mass to decompose the PVDF binder and consequently enabling graphite separation from cathode active materials. In addition, several species of hazardous gases were detected during the pyrolytic treatment of the black mass, which should be carefully considered during the pre-treatment and recycling of spent LIBs. Future research will focus on studying the effect of heat treatment on the graphite separation from the LiMeOx in the BM using froth flotation.

Supplementary Materials

The following supporting information can be downloaded at: https://www.mdpi.com/article/10.3390/su15010015/s1, Table S1. Petrographic reflectance analysis results. Table S2. Raman microspectroscopy results—calculated parameters. Table S3. Raman microspectroscopy results—raw data. Figure S1. SEM-EDS analysis pressed aluminium-binder-cathode particles observed in the >250 μm size fraction of BM2, polished block. Figure S2. SEM-EDS analysis pressed lithium minerals observed in the >250 μm size fraction of BM2, polished block.

Author Contributions

All authors involved and contributed to methodology, investigation, formal analysis, writing—original manuscript, review, and editing. All authors have read and agreed to the published version of the manuscript.

Funding

This work was carried out with the support of the ERA-MIN2 programme (2018), the European Commission, and the respective national financier represented in VINNOVA, Sweden (project no. 2019-03473), REGIONE CALABRIA, Italy (project CUP:J11B180047005 ), and FCT, Portugal (ref. ERA-MIN/0003/2018) through the project COMPETE 2020 (UIDB/04683/2020), POCI-01-0145-FEDER-007690 to the project “Novel Circular Economic Approaches for Efficient Extraction of Valuables from Spent Li-Ion Batteries (NEXT-LIB)”.

Conflicts of Interest

The authors declare that they have no know competing financial interests or personal relationships that could have appeared to influence the work reported in this paper.

References

  1. International Energy Agency. Global EV Outlook 2021—Accelerating Ambitions Despite the Pandemic; IEA: Paris, France, 2021; p. 101. [Google Scholar]
  2. Graham, J.D.; Rupp, J.A.; Brungard, E. Lithium in the green energy transition: The quest for both sustainability and security. Sustainability 2021, 13, 11274. [Google Scholar] [CrossRef]
  3. Dadé, M.; Wallmach, T.; Laugier, O. Detailed Microparticle Analyses Providing Process Relevant Chemical and Microtextural Insights into the Black Mass. Minerals 2022, 12, 119. [Google Scholar] [CrossRef]
  4. Gaines, L. Profitable Recycling of Low-Cobalt Lithium-Ion Batteries Will Depend on New Process Developments. One Earth 2019, 1, 413–415. [Google Scholar] [CrossRef]
  5. Fahimi, A.; Ducoli, S.; Federici, S.; Ye, G.; Mousa, E.; Frontera, P.; Bontempi, E. Evaluation of the sustainability of technologies to recycle spent lithium-ion batteries, based on embodied energy and carbon footprint. J. Clean. Prod. 2022, 338, 130493. [Google Scholar] [CrossRef]
  6. Halleux, V. New EU Regulatory Framework for Batteries-Setting Sustainability Requirements. © European Union 2022. Available online: https://www.europarl.europa.eu/RegData/etudes/BRIE/2021/689337/EPRS_BRI(2021)689337_EN.pdf (accessed on 1 December 2022).
  7. Larsson, F.; Andersson, P.; Blomqvist, P.; Mellander, B.E. Toxic fluoride gas emissions from lithium-ion battery fires. Sci. Rep. 2017, 7, 10018. [Google Scholar] [CrossRef] [Green Version]
  8. European Union. Directive 2008/68/EC of the European Parliament and of the Council of 24 September 2008 on the inland transport of dangerous goods. Off. J. Eur. Union L 2008, 230, 13–59. [Google Scholar]
  9. Petranikova, M.; Naharro, P.; Vieceli, N.; Lombardo, G.; Ebin, B. Recovery of critical metals from EV batteries via thermal treatment and leaching with sulfuric acid at ambient temperature. Waste Manag. 2022, 140, 164–172. [Google Scholar] [CrossRef]
  10. Zhang, W.; Hu, C.; He, W.; Li, G.; Huang, J. A review on management of spent lithium ion batteries and strategy for resource recycling of all components from them. Waste Manag. Res. 2018, 36, 99–112. [Google Scholar] [CrossRef] [Green Version]
  11. Yu, D.; Huang, Z.; Makuza, B.; Guo, X.; Tian, Q. Pretreatment options for the recycling of spent lithium-ion batteries: A comprehensive review. Miner. Eng. 2021, 173, 107218. [Google Scholar] [CrossRef]
  12. Kim, S.; Bang, J.; Shin, Y.; Bae, J.; Jeong, J.; Kim, K.; Dong, P.; Kwon, K. A comprehensive review on the pretreatment process in lithium-ion battery recycling. J. Clean. Prod. 2021, 294, 126329. [Google Scholar] [CrossRef]
  13. Makuza, B.; Tian, Q.; Guo, X.; Chattopadhyay, K.; Yu, D. Pyrometallurgical options for recycling spent lithium-ion batteries: A comprehensive review. J. Power Sources 2021, 491, 229622. [Google Scholar] [CrossRef]
  14. Neumann, J.; Petronikova, M.; Meeus, M.; Gamarra, J.D.; Younesi, R.; Winter, M.; Nowak, S. Recycling of Lithium-Ion Batteries—Current State of the Art, Circular Economy, and Next Generation Recycling. Adv. Energy Mater. 2022, 12, 2102917. [Google Scholar] [CrossRef]
  15. Hu, X.; Mousa, E.; Ånnhagen, L.; Musavi, Z.; Alemrajabi, M.; Hall, B.; Ye, G. Complex gas formation during combined mechanical and thermal treatments of spent lithium-ion-battery cells. J. Hazard. Mater. 2022, 431, 128541. [Google Scholar] [CrossRef] [PubMed]
  16. ISO 7404-2; Methods for the Petrographic Analysis of Coals. Part 2: Methods of Preparing Coal Samples. ISO (International Organisation for Standardisation): Geneva, Switzerland, 2009.
  17. ISO 7404-5; Methods for the Petrographic Analysis of Coals. Part 5: Method of Determining Microscopically the Reflectance of Vitrinite. ISO (International Organisation for Standardisation): Geneva, Switzerland, 2009.
  18. Li, X.; Hayashi, J.; Li, C.-Z. FT-Raman spectroscopic study of the evolution of char structure during the pyrolysis of a Victorian brown coal. Fuel 2006, 85, 1700–1707. [Google Scholar] [CrossRef]
  19. Rebelo, S.L.; Guedes, A.; Szefczyk, M.E.; Pereira, A.M.; Araújo, J.P.; Freire, C. Progress in Raman spectra analysis of covalently functionalized multiwalled carbon nanotubes: Unraveling disorder in graphitic materials. Phys. Chem. Chem. Phys. 2016, 18, 12784–12796. [Google Scholar] [CrossRef] [PubMed]
  20. Smith, M.W.; Dallmeyer, I.; Johnson, T.J.; Brauer, C.S.; McEwen, J.-S.; Espinal, J.F.; Garcia-Perez, M. Structural analysis of char by Raman spectroscopy: Improving band assignments through computational calculations from first principles. Carbon 2016, 100, 678–692. [Google Scholar] [CrossRef] [Green Version]
  21. Ferrari, A.C.; Robertson, J. Interpretation of Raman spectra of disordered and amorphous carbon. Phys. Rev. B 2000, 61, 14095–14107. [Google Scholar] [CrossRef] [Green Version]
  22. Badenhorst, C. Char Extracted from Coal Ash as a Replacement for Natural Graphite. Ph.D. Thesis, University of Johannesburg, Johannesburg, South Africa, 2019. [Google Scholar]
  23. Adamczyk, Z.; Komorek, J.; Białecka, B.; Całus-Moszko, J.; Klupa, A. Possibilities of graphitization of unburned carbon from coal fly ash. Minerals 2021, 11, 1027. [Google Scholar] [CrossRef]
  24. Li, K.; Rimmer, S.M.; Liu, Q. Geochemical and petrographic analysis of graphitized coals from Central Hunan, China. Int. J. Coal Geol. 2018, 195, 267–279. [Google Scholar] [CrossRef]
  25. Kwiecińska, B.; Petersen, H.I. Graphite, semi-graphite, natural coke, and natural char classification—ICCP system. Int. J. Coal Geol. 2004, 57, 99–116. [Google Scholar] [CrossRef]
  26. Tuinstra, F.; Koenig, J.L. Raman Spectrum of Graphite. J. Chem. Phys. 1970, 53, 1126–1130. [Google Scholar] [CrossRef]
  27. Wang, M.; Tan, Q.; Liu, L.; Li, J. Environmentally friendly, and low-temperature approach for decomposition of polyvinylidene fluoride from the cathode electrode of spent lithium-ion batteries. ACS Sustain. Chem. Eng. 2019, 7, 12799–12806. [Google Scholar] [CrossRef]
  28. Fu, Y.; Schuster, J.; Petranikova, M.; Ebin, B. Innovative recycling of organic binders from electric vehicle lithium-ion batteries by supercritical carbon dioxide extraction. Resour. Conserv. Recycl. 2021, 172, 105666. [Google Scholar] [CrossRef]
Figure 1. Normalized XRF analysis results: (a) the as-received samples; (b,c) particle size distribution versus recovery for the BM1 and BM2 samples, respectively.
Sustainability 15 00015 g001
Figure 2. XRD profiles of BM1 and BM2.
Sustainability 15 00015 g002
Figure 3. SEM-EDS (BSE mode; (a,c) polished blocks) and petrographic (reflected polarized and 1 λ retarded light; (eh) polished blocks) analyses of BM1 and BM2: (a) Al- and Cu foils; (b) cathode chunks: dashed white area 1 is LCO cathode; dashed white area 2 is LiMeOx cathode; (c) detailed image and EDS lithium cobaltate grains with PVDF binder (fluorine in EDS is the binder signature); (d) detailed image and EDS lithium manganate grains with Ni and Co, bound with PVDF; (e,f) three different LiMeOx morphotypes identified via petrography; (g,h) two different types of graphite morphology identified via petrography.
Sustainability 15 00015 g003
Figure 4. Different spectra observed for the graphite particles in the BM samples during Raman microspectroscopy analysis: (a) Type A; (b) Type B; (c) Type C; (d) Type D.
Sustainability 15 00015 g004
Figure 5. TGA and DTGA of BM1: (a) heated in air atmosphere; (b) heated in N2 atmosphere.
Sustainability 15 00015 g005
Figure 6. TGA and DSC of BM2.
Sustainability 15 00015 g006
Figure 7. (a) XRD profiles of BM1 sample calcined in situ at different temperatures, (b) XRD profiles of BM2 sample calcined at different temperatures.
Sustainability 15 00015 g007
Figure 8. (a) Size distribution and moisture content in the different size fractions of BM1 and BM2. (b) Mass loss of BM1 and BM2 after thermal treatment at 550 °C in the different size fractions of BM1 and BM2. (c) Mass loss of BM2 after thermal treatment at 650 °C under an N2 atmosphere at the different residence time.
Sustainability 15 00015 g008
Figure 9. SEM-EDS (BSE mode; polished blocks) and petrographic (reflected polarized light; h polished blocks) analyses of BM2: (a,b) removal of LiMeOx from Al foils after a 1 h and 4 h thermal residence time, respectively; (ce) decrease in compaction in cathode chunks after a 1 h, 3 h, and 4 h thermal residence time, respectively; (f,g) magnification of square areas 1 and 2 in “d” and EDS spectra. The LiMeOx lost their round shape and are partially decomposed; (h) blue spherical framboids lost their color upon thermal treatment.
Sustainability 15 00015 g009
Figure 10. Normalized XRF analysis results: (a) composition of the +0.25 mm fraction at different pyrolysis residence times; (b) composition of the −0.25 mm fraction at different pyrolysis residence times.
Sustainability 15 00015 g010
Figure 11. SEM-EDS (BSE mode; (a) powder, (b,c) polished blocks) of BM2: (a) surfaces of graphite remain covered by PVDF binder after thermal treatment; (b) newly formed crystals enriched in F; (c) newly formed dark framboids composed of C–O.
Sustainability 15 00015 g011
Table 1. Chemical analysis of BM1 and BM2.
ElementCoNiMnLiCuAlFeCOthers
wt.%, Dry Basis
BM117.55.13.03.93.91.61.636.027.4
BM25.412.510.92.63.14.82.342.116.3
Table 2. Petrographic reflectance analysis and calculated Raman microspectroscopy results for BM1 and BM2.
Petrographic Reflectance Results
Mean Random ReflectanceMaximum Dense GraphiteMaximum Flake Graphite
Rr %sRm %SRm %s
BM1 5.6280.5719.9840.7969.1700.892
BM2 4.7640.6459.8681.5267.9941.385
Raman microspectroscopy results
GD1 distance (cm−1)D1/G integrated intensity ratioD1/G FWHM ratio
DenseFlakeOrderedAverageDenseFlakeOrderedAverageDenseFlakeOrderedAverage
BM1231231-2311.81.2-1.52.42.1-2.3
BM22152322302251.51.61.11.31.10.92.31.3
Rr—mean random reflectance; Rm—maximum reflectance; s—standard deviation.
Table 3. Petrographic reflectance analysis results for thermal treated BM1 and BM2 samples.
Mean Random ReflectanceMaximum Dense GraphiteMaximum Flake Graphite
Rr %sRm %sRm %s
BM1 +1 mm 550 °C 15 min4.4040.5038.7970.9228.0640.768
BM1 +0.25–1mm 550 °C 15 min4.5550.3489.3600.7458.8620.767
BM1 −0.25 mm 550 °C 15 min5.0980.39310.0910.8979.3210.759
BM2 +1 mm 550 °C 15 min4.5990.5589.9040.8749.1860.943
BM2 +0.25–1 mm 550 °C 15 min4.9750.3759.3990.7948.2940.858
BM2 −0.25 mm 550 °C 15 min4.9350.3249.3730.5838.4670.782
BM2 +0.25 mm 650 °C 1 h5.3710.53310.3100.8059.3891.125
BM2 +0.25 mm 650 °C 2 h5.2980.51710.4521.2079.8871.320
BM2 +0.25 mm 650 °C 3 h5.0980.76510.8811.0749.6141.392
BM2 +0.25 mm 650 °C 4 h5.3330.58910.0990.9899.4571.186
BM2 −0.25 mm 650 °C 1 h5.6160.60611.4120.87710.1851.231
BM2 −0.25 mm 650 °C 2 h5.5200.58210.7321.35710.2301.061
BM2 −0.25 mm 650 °C 3 h5.2500.53110.7000.6979.9600.820
BM2 −0.25 mm 650 °C 4 h5.6140.59311.1081.2249.8991.075
Disclaimer/Publisher’s Note: The statements, opinions and data contained in all publications are solely those of the individual author(s) and contributor(s) and not of MDPI and/or the editor(s). MDPI and/or the editor(s) disclaim responsibility for any injury to people or property resulting from any ideas, methods, instructions or products referred to in the content.

