Article

Design of UVA Ultraviolet Disinfection System for Nutrient Solution Residual Liquid and Development of Microbial Online Monitoring System

School of Agriculture Engineering, Jiangsu University, Zhenjiang 212013, China
*
Author to whom correspondence should be addressed.
Sustainability 2023, 15(1), 173; https://doi.org/10.3390/su15010173
Submission received: 29 November 2022 / Revised: 16 December 2022 / Accepted: 20 December 2022 / Published: 22 December 2022
(This article belongs to the Special Issue Sustainable Agricultural Engineering Technologies and Applications)

Abstract

:
If the nutrient solution used in the hydroponic system is recycled and reused without disinfection, the plant diseases are likely to spread. The current disinfection system still cannot conduct online monitoring of microorganisms at the same time as disinfection. In this paper, a UVA ultraviolet disinfection system and an online microbial monitoring system are proposed, which can conduct online monitoring at the same time as disinfection. This system includes the design of the disinfection system, the microbial online detection system and the microfluidic chip. The practical performance of the disinfection system and the microfluidic chip was verified by means of simulation and experiment. The relationship between the working power (P) of the UVA ultraviolet sterilizer used and its irradiance (Ee) is P = 29.98 Ee. The direct influencing factor of the ultraviolet disinfection rate of the nutrient solution residual liquid was the ultraviolet light irradiation dose. When the power of the ultraviolet lamp (radiation flux) is 30 W, the optimum wavelength is close to 300 nm, and the absorbance value is approximately 0.07. The error between bioluminescence detection and laboratory culture detection error is 0.002. The disinfection method and microfluidic chip proposed in this paper can be used in a greenhouse hydroponic system to reduce the impact of harmful microorganisms in the nutrient solution return on plants, and improve the effect of the return solution.

1. Introduction

The nutrient solution without disinfection can spread plant diseases quickly, so the disinfection method of the hydroponic nutrient solution has been used. Disinfection methods have developed from electrothermal disinfection and sand filtration to technologies such as ozone and ultraviolet disinfection. Existing disinfection equipment have the advantages of good scalability and low failure rate, but lack the online monitoring function of microorganisms in the residual liquid. The existing equipment also has the disadvantages of cumbersome disinfection procedures and long disinfection cycles, which make it difficult to achieve the killing effect based on online microbial monitoring. Several disinfection processes of ultraviolet (UV), post-UV chlorination, were studied; it was found that an increase in the UV dose can inhibit the self-repair of bacteria [1]. Low-pressure ultraviolet (254 nm) was also used for disinfection [2]. The combined disinfection process of ultraviolet and chlorine (or chloramine) can improve the safety of the water supply [3,4,5,6].
A novel disinfection device, equipped with ultraviolet (UVA) light-emitting diodes, was developed to conduct UV sterilization experiments on Escherichia coli strains. A model was designed to describe the relationship between the nutrient solution volume, the logarithmic survival rate and the UVA flux relation [7]. For removing toxic substances, such as organic acids and nutrient solution microorganisms emitted by plants, some nutrient solution waste liquid sterilization methods, such as ozone, heating, sand filtration, advanced oxidation disinfection, activated carbon, nano-TiO2 catalysis and comprehensive sterilization, can be used [8,9,10,11,12]. For the recycling of the nutrient solution residual liquid, these disinfection methods may obviously affect the composition ratio of the nutrient solution. The accumulation of chemicals will cause safety problems. The sterilization efficiency of ultraviolet radiation disinfection is high and the effect on the effective components in the nutrient solution is small.
Microfluidics have been used in precision agriculture for accurate detection [13]. A method using microfluidic technology was designed and used to rapidly detect microorganisms [14]. The development of low-cost and disposable paper-based microfluidic chips, combined with novel assay formats, can reduce the testing time and the complexity of diagnostic testing [15,16]. A fluorescence detection thin-layer chromatography separation method was also used to detect microorganisms [17]. The detection accuracy can be improved by using photomultiplier tubes and wavelength filters to collect fluorescence signals, and using integrators to process the output fluorescence intensity [18,19]. The microfluidic chip, designed by correlating the measured concentration and fluorescence intensity, was used to continuously analyze nitrate and nitrite in water [20].
In view of the problems existing in the current residual liquid disinfection method, a UVA ultraviolet disinfection system for the residual liquid of the nutrient solution and its online microorganism monitoring system was designed in this paper. The design and experimental verification of the pipeline and the other hardware of the disinfection system were carried out. A microfluidic chip was designed at the same time and used in the online detection system, and the reliability of the designed microfluidic chip was verified by means of CFD simulation and experiment. The disinfection system and online detection system described in this paper can provide hardware support for the configuration of the nutrient solution in the greenhouse, and promote the recycling and reuse of the nutrient solution in the greenhouse.

2. Materials and Methods

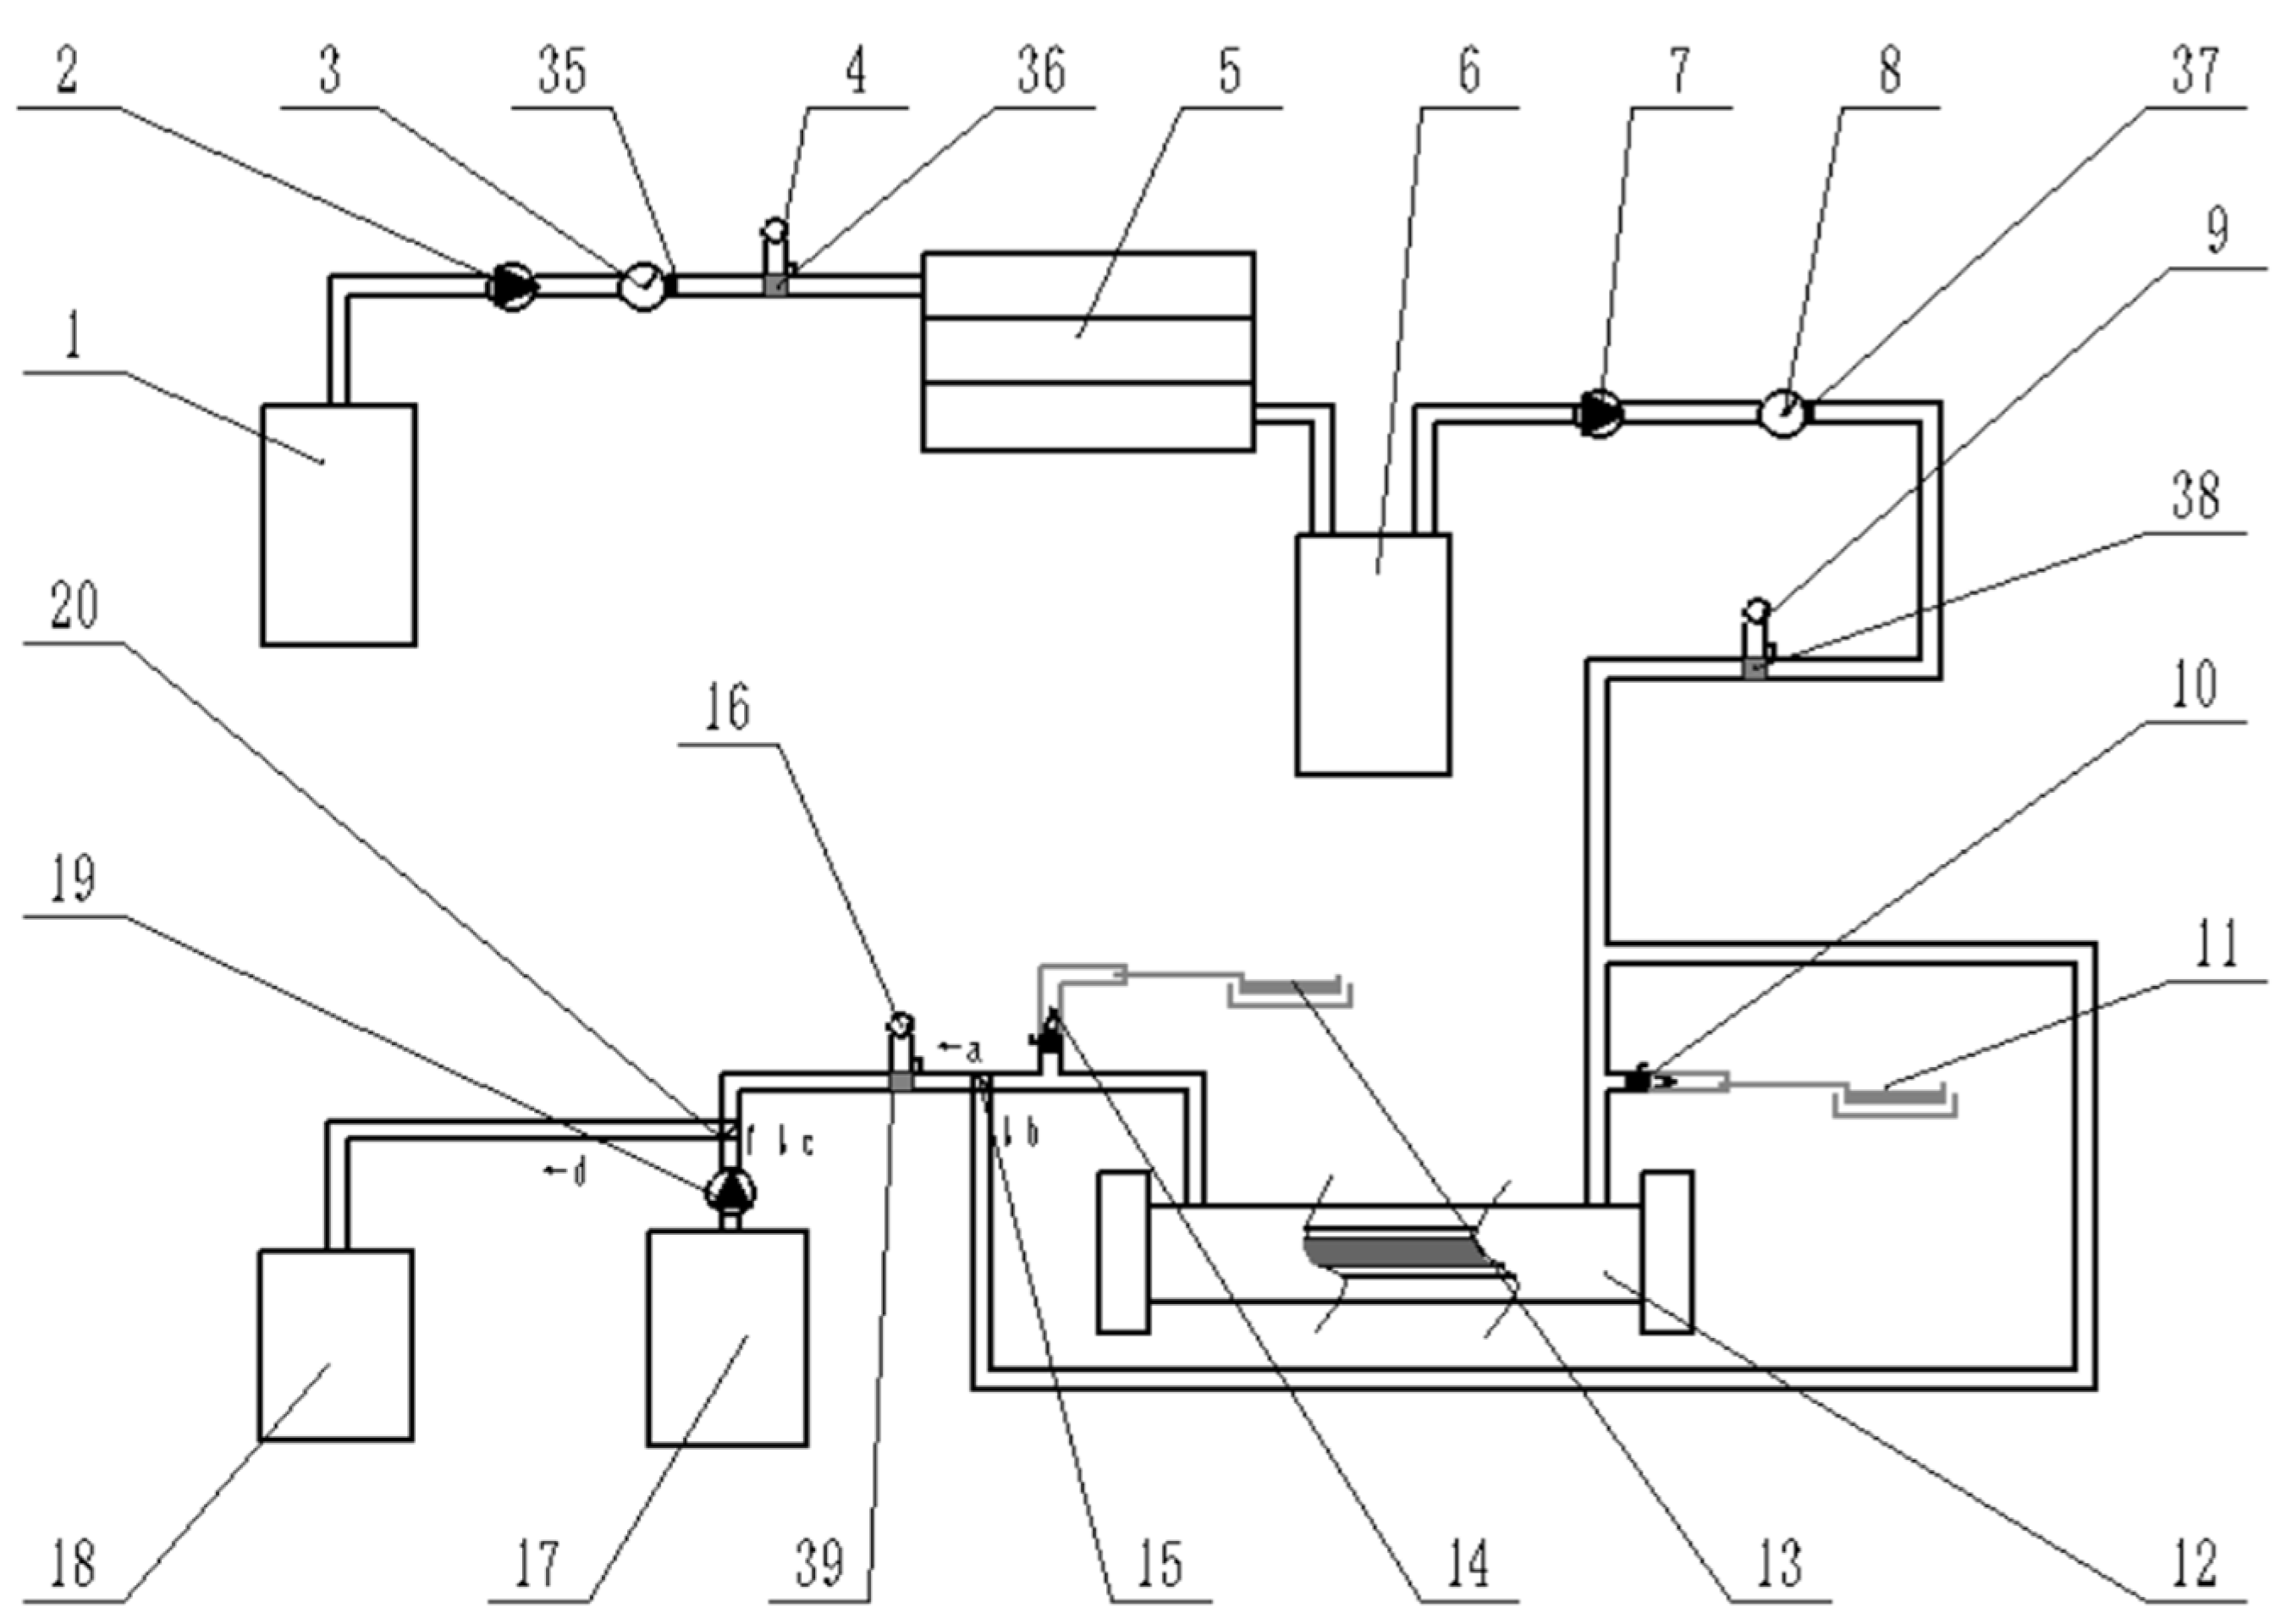
2.1. Design of Piping System for Residual Liquid Treatment

Residual Liquid Treatment Piping System

In this paper, a microfluidic chip-based online monitoring pipeline system for nutrient solution residual liquid disinfection was designed (see Figure 1). The tertiary filter adopts the filtration sequence from coarse to fine, to filter out particulate impurities and some microorganisms in the residual liquid. The power and operating frequency of the single-suction pipeline pump was controlled by a console according to the flow signal collected by the flow sensor A. The pressure sensor A was used to collect the pressure signal in the connecting pipeline and transmit it to the console in real time. When the pressure in the connecting pipeline reached the set value, the single-suction pipeline pump was controlled by the console to close. The liquid level sensor A was used to obtain the liquid level of the collection pool in real time. When the liquid level reached the maximum value set by the disinfection process, the single-suction pipeline pump worked. When the liquid level reached the minimum value set by the disinfection process, the single-suction pipeline pump stopped.
In this model, the residual liquid of the hydroponic system flows into the collection tank, and the liquid level sensor A in the collection tank obtains the liquid level of the collection tank in real time. When the liquid level reaches the maximum value set by the disinfection process, the single-suction pipeline pump worked. Under the action of the single-suction pipeline pump, the residual liquid entered the tertiary filter, and the tertiary filter adopted the sand filtration method to filter the residual liquid. Level sensor B, the liquid level sensor B, was used to obtain the liquid level of the first-stage filter in real time. When the liquid level reaches the minimum value set by the disinfection process, the single-suction pipeline pump closes, and it is filtered by the third-stage filter. The remaining liquid is stored in the storage tank. The tertiary filter communicates with the storage tank, and the storage tank contains a liquid level sensor C to obtain the liquid level of the storage tank in real time. When the liquid level reaches the set maximum value, the pipeline pump works. The residual liquid in the storage tank enters the UVA ultraviolet sterilizer for ultraviolet disinfection under the action of the pipeline pump. The residual liquid after disinfection passes through the port of the solenoid valve A, and the c port of valve B enters the post-processing tank. The liquid level sensor D is located in the post-processing tank and was used to obtain the liquid level of the post-processing tank in real time. When the liquid level reaches the set maximum value, the pump works, the d port of the solenoid valve B opens, and the remaining liquid enters the mixing tank for processing.
The working response variable of the liquid level sensor A in the collection pool was set as W1/n, and W1 = nW2 = nW3. The treatment capacity of each disinfection process was set as W2 or W3, to realize the independent progress of each disinfection process of the residual liquid, that is, the residual liquid pumped out of the storage tank. After being sterilized by the UVA ultraviolet sterilizer, the residual liquid enters the post-treatment tank. After each sterilization process was over, the sterilized residual liquid was pumped into the dispensing tank by the pump 19, and then the next disinfection process was carried out to avoid the occurrence of unqualified disinfection. Among them, W1, W2, and W3 were determined by the circulation volume of the nutrient solution and the working efficiency of the UV sterilizer.
Where: W1 is the total processing capacity of a disinfection process; W2 is the working response variable of the liquid level sensor C in the storage pool (including the maximum and minimum values of the liquid level setting); W3 is the working response variable of the liquid level sensor D in the post-processing tank.

2.2. Design of Online Monitoring System for Residual Liquid Microorganisms Based on Microfluidic Chip

In order to accurately test whether the residual liquid disinfection treatment meets the requirements of the secondary utilization, a set of residual liquid microorganism online monitoring systems, based on the microfluidic chip, were designed. The monitoring system in Figure 1 includes a microbial fluorescence monitoring pool A and a microbial fluorescence monitoring pool B, which were, respectively, connected to the inlet and outlet ends of the UVA ultraviolet sterilizer by sampling pipelines. The microbial fluorescence monitoring pool A was used to detect microorganisms in the test solution before disinfection, and the microbial fluorescence monitoring pool B was used to detect microorganisms in the test solution after disinfection.

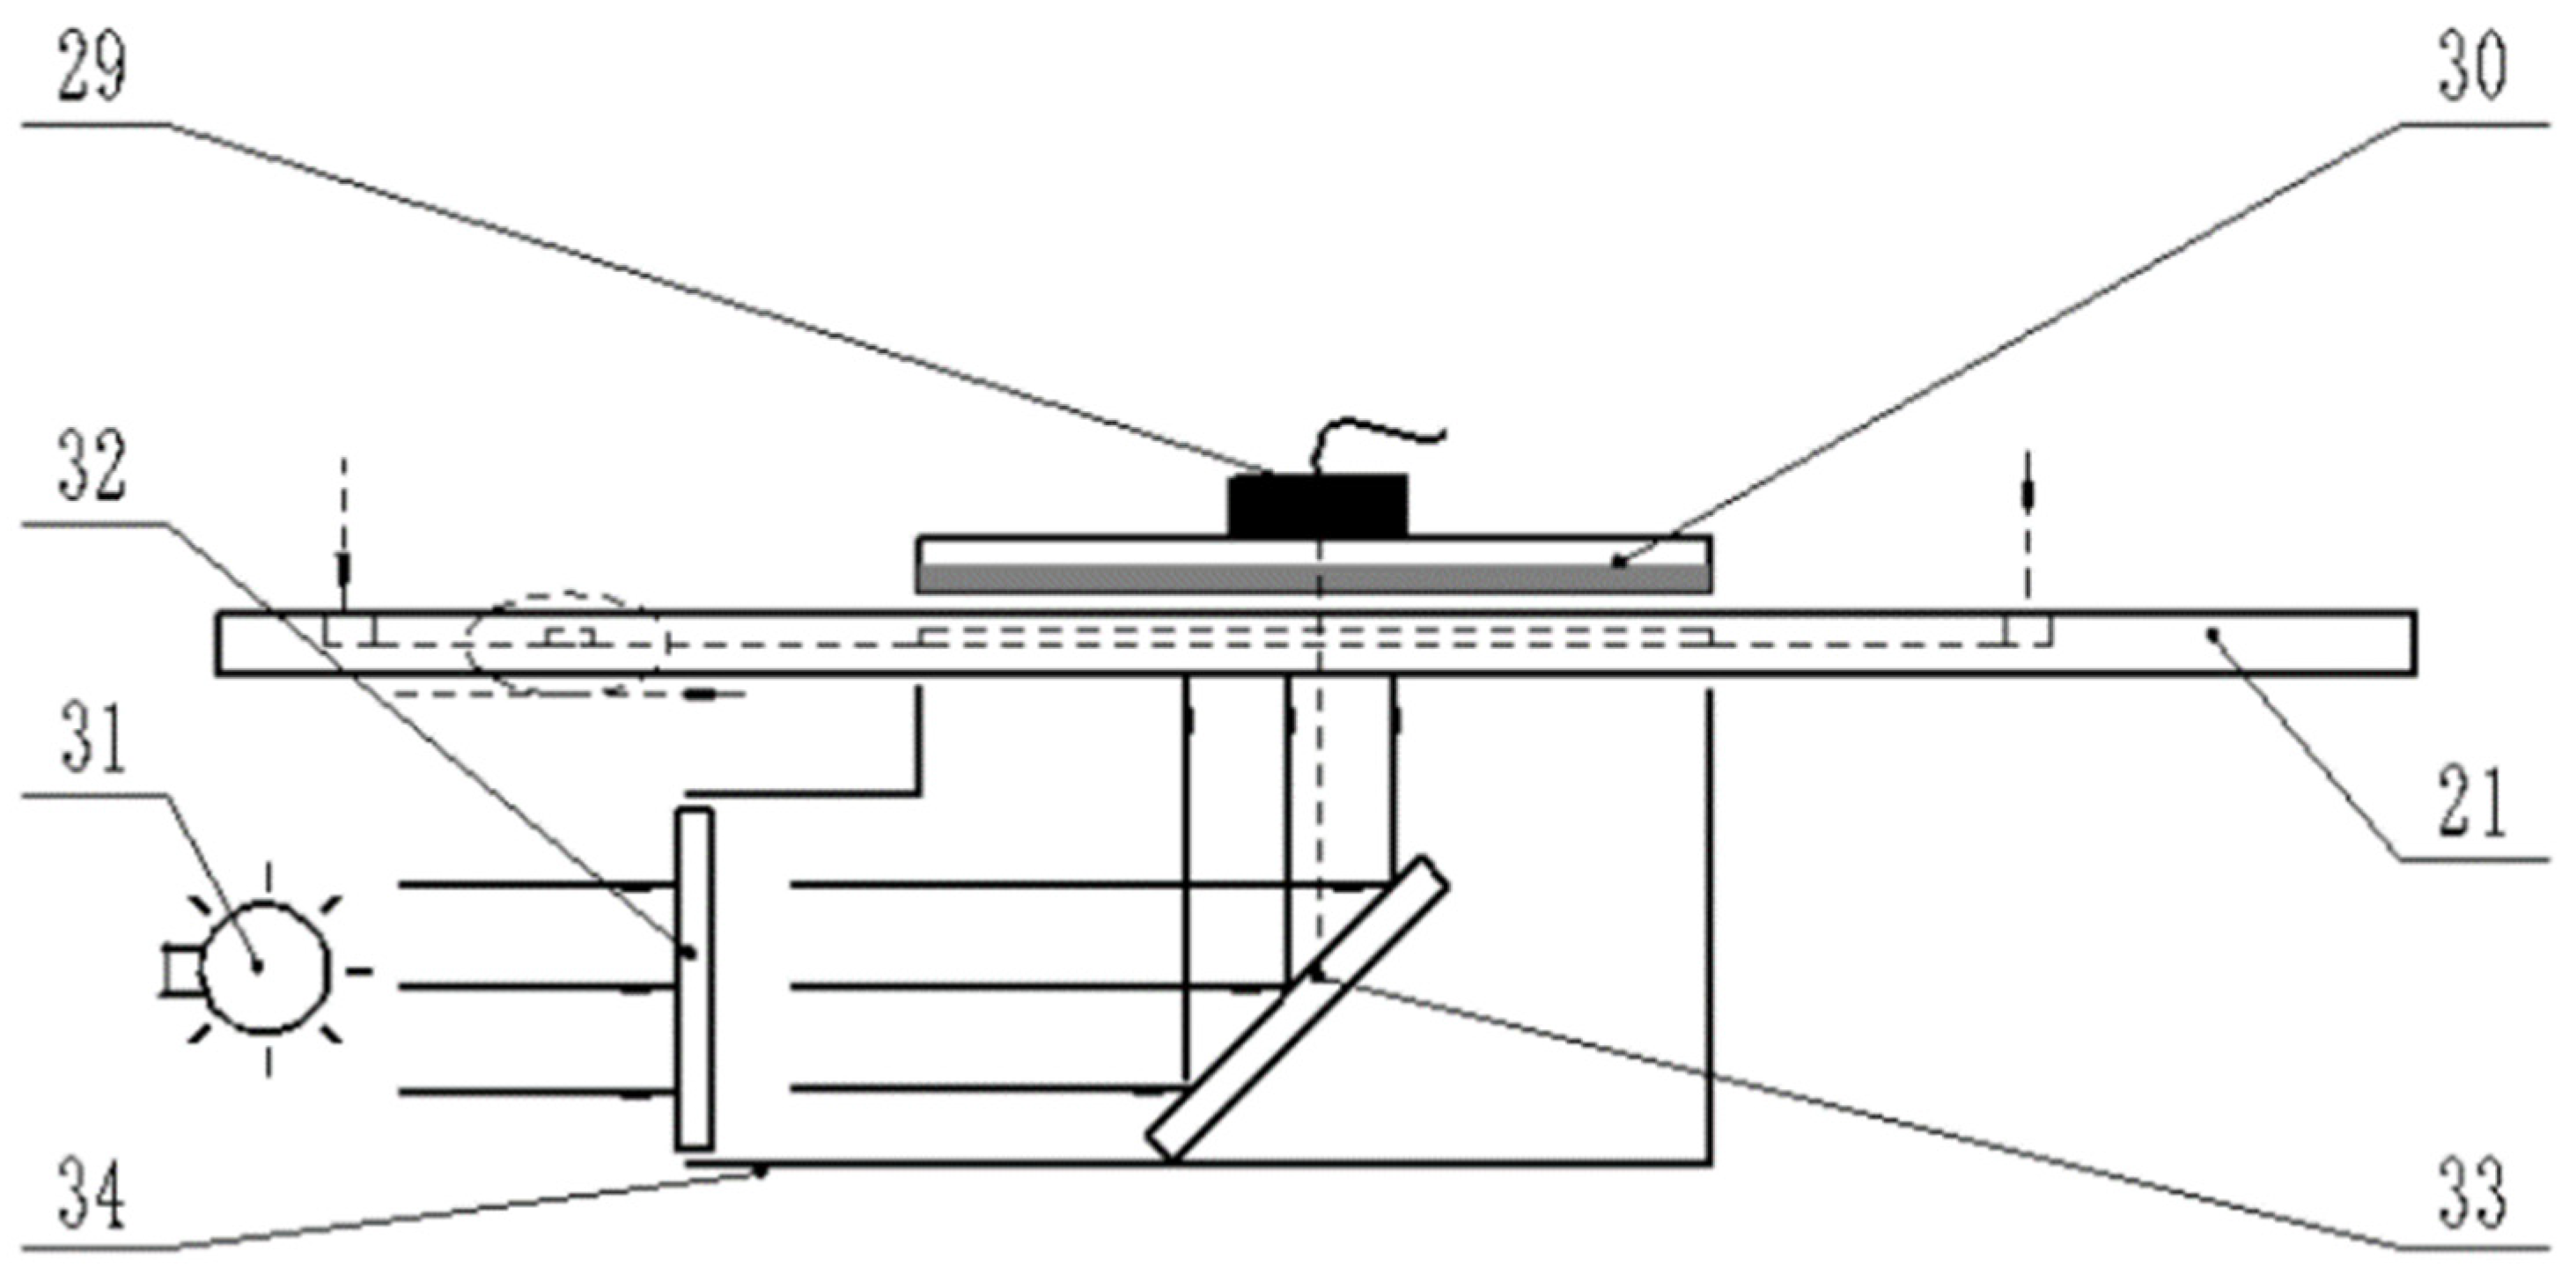
2.2.1. Microbiological Monitoring System Model

In order to better analyze the disinfection rate, reduce the workload of the monitoring system and save the cost, the monitoring system was designed. It used live cell fluorescent probes to label microorganisms and extract fluorescent photoelectric signals. The structure of the microorganism monitoring system includes seven parts: microfluidic glass chip, photoelectric processor, photosensitive plate, laser light source, excitation color filter, mirror and optical channel.
The structure of the microbial monitoring system is shown in Figure 2. The upper part of the microfluidic glass chip is a photosensitive plate, and there is a gap between the photosensitive plate and the microfluidic glass chip, and the photosensitive plate is supported by a bracket on the inner wall of the microbial fluorescence monitoring tank. A photoelectric processor was installed on the photosensitive board. An optical channel was arranged under the microfluidic glass chip, the upper port of the optical channel is opposite to the photosensitive plate. An excitation filter was arranged at the entrance of the optical channel, a laser light source was arranged beside the excitation filter, and a reflector was arranged inside the optical channel. The photosensitive plate was mainly composed of a high-sensitivity photon detection optical sensor chip-CCD chip with a “backthinning” process, which expands the detection range and can accurately capture the fluorescent emission light signal.

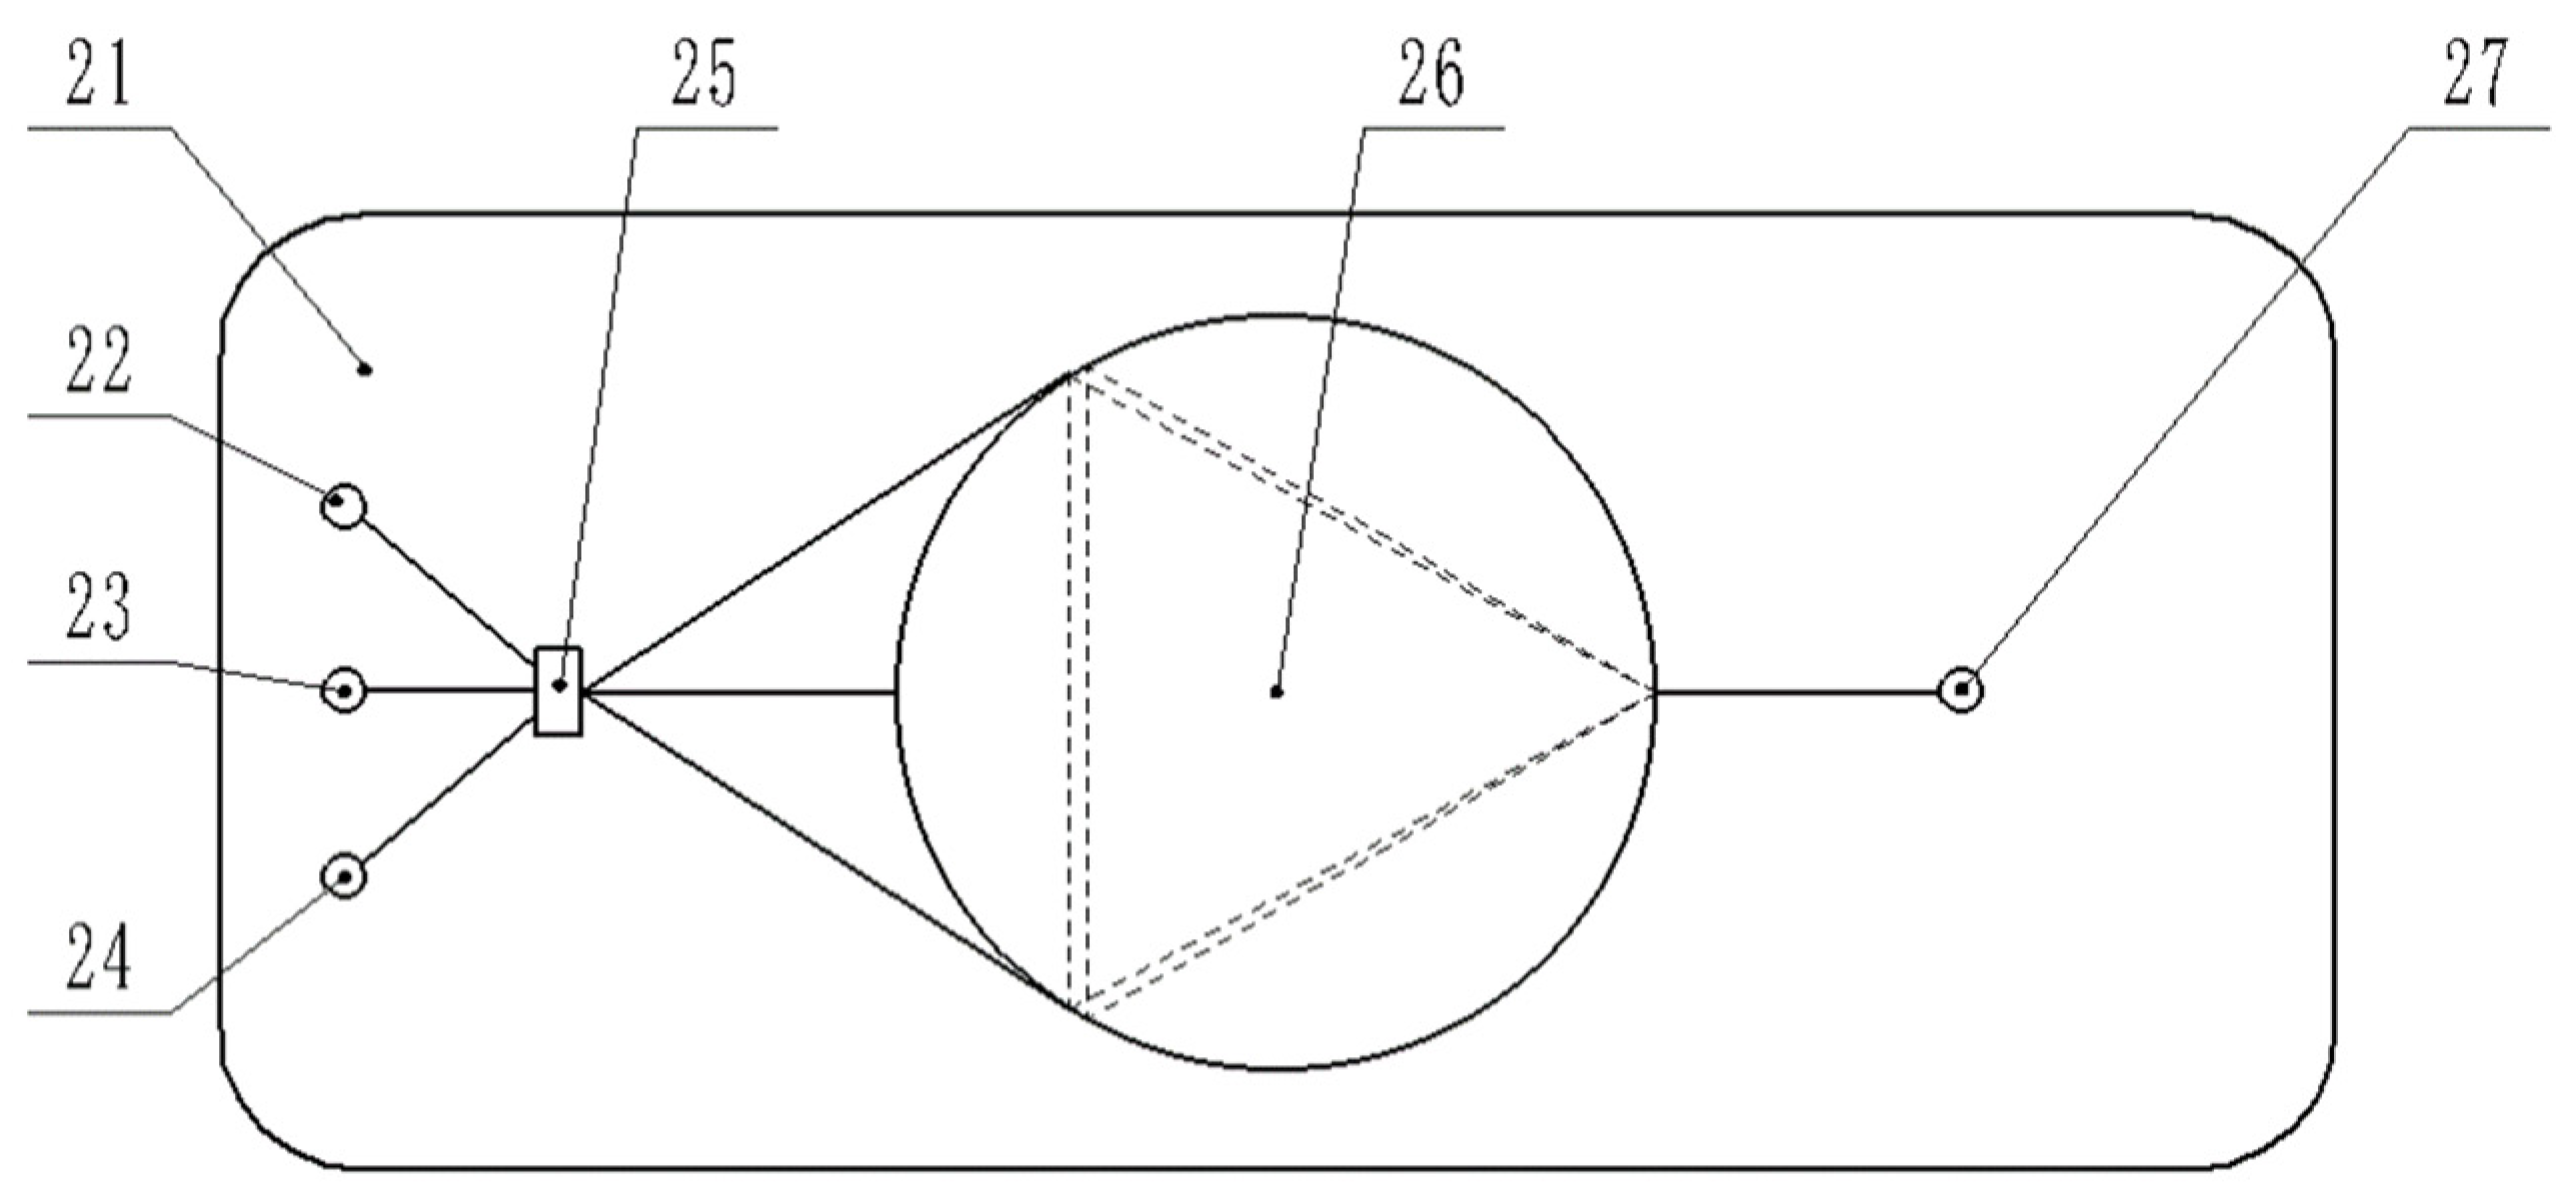
2.2.2. Microfluidic Chip Structure

The miniaturization of liquid phase analysis can lead to significant performance improvements, and substantial time and cost savings. Figure 3 shows the designed two-phase flow microfluidic chip, where 22 and 24 are injected with different fluids, synchronously. The residual liquid of the nutrient solution is injected into the microbial fluorescence monitoring pool A and the microbial fluorescence monitoring pool B through the PWM injector A and the PWM injector B. The detection samples enter the microfluidic glass chip through the sampling port. The fluorescent molecular probe is injected into the fluorescent molecular probe port, and the fluorescent molecular probe and the detection sample enter the marking cell synchronously through the microchannel for full mixing. After the test sample and fluorescent molecular probe are fully mixed in the marking cell, the microorganism will be marked. After the fluorescent molecular probe labels the detection sample microorganism, a detection solution is formed. The detection solution passes through three microchannels and enters the inspection pool, and the marked detection solution is evenly spread over the bottom of the pool. The laser light source emits light, and the detection liquid is excited by the excitation color filter and the reflection mirror in sequence. The photosensitive plate extracts the fluorescence signal of the detection liquid, and sends it to the photoelectric processor for processing.

2.2.3. Calculation of Biomass of Test Solution

The photosensitive plate extracts the fluorescent signal of the detection solution, obtains the number of fluorescent photons N 0 at time 0, and then transmits it to the console. N t is the number of fluorescent light elements attenuated with time t based on N 0 . Based on the number of fluorescent photons N 0 at time 0, the number N t of fluorescent photons at the time of detection t is calculated. The calculation relationship is as shown in Formulas (1) and (2). Formula (1) is the evaluation model of N t . The left side of the equation is the light intensity attenuated by time. After each test was completed, the detection tank needed to be drained and cleaned through the pure water port, and the liquid would flow out from the liquid outlet port. According to the calculation in the microbial fluorescence monitoring pool A, the number of fluorescent photons at the time of detection t was obtained, and the microbial mass y1 before disinfection was obtained. According to the calculation in the microbial fluorescence monitoring pool B, the number of fluorescent photons detected at time t was obtained, and the microbial mass y2 after disinfection was obtained. The disinfection rate, p = (y2 − y1)/y1, set the threshold p1 of the disinfection rate; when p ≥ p1, the disinfection was qualified and when p < p1, the disinfection was unqualified. When the disinfection is unqualified, the console interrupts the operation of the pipeline pump, starts the pump 19, and opens the b port of the solenoid valve A. The pump 19 pumps the remaining liquid in the post-treatment tank back into the UVA ultraviolet sterilizer for secondary disinfection. Using the microbial fluorescence monitoring tank to calculate the number of fluorescent elements at the time of detection t again, the microbial amount before and after the disinfection was obtained, until the disinfection was qualified. The residual liquid that was qualified for disinfection was pumped into the mixing tank until the liquid level in the post-treatment tank reached the set minimum value, then the console controlled the pump 19 to stop.
I 0 exp ( t τ + ε ) = E N t π D 2 h c / λ
ε = ( N t N 0 ) 2 N 0 1
where: I 0 is the theoretical fluorescence intensity at 0 moment after excitation of the detection solution; fluorescence lifetime is τ = 1 / ( Γ + K n r ) , and Γ and K n r are the radiative transition rate and the non-radiative transition rate, respectively; ε is the standard deviation, D is the diameter of the inspection cell 26, h is Planck’s constant, c is the speed of light, and λ is the laser wavelength; the optimal excitation conditions and the influence parameters of the signal-to-noise ratio are E = K ν π D 2 H 2 , K is the excitation light decay constant, H is the depth of the inspection cell, and ν is the laser photobleaching coefficient.
The mathematical model in Formula (1) is a pre calculation model combined with statistical regression analysis, which is used to model the relationship between multiple parameters and regression variables. The theoretical basis is the exponential decay model of fluorescence lifetime. After the labeled test sample is excited by a laser beam, the fluorescent active molecules in the sample absorb energy and transition from the ground state to an excited state, and then emit fluorescence in the form of radiative transition back to the ground state. When the excitation light is removed, the fluorescence intensity of the molecule decreases to 1 / e of the excited state I 0 , as the fluorescence lifetime.
According to the number of fluorescent photons N t at time t, the amount of microorganisms y in the detection solution can be obtained as shown in Equation (3).
y = m N t
where m is a parameter, the number of microorganisms is set as the number of viable bacteria VC, the number of viable bacteria VC is obtained through the laboratory (such as image processing or electron microscopy), and the parameter m is determined according to the number of viable bacteria VC and the number of fluorescent photons N t .

2.3. Microfluidic Chip Model and Calculation of Important Parameters Related to CFD

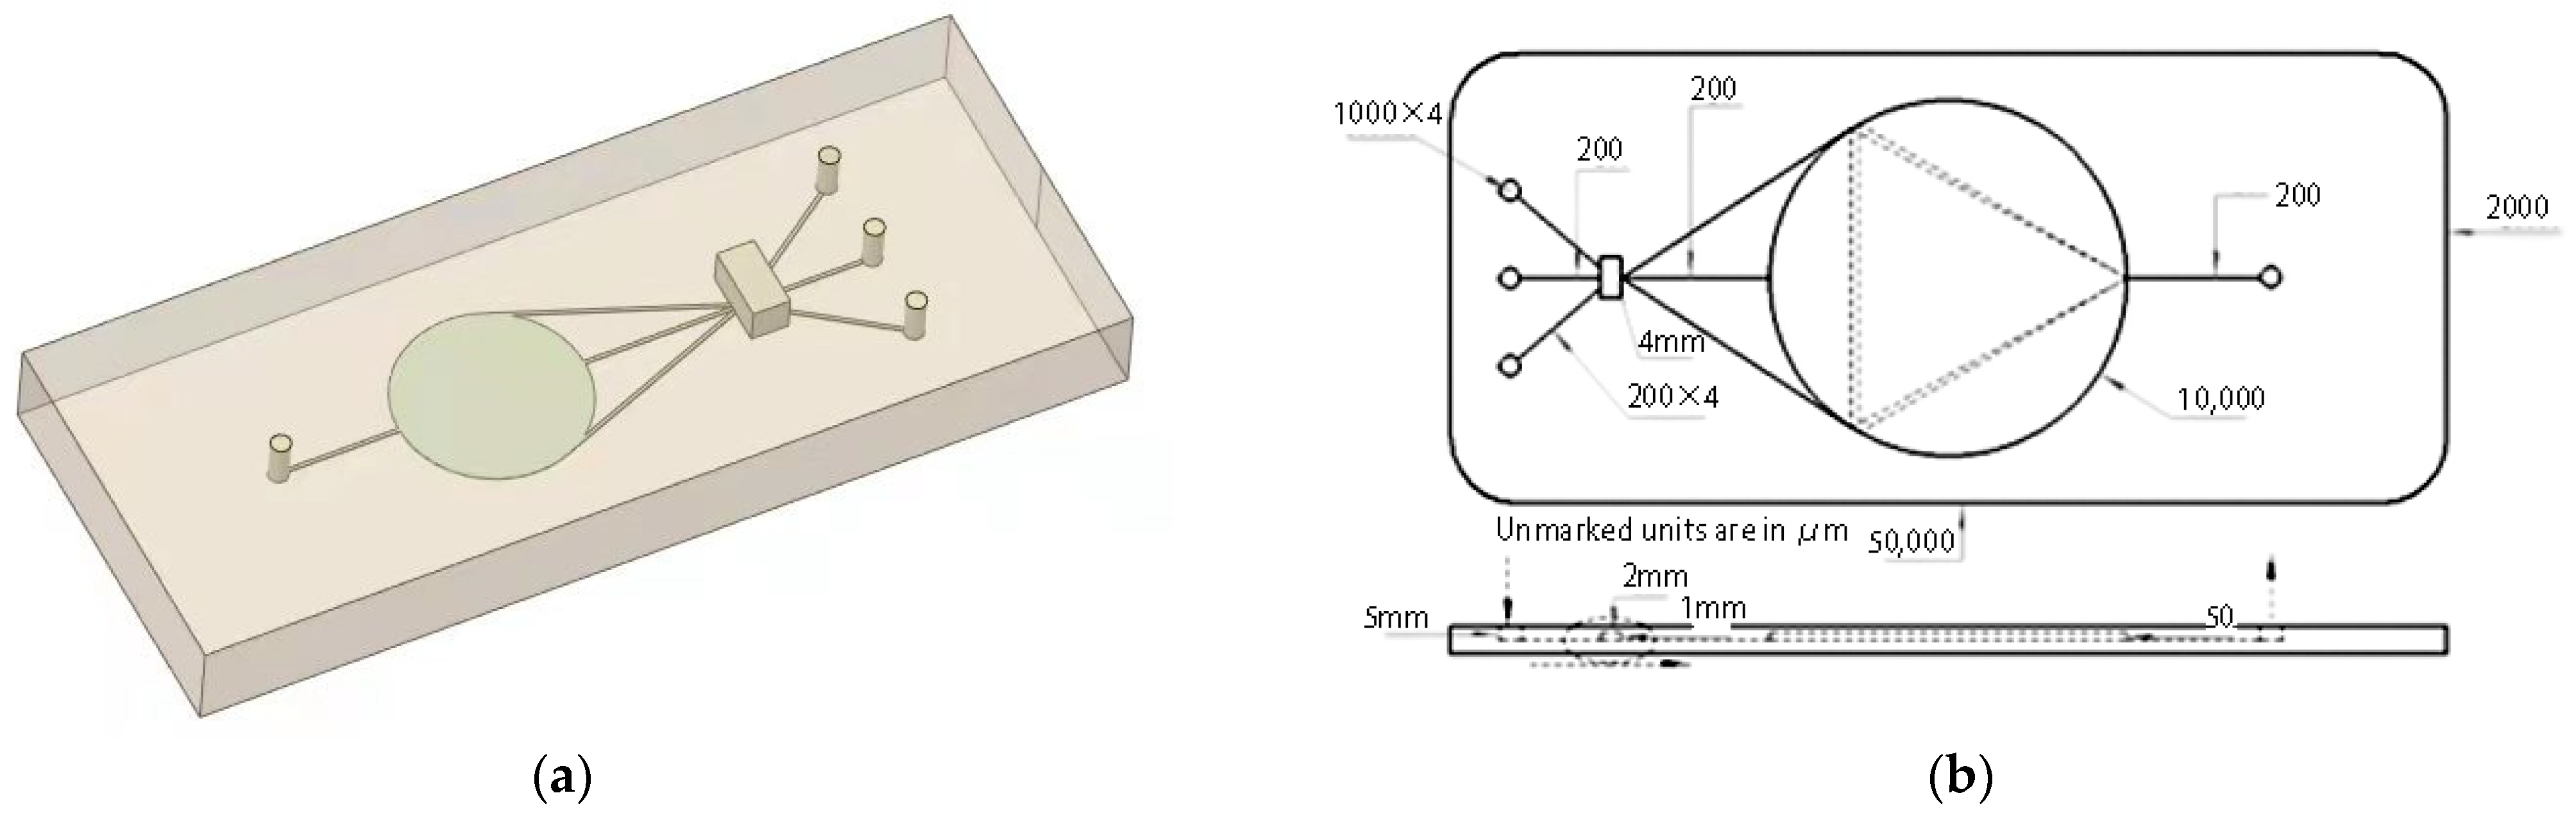
2.3.1. 3D Model of Microfluidic Chip

According to the general specifications of the laboratory, the overall modeling of the microfluidic chip was carried out, and the three-dimensional model and size were established using SCDM software (version: 19.0, company: ANSYS, location: Pittsburgh, PA, USA) (see Figure 4).

2.3.2. Boundary Condition Calculation

According to the designed drawings (see Figure 5), the boundary conditions were calculated to simulate the motion state of the detection liquid in the channel during the fluorescence detection process of the microfluidic chip. The fluorescent molecular probe port and the sampling port were set as the liquid inlet. The liquid volume V of the chip in the detection was calculated, which mainly included 6 parts: the fluorescent molecular probe port, sampling port, chip channel, marker pool, inspection pool and liquid outlet port.
V = 3 V p o r t + V a i s l e + V m a r k + V c h e c k = 20.55   μ L
The channel cross-sectional areas of the chip inlet and channel are shown as follows.
This section may be divided by subheadings. It should provide a concise and precise description of the experimental results, their interpretation, as well as the experimental conclusions that can be drawn.
S e n t e r = 0.95   mm 2
S P a s s = 0.01   mm 2
The injection time t was set as 3 s, 4 s, 5 s, and the turbulence coefficient ϑ = 1.1. The relationship between the velocity v (mm/s), the flow rate q (μL/s) and the capacity V (μL) is shown as Formulas (5)–(7).
V = ϑ · q · t
q = v · s
v P a s s = S e n t e r S P a s s v e n t e r
( 1 ) { v e n t e r = 3.93   mm / s v 2 e n t e r = 4.92   mm / s v 3 e n t e r = 6.55   mm / s
( 2 ) { v 1 p a s s = 410.40   mm / s v 2 p a s s = 513.95   mm / s v 3 p a s s = 684.95   mm / s

2.4. Microfluidic Chip CFD Analysis

2.4.1. CFD Condition Setting

For the designed microfluidic glass chip, the sampling port and the fluorescent molecular probe port were set as the velocity the inlet ports, and the liquid outlet port was set as the velocity outlet. The inlet and outlet boundary conditions of the microfluidic glass core model were set as shown in Table 1. The notations for speeds v 1 , v 2 , v 3 represent the inlet velocity before the turbulence coefficient had been weighted. The notations for speeds v 1 , v 2 , v 3 represent the inlet velocity after the turbulence coefficient had been weighted. The speed value calculated in the formula corresponds to the speed value in the table. The specific parameters of the residual liquid and glass used in the CFD model of the microfluidic chip designed in this paper are shown in Table 2.

2.4.2. Analysis of CFD Results

Microfluidic chip simulation was performed in FLUENT software, using the Realizable k-ε turbulence model for steady-state simulation. Figure 5 is the plane velocity cloud diagram of the microfluidic glass chip at t = 4 s. The conditions were set according to the boundary conditions and the model material property parameters, so that the fluid evenly covers the inspection cell and keeps the velocity close to 0 m/s. The cross-sectional area of the fluid inside the channel became smaller, and the flow velocity increased to 0.5 m/s, which is in line with the calculation results. The fluid velocity at the inlet and outlet of the channel was between 0.3~0.45 m/s. The fluid in the marking pool was marked by mixing under the action of the turbulent flow, and the fluid velocity in the marking pool was approximately 0.15 m/s. Because of its mechanical and dynamic characteristics, the fluid in the test cell was maintained at close to 0 m/s, and the fluid distribution was uniform, which met the set requirements. The fluid velocity distribution in different parts of the microfluidic glass chip was uniform, and the designed microfluidic glass chip met the expected requirements.

3. Results and Discussion

3.1. UVA UV Disinfection Test of Residual Liquid

The UVA ultraviolet disinfection test was carried out for the designed residual liquid treatment pipeline system, to study the relationship between flow rate, sterilization time and microbial concentration under different ultraviolet light intensities in facility agricultural production.

3.1.1. Test System Structure

As shown in Figure 6, the entire cultivation bed was divided into 3 rows, and each row had 11 cultivation grooves arranged in the same row. In order to increase the growth space and improve the lighting rate, the cultivation grooves were dislocated. The test time was 14 August 2021. The test site was in Suqian, Jiangsu province. Based on the base hydroponic platform, the structure diagram of the test device was designed, as shown in Figure 7, and the test device was built as shown in Figure 8.
In the tidal irrigation system, the automatic irrigation system pumps the nutrient solution from the storage bucket into the cultivation bed, the nutrient solution flows in the cultivation tank to form the cultivation liquid, and the cultivation liquid is approximately 2–3 cm deep. The nutrient solution after irrigation forms residual liquid and flows into the red collection bucket. The collection bucket contains an adjustable flow pump. The 25 W “Chuangning” brand adjustable flow pump was used. The suction port of the flow pump contains a filter screen, which can effectively filter out the residual impurities. The flow pump pumps the residual liquid into the UVA ultraviolet sterilizer for sterilization. The time-controlled switch was used to control the running time of the pump. The central control module of the sterilizer controls and displays the working power and time of the sterilizer. The residual liquid before and after disinfection was sampled and tested.

3.1.2. Test Plan and Content

Using UVA ultraviolet sterilization method, according to the distribution of microorganisms in the residual liquid, combined with the recovery amount of irrigation nutrient solution and the sterilization target, different ultraviolet light intensities and irradiation times were set to irradiate the nutrient recovery solution of crops to achieve sterilization.

3.1.3. Test Conditions and Parameters

The test site was Jiangsu Lvgang Modern Agriculture Development Co., Ltd. (Lianyungang, China), and the test object was the recovered liquid from the glass greenhouse test cultivation bed. The multi-parameter spectrum test was carried out with the power of ultraviolet light. The optical signal probe was located at the top of the analyzer. Then, the working switch of the UV sterilizer was turned on. Waiting for 30 s to make the light-emitting state of the lamp stable, the probe of the spectrum analyzer was placed at the water inlet and outlet of the sterilizer spectral test. The UVA ultraviolet sterilizer used was the Keyuan environmental protection pipeline type QL-RZ-UVA ultraviolet sterilizer; working power was 16–30 W, the theoretical disinfection time was 10~30 s, the voltage was 220 V 50/60 Hz, and the quartz tube model was QT5-580 ( 23 × 580   mm ). The size of the lamp tube was 15 × 550   mm , 425 mA, and the maximum working flow was 6 GPm. The water inlet and outlet were M20/21 (large diameter) external thread.
Before the inactivation test of the remaining liquid microorganisms was conducted by the UV disinfection equipment, the tube UVA UV sterilizer was first tested in full size. The effective length of the sterilizer was 520 mm, the distance between the water inlet and outlet was 470 mm, and the static volume of the UV sterilizer cavity was 1300 mL. According to the dosage requirements of the reclaimed water ultraviolet water disinfection equipment, the standard was 50~100 mJ/cm2. The calculation method of exposure dose is shown as follow.
Irradiation dose (mJ/cm2) = irradiation time (s) UVA intensity (mW/cm2).
The applicable dose range of the tested microorganism MS2 was between 10~120 mJ/cm2, while the applicable dose range of T1 and fecal Escherichia coli was between 2.5~25 mJ/cm2; therefore, the above dose range used for the UVA ultraviolet irradiation met the test requirements.

3.1.4. UVA Disinfection and Microbial Detection

(1)
Determine the disinfection time range
When other conditions were the same, especially in the working state of the same lamp, the working power P of the UV sterilizer was proportional to its irradiance Ee, and its proportionality coefficient was set to k, that is, P = k E e . According to the regeneration water, the dosage requirements of the UV water disinfection equipment and Table 3 determine the effective UV disinfection time range and coefficient k under different powers in Table 4. The coefficient k was stable at 29.98 on average, which met the requirements for using.
(2)
UV disinfection test
Under the condition that the parameters of the sterilizer remain unchanged, the larger the flow rate q, the shorter the disinfection time t. The larger the irradiance Ee, the higher the sterilization efficiency. The test process was divided according to the orthogonal test method, and the disinfection flow and sterilization time was set under different working conditions of the sterilizer. The UV transmittance of the remaining liquid was measured to be 70% > 45%, by using the UV-Vis spectrophotometer. Table 5 is a table of ultraviolet light intensity, sterilization time and microorganism concentration at different flow rates.
Three different radiation flux were set as 30 W, 25 W, and 16 W, and a cross-test under different ultraviolet light intensities was carried out. The power of the UV lamp (radiation flux) represents three different UV light intensities. When the radiation flux is 30 W and the disinfection time is 90 s, 70 s, 50 s and 30 s, respectively, the nutrient solution remains. The irradiation doses of the UV lamps were 90.54 mJ/cm2, 70.42 mJ/cm2, 50.3 mJ/cm2 and 30.18 mJ/cm2, respectively. When the radiation flux is 25 W and the disinfection time is 80 s, 60 s, 40 s and 20 s, respectively, the irradiation doses of the nutrient solution remaining liquid by the ultraviolet lamp are 69.68 mJ/cm2, 52.26 mJ/cm2, 34.84 mJ/cm2 and 17.42 mJ/ cm2. When the radiation flux is 16 W and the disinfection time is 100 s, 70 s, 40 s and 10 s, the irradiation doses of the nutrient solution remaining by the UV lamp are, respectively, 50.9 mJ/cm2, 35.63 mJ/cm2, 20.36 mJ/cm2 and 5.09 mJ/cm2. The disinfection time range was 10~100 s, and the irradiation dose range was between 5.09~90.54 mJ/cm2, which can verify the microbial sterilization law in a wider range and multiple dimensions.
(3)
Microbiological laboratory testing of residual liquid
In this experiment, the method of laboratory culture detection was used to detect the number of microorganisms in the residual liquid samples before and after sterilization. The medium was prepared according to the number of samples firstly tested.
(1)
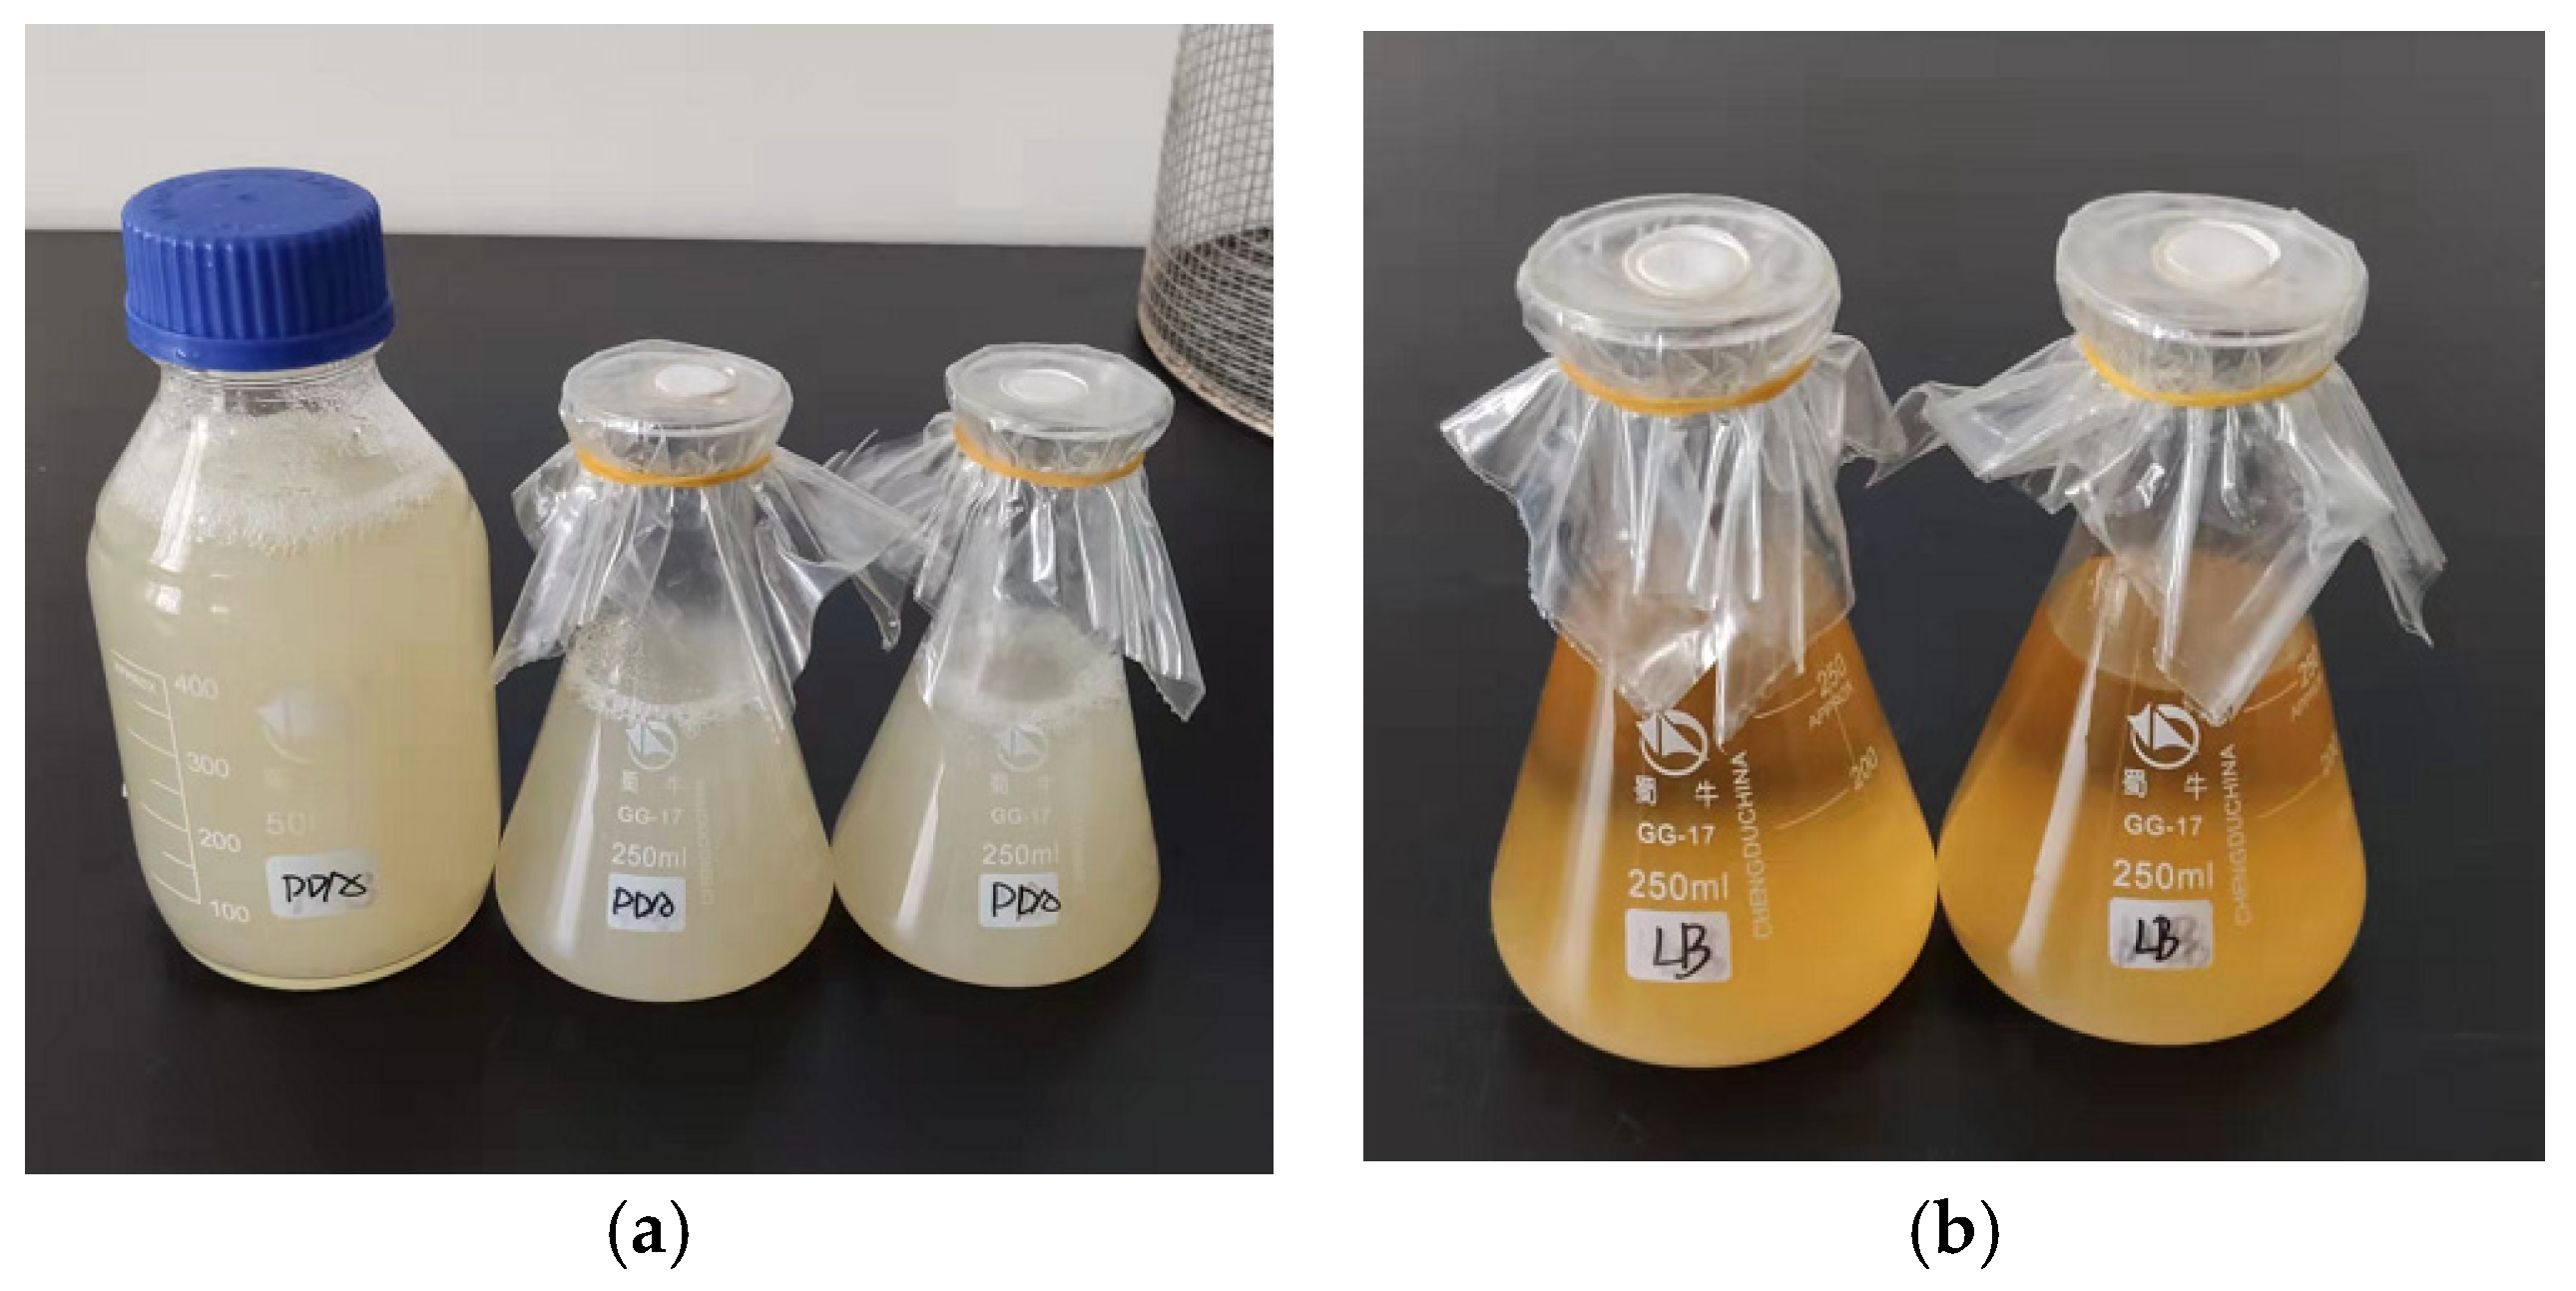
lb solid medium: Tryptone 10 g, yeast extract 5 g, sodium chloride 10 g, agar 15 g, adjust the pH to 7.0 with NaOH, with the volume diluted to 1000 mL with distilled water. Figure 9 is the test diagram for the preparation of lb solid medium. The medicine was added to a 1000 mL beaker, some distilled water was added and stirred in an electric heating constant temperature water bath until it was fully dissolved. Then, a pH meter was used to test the pH and a liquid dispenser was used to absorb a small amount of 5 mol/L NaOH solution to adjust the pH to 7.0. Finally, the distilled water was used to make up to 1000 mL; the solution needed to be stirred continuously during the process of pH adjustment and constant volume.
(2)
pda medium: 200 g potatoes, 20 g sucrose, 15~20 g agar, distilled water to 1000 mL.
Peeled and washed potatoes were cut into small pieces, water was added to boil, and then the potatoes were filtered with gauze. Agar was added, heated, and stirred evenly to dissolve the agar completely. Sucrose was added, stirred evenly, and distilled water was added to make the volume to 1000 mL after cooling slightly.
(3)
The prepared lb and pda medium and petri dish were sterilized in a high temperature sterilization box. Figure 9 shows the sterilized lb and pda solid medium.
The sterilization tests with different powers, from 16 W to 30 W, were performed, and four different samples were obtained by performing four tests at each power. For each group of test samples, the original culture and 10-fold dilution were carried out; the bacteria and fungi were cultured in lb solid (meat peptone) medium and pda (potato dextrose agar) medium, respectively, with a total of 56 culture units. The sterilized lb and pda mediums were poured into the petri dish respectively, so that they evenly covered the bottom of the dish with 2~3 mm. Then, lb was incubated at 37 °C for 24 h, and pda was incubated at 28 °C for 48 h.

3.2. Sterilization Test Results and Analysis

After the biological culture was completed, a high-definition camera was used to acquire culture images. ImageJ image processing software was used for colony counting, and the methods of image gray area segmentation, identification and point counting were used for data integration processing. Figure 10c is the ImageJ image point processing diagram, which integrates data with image point processing results as the main reference object.
As shown in Figure 11, when the working power of the UV sterilizer is 30 W, a disinfection time of 30 s can kill 60.67% of the germs in the remaining liquid; in addition, the sterilization rate of 50 s is 78.67%, and the sterilization rate of 70 s can kill nearly 90% of the germs. It takes approximately 100 s for the bacterial rate to reach 100%. Among them, when the disinfection time is 30 s, the water pump flow rate q is 0.156 m3·h−1. When the disinfection time is 90 s, the water pump flow rate is 0.052 m3·h−1. The stronger the UV light intensity, the higher the sterilization efficiency under the same state.
Under the current test conditions, the sterilization rate of 40 s at 25 W is approximately equivalent to the sterilization rate of 30 s at 30 W, the sterilization rate of 60 s at 30 W is approximately equivalent to the sterilization rate of 50 s at 30 W, and the sterilization rate of 80 s at 30 W is approximately equivalent to the sterilization rate of 70 s at 30 W. The sterilization efficiency is reflected in the time that the sterilization time of 30 W has a sterilization advantage of 10 s, which is relatively stable. When the working power is 16 W, due to the low working power and poor penetration rate, the sterilization rate when working for 100 s is only 81.33%. When the irradiation time is 10 s, the bacteria can hardly be killed, and the sterilization efficiency is low.
In Figure 11b, according to the relationship between irradiation dose, irradiation time and UVA intensity, the direct relationship between the sterilization rate and irradiation dose of residual microorganisms within the applicable dose range under the state of penetration rate of 70% was verified. In Table 4, the UVA intensities of 30~16 W are 1.006 mW/cm2, 0.871 mW/cm2 and 0.509 mW/cm2, respectively. In combination with Table 5, it can be concluded that the irradiation doses of 30 W sterilization for 70 s and 25 W sterilization for 80 s are 70.42 mJ/cm2 and 64.56 mJ/cm2, with similar sterilization rates of 89.33% and 87.53%, respectively. The irradiation doses of 30 W sterilization for 50 s, 25 W sterilization for 60 s, and 16 W sterilization for 100 s, were 50.30 mJ/cm2, 52.26 mJ/cm2 and 50.90 mJ/cm2, with similar sterilization rates of 78.67%, 80.95% and 81.33%, respectively. The irradiation doses of 30 W sterilization for 30 s, 25 W sterilization for 40 s and 16 W sterilization for 70 s were 30.18 mJ/cm2, 34.84 mJ/cm2 and 35.63 mJ/cm2, respectively, with similar sterilization rates of 60.67%, 65.62% and 62.81%, respectively.

3.3. Microfluidic Chip Bioluminescence Detection Test

Using the designed microfluidic chip, the laboratory bioluminescence detection test of the remaining liquid sample under the same conditions was carried out to test the accuracy of the CFD model of the microfluidic glass chip, and to verify the consistency and determination of the biofluorescence detection and laboratory culture detection.

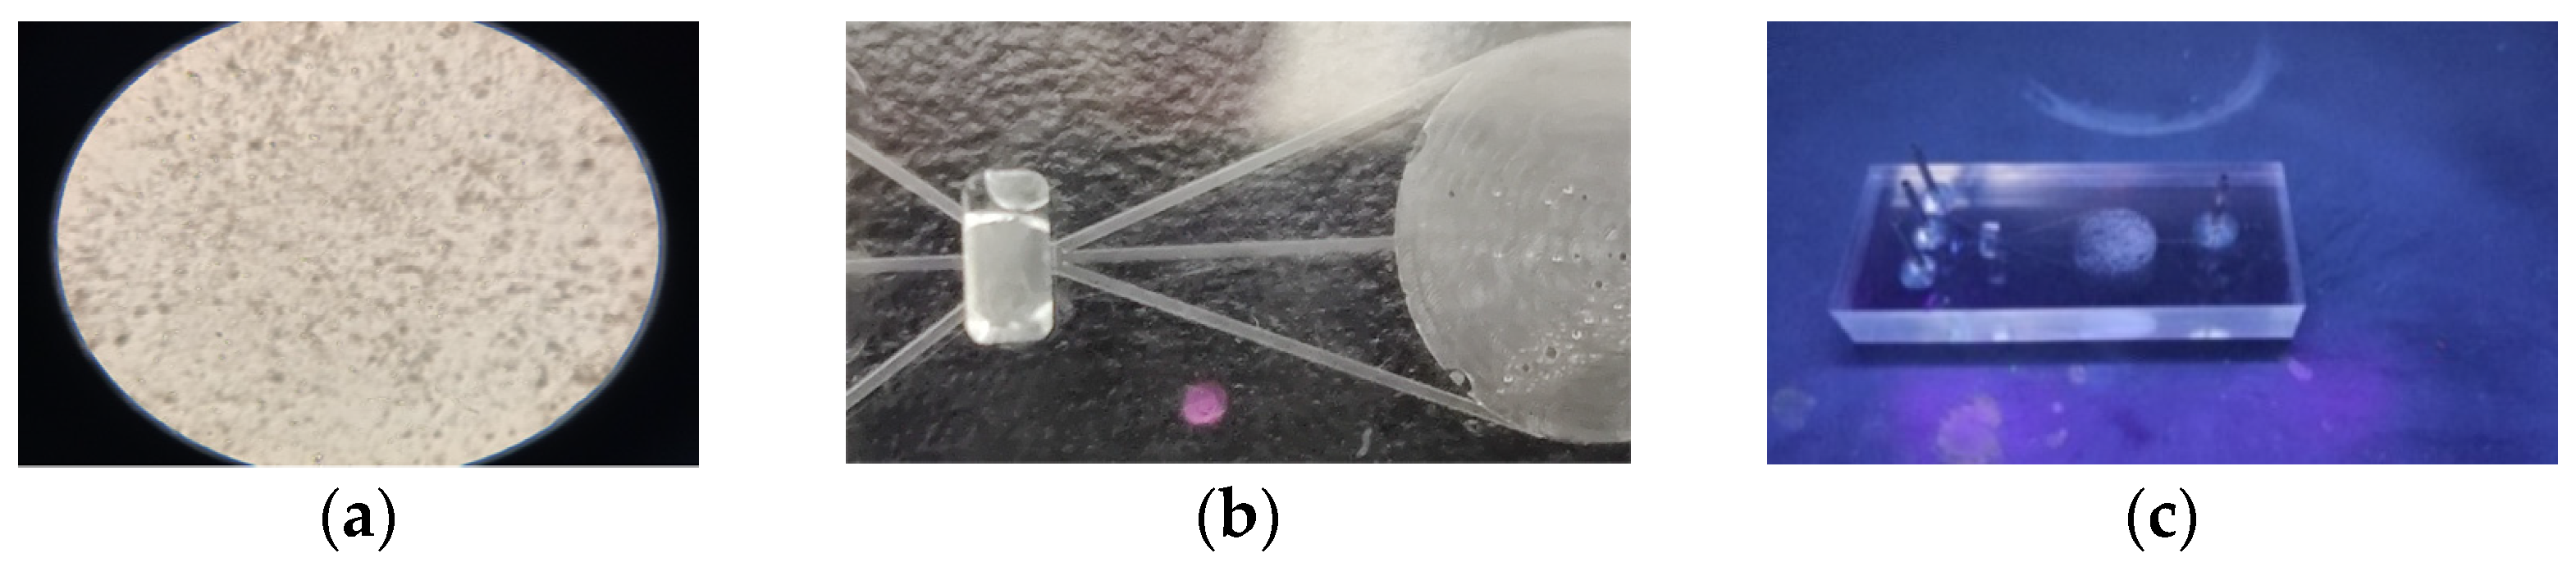
Biofluorescence Labeling and Detection

(1)
Sterilization absorbance detection of residual liquid
Because some microorganisms in the residual liquid have fluorescence characteristics and that test microorganisms have light absorption characteristics, the absorbance detection of the residual liquid after sterilization was carried out. The sterilization test of the residual liquid stock solution and microfiltration at 20 s, 30 s, 40 s, 50 s, 60 s, 70 s and 90 s, was carried out under 30 W, and the absorbance was detected by ultraviolet-visible spectrophotometer. A control test was established to dilute the above-mentioned residual liquid stock solution, 2, 3, 5 and 10 times for the same condition for absorbance detection. The parameter settings were based on the system default settings.
(2)
Bioluminescent labeling and detection
Steps: (a) A 2–10 mM DMSO stock solution was prepared. Next, 4.2 mg of fluorescent tracer probe FDA in 1 mL of DMSO was dissolved to make a 10 mM stock solution (1 mg/mL fluorescent tracer probe FDA is approximately equivalent to 2.4 mM). (b) A 1–20 μM dye working solution was prepared by diluting the DMSO stock solution from the above step with buffer (Hanks, Hepes/HHBS, ph7), and mixing well by vortexing. (c) Residual liquid sterilization samples were prepared (stock, 90 s, 70 s, 50 s and 30 s). When the ultraviolet light intensity was 30 W, the residual liquid sterilization treatment of 90 s, 70 s, 50 s and 30 s was carried out three times for a total of 15 groups of test samples. In order to simulate and verify the bioluminescence optical performance of the microfluidic glass chip during use, the sample dye working solution volume V c h e c k = 4   μ L was extracted and placed in a custom-made quartz cuvette for fluorescence spectrum detection. (d) Microscopic and fluorescence observations were carried out on the remaining liquid and the sample dye working solution, as shown in Figure 12.

3.4. Results and Analysis of the Online Monitoring Test of Microorganisms in the Residual Liquid of the Nutrient Solution

When the ultraviolet light intensity was 30 W, the absorbance of sterilization was tested to verify the influence of living cell microorganisms on the absorbance; this was used to analyze the possibility of absorbance detection in the detection of residual liquid microorganisms and the proportion of live bacteria in the fluorescence emitted by the labeled organisms. The test results are shown in Figure 13. It can be seen from Figure 13a that the residual liquid has been sterilized at 30 W. In addition, the absorbance detection chart shows that, when the times are 20 s, 30 s, 40 s, 50 s, 60 s, 70 s and 90 s under 30 W ultraviolet light intensity, the absorbance values of the sterilization test sample do not change significantly, and there is a weak peak. At the optimum wavelength close to 300 nm, the absorbance value was approximately 0.07. It shows that the particulate impurities in the residual liquid and some microorganisms themselves have fluorescent properties, and the fluorescent properties have a weak effect on the absorbance and can be ignored. The sterilization treatment at different times has no significant effect on the absorbance of the tested samples. The proportion of viable bacteria has no effect on the absorbance. In Figure 13b, the change of the absorption value after dilution is consistent with the dilution ratio, which is linear, indicating that the absorption value of the sample represents the total concentration of the solvent (nutrient ions, particulate impurities, live/dead bacteria) in the remaining liquid. This eliminates the influence of the proportion of viable bacteria on the fluorescence transmittance of bioluminescence detection, thereby avoiding the impact on the capture of fluorescence signals.
The relationship between the fluorescent signal after labeling and the biomass of the sample is shown in Figure 14. In the figure, the emission wavelength of the live cell fluorescent tracer probe FDA is 513 nm. The longer the sterilization time is, the lower the number of viable bacteria in the sample and the weaker the fluorescence intensity. The maximum fluorescence intensity of the stock solution sample is 423,820.75 CPS. The ratio U/V of biofluorescence intensity to bacterial population was stabled between 27.07 and 30.37, and the average coefficient was 28.79, that is, the proportional coefficient m = 28.79 between the biomass y of the remaining liquid and the number of fluorescent photons N t under the current conditions. The detection of live cell fluorescent labeling can more accurately reflect the biomass in the remaining liquid.
SPSS software(Version No: 22.0, company: SPSS, location: Chicago, IL, USA) was used for a correlation test; the Pearson correlation value is 0.0003 < 0.01, so the correlation is significant. The online monitoring technology of microorganisms in the residual liquid of nutrient solution is a microfluidic bioluminescence detection technology based on a microfluidic chip. During detection, the system takes samples from the nutrient solution residual liquid loop for biofluorescence labeling, and the detection device indirectly measures the concentration of microorganisms in the sampling pipeline by extracting the number of fluorescent photons. The relationship obtained in this experiment is y = 28.79 N t . Therefore, the concentration of microorganisms in the detected loop is y/ V c h e c k , whereby, V c h e c k is the volume of the microfluidic chip inspection pool (Table 6).

3.5. Discussion of the Results

A UVA disinfection system and microbial online monitoring system was designed in this paper. It can detect the sterilization effect while sterilizing, and perform secondary sterilization when the sterilization quality meets the requirements, and the sterilization quality is guaranteed. The nutrient solution after sterilization can lay the foundation for the secondary fertilizer utilization of the nutrient solution returning to the solution, avoid the spread of plant viruses, and reduce the cost of hydroponic cultivation in the greenhouse.
The reliability of the online monitoring system for microorganisms has been verified by tests, which can ensure the accuracy of the detection results in microorganisms. The reliability of the microfluidic chip is the guarantee of the reliability of the microorganism online monitoring system, so the reliability of the microfluidic chip has also been verified by the test results. The development of this system is of great significance to the reuse of the hydroponic nutrient solution, which can improve the economic value and environmental protection of hydroponic cultivation. The consistency between bioluminescence detection and laboratory culture detection is high, and the standard error is 0.002, which is lower than the overall required error accuracy level of domestic and foreign research (0.02), which meets the requirements [21,22,23].
The microfluidic chip and online detection system developed in this paper have been tested and verified, and their feasibility and accuracy have reached the industry standard. The online detection system is more convenient and efficient than the existing common detection methods. This study can disinfect the returned solution of the hydroponic nutrient solution and detect it online. It can improve the effect and efficiency of nutrient solution configuration and reuse of nutrient solution return. It is of great significance for the allocation of the existing hydroponic nutrient solution and the reuse of the returned solution.

4. Conclusions

(1)
When the central wavelength of the UVA ultraviolet sterilizer is 439 nm, the working power is 30 W, 25 W and 16 W, respectively, and the UV penetration rate of the remaining liquid is 70%, the disinfection time range is controlled between 10~100 s, and the irradiation dose range is 5.09~90.54 mJ/cm2. When other conditions are the same, the relationship between the working power P of the UVA ultraviolet sterilizer used and its irradiance Ee is P = 29.98 E e .
(2)
The microbial culture test of the residual liquid before and after disinfection was carried out. When the power of ultraviolet sterilization is 30 W, 25 W and 16 W, as the disinfection time increases, the sterilization rate keeps increasing. When the working power of the UV sterilizer is 30 W, the sterilization rate of the disinfection time is 60.67% for 30 s, 78.67% for 50 s, and 94% for 70 s. It takes about 100 s for the sterilization rate to reach 100%. With the increase in the time that the residual liquid flows through the UV sterilizer cavity, the number of microorganisms in the residual liquid continues to decrease. When the residual liquid flows through the ultraviolet sterilizer cavity for 10 s, the maximum flow rate is 0.158 m3·h−1, When the time is 100 s, the minimum flow rate is 0.018 m3·h−1. Under the condition that other conditions remain unchanged, the direct influencing factor of the ultraviolet disinfection rate of the nutrient solution residual liquid is the ultraviolet light irradiation dose.
(3)
The simulation analysis results of the channel performance of the microfluidic chip show that when t = 4 s, the fluid evenly covers the test cell and keeps the velocity close to 0 m/s, and the fluid velocity at the inlet and outlet of the channel is between 0.3 m/s and 0.45 m/s. This is consistent with the calculation results. The designed microfluidic glass chip meets expectations.
(4)
In the liquid-return biofluorescence detection test and residual liquid sterilization absorbance detection test based on the microfluidic chip, when the power of ultraviolet sterilization is 30 W, the absorbance value of different sterilization test samples does not change significantly. In addition, there are weak peaks, which are close to the optimal wavelength (300 nm), and the absorption value is approximately 0.07. The sterilization time has little effect on the absorbance of the detected sample.

Author Contributions

Conceptualization: X.W., W.F. and Z.Z. reviewed the literature and wrote the initial draft of the paper, X.W. contributed to revising the manuscript. All authors have read and agreed to the published version of the manuscript.

Funding

This work was supported by Jiangsu Province Modern Agricultural Machinery Equipment, Technology Demonstration and Promotion Project (No. NJ2020-14), Project of the Agricultural Equipment Faculty of Jiangsu University (No. NZXB20200104) and Kunshan Municipal Science and Technology Project (KN2202).

Institutional Review Board Statement

Not applicable.

Informed Consent Statement

Not applicable.

Data Availability Statement

Not applicable.

Conflicts of Interest

The authors declare no conflict of interest.

References

  1. Wang, X.; Hu, X.; Hu, C.; Wei, D. Sequential use of ultraviolet light and chlorine for reclaimed water disinfection. J. Environ. Sci. 2011, 23, 1605–1610. [Google Scholar] [CrossRef] [PubMed]
  2. Wang, Y.; Bai, M.; Jiang, H.; Zhang, M.; Zhang, C. Removal of resistance genes in simulated pipeline network by chlorine/chloramine and low-pressure UV sequential disinfection. China Environ. Sci. 2022, 42, 1–10. [Google Scholar]
  3. Lv, D. Multi-barrier disinfection strategy for drinking water and application of UV disinfection technology. Water Purif. Technol. 2019, 38, 1–6. [Google Scholar]
  4. Zhang, T.; Hu, Y.; Jiang, L.; Yao, S.; Lin, K.; Zhou, Y.; Cui, C. Removal of antibiotic resistance genes and control of horizontal transfer risk by UV, chlorination and UV/chlorination treatments of drinking water. Chem. Eng. J. 2018, 358, 589–597. [Google Scholar] [CrossRef]
  5. Zhang, M.; Wang, L.; Xu, M.; Zhou, H.; Wang, S.; Wang, Y.; Bai, M.; Zhang, C. Selective antibiotic resistance genes in multiphase samples during biofilm growth in a simulated drinking water distribution system: Occurrence, correlation and low-pressure ultraviolet removal. Sci. Total Environ. 2018, 649, 146–155. [Google Scholar] [CrossRef] [PubMed]
  6. Ma, W.; Dan, Q.; Ma, W.; Yin, B.; Cao, T.; Jiang, C.; Xu, Y. Research on greenhouse nutrient solution recycling device and disinfection effect. Northeast Agric. Sci. 2019, 44, 52–56. [Google Scholar]
  7. Tsunedomi, A.; Miyawaki, K.; Masamura, A.; Nakahashi, M.; Mawatari, K.; Shimohata, T.; Uebanso, T.; Kinouchi, Y.; Akutagawa, M.; Emoto, T.; et al. UVA-LED device to disinfect hydroponic nutrient solution. J. Med. Investig. 2018, 65, 171–176. [Google Scholar] [CrossRef] [Green Version]
  8. Fan, J.; Wu, S.; Chu, C.; Zhou, D.; Jiang, Z. Research progress on recycling of nutrient solution waste in soilless culture. J. Agron. 2014, 4, 51–53. [Google Scholar]
  9. Liu, W.; Huang, C. Effects of the circulation pump type and ultraviolet sterilization on nutrient solutions and plant growth in plant factories. HortTechnology 2019, 29, 189–198. [Google Scholar] [CrossRef] [Green Version]
  10. Kwon, S.-Y.; Ryu, S.-H.; Lim, J.-H. Design and implementation of an integrated management system in a plant factory to save energy. Clust. Comput. 2014, 17, 727–740. [Google Scholar] [CrossRef]
  11. Settanni, L.; Miceli, A.; Francesca, N.; Cruciata, M.; Moschetti, G. Microbiological investigation of Raphanus sativus L. grown hydroponically in nutrient solutions contaminated with spoilage and pathogenic bacteria. Int. J. Food Microbiol. 2013, 160, 344–352. [Google Scholar] [CrossRef] [PubMed] [Green Version]
  12. Lu, J.; Cheng, M.; Zhao, C.; Li, B.; Peng, H.; Zhang, Y.; Shao, Q.; Hassan, M. Application of lignin in preparation of slow-release fertilizer: Current status and future perspectives. Ind. Crop. Prod. 2022, 176, 114267. [Google Scholar] [CrossRef]
  13. Solanki, S.; Pandey, C.M.; Gupta, R.K.; Malhotra, B.D. Emerging Trends in Microfluidics Based Devices. Biotechnol. J. 2020, 15, e1900279. [Google Scholar] [CrossRef] [PubMed]
  14. Sun, R.; Fu, Y. Research progress of rapid detection technology of microorganisms in planetary protection. J. Kunming Univ. Sci. Technol. (Nat. Sci. Ed.) 2021, 46, 147–157. [Google Scholar]
  15. Yager, P.; Edwards, T.; Fu, E.; Helton, K.; Nelson, K.; Tam, M.R.; Weigl, B.H. Microfluidic diagnostic technologies for global public health. Nature 2006, 442, 412–418. [Google Scholar] [CrossRef]
  16. Cui, P.; Wang, S. Application of microfluidic chip technology in pharmaceutical analysis: A review. J. Pharm. Anal. 2019, 9, 238–247. [Google Scholar] [CrossRef]
  17. Tozar, T.; Boni, M.; Andrei, I.R.; Pascu, M.L.; Staicu, A. High performance thin layer chromatography densitometry method based on picosecond laser-induced fluorescence for the analysis of thioridazine and its photoproducts. J. Chromatogr. A 2021, 1655, 462488. [Google Scholar] [CrossRef]
  18. Hussein, S.A.E.-R.; El-Wadood, H.M.A.; Abdallah, M.A.-E.W.; Khorshed, A.A.E.-H. HPTLC with Fluorescence Densitometry for Simultaneous Determination of Some Angiotensin II Receptor Blockers in Tablets and Plasma. J. AOAC Int. 2015, 98, 354–360. [Google Scholar] [CrossRef]
  19. Coran, S.; Bartolucci, G.; Bambagiotti-Alberti, M. Selective determination of aloin indifferent matrices by HPTLC den-sitometry in fluorescence mode. J. Pharm. Biomed. Anal. 2011, 54, 422–425. [Google Scholar] [CrossRef]
  20. Nightingale, A.M.; Hassan, S.-U.; Warren, B.M.; Makris, K.; Evans, G.W.H.; Papadopoulou, E.; Coleman, S.; Niu, X. A Droplet Microfluidic-Based Sensor for Simultaneous in Situ Monitoring of Nitrate and Nitrite in Natural Waters. Environ. Sci. Technol. 2019, 53, 9677–9685. [Google Scholar] [CrossRef]
  21. Yang, N.; Wang, P.; Zhang, R.; Xu, P.; Sun, J.; Mao, H. Photoelectric detection method of rice smut spores based on enrichment microfluidic chip. Chin. J. Agric. Eng. 2017, 33, 161–168. [Google Scholar]
  22. Abdullafva, A.M.; Blinkova, L.P.; Usha, B.V.; Pakhomov, Y.D. Method for Express Detection of Viable Microorganisms in Meat and Meat Products. Patent RU20200126113, 5 August 2020. [Google Scholar]
  23. Singh, K.R.; Nayak, V.; Singh, J.; Adetunji, C.O.; Singh, R.P. Introduction: Potentialities of bionanomaterials towards the environmental and agricultural domain. In Bionanomaterials for Environmental and Agricultural Applications; IOP Publishing: Bristol, UK, 2021; pp. 1–19. [Google Scholar]
Figure 1. Schematic diagram of residual liquid treatment pipeline system. 1—collection pool, 2—single suction pipeline pump, 3—water meter A, 4—pressure gauge A, 5—tertiary filter, 6—storage pool, 7—pipeline pump, 8—water meter B, 9—pressure gauge B, 10—PWM injector A, 11—microbial fluorescence monitoring pool A, 12—UVA ultraviolet sterilizer, 13—microbial fluorescence monitoring pool B, 14—PWM injector B, 15—solenoid valve A, 16—pressure gauge C, 17—post-treatment tank, 18—mixing tank, 19—pump, 20—solenoid valve B, 35—flow sensor A, 36—pressure sensor A, 37—flow sensor B, 38—pressure sensor B, 39—pressure sensor C. (a–d represents the direction of the change-over switch and also the flow direction of the liquid).
Sustainability 15 00173 g001
Figure 2. Microbial monitoring system structure diagram. 21—microfluidic glass chip, 29—photoelectric processor, 30—photosensitive plate, 31—laser light source, 32—excitation color filter, 33—reflector, 34—optical channel. (The filter used in this paper is a band-pass filter).
Sustainability 15 00173 g002
Figure 3. Schematic diagram of microfluidic glass chip structure. 21—microfluidic glass chip, 22—fluorescent molecular probe port, 23—pure water port, 24—sampling port, 25—marking cell, 26—check cell, 27—liquid outlet port.
Sustainability 15 00173 g003
Figure 4. 3D drawing and dimension drawing of microfluidic chip. (a) 3D model of microfluidic glass chip; (b) size of microfluidic chip.
Sustainability 15 00173 g004
Figure 5. Plane velocity cloud map of microfluidic glass chip at t = 4 s.
Sustainability 15 00173 g005
Figure 6. Test site situation. (a) Cultivation bed for the test; (b) Schematic diagram of the cross-sectional dimension of the cultivation bed.
Sustainability 15 00173 g006
Figure 7. Test device structure diagram.
Sustainability 15 00173 g007
Figure 8. UVC disinfection test device. 1—Time control switch, 2—Central control module, 3—UVA ultraviolet sterilizer, 4—Transformer.
Sustainability 15 00173 g008
Figure 9. lb and pda solid medium. (a) pda medium; (b) lb medium.
Sustainability 15 00173 g009
Figure 10. Image gray area segmentation and recognition and ImageJ image point processing. (a) Grayscale processed image; (b) Image recognition result; (c) ImageJ image point processing.
Sustainability 15 00173 g010
Figure 11. Disinfection time-sterilization rate diagram and flow-sterilization rate relationship diagram. (a) Disinfection time-sterilization rate diagram (b) Flow rate-sterilization rate diagram.
Sustainability 15 00173 g011
Figure 12. Microfluidic glass chip test effect display diagram. (a) Microscopic image of microorganisms in the residual liquid in the microfluidic glass control chip inspection tank; (b) Ten times magnification of the area of the microfluidic glass control chip; (c) The marked residual liquid emits fluorescence under UV lamp irradiation.
Sustainability 15 00173 g012
Figure 13. Residual liquid absorbance test result chart. (a) The 30 W sterilization absorbance detection of residual liquid; (b) dilution control test of residual liquid stock solution.
Sustainability 15 00173 g013
Figure 14. The detection curve of biofluorescence labeling and the comparison of fluorescence intensity and bacterial quantity after sterilization by ultraviolet light of 30 W intensity of residual liquid. (a) Detection of biofluorescence labeling after sterilization by 30 W ultraviolet light of residual liquid; (b) Comparison curve of fluorescence intensity and bacterial count.
Sustainability 15 00173 g014
Table 1. Boundary condition parameter.
ParameterType v 1 (m/s) v 2 (m/s) v 3 (m/s)Turbulence Coefficient v 1 (m/s) v 2 (m/s) v 3 (m/s)Tag Pool Properties
Entrance 22speed entry0.004320.005410.007211.10.003930.004920.00655Turbulence intensity: 1.18%
Entrance 230.006480.081150.10800.005890.073770.09818
Entrance 240.004320.005410.007210.003930.004920.00655
Entrance 27speed exit0000000
Table 2. Parameters related to material properties in CFD model of microfluidic chip.
MaterialDensity (kg·m−3)Specific Heat Capacity (J·kg−1·k−1)TransmittanceViscosityRefractive Index
PMMA177014640.92/1.51
pure water100042000.991.011.10
residual liquid100540800.981.321.15
dye107019500.751.471.89
Table 3. Optical parameters of UVA sterilizer lamp.
Power (W)Wave (nm)Value (uW/cm2/nm)Bek (uW/lm)Ee (mW/cm2)
30439.048.5341.871.006
25439.043.4181.830.871
16439.028.1341.780.509
Table 4. Sterilization time and scaling factor.
Power (W)Ee (mW/cm2)T (s)ki
301.00649.70–99.3029.82
250.87157.41–114.8128.71
160.50998.23–196.4631.42
Table 5. UV light intensity, sterilization time and microbial concentration at different flow rates.
Power of Ultraviolet Lamp (Radiation Flux) (W)Pump Flow q/(m3·h−1)Time to Flow through the UV Sterilizer Chamber/sMicrobial Sterilization Rate after One Disinfection (%)
300.0529094
0.0677089.33
0.0945078.67
0.1563060.67
250.0368087.53
0.0486080.95
0.0724065.62
0.1442023.79
160.01810081.33
0.0267062.81
0.0534041.36
0.158107.89
Table 6. 30 W bactericidal biological fluorescence intensity and bacterial count.
WavelengthStrength UThe Amount of Bacteria after Disinfection V/IndividualRatio (U/V)m Value
513423,820.815,03728.2528.79
421,44213,87730.37
157,925.1583427.07
23,230.777729.91
8528.5930128.35
Disclaimer/Publisher’s Note: The statements, opinions and data contained in all publications are solely those of the individual author(s) and contributor(s) and not of MDPI and/or the editor(s). MDPI and/or the editor(s) disclaim responsibility for any injury to people or property resulting from any ideas, methods, instructions or products referred to in the content.

