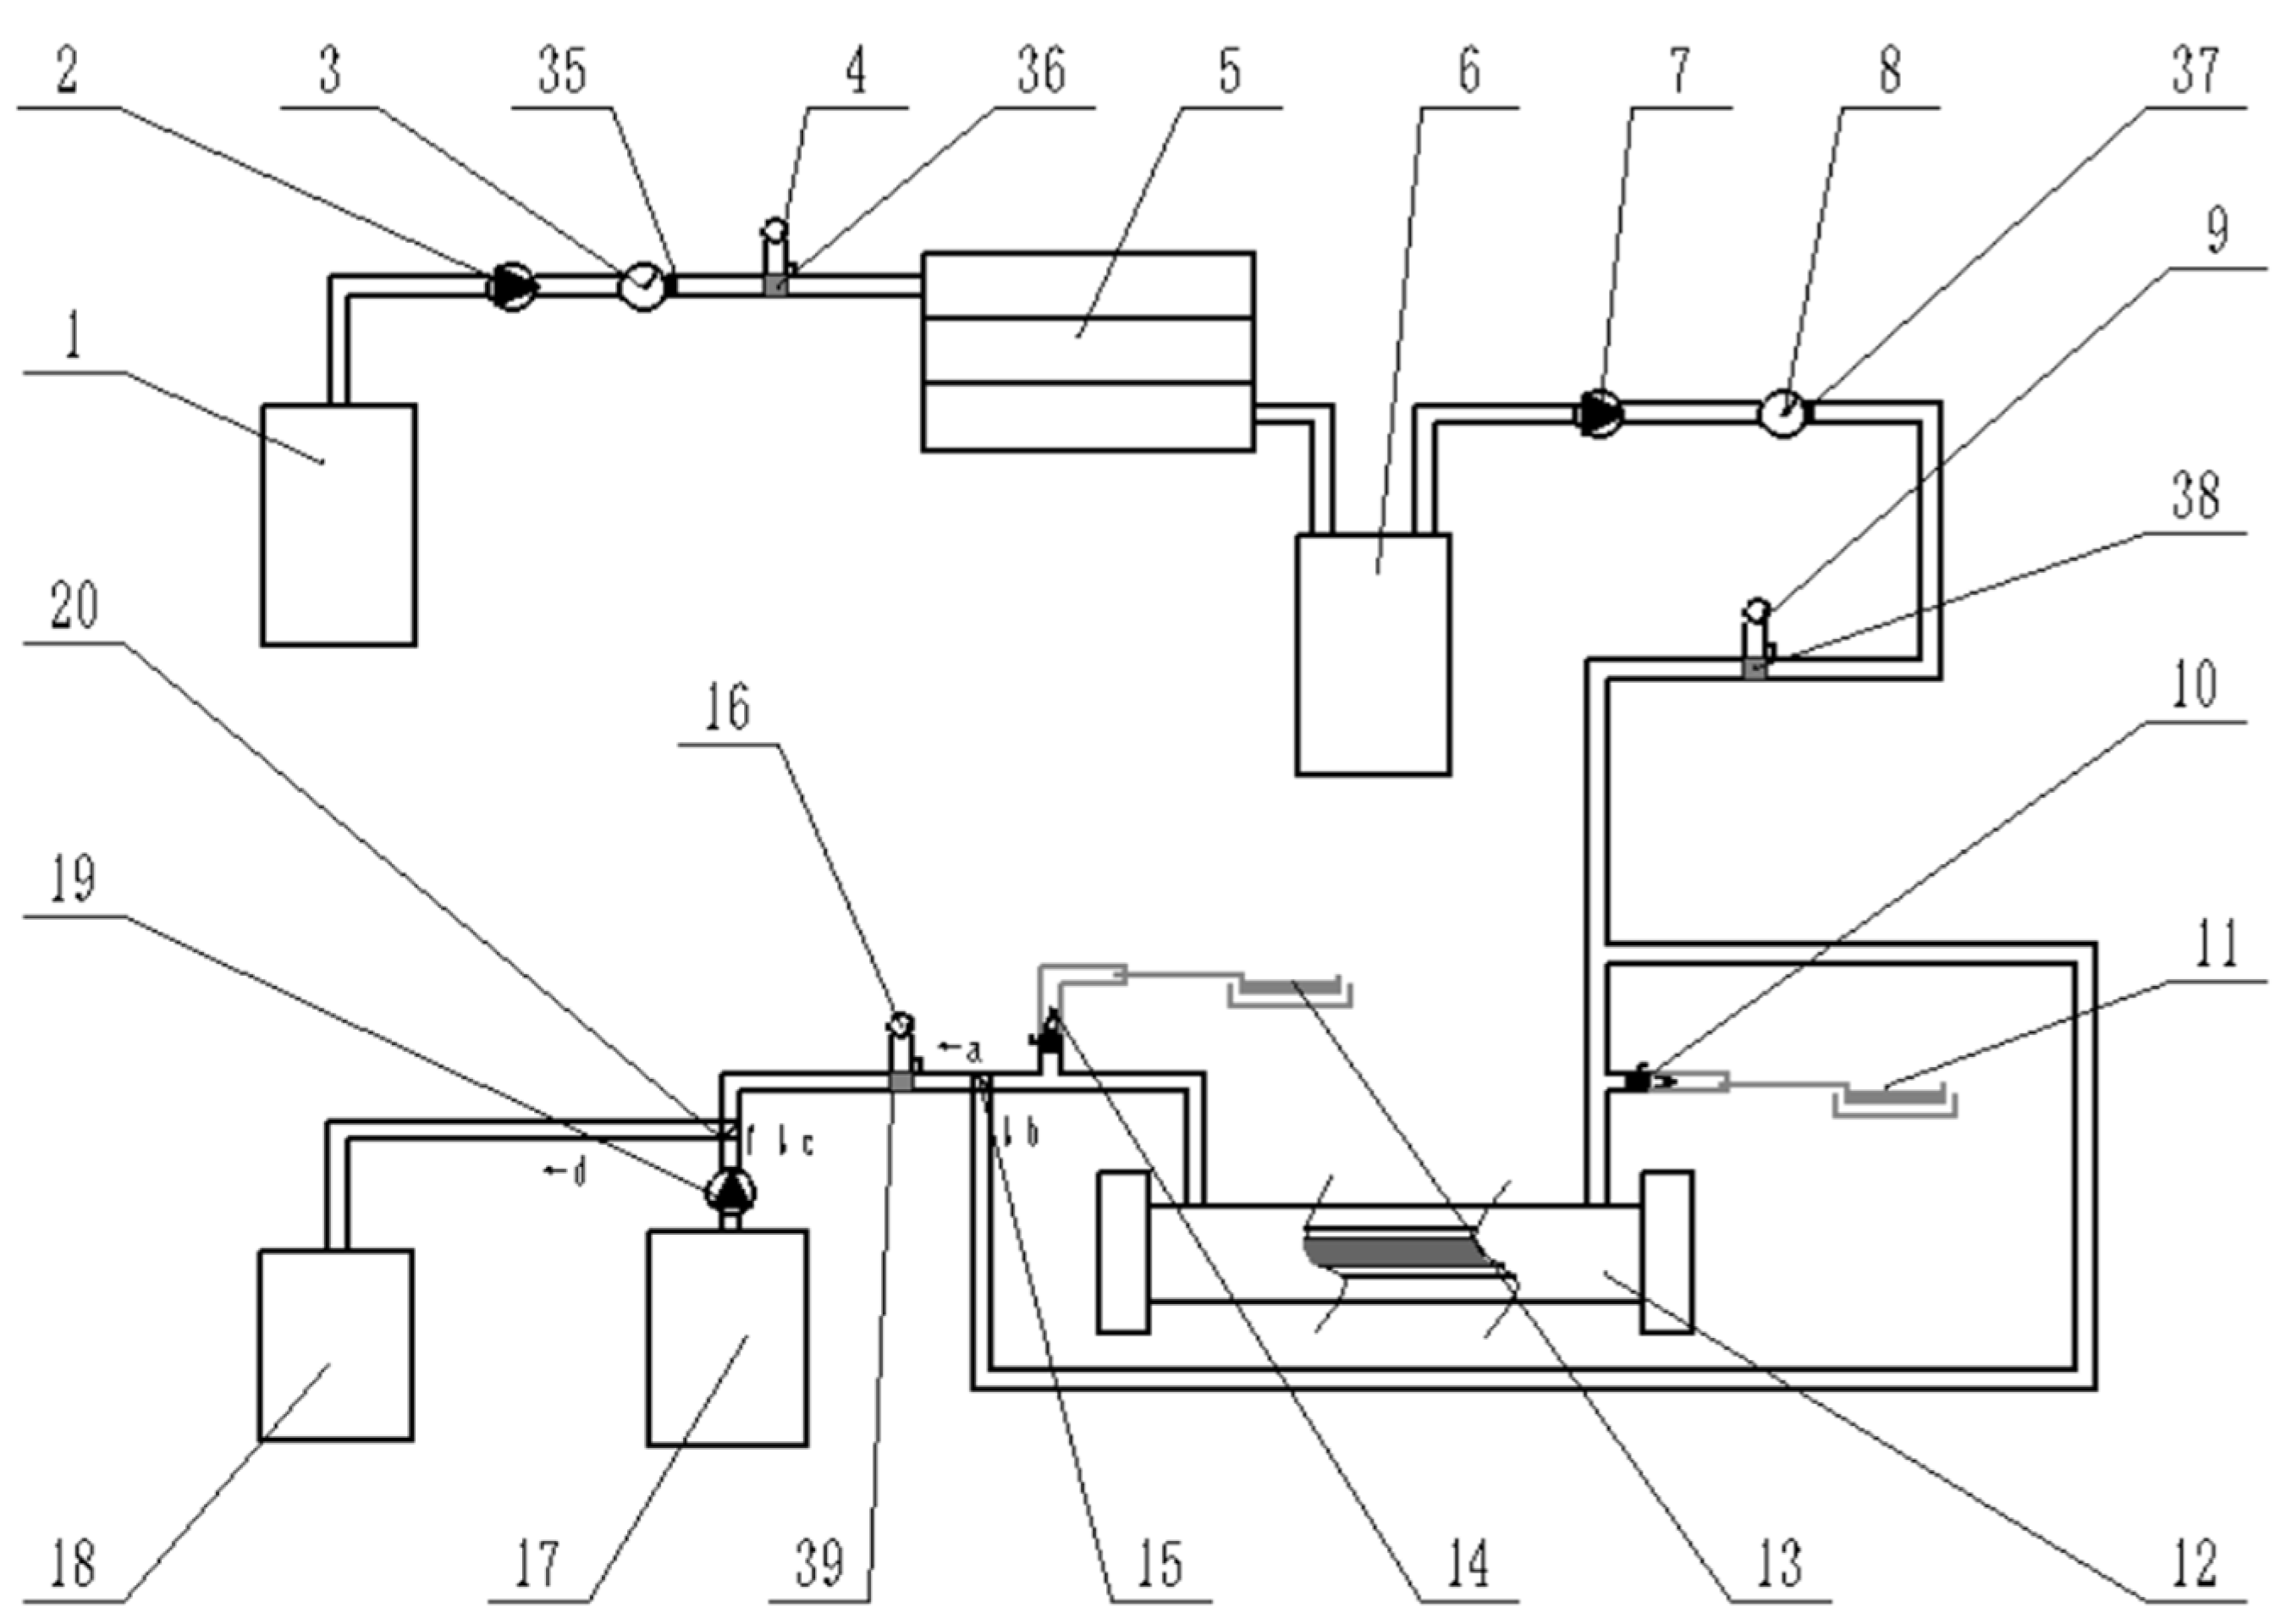
Figure 1.
Schematic diagram of residual liquid treatment pipeline system. 1—collection pool, 2—single suction pipeline pump, 3—water meter A, 4—pressure gauge A, 5—tertiary filter, 6—storage pool, 7—pipeline pump, 8—water meter B, 9—pressure gauge B, 10—PWM injector A, 11—microbial fluorescence monitoring pool A, 12—UVA ultraviolet sterilizer, 13—microbial fluorescence monitoring pool B, 14—PWM injector B, 15—solenoid valve A, 16—pressure gauge C, 17—post-treatment tank, 18—mixing tank, 19—pump, 20—solenoid valve B, 35—flow sensor A, 36—pressure sensor A, 37—flow sensor B, 38—pressure sensor B, 39—pressure sensor C. (a–d represents the direction of the change-over switch and also the flow direction of the liquid).
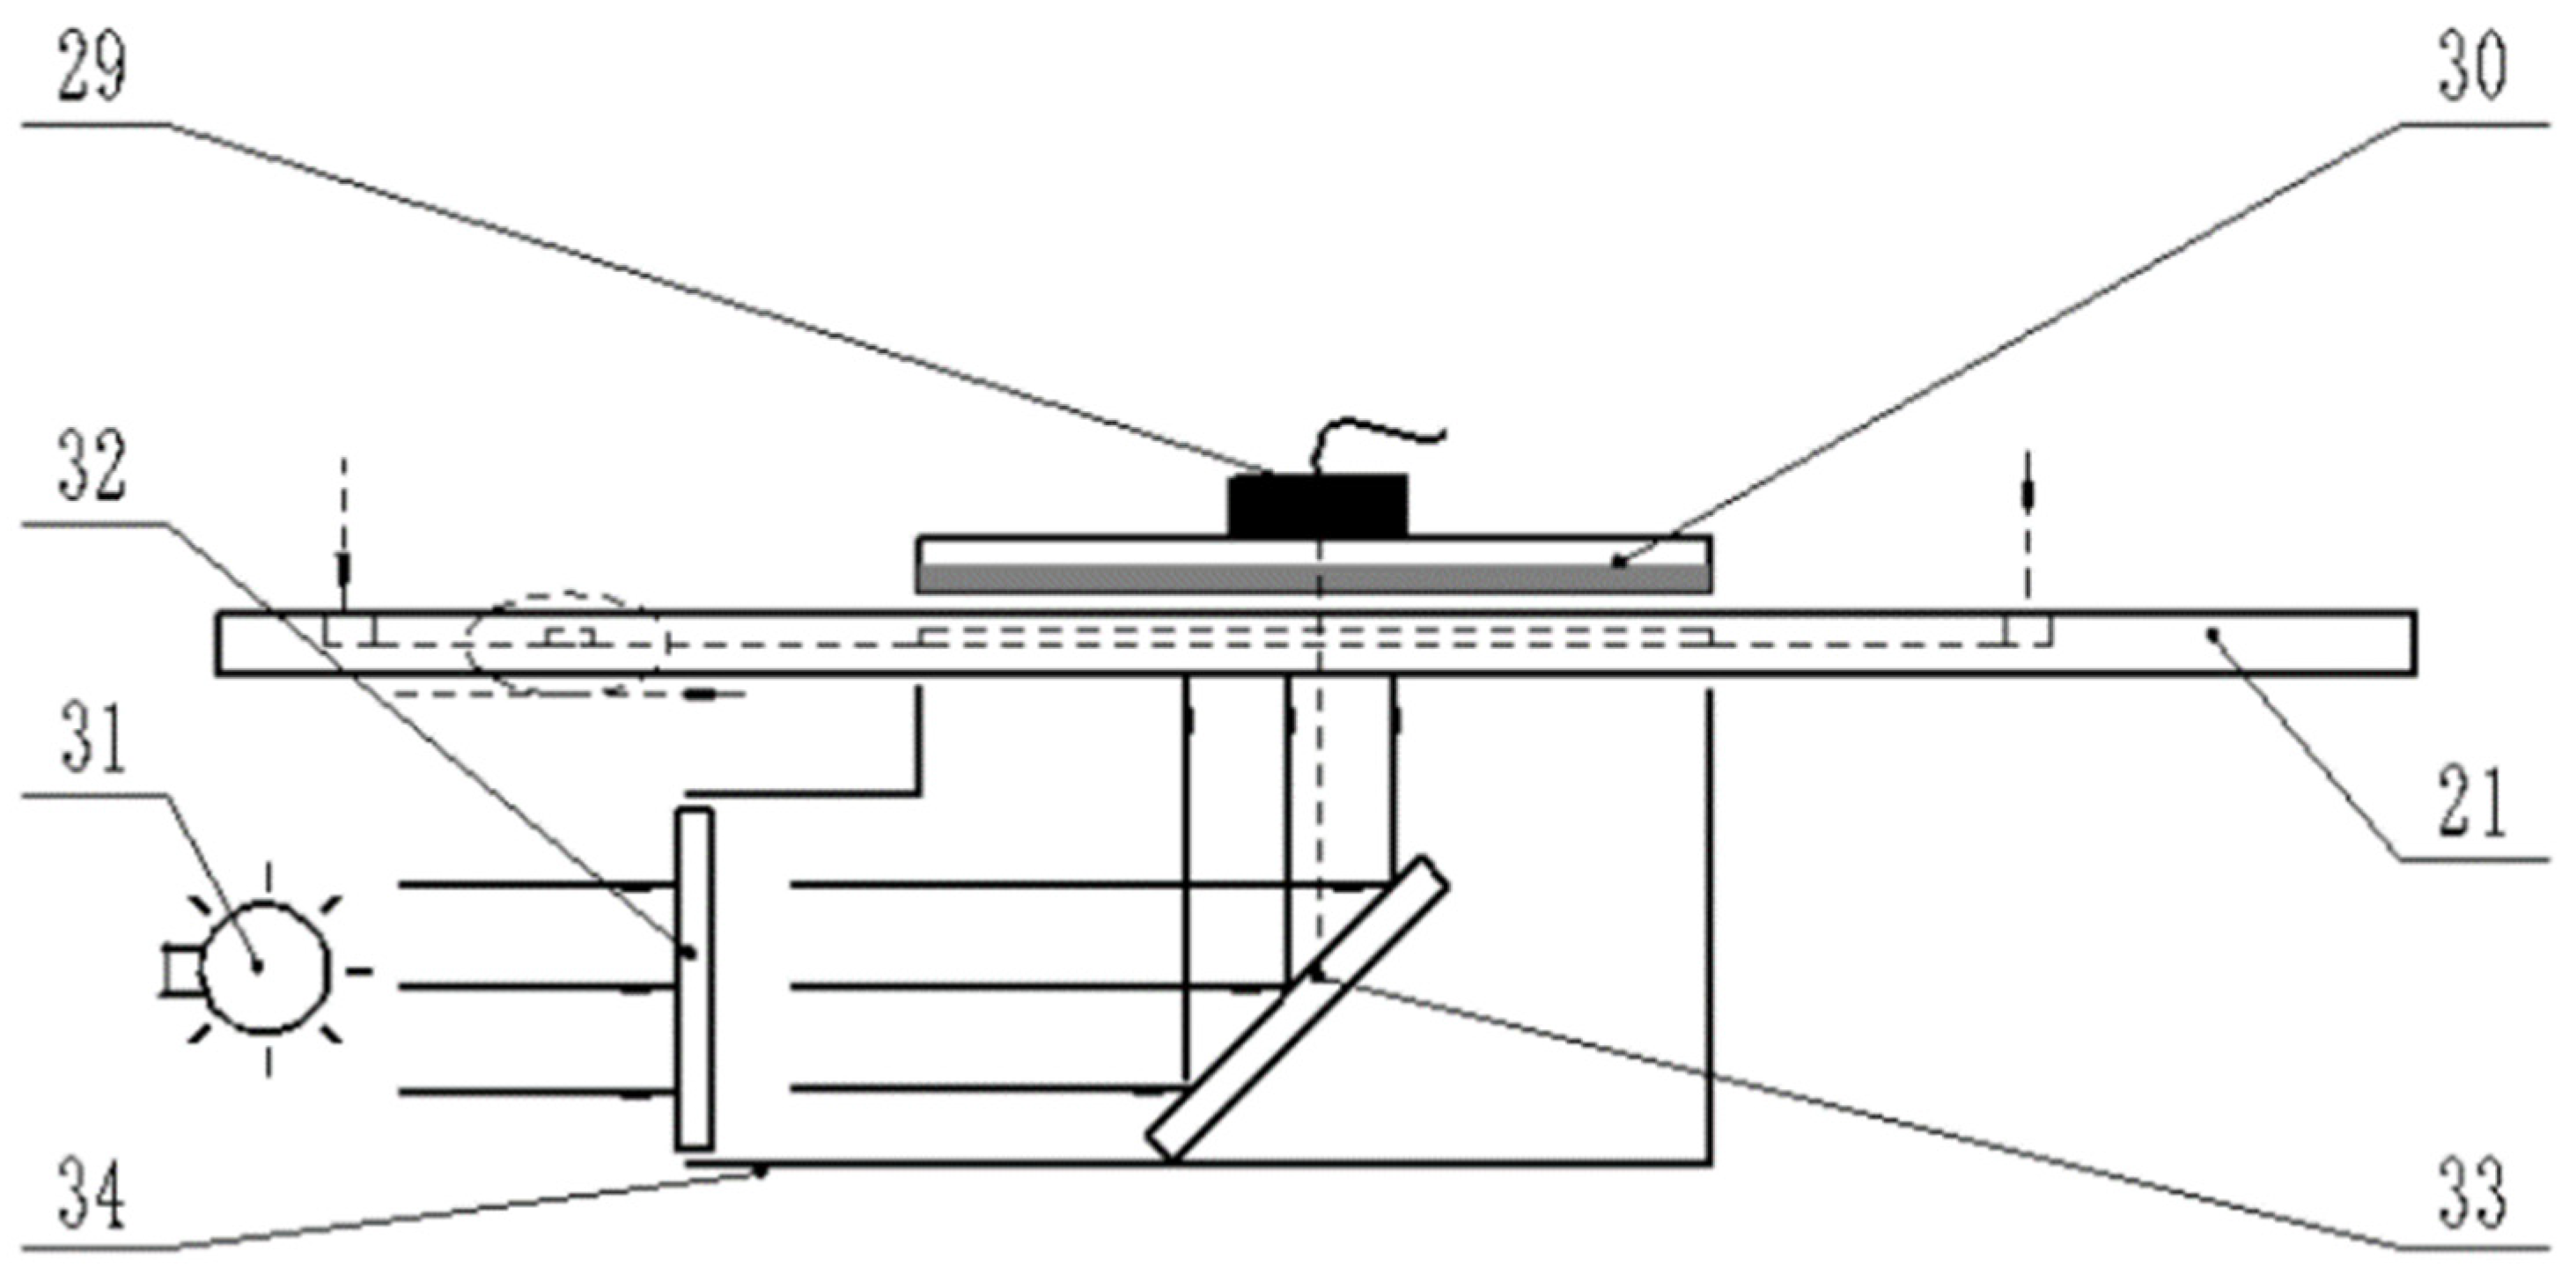
Figure 2.
Microbial monitoring system structure diagram. 21—microfluidic glass chip, 29—photoelectric processor, 30—photosensitive plate, 31—laser light source, 32—excitation color filter, 33—reflector, 34—optical channel. (The filter used in this paper is a band-pass filter).
Figure 2.
Microbial monitoring system structure diagram. 21—microfluidic glass chip, 29—photoelectric processor, 30—photosensitive plate, 31—laser light source, 32—excitation color filter, 33—reflector, 34—optical channel. (The filter used in this paper is a band-pass filter).
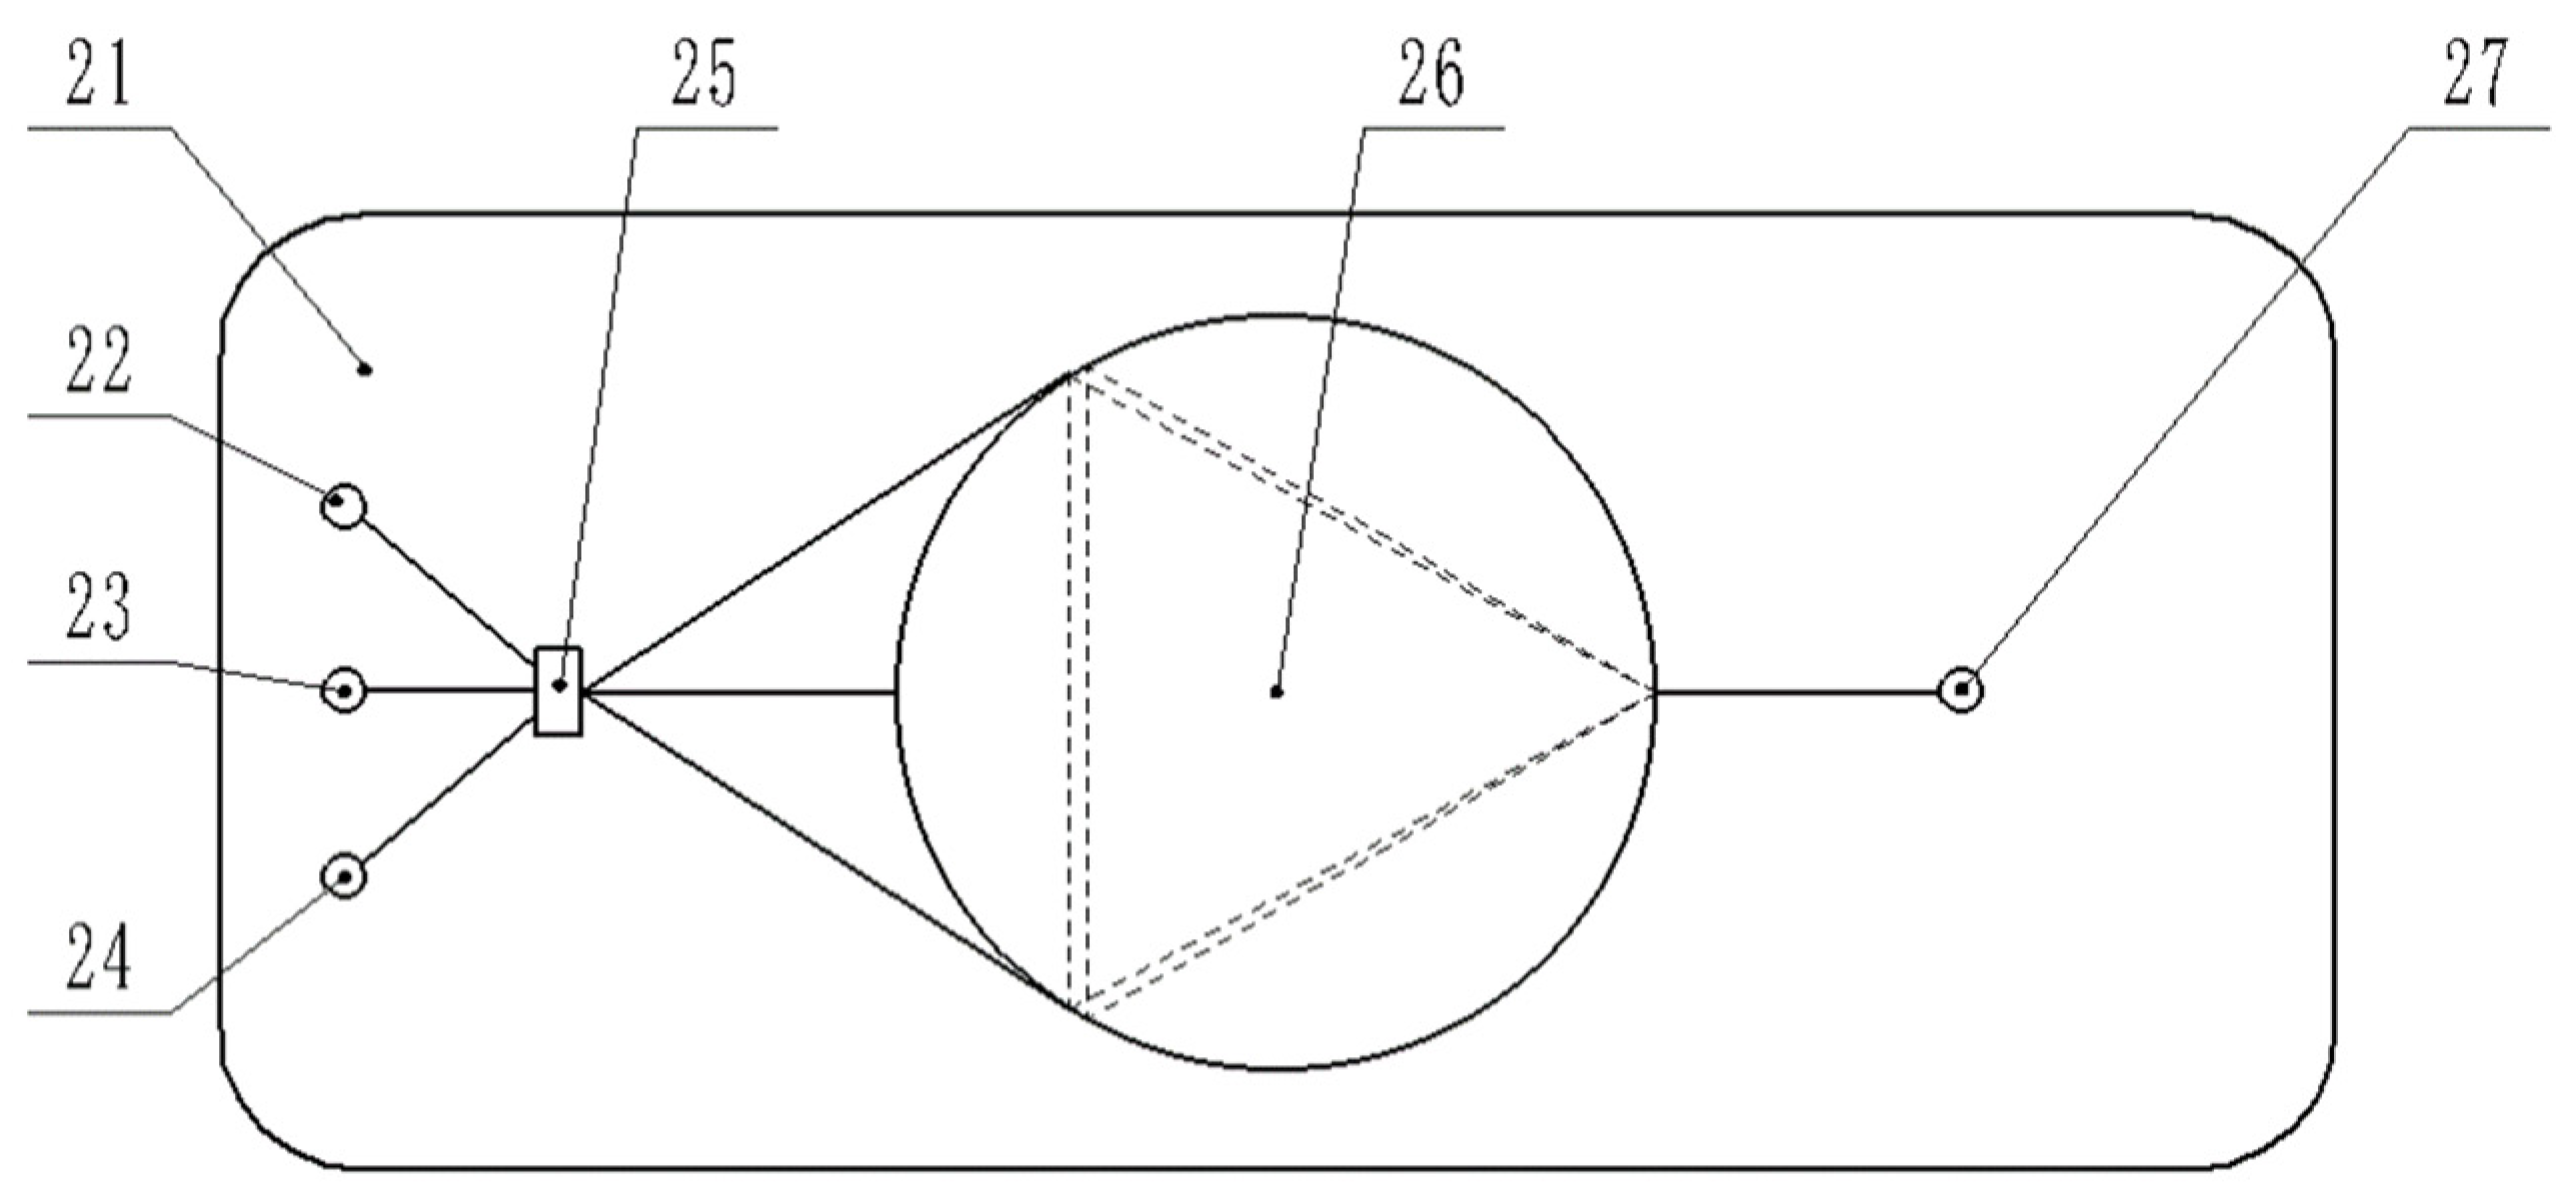
Figure 3.
Schematic diagram of microfluidic glass chip structure. 21—microfluidic glass chip, 22—fluorescent molecular probe port, 23—pure water port, 24—sampling port, 25—marking cell, 26—check cell, 27—liquid outlet port.
Figure 3.
Schematic diagram of microfluidic glass chip structure. 21—microfluidic glass chip, 22—fluorescent molecular probe port, 23—pure water port, 24—sampling port, 25—marking cell, 26—check cell, 27—liquid outlet port.
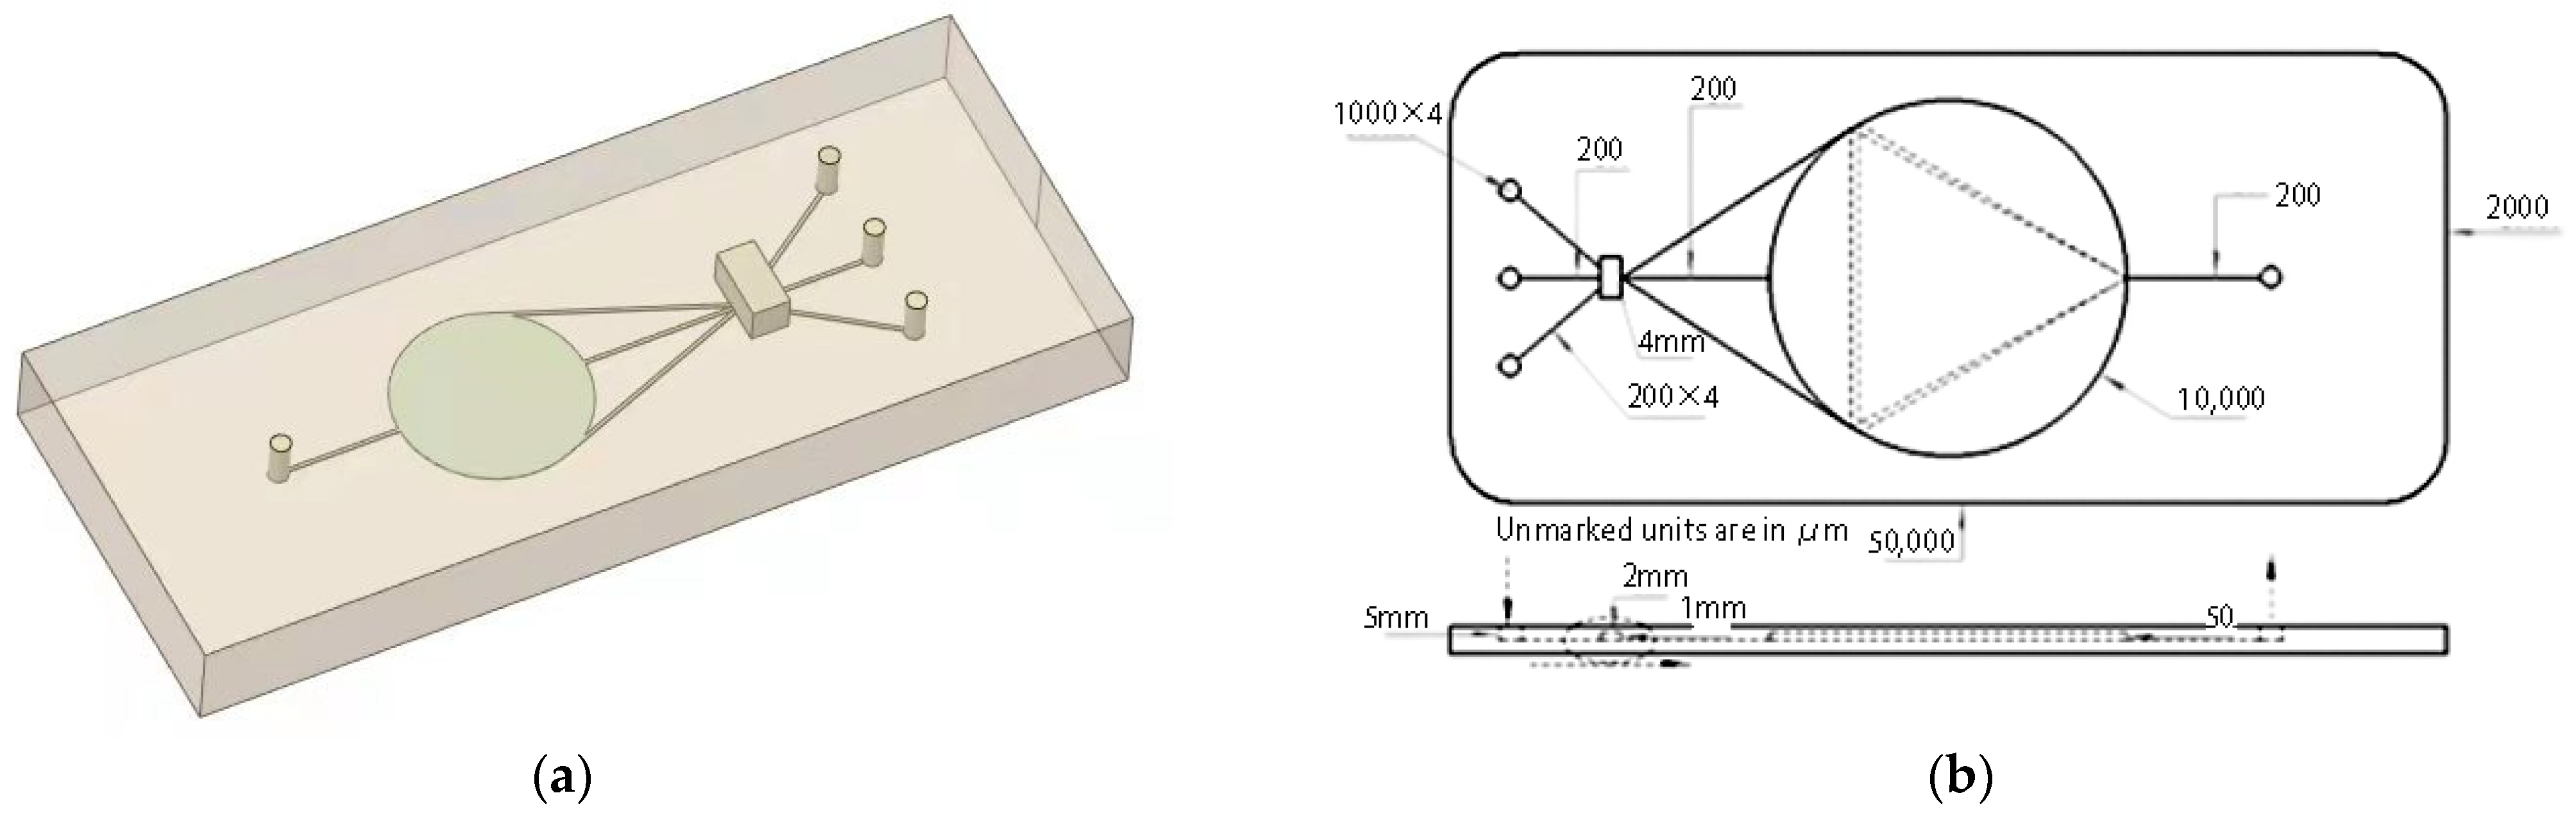
Figure 4.
3D drawing and dimension drawing of microfluidic chip. (a) 3D model of microfluidic glass chip; (b) size of microfluidic chip.
Figure 4.
3D drawing and dimension drawing of microfluidic chip. (a) 3D model of microfluidic glass chip; (b) size of microfluidic chip.
Figure 5.
Plane velocity cloud map of microfluidic glass chip at t = 4 s.
Figure 5.
Plane velocity cloud map of microfluidic glass chip at t = 4 s.
Figure 6.
Test site situation. (a) Cultivation bed for the test; (b) Schematic diagram of the cross-sectional dimension of the cultivation bed.
Figure 6.
Test site situation. (a) Cultivation bed for the test; (b) Schematic diagram of the cross-sectional dimension of the cultivation bed.
Figure 7.
Test device structure diagram.
Figure 7.
Test device structure diagram.
Figure 8.
UVC disinfection test device. 1—Time control switch, 2—Central control module, 3—UVA ultraviolet sterilizer, 4—Transformer.
Figure 8.
UVC disinfection test device. 1—Time control switch, 2—Central control module, 3—UVA ultraviolet sterilizer, 4—Transformer.
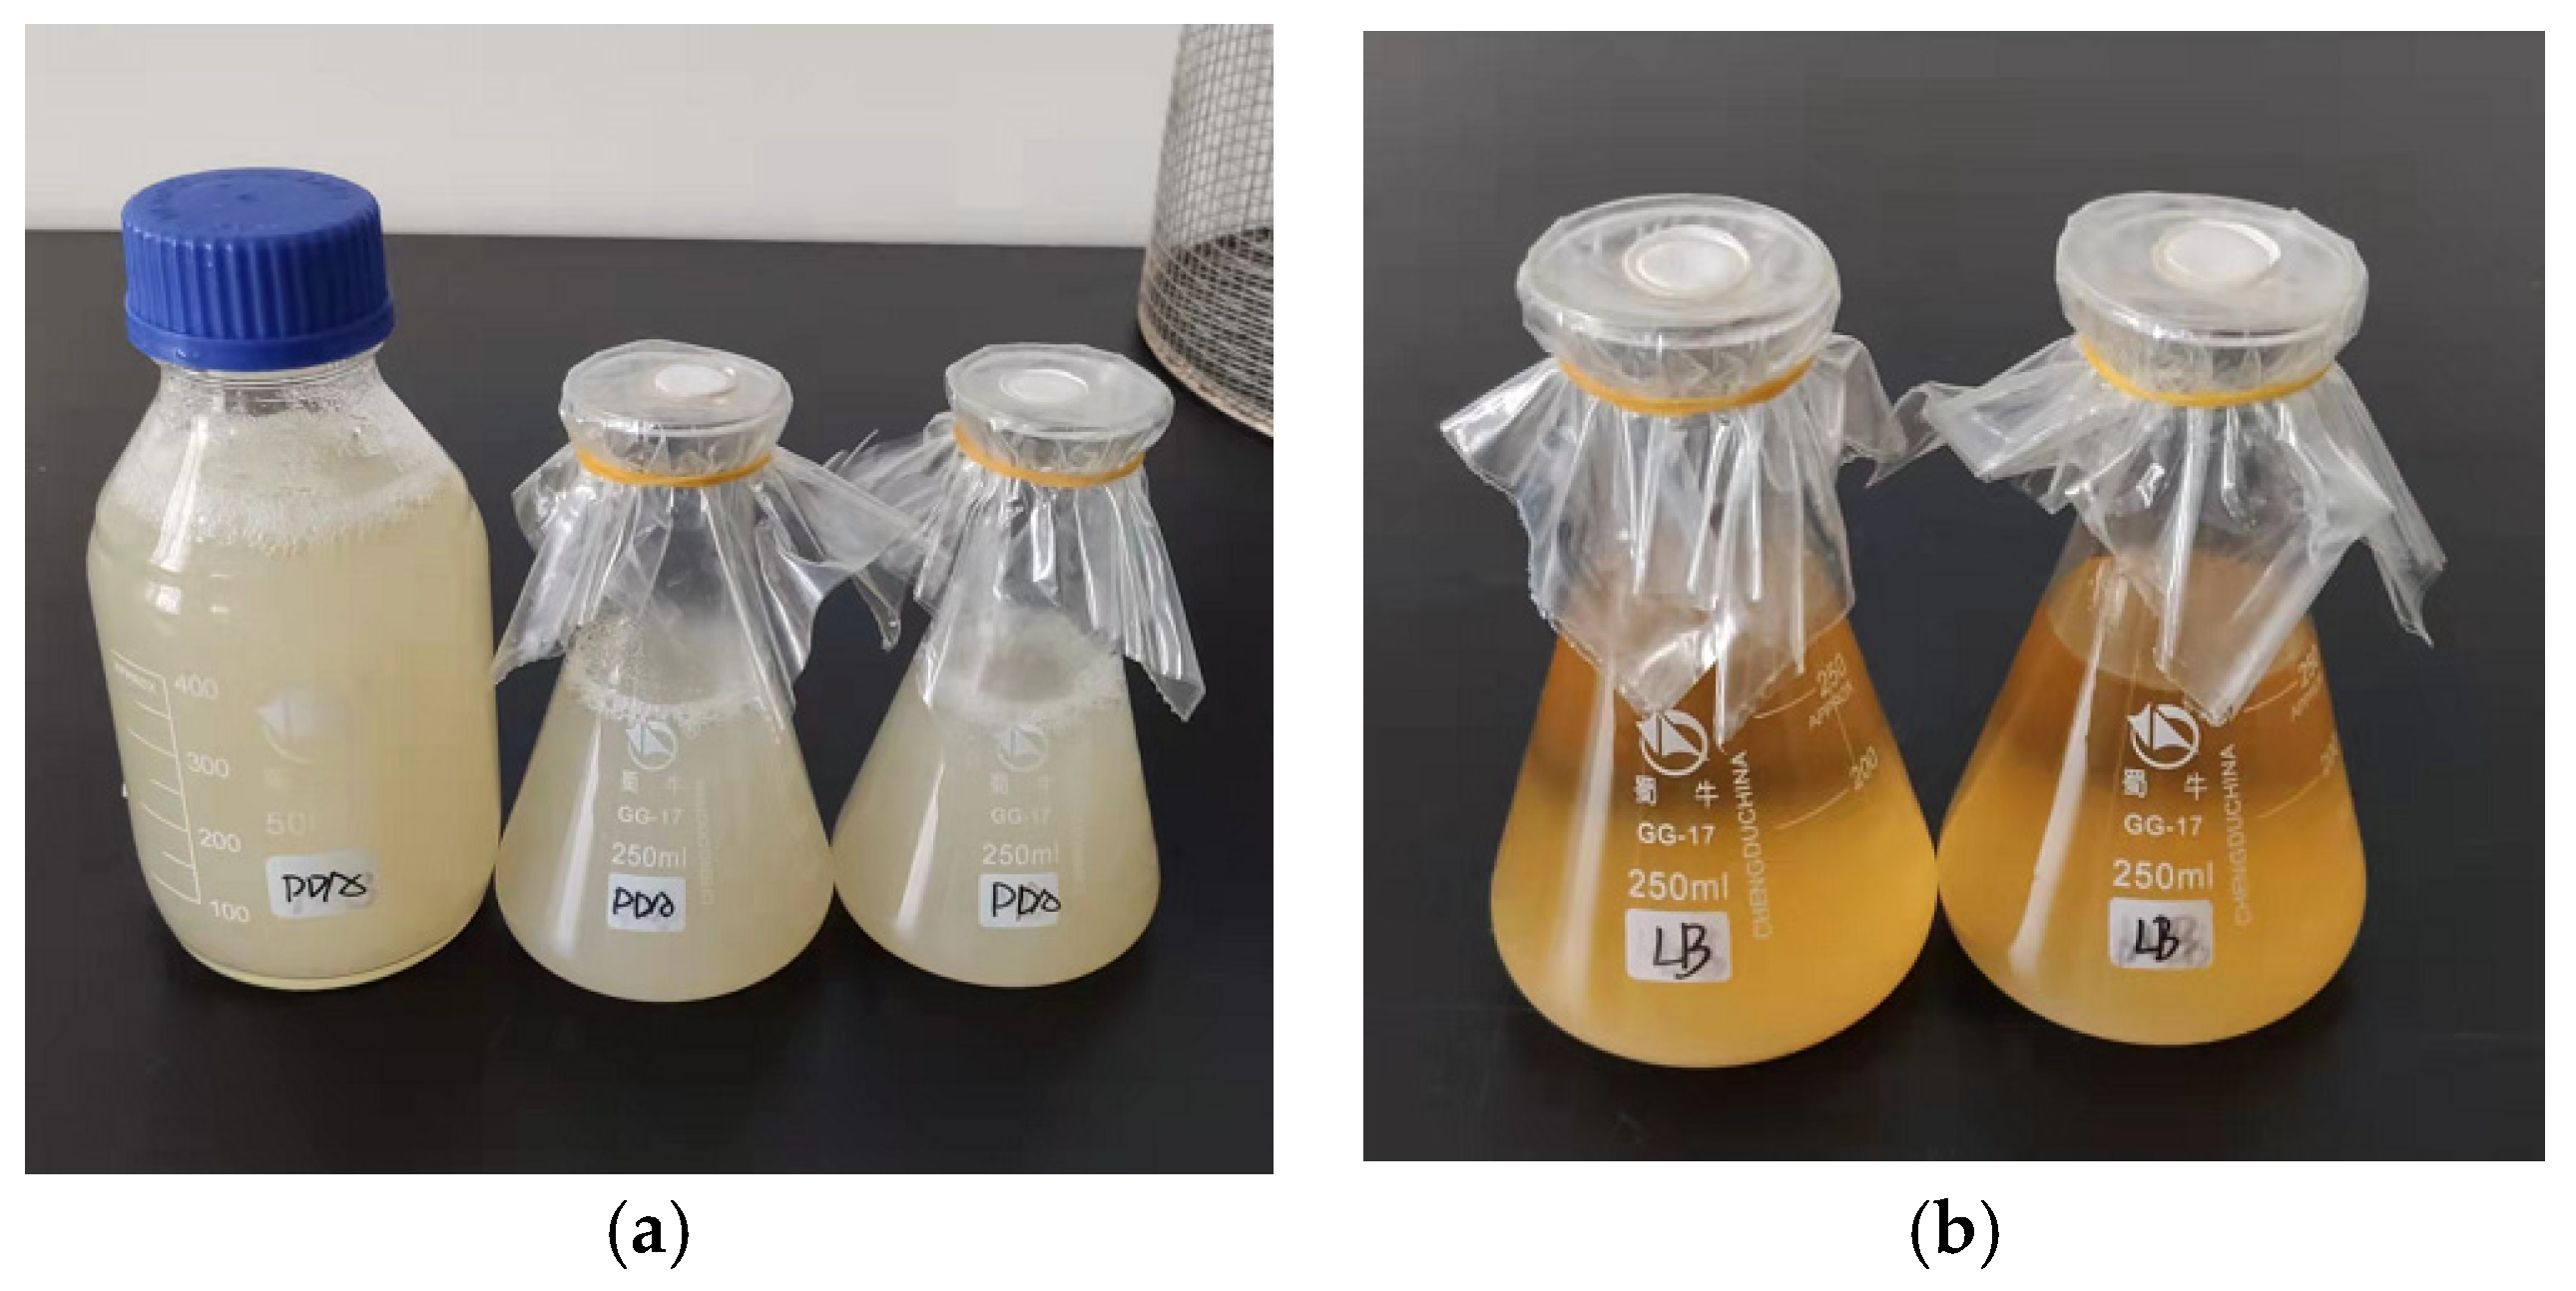
Figure 9.
lb and pda solid medium. (a) pda medium; (b) lb medium.
Figure 9.
lb and pda solid medium. (a) pda medium; (b) lb medium.
Figure 10.
Image gray area segmentation and recognition and ImageJ image point processing. (a) Grayscale processed image; (b) Image recognition result; (c) ImageJ image point processing.
Figure 10.
Image gray area segmentation and recognition and ImageJ image point processing. (a) Grayscale processed image; (b) Image recognition result; (c) ImageJ image point processing.
Figure 11.
Disinfection time-sterilization rate diagram and flow-sterilization rate relationship diagram. (a) Disinfection time-sterilization rate diagram (b) Flow rate-sterilization rate diagram.
Figure 11.
Disinfection time-sterilization rate diagram and flow-sterilization rate relationship diagram. (a) Disinfection time-sterilization rate diagram (b) Flow rate-sterilization rate diagram.
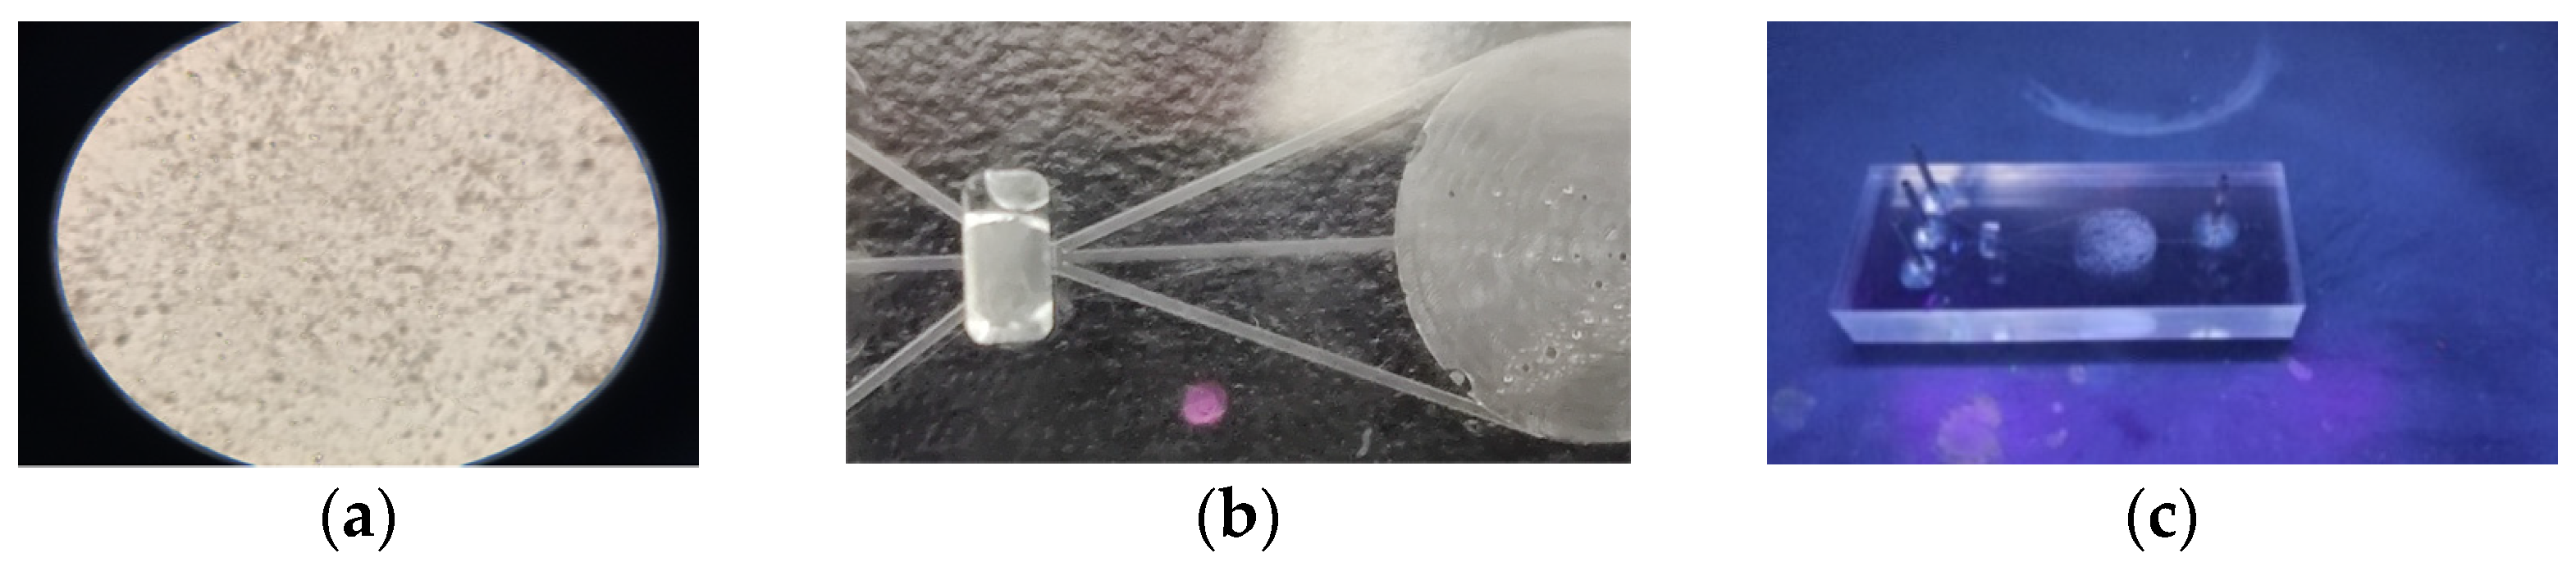
Figure 12.
Microfluidic glass chip test effect display diagram. (a) Microscopic image of microorganisms in the residual liquid in the microfluidic glass control chip inspection tank; (b) Ten times magnification of the area of the microfluidic glass control chip; (c) The marked residual liquid emits fluorescence under UV lamp irradiation.
Figure 13.
Residual liquid absorbance test result chart. (a) The 30 W sterilization absorbance detection of residual liquid; (b) dilution control test of residual liquid stock solution.
Figure 13.
Residual liquid absorbance test result chart. (a) The 30 W sterilization absorbance detection of residual liquid; (b) dilution control test of residual liquid stock solution.
Figure 14.
The detection curve of biofluorescence labeling and the comparison of fluorescence intensity and bacterial quantity after sterilization by ultraviolet light of 30 W intensity of residual liquid. (a) Detection of biofluorescence labeling after sterilization by 30 W ultraviolet light of residual liquid; (b) Comparison curve of fluorescence intensity and bacterial count.
Table 1.
Boundary condition parameter.
Table 1.
Boundary condition parameter.
| Parameter | Type | (m/s) | (m/s) | (m/s) | Turbulence Coefficient | (m/s) | (m/s) | (m/s) | Tag Pool Properties |
|---|
| Entrance 22 | speed entry | 0.00432 | 0.00541 | 0.00721 | 1.1 | 0.00393 | 0.00492 | 0.00655 | Turbulence intensity: 1.18% |
| Entrance 23 | 0.00648 | 0.08115 | 0.1080 | 0.00589 | 0.07377 | 0.09818 |
| Entrance 24 | 0.00432 | 0.00541 | 0.00721 | 0.00393 | 0.00492 | 0.00655 |
| Entrance 27 | speed exit | 0 | 0 | 0 | 0 | 0 | 0 | 0 |
Table 2.
Parameters related to material properties in CFD model of microfluidic chip.
Table 2.
Parameters related to material properties in CFD model of microfluidic chip.
| Material | Density (kg·m−3) | Specific Heat Capacity (J·kg−1·k−1) | Transmittance | Viscosity | Refractive Index |
|---|
| PMMA | 1770 | 1464 | 0.92 | / | 1.51 |
| pure water | 1000 | 4200 | 0.99 | 1.01 | 1.10 |
| residual liquid | 1005 | 4080 | 0.98 | 1.32 | 1.15 |
| dye | 1070 | 1950 | 0.75 | 1.47 | 1.89 |
Table 3.
Optical parameters of UVA sterilizer lamp.
Table 3.
Optical parameters of UVA sterilizer lamp.
| Power (W) | Wave (nm) | Value (uW/cm2/nm) | Bek (uW/lm) | Ee (mW/cm2) |
|---|
| 30 | 439.0 | 48.534 | 1.87 | 1.006 |
| 25 | 439.0 | 43.418 | 1.83 | 0.871 |
| 16 | 439.0 | 28.134 | 1.78 | 0.509 |
Table 4.
Sterilization time and scaling factor.
Table 4.
Sterilization time and scaling factor.
| Power (W) | Ee (mW/cm2) | T (s) | ki |
|---|
| 30 | 1.006 | 49.70–99.30 | 29.82 |
| 25 | 0.871 | 57.41–114.81 | 28.71 |
| 16 | 0.509 | 98.23–196.46 | 31.42 |
Table 5.
UV light intensity, sterilization time and microbial concentration at different flow rates.
Table 5.
UV light intensity, sterilization time and microbial concentration at different flow rates.
| Power of Ultraviolet Lamp (Radiation Flux) (W) | Pump Flow q/(m3·h−1) | Time to Flow through the UV Sterilizer Chamber/s | Microbial Sterilization Rate after One Disinfection (%) |
|---|
| 30 | 0.052 | 90 | 94 |
| 0.067 | 70 | 89.33 |
| 0.094 | 50 | 78.67 |
| 0.156 | 30 | 60.67 |
| 25 | 0.036 | 80 | 87.53 |
| 0.048 | 60 | 80.95 |
| 0.072 | 40 | 65.62 |
| 0.144 | 20 | 23.79 |
| 16 | 0.018 | 100 | 81.33 |
| 0.026 | 70 | 62.81 |
| 0.053 | 40 | 41.36 |
| 0.158 | 10 | 7.89 |
Table 6.
30 W bactericidal biological fluorescence intensity and bacterial count.
Table 6.
30 W bactericidal biological fluorescence intensity and bacterial count.
| Wavelength | Strength U | The Amount of Bacteria after Disinfection V/Individual | Ratio (U/V) | m Value |
|---|
| 513 | 423,820.8 | 15,037 | 28.25 | 28.79 |
| 421,442 | 13,877 | 30.37 |
| 157,925.1 | 5834 | 27.07 |
| 23,230.7 | 777 | 29.91 |
| 8528.59 | 301 | 28.35 |


