Article

A Semi-Automatic Data Management Framework for Studying Thermal Comfort, Cognitive Performance, Physiological Performance, and Environmental Parameters in Semi-Outdoor Spaces

1
Department of the Built Environment, College of Design and Engineering, National University of Singapore, Singapore 117566, Singapore
2
Kajima Technical Research Institute Singapore, Singapore 117566, Singapore
3
Human Potential Translational Research Programme, Yong Loo Lin School of Medicine, National University of Singapore, Singapore 119228, Singapore
4
Department of Architecture, College of Design and Engineering, National University of Singapore, Singapore 117566, Singapore
*
Author to whom correspondence should be addressed.
Sustainability 2023, 15(1), 183; https://doi.org/10.3390/su15010183
Submission received: 1 November 2022 / Revised: 17 December 2022 / Accepted: 20 December 2022 / Published: 22 December 2022

Abstract

:
Semi-outdoor space can be used as an alternative to short-term office activities to save office energy consumption and promote a healthy and nature-based working environment. This study evaluated the suitability of semi-outdoor space in four aspects including environmental measurements, physiological measurements, subjective measurements and cognitive performance tests. However, the manual processing and analysis of such multidimensional data can be time-consuming and error-prone. Hence, the objective of this study was to develop a semi-automatic method to manage and analyze the data from different instruments and platforms and two open-source applications (a stroop color and word test and a digit span test) for cognitive performance tests. These codes were critical to the success of the project, providing an effective framework for data extraction, data pre-processing, data analysis and performance tests. Eighty-nine people participated in the experiment of evaluation of thermal comfort, cognitive performance, physiological performance and environmental parameters in semi-outdoor spaces in a tropical setting. Each participant received cognitive tests to assess their selective attention, short-term memory, concentration and creativity quotient. Concurrently, qualitative measurements were conducted to assess thermal sensation, thermal comfort and thermal acceptability. The heart rate, skin temperature, and skin conductance of participants were measured throughout the experiments. Microclimatic variables such as illuminance, noise levels, dry-bulb air temperature, global temperature, relative humidity, air speed, and air direction were monitored simultaneously. To understand the effects of semi-outdoor spaces on participant performance, this study recorded participant performance in different environments through controlled experiments. Data related to participants in different settings include those shared (e.g., environmental measurement), and data unique to each participant (e.g., physiological performance). The results revealed that the subjects’ cognitive and physiological performance did not change significantly after switching to the semi-outdoor space due to the availability of natural and mechanical ventilation, suggesting that short-term office activities in the semi-outdoor space are feasible in the tropics.

1. Introduction

Traditional office spaces have enclosed façades and rely on air conditioning to maintain thermal comfort and employee productivity. The energy consumption of air conditioning systems in tropical regions is enormous. Nevertheless, occupants sometimes feel too cold and need to wear long sleeves or jackets to keep warm in standard air-conditioned buildings. For example, a thermal comfort survey conducted in Singapore showed that occupants were dissatisfied with personal control and ambient temperature, which could be attributed to insufficient air flow and excessively cold temperature in commercial buildings [1]. Due to the heat balance of the human body, personal thermal comfort is closely related to the environmental quality of space [2,3,4]. In order to solve the overall cooling problem and reduce energy consumption, a hybrid ventilation strategy based on natural ventilation and mechanical ventilation is proposed in tropical regions. A case study of a tropical campus showed that hybrid ventilation strategies produced higher neutral thermal sensation votes, temperature satisfaction levels, and overall thermal comfort levels [5].
In assessing human perception of the environment, the impact factors are not limited to thermal sensation votes. The evaluation of the impacts of heat on the cognitive performance of personnel is an important research topic [6]. Researchers evaluated the cognitive performance and perceived air quality under elevated air temperature conditions by measuring physical, physiological, cognitive and subjective performance [7,8]. Another research group evaluated the elevated temperature setpoint in an office environment by measuring temperature, cognitive performance, electroencephalogram (EEG), heart rate, thermal comfort and air quality questionnaires [9]. In the tropics, researchers evaluated the application of personal controlled air movement by measuring subjects’ thermal comfort, perceived air quality, and cognitive performance [10]. In previous studies, environmental conditions, physiological performance, cognitive performance, and thermal comfort were measured using different devices and platforms at different sampling frequencies and saved in various file formats, resulting in hundreds of different files with different data structures. Manual methods of manipulating and analyzing such data can be inefficient and error-prone. Python is one of the popular programming languages used in the scientific community for data management and analysis. It is a fundamental language to conduct studies related to artificial intelligence. Machine learning and statistical analysis modules from Python have been applied in predicting thermal sensation in thermal comfort studies. For example, researchers systematically evaluated the performance of nine machine learning algorithms in predicting 3-point and 7-point thermal sensation votes in the ASHRAE Comfort Database II using Python [11]. There are a growing number of resources written in Python to support various research needs including thermal comfort. The thermofeel is a Python package incorporating outdoor thermal comfort indices, such as the universal thermal climate index, into weather forecasting systems for heat stress evaluation [12]. The pythermalcomfort package supports the calculation of various common thermal comfort indices including predicted mean vote, predicted percentage of dissatisfied, psychrometric properties of air, standard equivalent temperature, etc. [13]. For physiological studies, the pyHRV is a package written in Python supporting the calculation of heart rate variability (HRV) [14]. The pandas package provides an efficient way to manipulate and analyze data, and the numpy package supports complex scientific calculations. Python has also been used to code control systems for smart buildings to save energy and improve thermal comfort [15].
In addition, the assessment of spatial environments and subject performance in previous studies has been limited to indoor environments or test chambers. The study of human physiology, cognitive performance, and subjective performance in semi-outdoor space is a relatively new field in the tropics, as is the data management associated with it. The objective of this study was to develop a semi-automatic data management framework for multidimensional data manipulation and analysis for environmental measurements, physiological measurements, subjective measurements and cognitive performance tests of semi-outdoor spaces, and to find correlations between cognitive performance and environmental settings in semi-outdoor spaces. The framework developed in this study leverages Python resources to provide an efficient and error-free approach to extract, process, and analyze multidimensional data of environmental parameters, physiological parameters, subjective questionnaires, and cognitive performance results. To meet the needs of cognitive performance tests, the digit span test and the stroop color and word test were developed from scratch in this study.
The remaining structure of the article is organized as follows. First, research design on data management of environmental measurements, physiological measurements, subjective measurements and cognitive performance tests is illustrated. Subsequently, this article introduces the data collection and storage, raw data extraction, data pre-processing, and data analysis of environmental parameters, physiological parameters, subjective measurements, and cognitive performances. The algorithm development of the digit span test and stroop color and word test is shown. Finally, this article demonstrates the illustrative examples of the data management framework in Section 3 and concludes the study in Section 4.

2. Materials and Methods

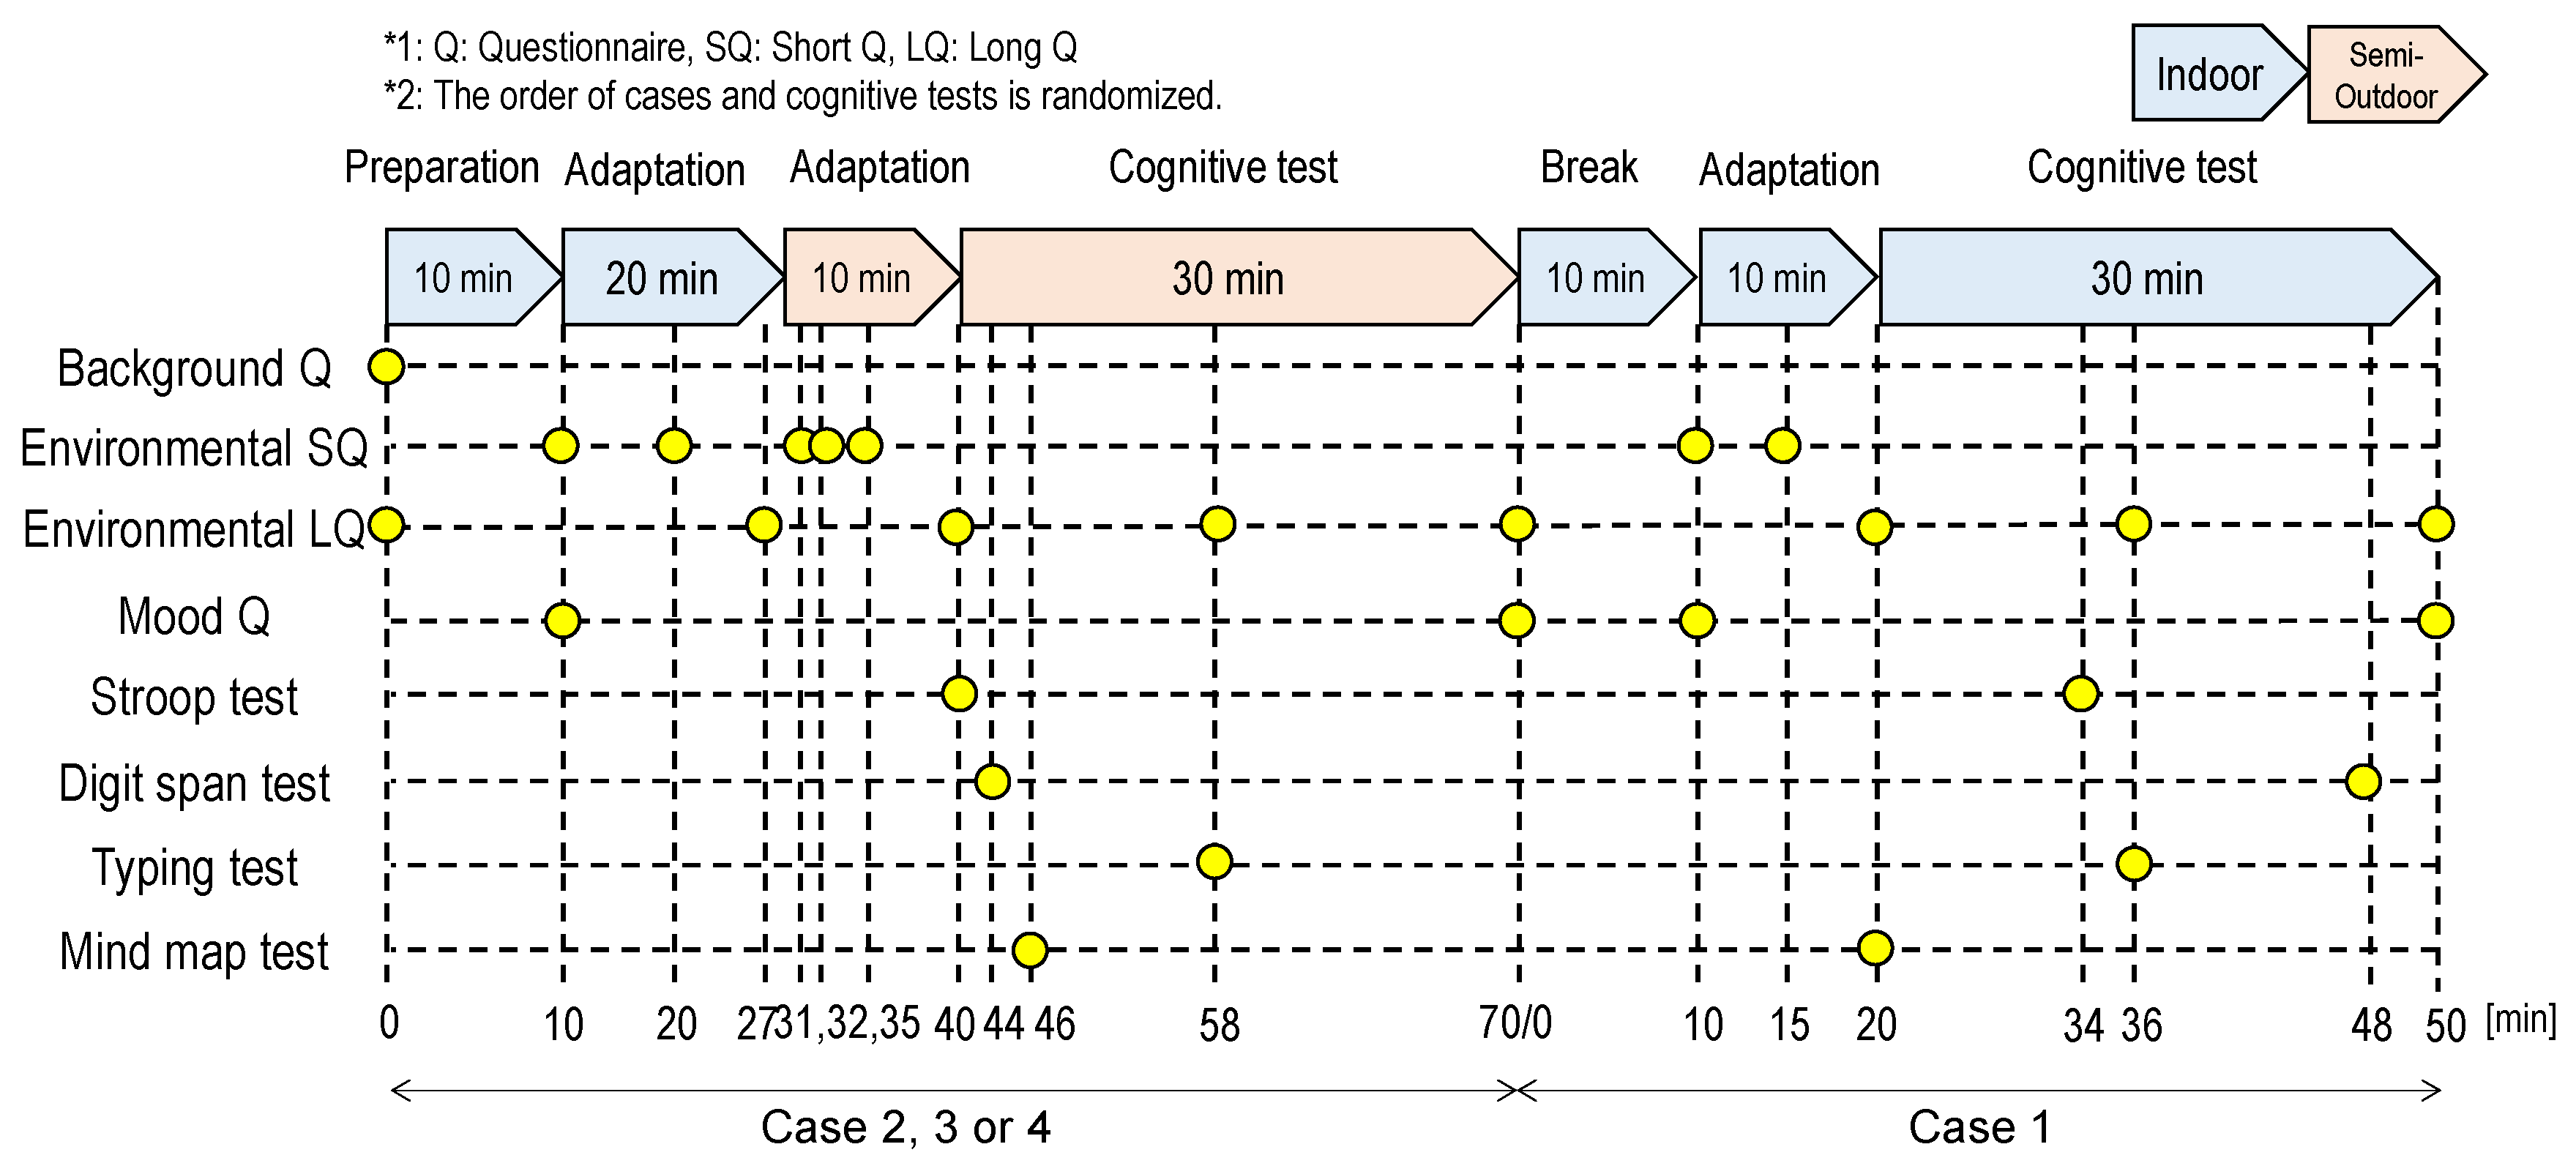
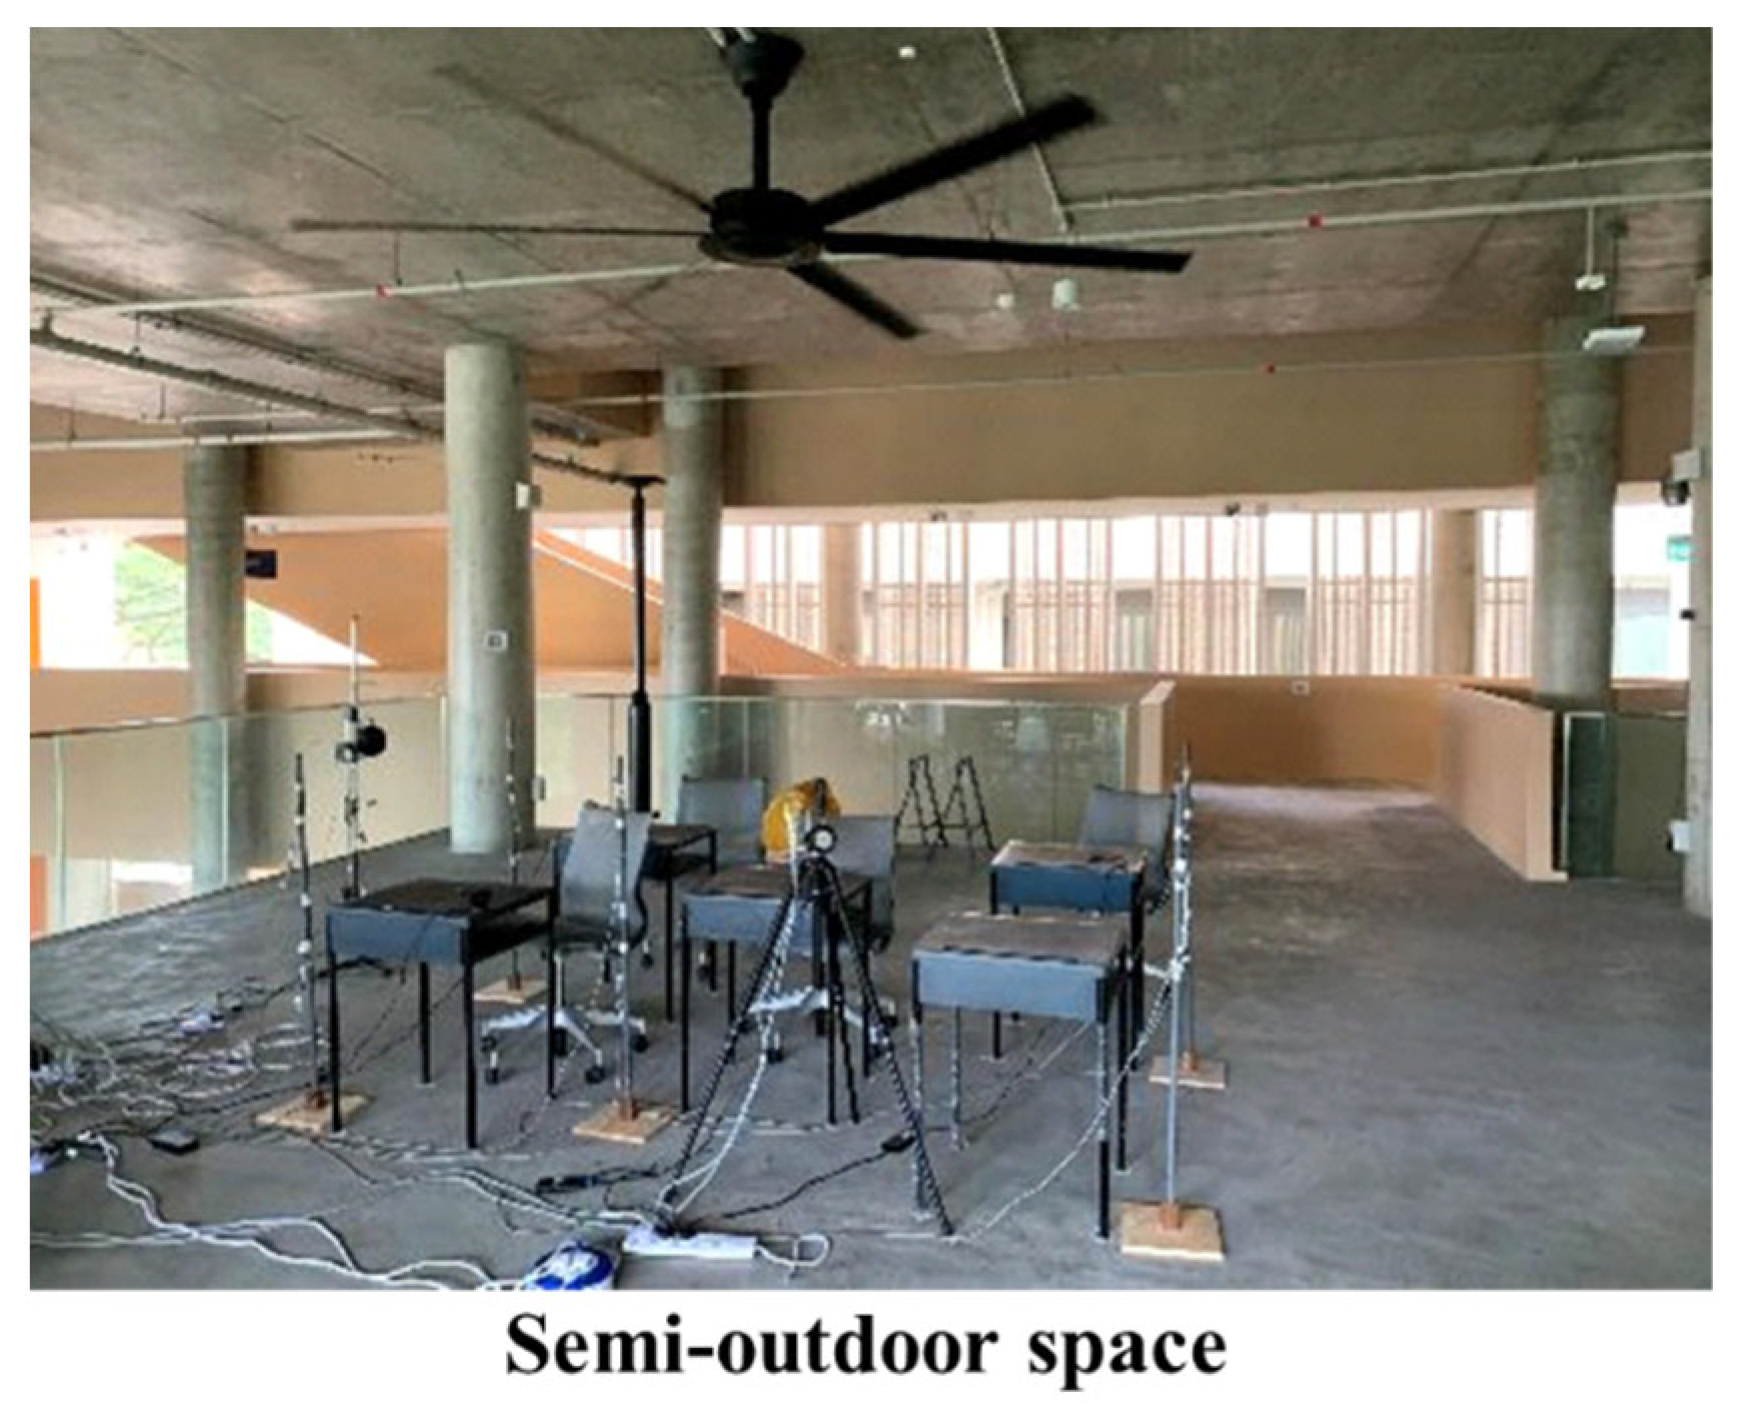
2.1. Research Design

The entire experiment lasted about two months (December–January, June–July), and involved the recruitment of eighty-nine people including forty-four men and forty-five women who were adapted to the local tropical climate. One session of the experiment was conducted each day, including two cases. As shown in Table 1 and Figure 1, four experimental cases were set up, including case 1 of indoor air conditioning (AC), case 2 of semi-outdoor in natural ventilation (NV), case 3 of semi-outdoor in mechanical ventilation (MV) in speed 3, and case 4 of semi-outdoor in MV in speed 6. The ceiling fan speed varies in a range from 0 to 6 (47 RPM to 90 RPM). Mode 3 represents the medium air speed while mode 6 represents the maximum air speed. Case 1 of the indoor AC session lasted about 50 min and was conducted in an indoor space in a building on the university campus in Singapore, while the semi-outdoor case lasted about 70 min and took place in a semi-outdoor space next to the indoor space on the university campus in Singapore. In the indoor AC session, the thermal comfort questionnaires had a 10 min adaptation time and the cognitive tests had a 30 min adaptation time. In the semi-outdoor session, subjects had 30 min to reach a steady state of thermal condition in the indoor space. After moving to the semi-outdoor, there was a 10-min adaptation time focusing on the thermal comfort questionnaire and 30-min of cognitive testing time. The semi-outdoor space in this study is a building space with a ceiling connected to the outdoor space (Figure 2). The indoor AC setpoint was 24 °C. The average temperature of the semi-outdoor space in NV were 27.1 °C and 29.9 °C during the cool period (December–January) and warm period (June–July), respectively. The average RH of semi-outdoor space in NV was 82% and 73% during the cool period and warm period, respectively.
As shown in Figure 3, this research has four types of measurement, including environmental measurements, physiological measurements, subjective measurements, and cognitive tests. The data of environmental measurements were shared among subjects attending the same period experiment, while the physiological, subjective and cognitive data are all personal data. For environmental measurements, dry-bulb air temperature, relative humidity, globe temperature, a-weighted sound pressure level, illuminance, omni-directional air speed, 3D air speed and air direction were measured. For physiological measurements, facial skin temperature, skin temperature of the left upper arm, left upper chest, right lower leg and right thigh, heart rate and skin conductance were measured. The participants were asked to wear the physiological measurement devices during the whole session. For subjective measurements, background information, mood assessment, self-reported performance and environmental satisfaction were measured. Thermal condition, air movement, humidity, air quality, visual, and the acoustic environment were inquired about in the environmental satisfaction questionnaire. For cognitive performance tests, the stroop color and word test (ST), the digit span test (DT), the typing test (TT) and the mind map test (MT) were conducted. ST was used to assess subjects’ selective attention, where the correct answer to the test was the color of the word rather than the name of the word. In this study, ST was assessed by interference score calculated based on reaction times and errors [17]. DT was used to assess short-term working memory [18]. The test output randomly generated numbers, starting with 3 digits. The subject was required to enter these digits in reverse order. If the user entered the digits in the correct order, the digit increased. When an incorrect answer was detected, the digit decreased. TT was used to assess concentration. The subject was asked to type the displayed sentences within 10 min. The number of words correctly typed per minute (net words per minute) was used as the score for TT [19]. MT was used to assess creativity, where subjects were provided with a topic and asked to produce words related to that topic within 12 min. The total number of valid responses was used as the MT score [20].

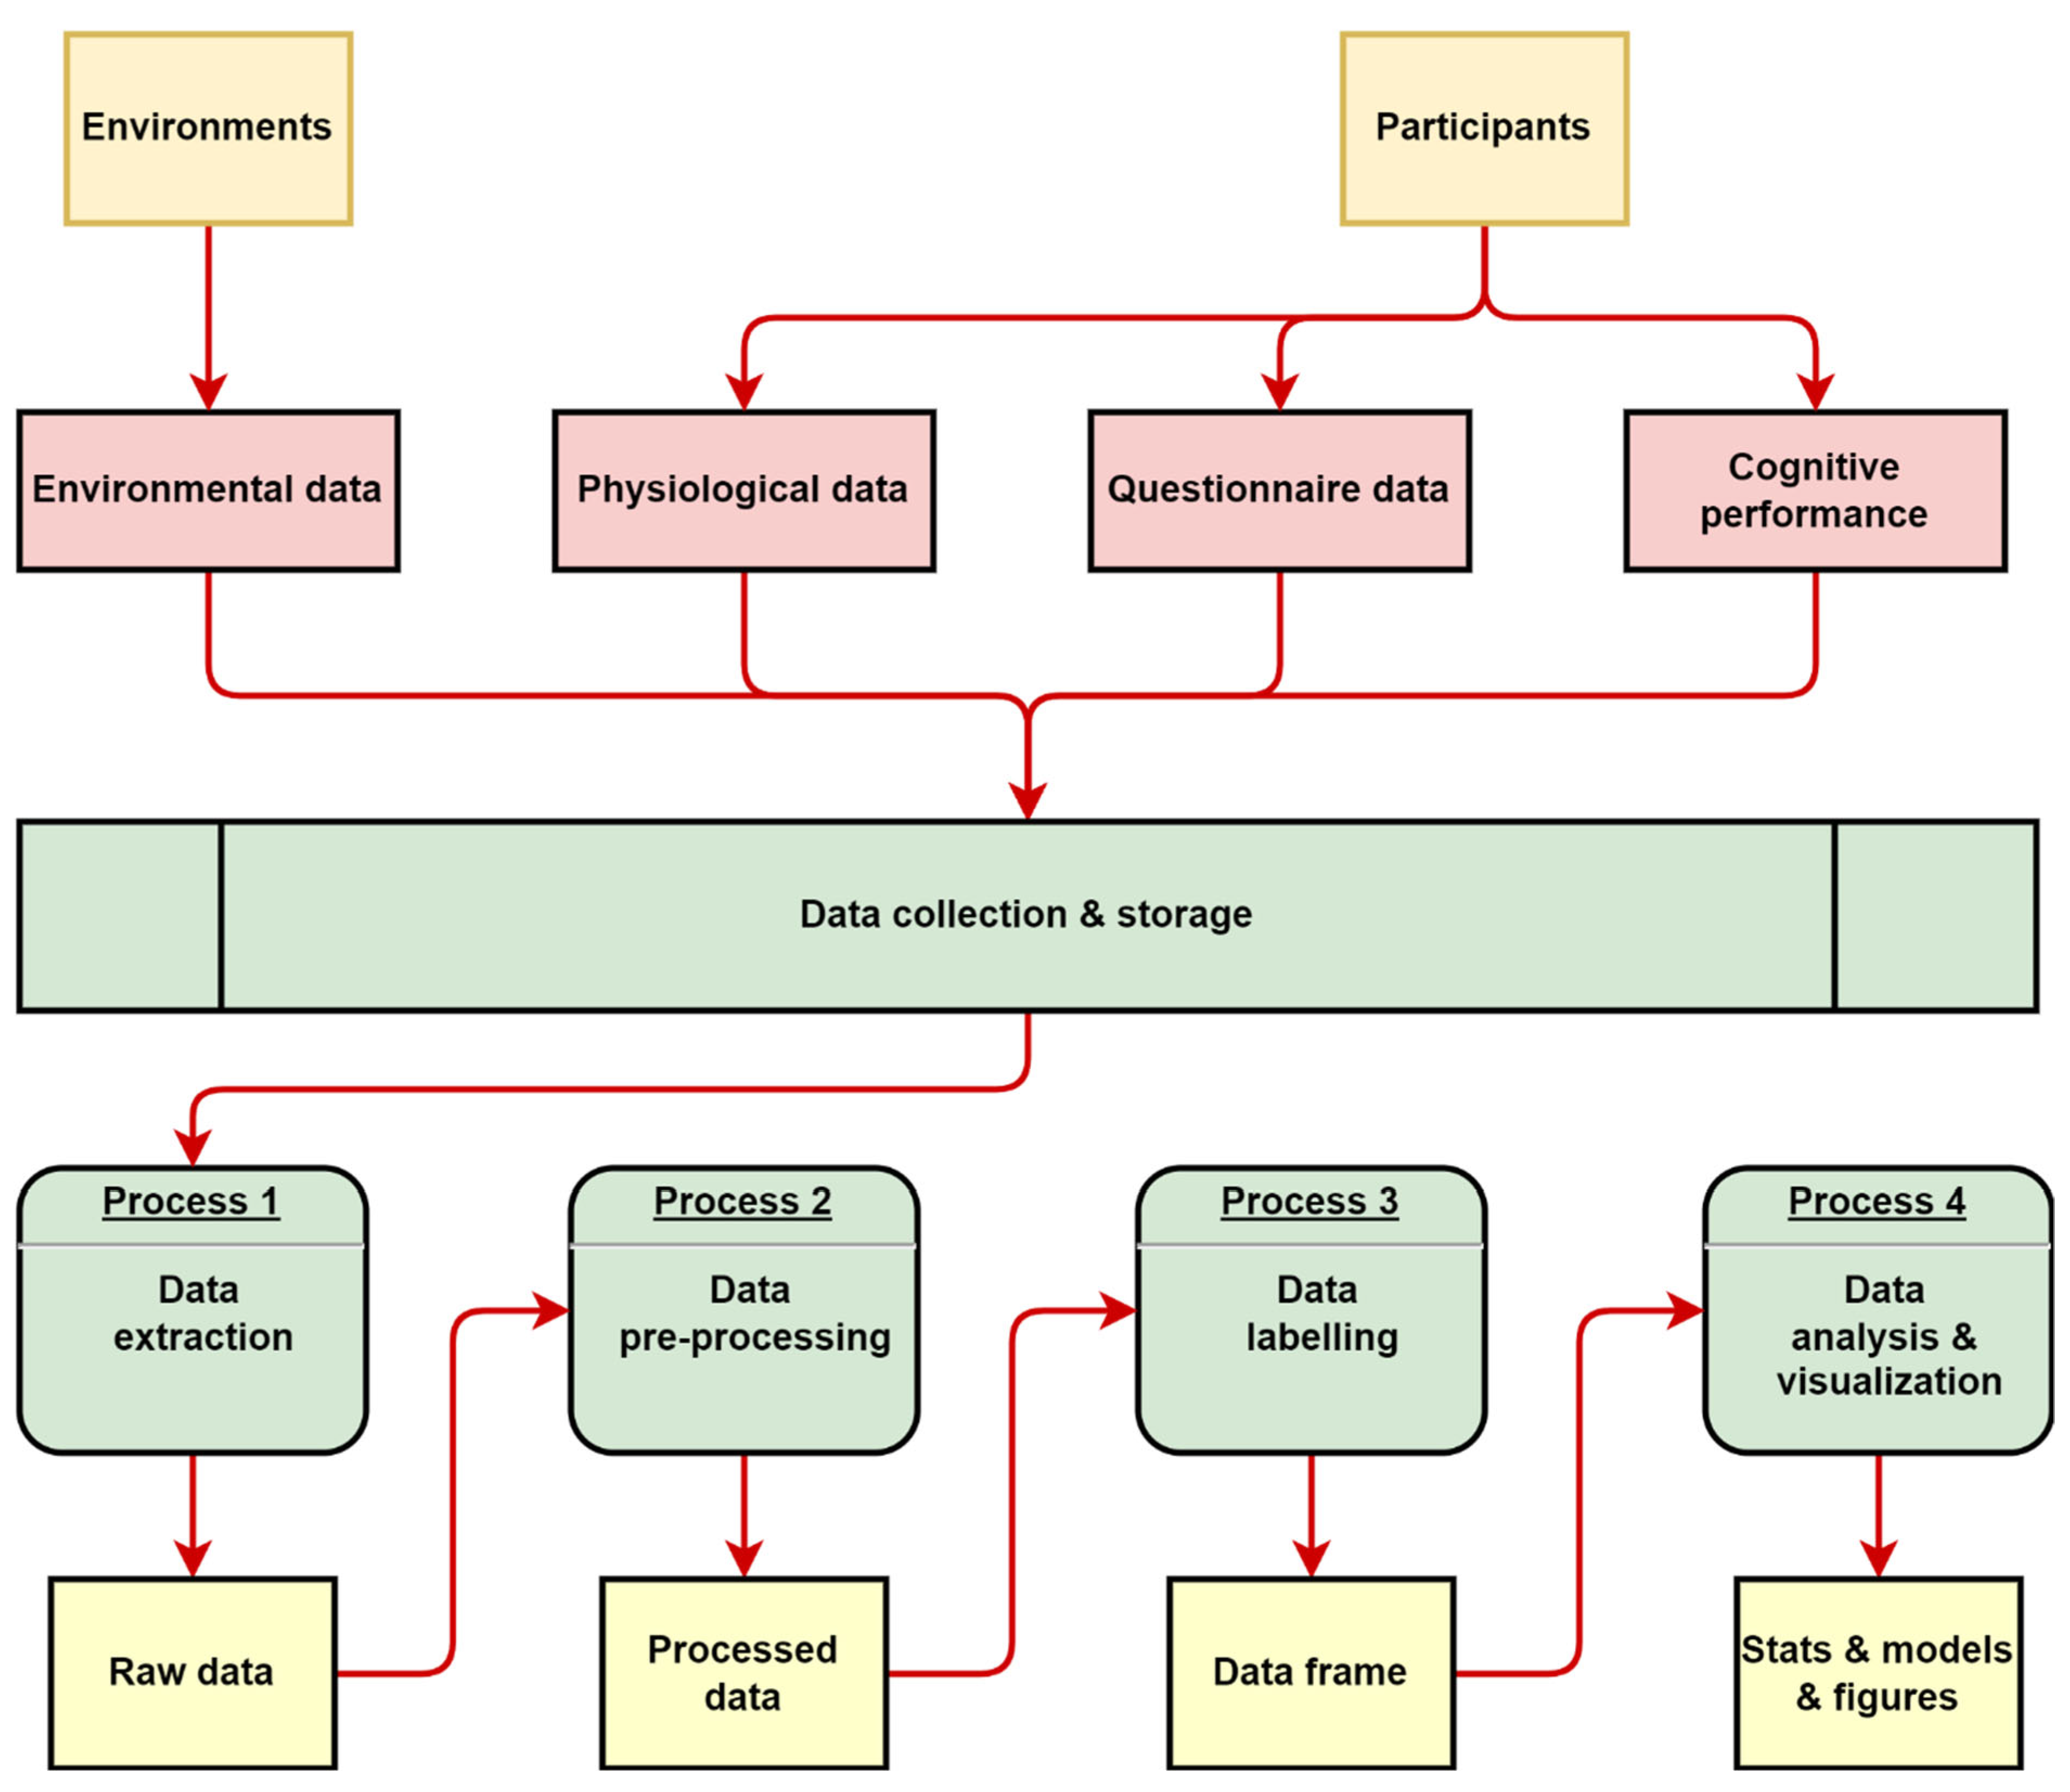
2.2. Description of Framework

Based on the research design, the data flow diagram (Figure 4) illustrates the data management process for the semi-outdoor study. Environmental data were measured from the surrounding environment, while physiological data, questionnaire data and cognitive performance data were collected from participants. These data were collected on a daily basis and were stored in a local directory. The raw data were extracted from the data files and pre-processed. Some parameters were calculated from the raw data. The processed data were then classified and labelled according to participant and experimental group information. Finally, data frames were created and used for statistical analysis and visualization. The data extraction codes were publicly available at: https://github.com/dbechenss/semi-outdoor-study, accessed on 1 December 2022.

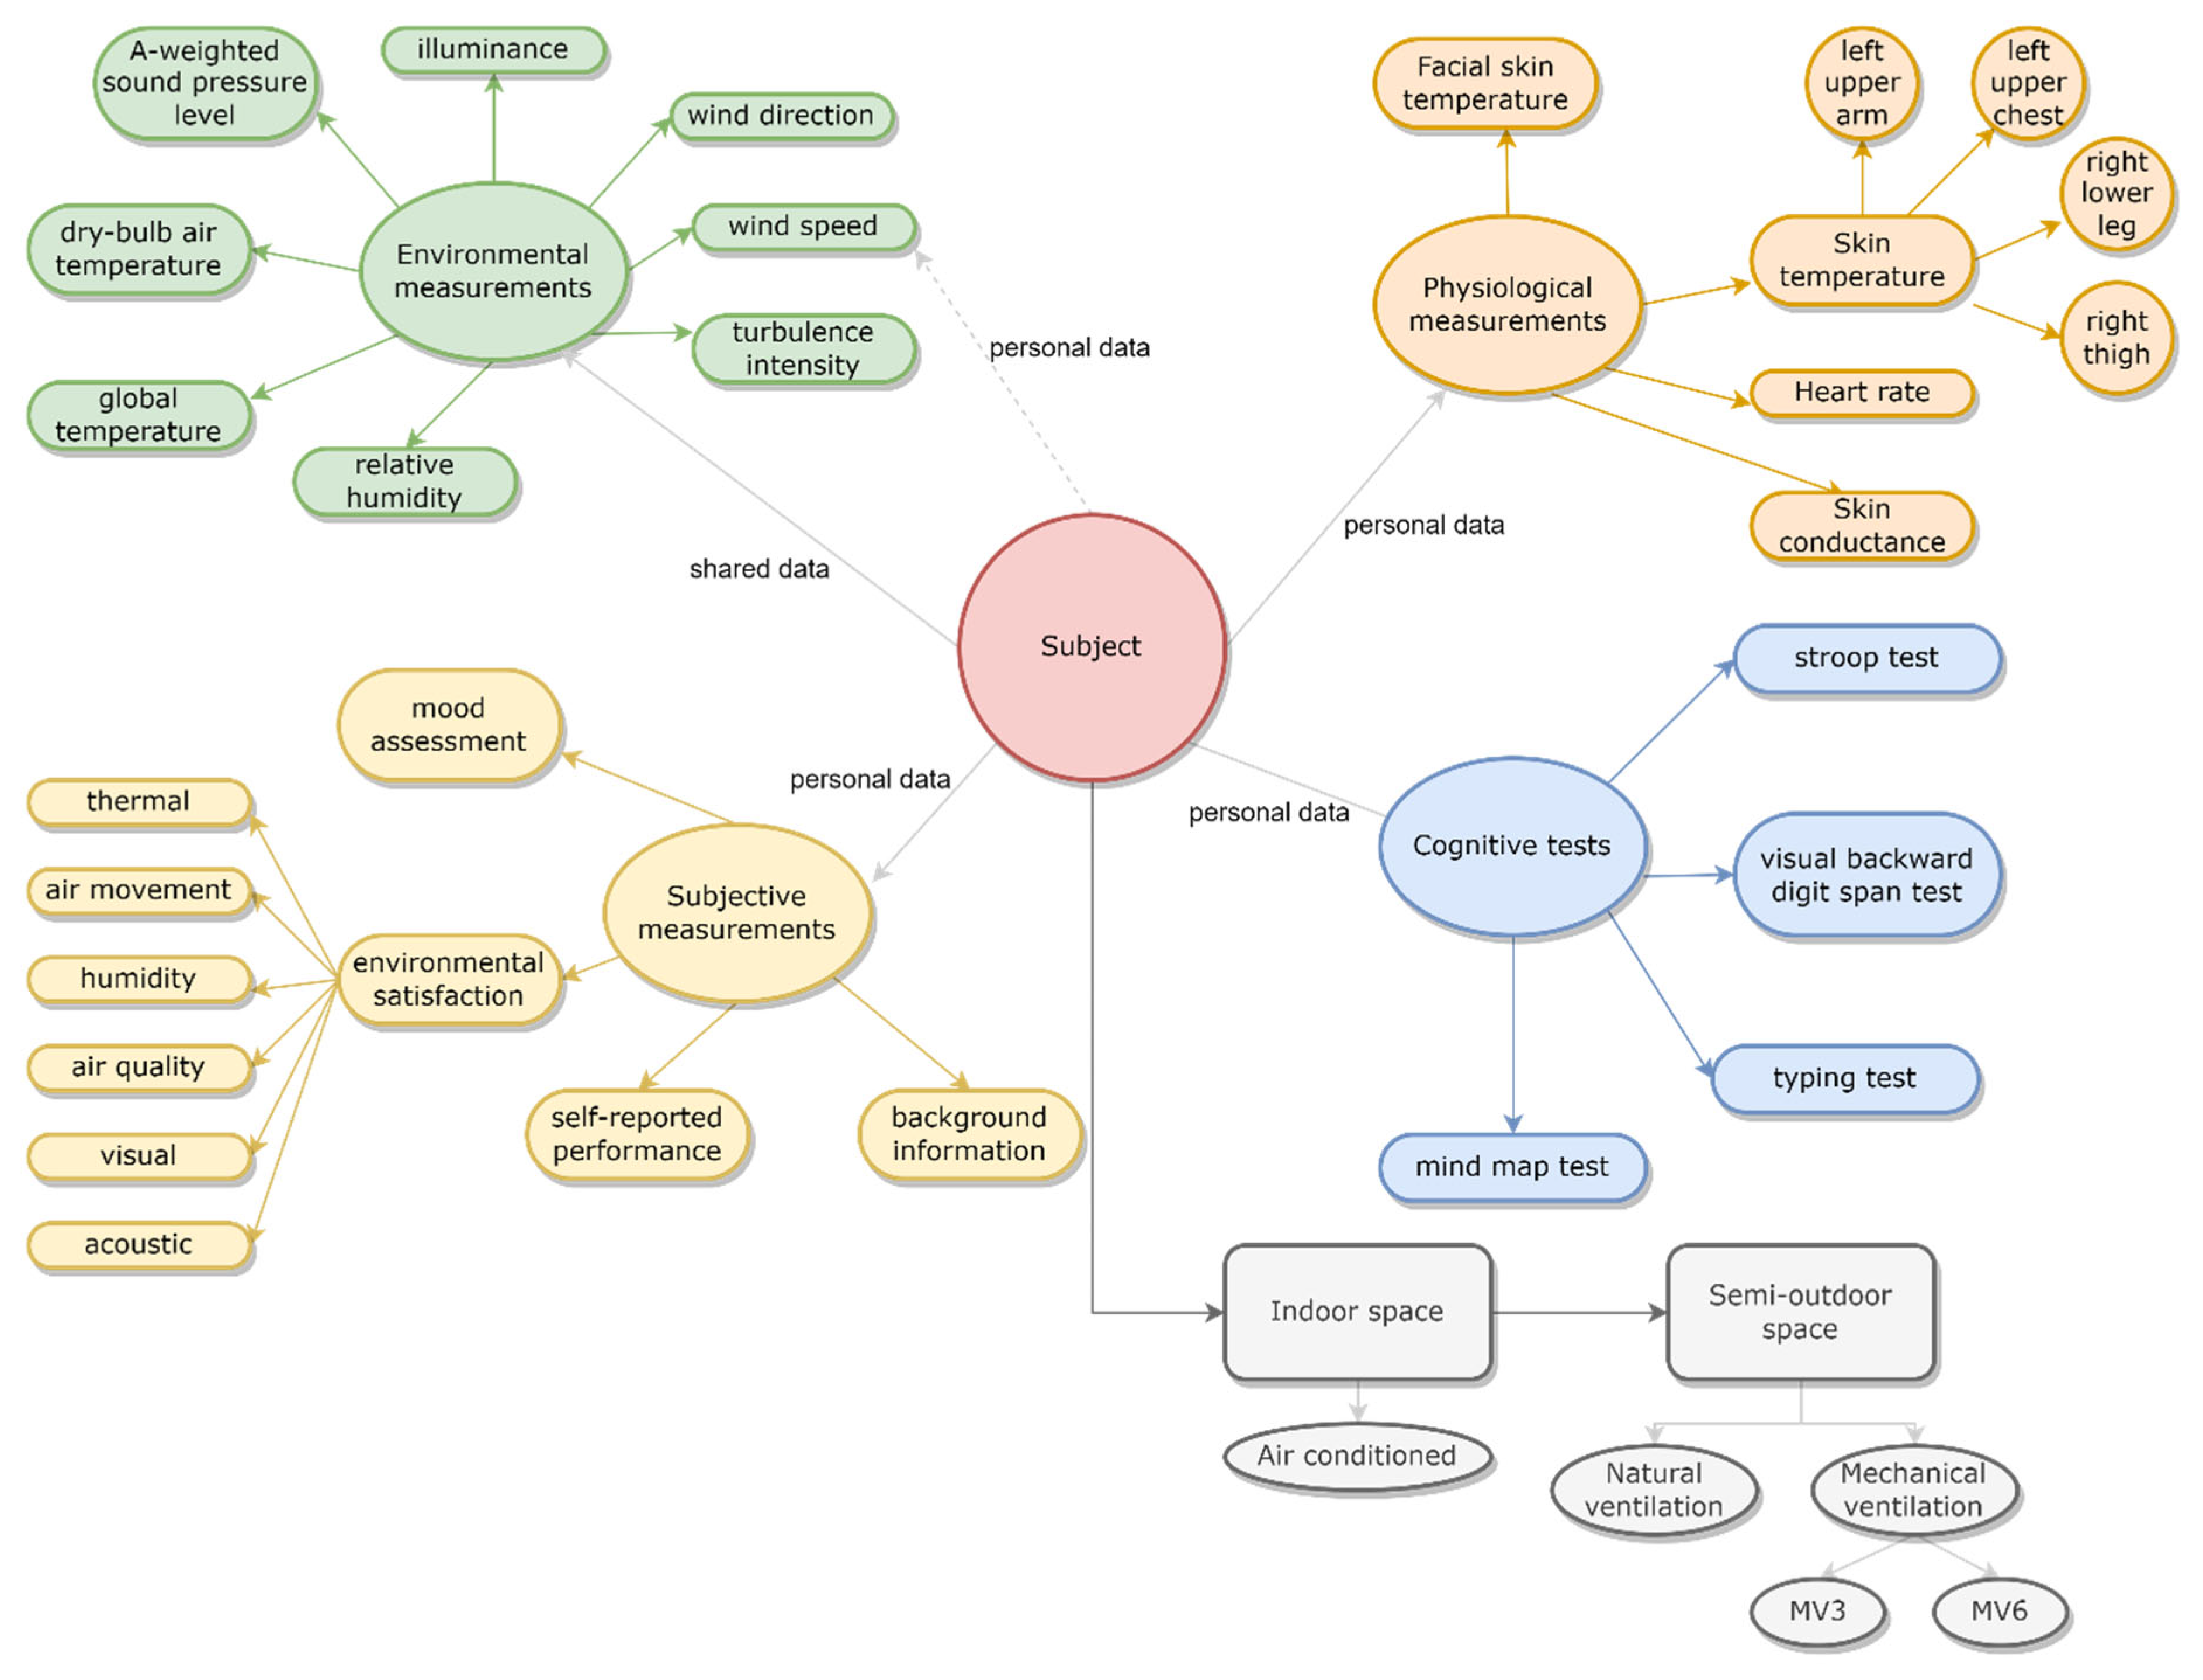
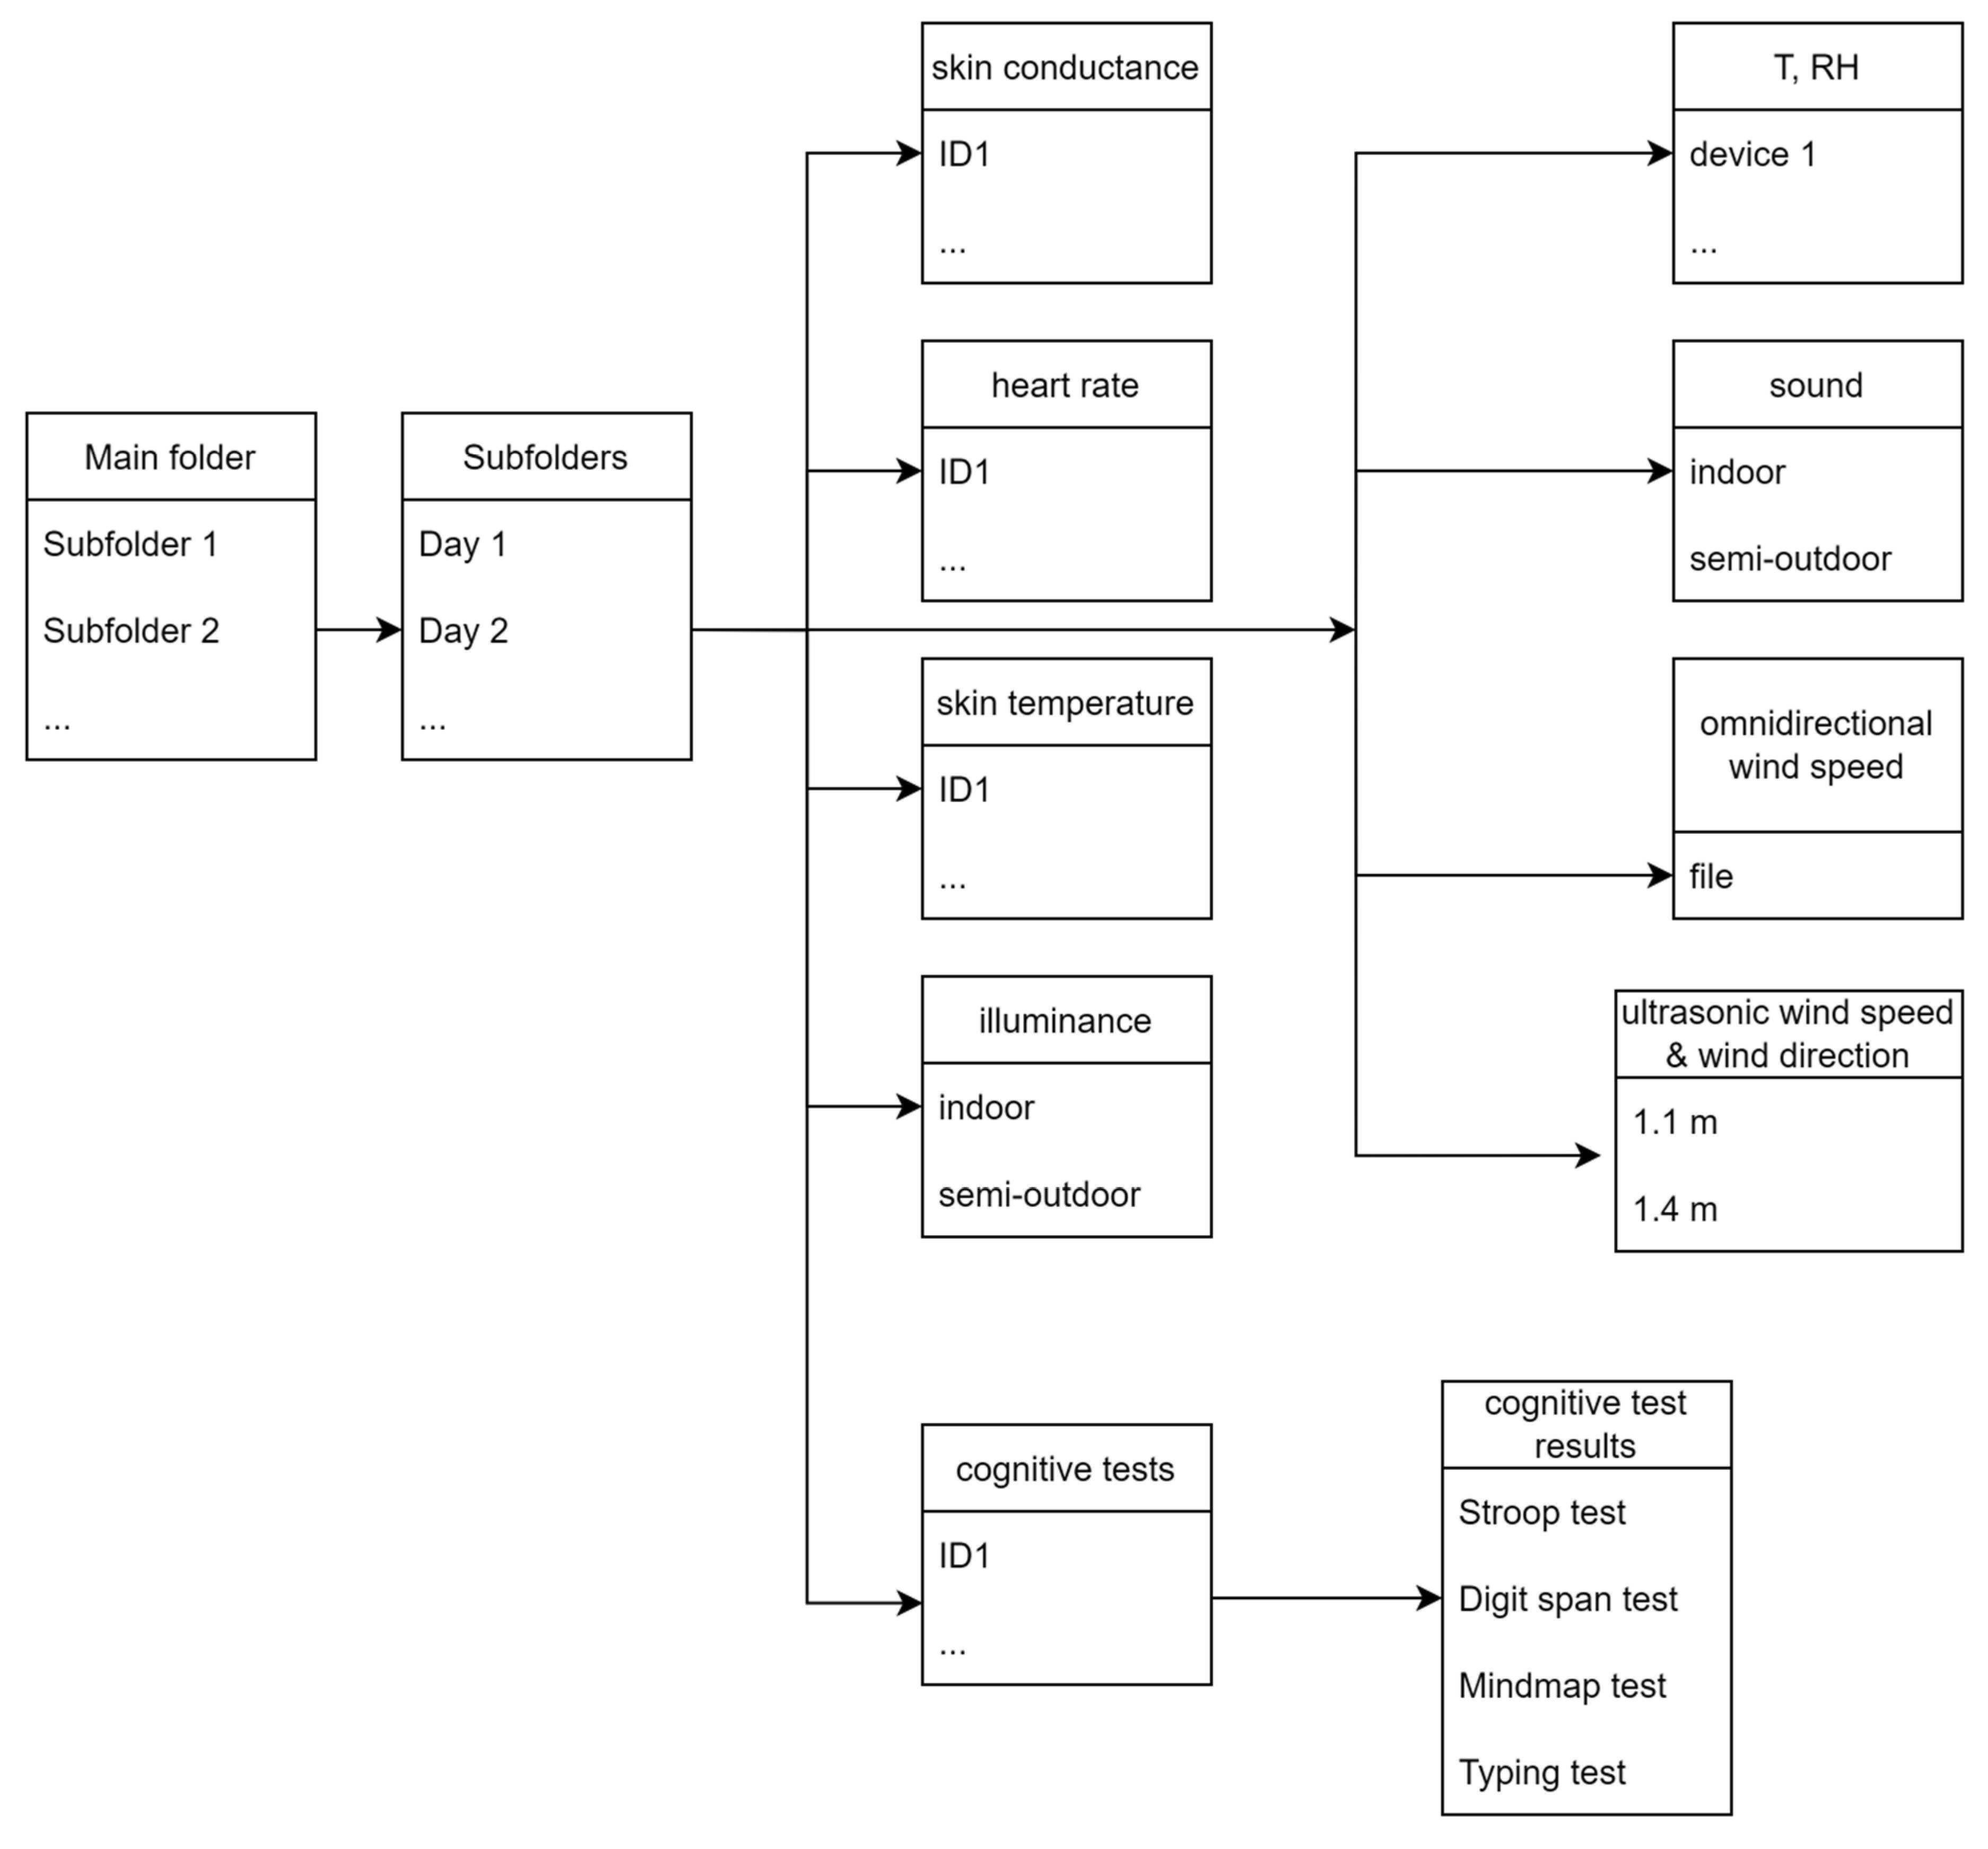
2.3. Data Collection and Storage

Temperature was measured by type-T thermocouple wires and humidity was measured by humidity logger. Air speed was measured by an omni-directional hot wire type anemometer and 3D ultrasonic anemometer. Temperature, humidity and omni-directional air speed were recorded using a Hioki data logger. Illuminance was recorded by T&D illuminometer. The sound pressure level was measured by a B&K sound level meter. Heart rate was measured by a Polar H10. Skin conductance was measured by a Shimmer 3. Skin temperature was measured by iButton. Due to the large amount of data and tight experimental schedule, the environmental data and physiological data could not be collected immediately after each cognitive test and subjective measurement. Temperature, humidity, sound pressure level and illuminance were collected from the beginning to the end of the entire experiment. After each session, air related parameters, skin temperature, skin conductance and heart rate were collected. Facial temperature data were collected via infrared thermography. After finishing the cognitive tests, the results of the stroop color and word test and the digit span test were automatically created and saved in the local directory. The typing test and mind map test were manually saved in the local folder by the instructor of the experiment.
The data were then organized in folders, as shown in Figure 5. At the top of the file structure, the date was used as a label for the folders. The names of the environmental parameters, physiological parameters and cognitive tests (e.g., skin conductance and skin temperature) were then used as the labels of the subfolders. For personal data, they were saved under the subfolders labeled with table ID. For subjective measurements, data were saved online.

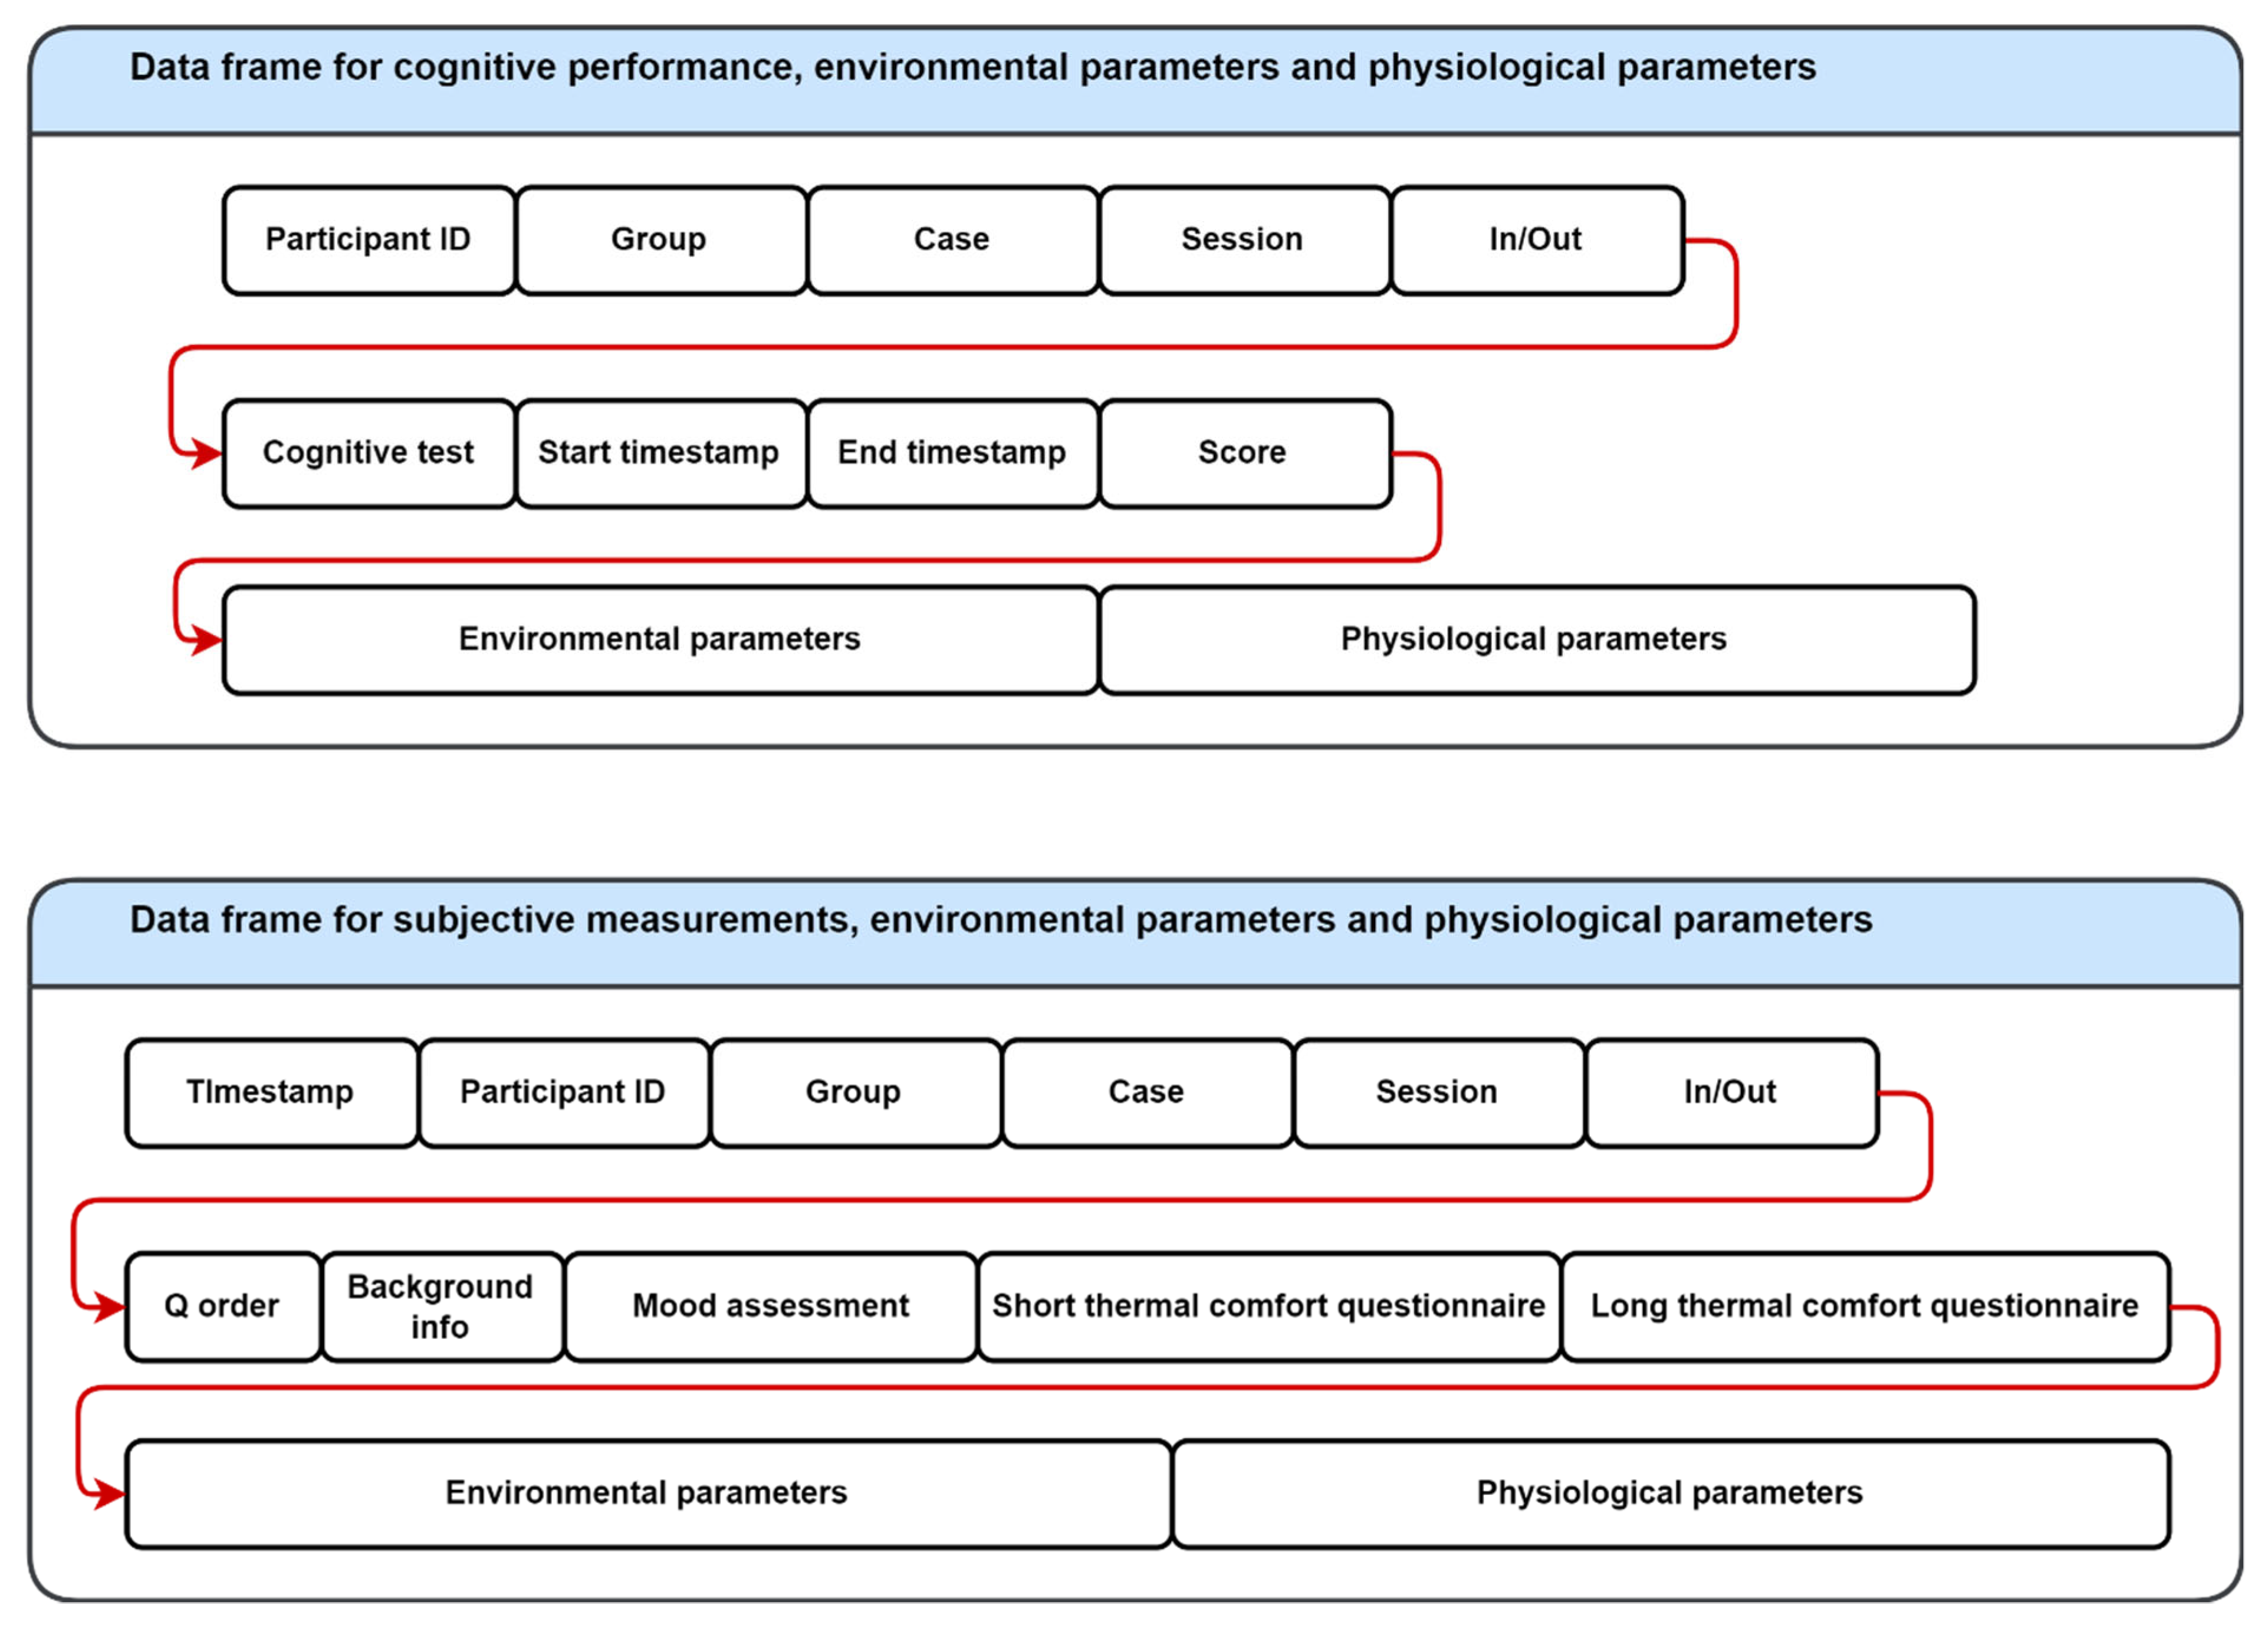
2.4. Data Extraction

Different environmental and physiological parameters were measured in different sampling intervals and file formats (Table 2). The temperature and humidity were measured in 5-min intervals and saved in csv format. The sound pressure level was measured in 1-min intervals and saved in xls format. The illuminance level was measured in 5-min intervals and saved in txt format. Omni-directional air speed was measured in 1-s intervals and saved in csv format. Three-dimensional air speed and air direction were measured in 0.05-s intervals and saved in txt format. Skin temperature and skin conductance were measured in 10-s and 0.2-s intervals, respectively. The data for both of these were saved in csv format. Heart rate data were measured in 0.001-s intervals and saved in txt format. Facial skin temperature was measured at specific timestamps during the experiment and saved in jpg format. In the steady state of the thermal response of subjects, thermal imaging was performed for a slightly longer period of time. After moving to a semi-outdoor environment, the facial skin temperature may change. Therefore, short-time thermal imaging was performed after moving to a semi-outdoor space. Except for the manual processing of facial skin temperature to obtain numerical results, the rest of the data extraction of environmental and physiological data were performed automatically based on Python programming. For omni-directional air speed, the logger only recorded the start timestamp and cumulative recording time, thus the script was programmed to locate the start timestamp and cumulative recording time in the raw data to create the actual timestamp for analysis. For cognitive tests, the results of the stroop color and word tests (e.g., interference score) and the digit span test (e.g., best score) were saved in csv format and extracted using pandas.read_csv. For the typing test and mind map test, the scores were manually typed into a spreadsheet. The subjective measurement data were retrieved from the questionnaire provider.
The research objectives required correlation analysis between environmental data, physiological data and subjective measurements. To achieve such objectives, the raw data were further extracted based on the timestamp of subjective measurements. As shown in Figure 1, the subjective measurements were conducted at multiple timestamps during the experiments. In the actual experiment, the start time of each participant answering the questionnaire was slightly different. As indicated in Table 3, the start timestamps of subjective measurements recorded in second accuracy were extracted from the data management system of the questionnaire provider. Other timestamps (0th, 10th, 20th, 30th, 31st, 32nd, 35th, 40th, 55th, 70th) were determined based on time intervals (e.g., 10 min, 20 min) from the start timestamp. Environmental data were further extracted based on the exact timestamp of each questionnaire order. For environmental data measured in 1-min and 5-min frequencies, they were extracted based on the round off timestamp of the questionnaire. Physiological data were extracted based on the past 1-min time interval from timestamp in seconds of each questionnaire order.
In addition, the raw data were further extracted for the correlation analysis between environmental data, physiological data and different cognitive performance scores. The start and end timestamps of the four cognitive tests (Table 4) must be obtained separately for correlation analysis. The stroop test required participants to complete 50-word color choices with no time limit for completion. Therefore, this study added the function of recording the start timestamp and the total time of the test in the stroop test program to determine the end timestamp. Similarly, for the digit span test, the game time was 2 min, and the developed program also recorded the start and end timestamps. For the typing test, it was conducted through a third-party web program, thus the end timestamp can only be obtained from the screenshot of the end of the test. The start timestamp of the typing test was then determined based on the total test length of 10 min. For the mind map test, the end timestamp was the file creation time, and the start timestamp was based on the total test length of 12 min. The environmental data and physiological data were extracted based on the time interval between the start timestamp and end timestamp of each cognitive test.

2.5. Data Pre-Processing

The raw data and processed data of this study are illustrated in Figure 6. For 3D air speed and air direction, the data needed pre-processing to get the actual value. The air speed and air direction were divided by 1000 and 10 to get the actual value, respectively. The air speed of X, Y, Z direction were then used to compute the vector air speed (U) shown in the Equation (1) [21]. The data were further resampled to 1 s frequency to compute the mean and standard deviation of air speed and turbulence intensity. The standard deviation of air speed ( σ U ) was calculated from the standard deviation of X, Y, Z components of air speed (Equation (2)) [21]. As shown in Equation (3), turbulence intensity (I) is the ratio of the standard deviation of air speed to the mean air speed [21]. The processed data were saved in csv file format for data archiving.
U   ( m / s ) = U X 2 + U Y 2 + U Z 2 2
σ U   ( m / s ) = σ X 2 + σ Y 2 + σ Z 2 3 2
  I = σ U U m e a n
For omni-directional air speed, data measured at 0.6 m and 1.1 m were used to compute mean air speed ( V m e a n ). The mean radiant temperature ( T m r t ) was calculated based on the globe temperature ( T g l o b e ), dry-bulb air temperature ( T a ) and air speed ( V ), as shown in Equation (4) [22]. The emissivity ( ε ) and diameter ( D ) of the globe is 0.95 and 150 mm, respectively. For T m r t in the semi-outdoor space, V was substituted by V m e a n . T g l o b e and T a were substituted by the temperatures measured at 1.1 m in the semi-outdoor space.
T m r t   ( ) = [ ( T g l o b e + 273.15 ) 4 + 1.1 × 10 8 × V 0.6 ε × D 0.4 × ( T g l o b e T a ) ] 0.25 273.15
T a , T m r t , V m e a n , RH, metabolic rate (1.1 met representing typing activity [14]) and clothing level (0.48 clo representing typical summer office attire) were used to calculate the standard effective temperature (SET) using the CBE online tool [23]. The operative temperature ( T o p ) was calculated from T a , T m r t and A based on Equation (5) from ASHRAE Standard 55 [24]. A is the function of V m e a n : A = 0.5 for air speed less than 0.2 m/s; A = 0.6 for air speed between 0.2 and 0.6 m/s; A = 0.7 for air speed between 0.6 and 1.0 m/s [24].
T o p   ( ) = A · T a + ( 1 A ) · T m r t
The upper and lower 80% acceptable ranges of T o p is determined based on ASHRAE Standard 55 [24].
U p p e r   80 %   l i m i t   ( ) = 0.31 · T p m a ( o u t ) + 21.3
L o w e r   80 %   l i m i t   ( ) = 0.31 · T p m a ( o u t ) + 21.3
where T p m a ( o u t ) is the prevailing mean outdoor air temperature from nearest meteorological station.
Skin temperature measured in different locations were used to calculate the weighted mean skin temperature ( T m s ) based on Equation (8) [25].
T m s   ( ) = 0.3 · T c h e s t + 0.3 · T a r m + 0.2 · T t h i g h + 0.2 · T l e g
The time series data of heart rate was processed to calculate Heart Rate Variability (HRV) parameters [26] including mean heart rate (HRM), the root mean square of successive differences between normal heartbeats ( R M S S D ), the interval between two heartbeats (NN), the number of adjacent NN intervals that differ from each other by more than 50 ms (NN50), the ratio between NN50 and the total number of NN intervals ( p N N 50 ), the fast Fourier transform ( F F T ) ratio, and the autoregressive ( A R ) ratio. The outlier check for heart rate and RR interval data were conducted using unsupervised outlier detection through the Scikit-learn function sklearn.neighbors.LocalOutlierFactor [27]. The calculation of HRV parameters was conducted using the open-source Python package pyhrv [14].
After the data were extracted, the data were labelled according to the type, location and identification code (ID) of the participant and table. Environmental data were shared by the participants, hence the type and location were labelled. For personal physiological data, type and ID were labelled. During the experiment planning, each participant was labelled with a unique “letter + number” combination (e.g., N001) and assigned a table number (e.g., ID1). Before the experiment, a bag containing the physiological instruments was passed to the participants. Hence, the serial number of different physiological instruments were associated with the ID of the participant and table. As shown in Table 5 and Table 6, information of physiological measurement and the ID of the table and participants were used as inputs during the data processing. Two tables were merged to create a basic information table containing location, serial number, table ID and participant ID. The time series data containing timestamp, serial number and measured data can then be merged with the basic information table. Finally, the processed physiological data matrix included the columns of timestamp, serial number of instruments, table ID, participant ID, and physiological data.

2.6. Data Analysis

The relationship between environmental factors and cognitive performance was first tested by Pearson correlation. Afterwards, relationships with significant correlations were modeled by multiple linear correlation (Equation (9)).
E ( Y ) = β 0 + β 1 X
where E(Y) is the expected value of the cognitive performance score of the digit span test, stroop test, mind map test and typing test; X is the measured value of SET, illuminance level and noise level.
The relationship between physiological parameters and cognitive performance was analyzed using a multiple linear regression model (Equation (10)). The β 1 to β 7 represents the effect of different physiological parameters (SCM, SCT, HRM, RMSSD, pNN50, FFT, AR) on cognitive performance. When the p value of the corresponding β coefficient is less than 0.05, the β value is considered valid, and the hypothesis that the corresponding physiological parameter affects cognitive performance is accepted.
E ( Y ) = β 0 + β 1 S C M + β 2 S C T + β 3 H R M + β 4 R M S S D + β 5 p N N 50 + β 6 F F T + β 7 A R
where: E(Y) is the expected value of cognitive performance score of the digit span test, stroop test, mind map test and typing test; SCM is the mean skin conductance; SCT is the mean skin temperature, HRM is the mean heart rate; RMSSD is the root mean square of successive differences between normal heartbeats; pNN50 is the ratio between NN50 and total number of NN intervals; FFT is the FFT ratio; and AR is the AR ratio.

2.7. Algorithm Development

Algorithm 1 illustrates the inputs, outputs, and functionality of the digit span test application. The input to the algorithm consists of user_input and digits_length. The user_input refers to the answer in reverse order of digits span. The digits_length refers to the initial length of digits set to 3 in this test. The output contains computer_output and the “correct/incorrect” text. The computer_output refers to digits randomly generated in order for the user during the test. The GenerateDigits() function first determines whether user_input has a none value, creates a variable to record the current timestamp, and checks whether the current digit length is less than 16. Then, if the current digit length is less than 11, the function generates a random list of unique digits based on the current digit length. If the current digit length is not less than 11, the random digit list contains 10 unique digits and the unique numbers computed based on the digit length of the current digit length minus10. The function then displays the current digit length and the digits in the random list in order. Finally, it outputs computer_output. The function CheckAnswers() creates an end_timestamp to record the current timestamp. The delta_T is equal to the time difference between GenerateDigits() and CheckAnswers(). If delta_T is less than the maximum test time of 120 s, the program continues. Then, the function outputs “correct” if user_input equals computer_output in reverse order, and “incorrect” otherwise. If the user’s input is correct and the current digit length is less than 16, the current digit length is incremented by one and GenerateDigits() continues. If the user’s input is incorrect, the user either continues GenerateDigits() with a digit length of 3 if the initial attempt fails, or continues testing with the current digit length minus one.
Algorithm 1: Digit Span Test
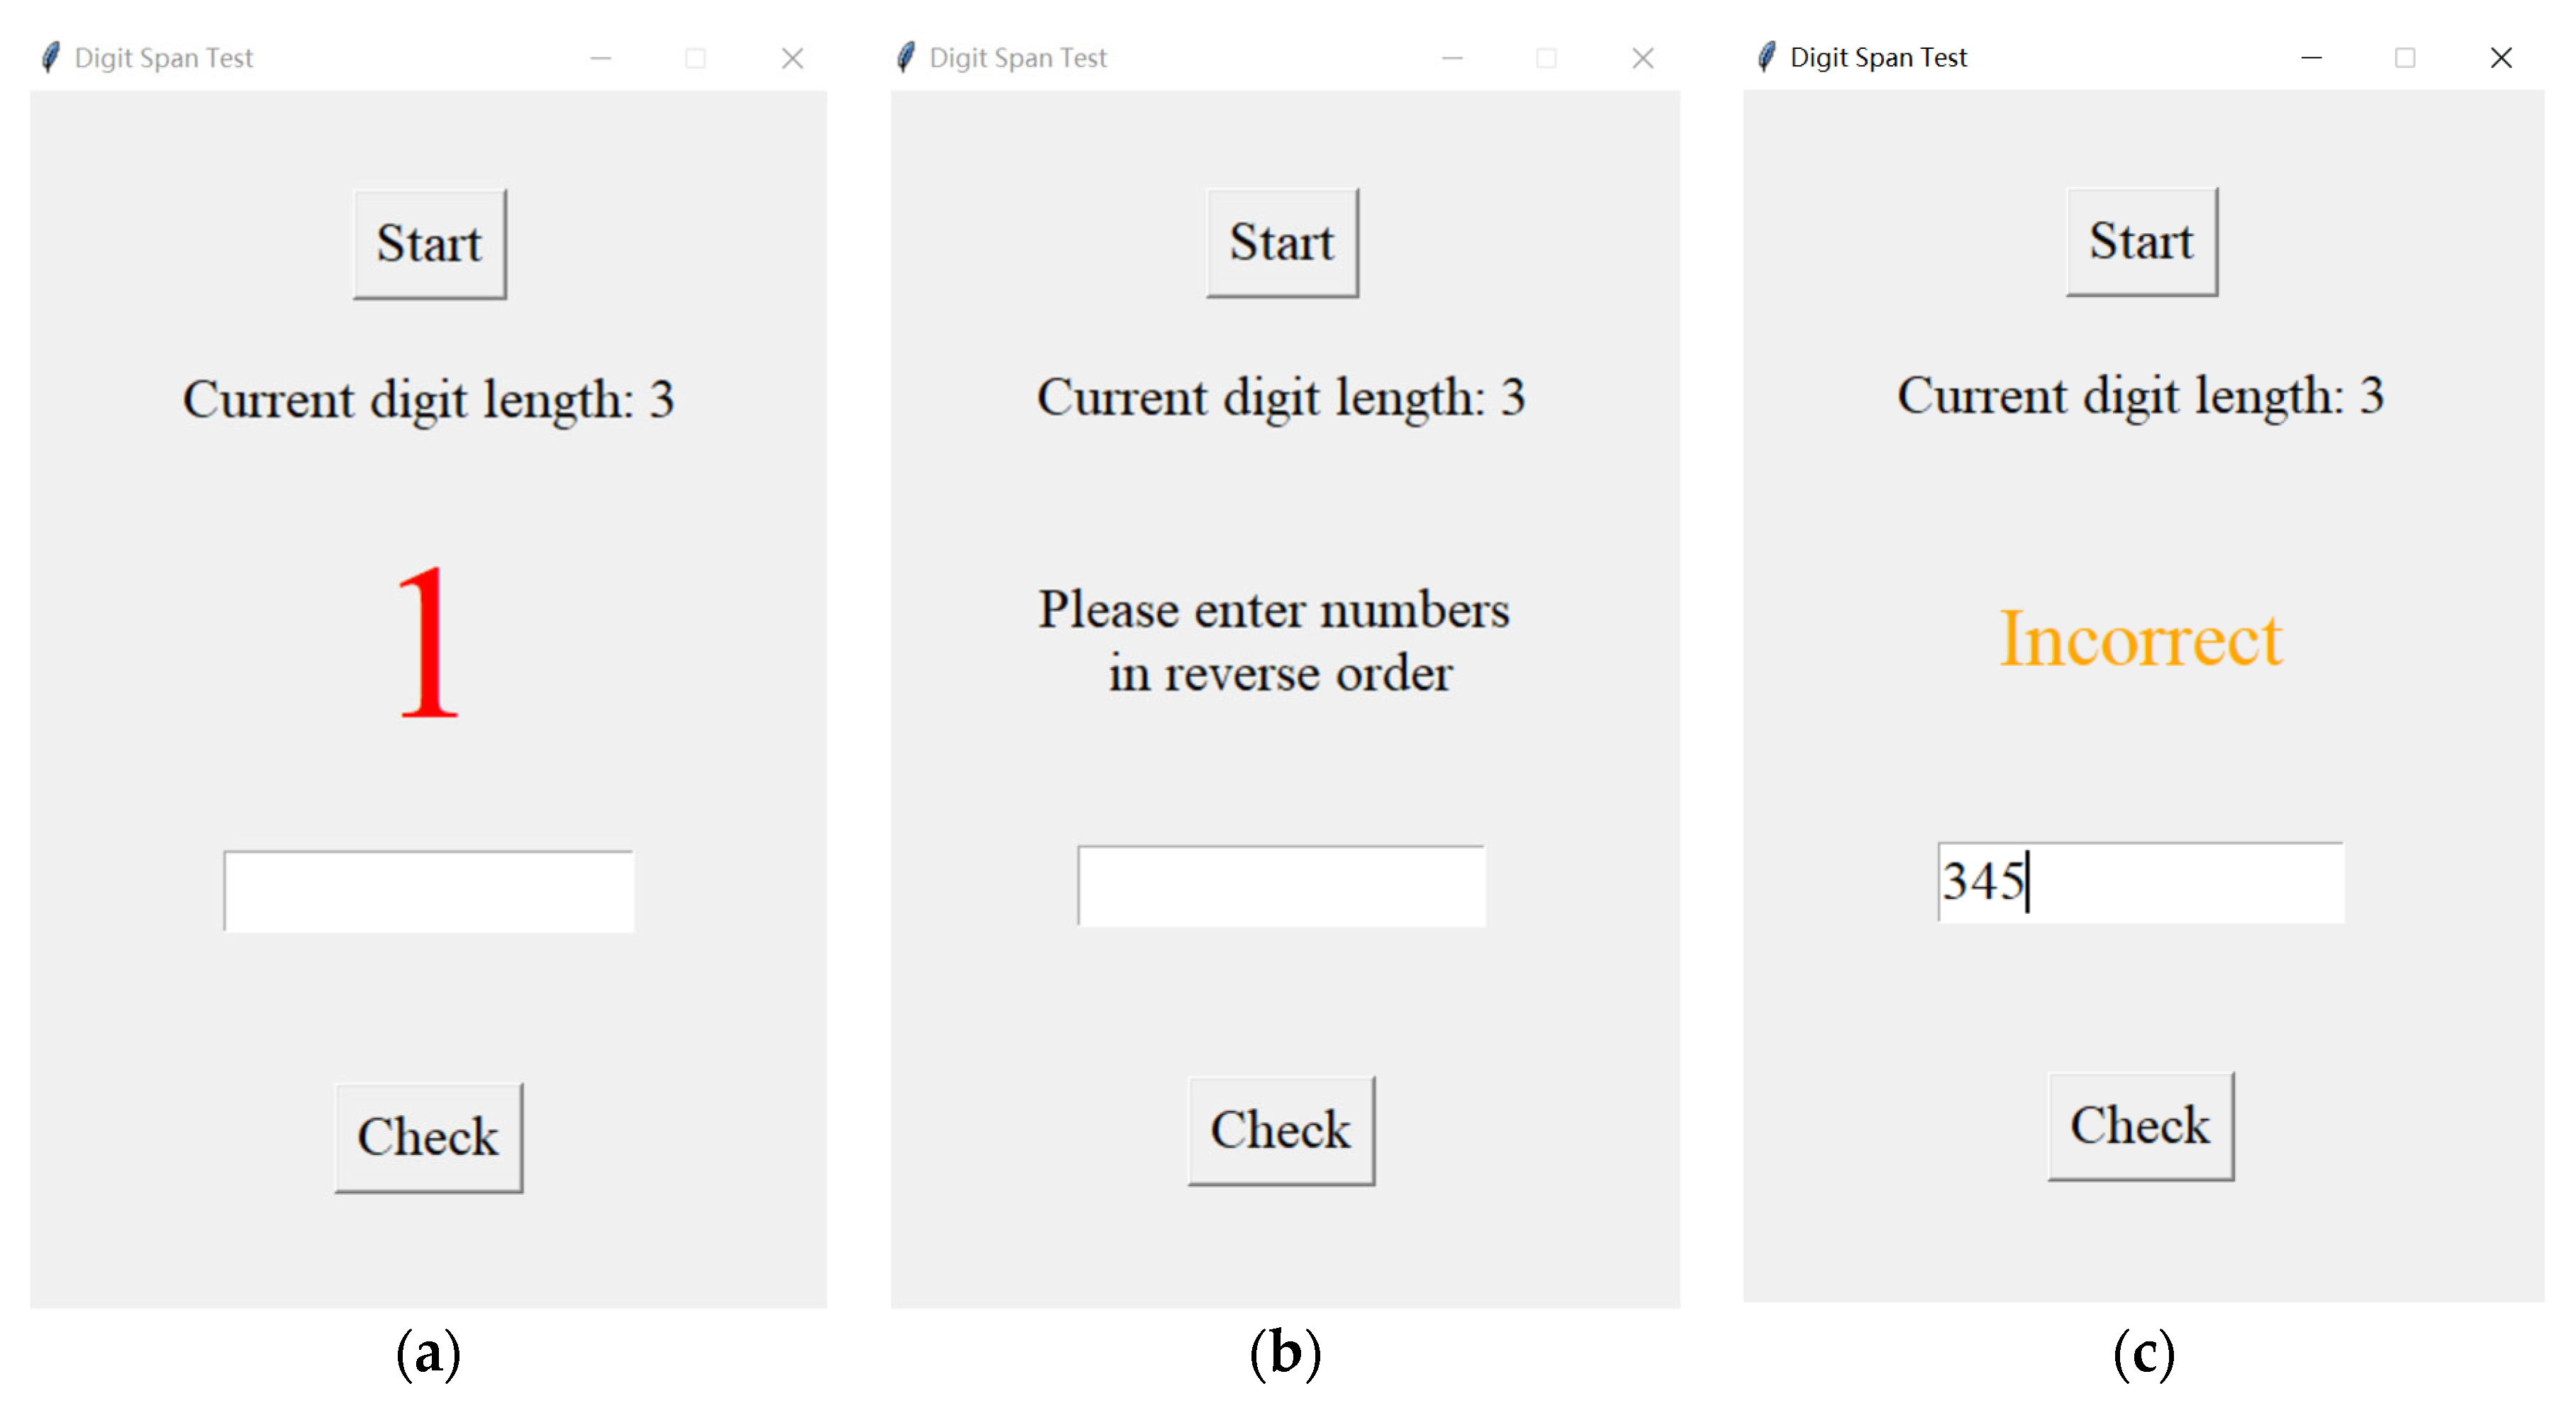
Input: user_input, digit_length
Output: computer_output, “correct”/“incorrect”
 
Function GenerateDigits():
  if user_input = None:
   start_timestamp = current timestamp
  while digit_length < 16:
   if digit_length <11:
    random list of digits = digits without duplicates based on the current length of digits
   else:
    random list of digits = 10 digits without duplicates + remaining length of digits without duplicates
   display current digit length
  for every digit in random list:
   display digit
  computer_output = random list of digits
return computer_output
 
Function CheckAnswers():
  end_timestamp = current timestamp
  delta_T = start_timestamp − end_timestamp
  if delta_T > 120 s:
   close application
  else:
   get user_input
   if user_input = reverse order of computer_output:
    display “correct”
    if digit_length < 16:
     digit_length = digit_length + 1
     GenerateDigits()
    else:
     close application
   else:
    display “incorrect”
    if digit_length >3:
     digit_length = digit_length − 1
     GenerateDigits()
    else:
     digit_length = 3
     GenerateDigits()
Algorithm 2 shows the input, output and functions of the stroop color and word test. The inputs contain the number of “congruent” words and the number of “incongruent” words. The output contains the interference score. The algorithm first creates and randomly shuffles the stroop_list based on 20 “congruent” words and 20 “incongruent” words. The function Congruent() outputs words (e.g., ‘Red’) with the same word color (e.g., ‘Red’), while Incongruent() outputs words (e.g., ‘Red’) with a different word color (e.g., ‘Yellow’). Run_stroop() first checks the stroop_list for the first word and continues with the relevant Congruent() or Incongruent() function. Meanwhile, a variable st is created to log current timestamp, and no_trial records the order of trials which have initial value of 1. The colored word then appears on the application screen. In Next_stroop(), if the total number of trials is less than or equal to the length of stoop_list, the function checks the first word of stroop_list and continues with the relevant Congruent() or Incongruent() function. The variable st is updated to record the current timestamp, and no_trial is incremented by 1. The colored word is displayed on the application screen. The function Submit() saves the user’s answer and duration from displaying the word to submitting the answer, then continues with Next_stroop(). User answers are recorded by clicking the relevant buttons (red, blue, green, yellow) in the application’s graphical user interface (GUI). The interference score (IS) is calculated based on Equation (11) [17].
I S = t o t a l   t i m e + 2 × m e a n   t i m e   p e r   w o r d × n u m b e r   o f   u n c o r r e c t e d   e r r o r s
where IS is the interference score; total time is the overall time for reading; mean time per word is the overall time for reading divided by the number of items; number of uncorrected errors is the number of errors not spontaneously corrected.
Algorithm 2: Stroop Color and Word Test
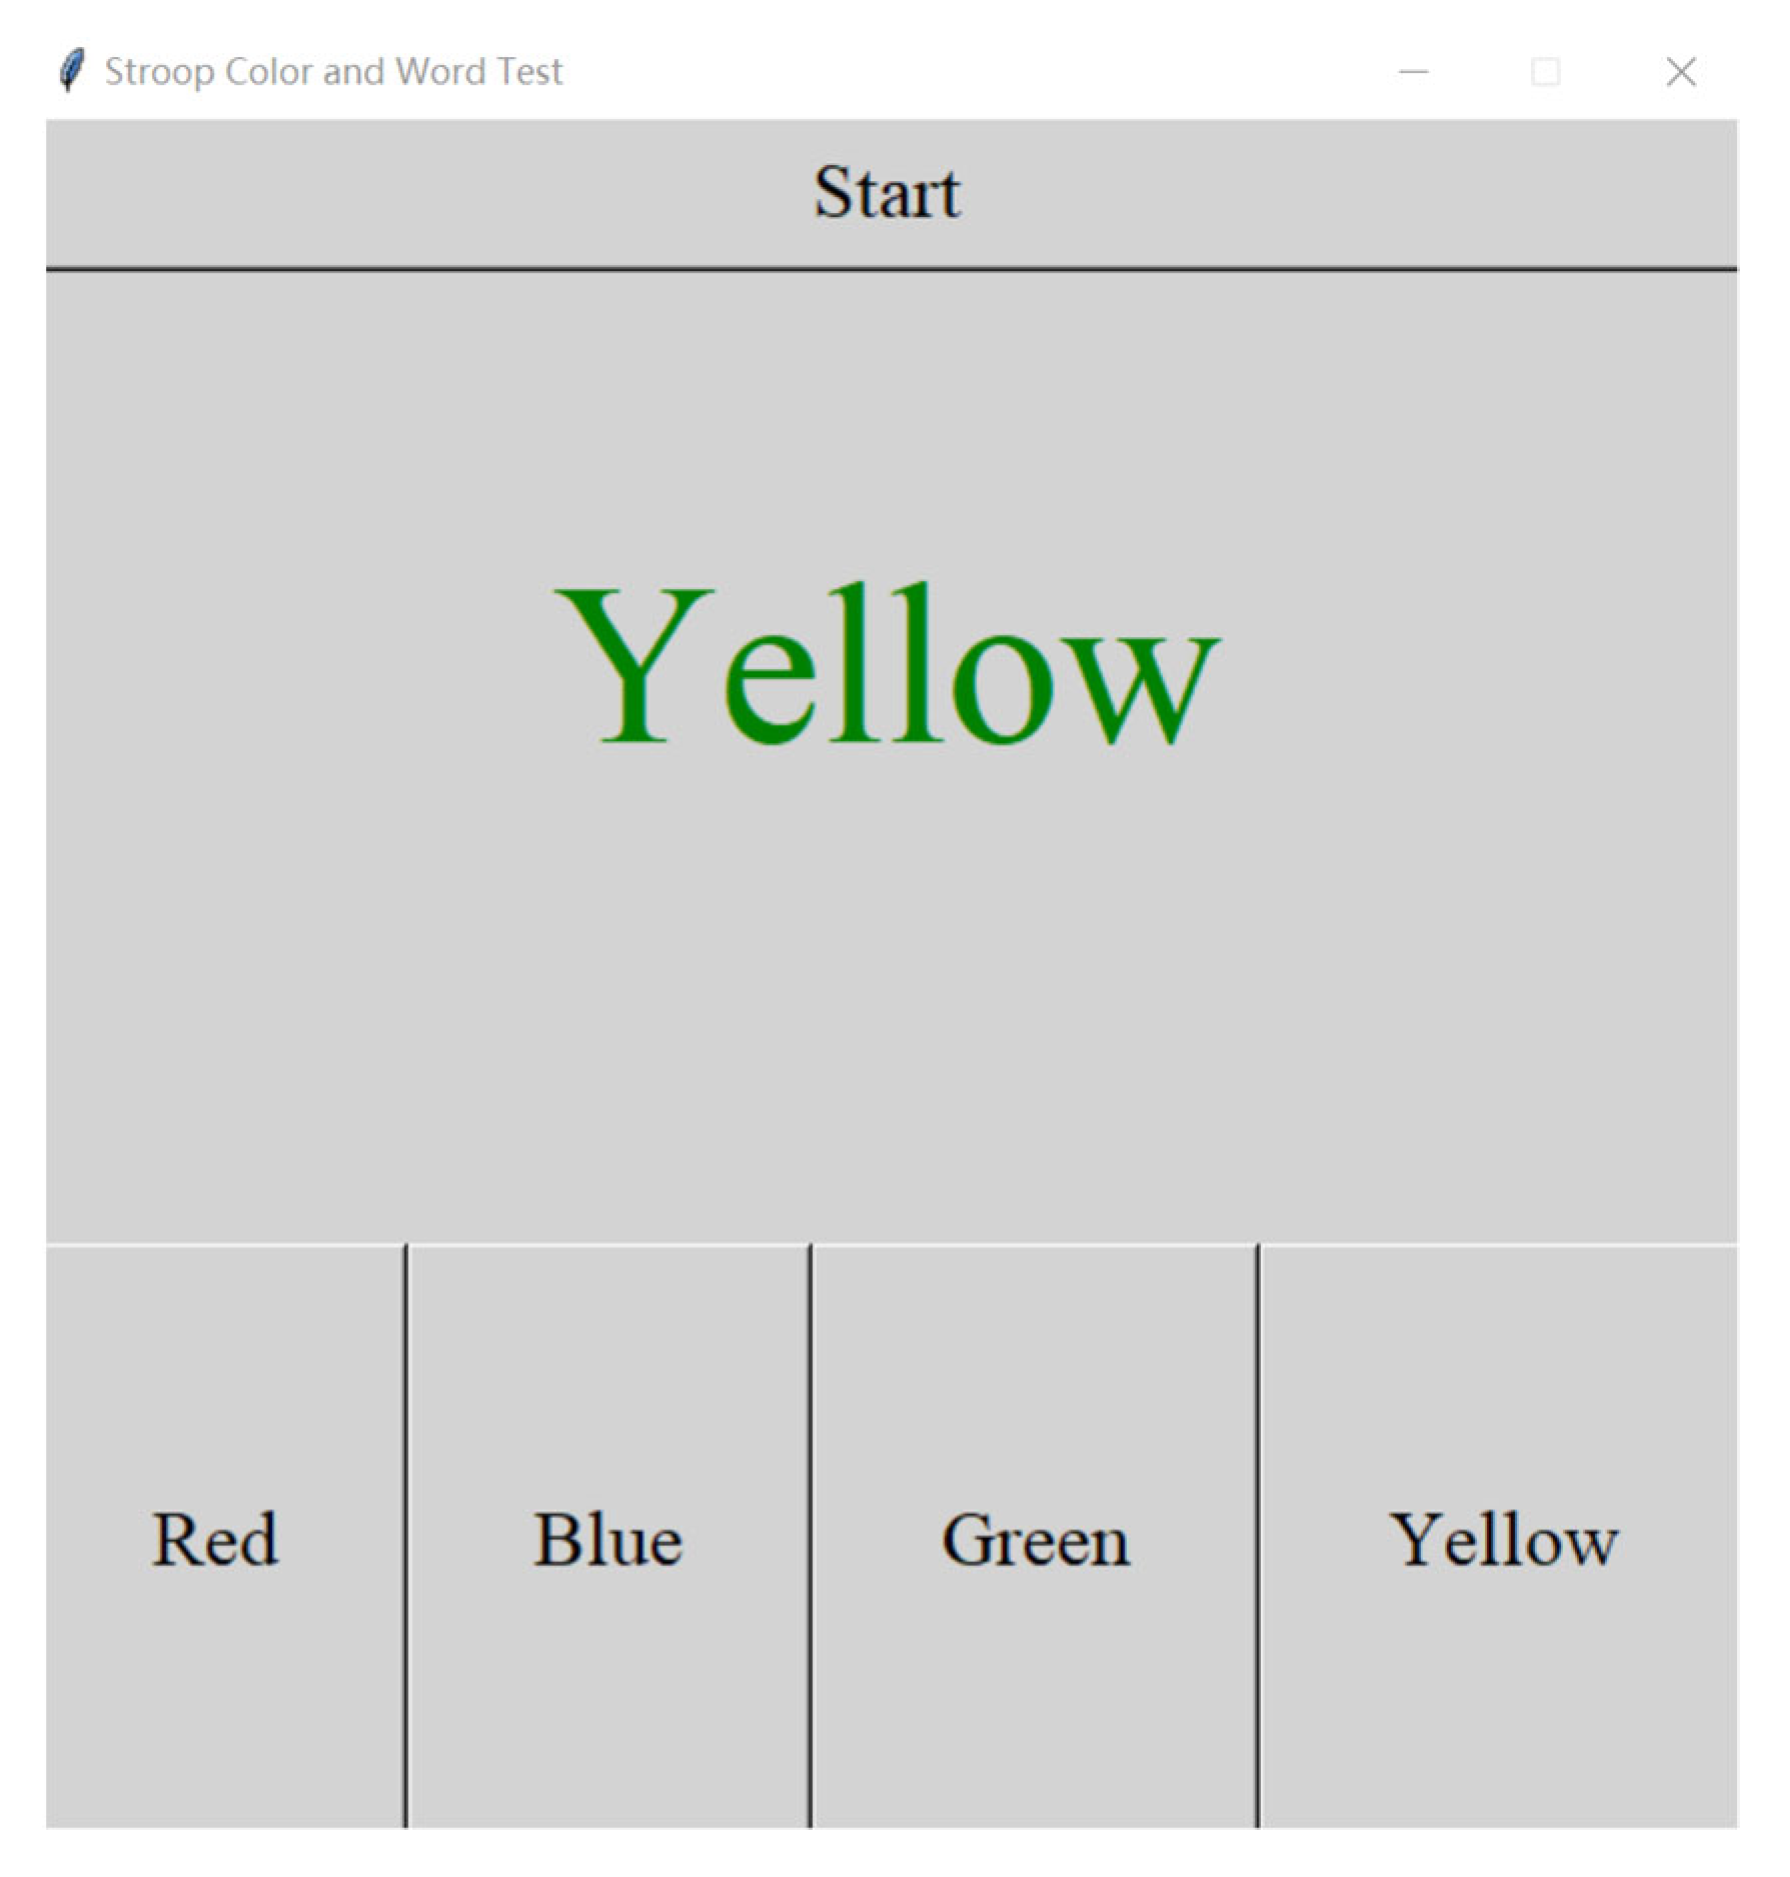
Input: number of congruent word; number of incongruent word
Output: interference score
number of congruent word = 20
number of incongruent word = 20
stoop_list = ‘congruent’ × number of congruent word + ‘incongruent’ × number of incongruent word
randomly shuffle the stoop_list
Function Congruent():
  word_list = ‘Red’, ‘Blue’, ‘Green’, ‘Yellow’
  selected_word = random choice of word_list
  return selected_word, selected_word
Function Incongruent():
  word_list = ‘Red’, ‘Blue’, ‘Green’, ‘Yellow’
  selected_word = random choice of word_list
  word_list_new = remove selected_word from word_list
  selected_color = random choice of word_list_new
  return selected_word, selected_color
Function Run_stroop():
  if stoop_list[0] == ‘congruent’:
   word, color = Congruent()
  else:
   word, color = Incongruent()
  st = current timestamp
  display word and color of word
  no_trial = 1
Function Next_stroop():
  if no_trial > len(stoop_list) − 1:
   close application
  else:
   if stoop_list[a] == ‘congruent’:
    word, color = Congruent()
   else:
    word, color = Incongruent()
   st = current timestamp
   display word and color of word
   no_trial = no_trial + 1
Function Submit():
  duration = current timestamp-st
  answer = ‘Red’
  save answer
  save duration
  Next_stroop()
total time = the overall time for reading
mean time per word = the overall time for reading divided by the number of items
number of uncorrected errors = the number of errors not spontaneously corrected
interference score = total time + 2 × mean time per word × number of uncorrected errors
The applications of digit span test and stroop color and word test were publicly available at: https://github.com/dbechenss/semi-outdoor-study, accessed on 1 December 2022.

2.8. GUI of Digit Span Test and Stroop Word and Color Test

The GUI of the digit span test is shown in Figure 7. The application displays the information regarding the current digit length. It starts by clicking the start button at the top, then the digit colored in red displays in order in the middle. The user is required to enter the answer of displayed digits in reverse order. The user can either click the check button or type enter to submit their answer. The output table contains information regarding the test procedure and user performance including sequence, computer output, user input, results, and best score.
The GUI of stroop color and word test is shown in Figure 8. The test is initiated by clicking the top button, and then the colored word is displayed in the middle. The user is then asked to click the relevant buttons at the bottom to submit their answer to the colored word. The software will record the type of each trial (incongruent or congruent), the words, the colors, the user input, time of answer, and computer evaluation. The interference score is calculated based on these data.

3. Results

The data frame structure of this study is shown in Figure 9. The data frame structure at the top contains data for environmental and physiological parameters related to cognitive performance. The bottom data frame structure contains the data of environmental parameters and physiological parameters used for correlation analysis of subjective measurement. Basic information including participant ID, group, case, session, and input/output is used for data classification. The proposed data frame was mainly used for correlation analysis between two parameters or for regression analysis of the causal relationship. The following illustrative examples are generated based on these two data frames.

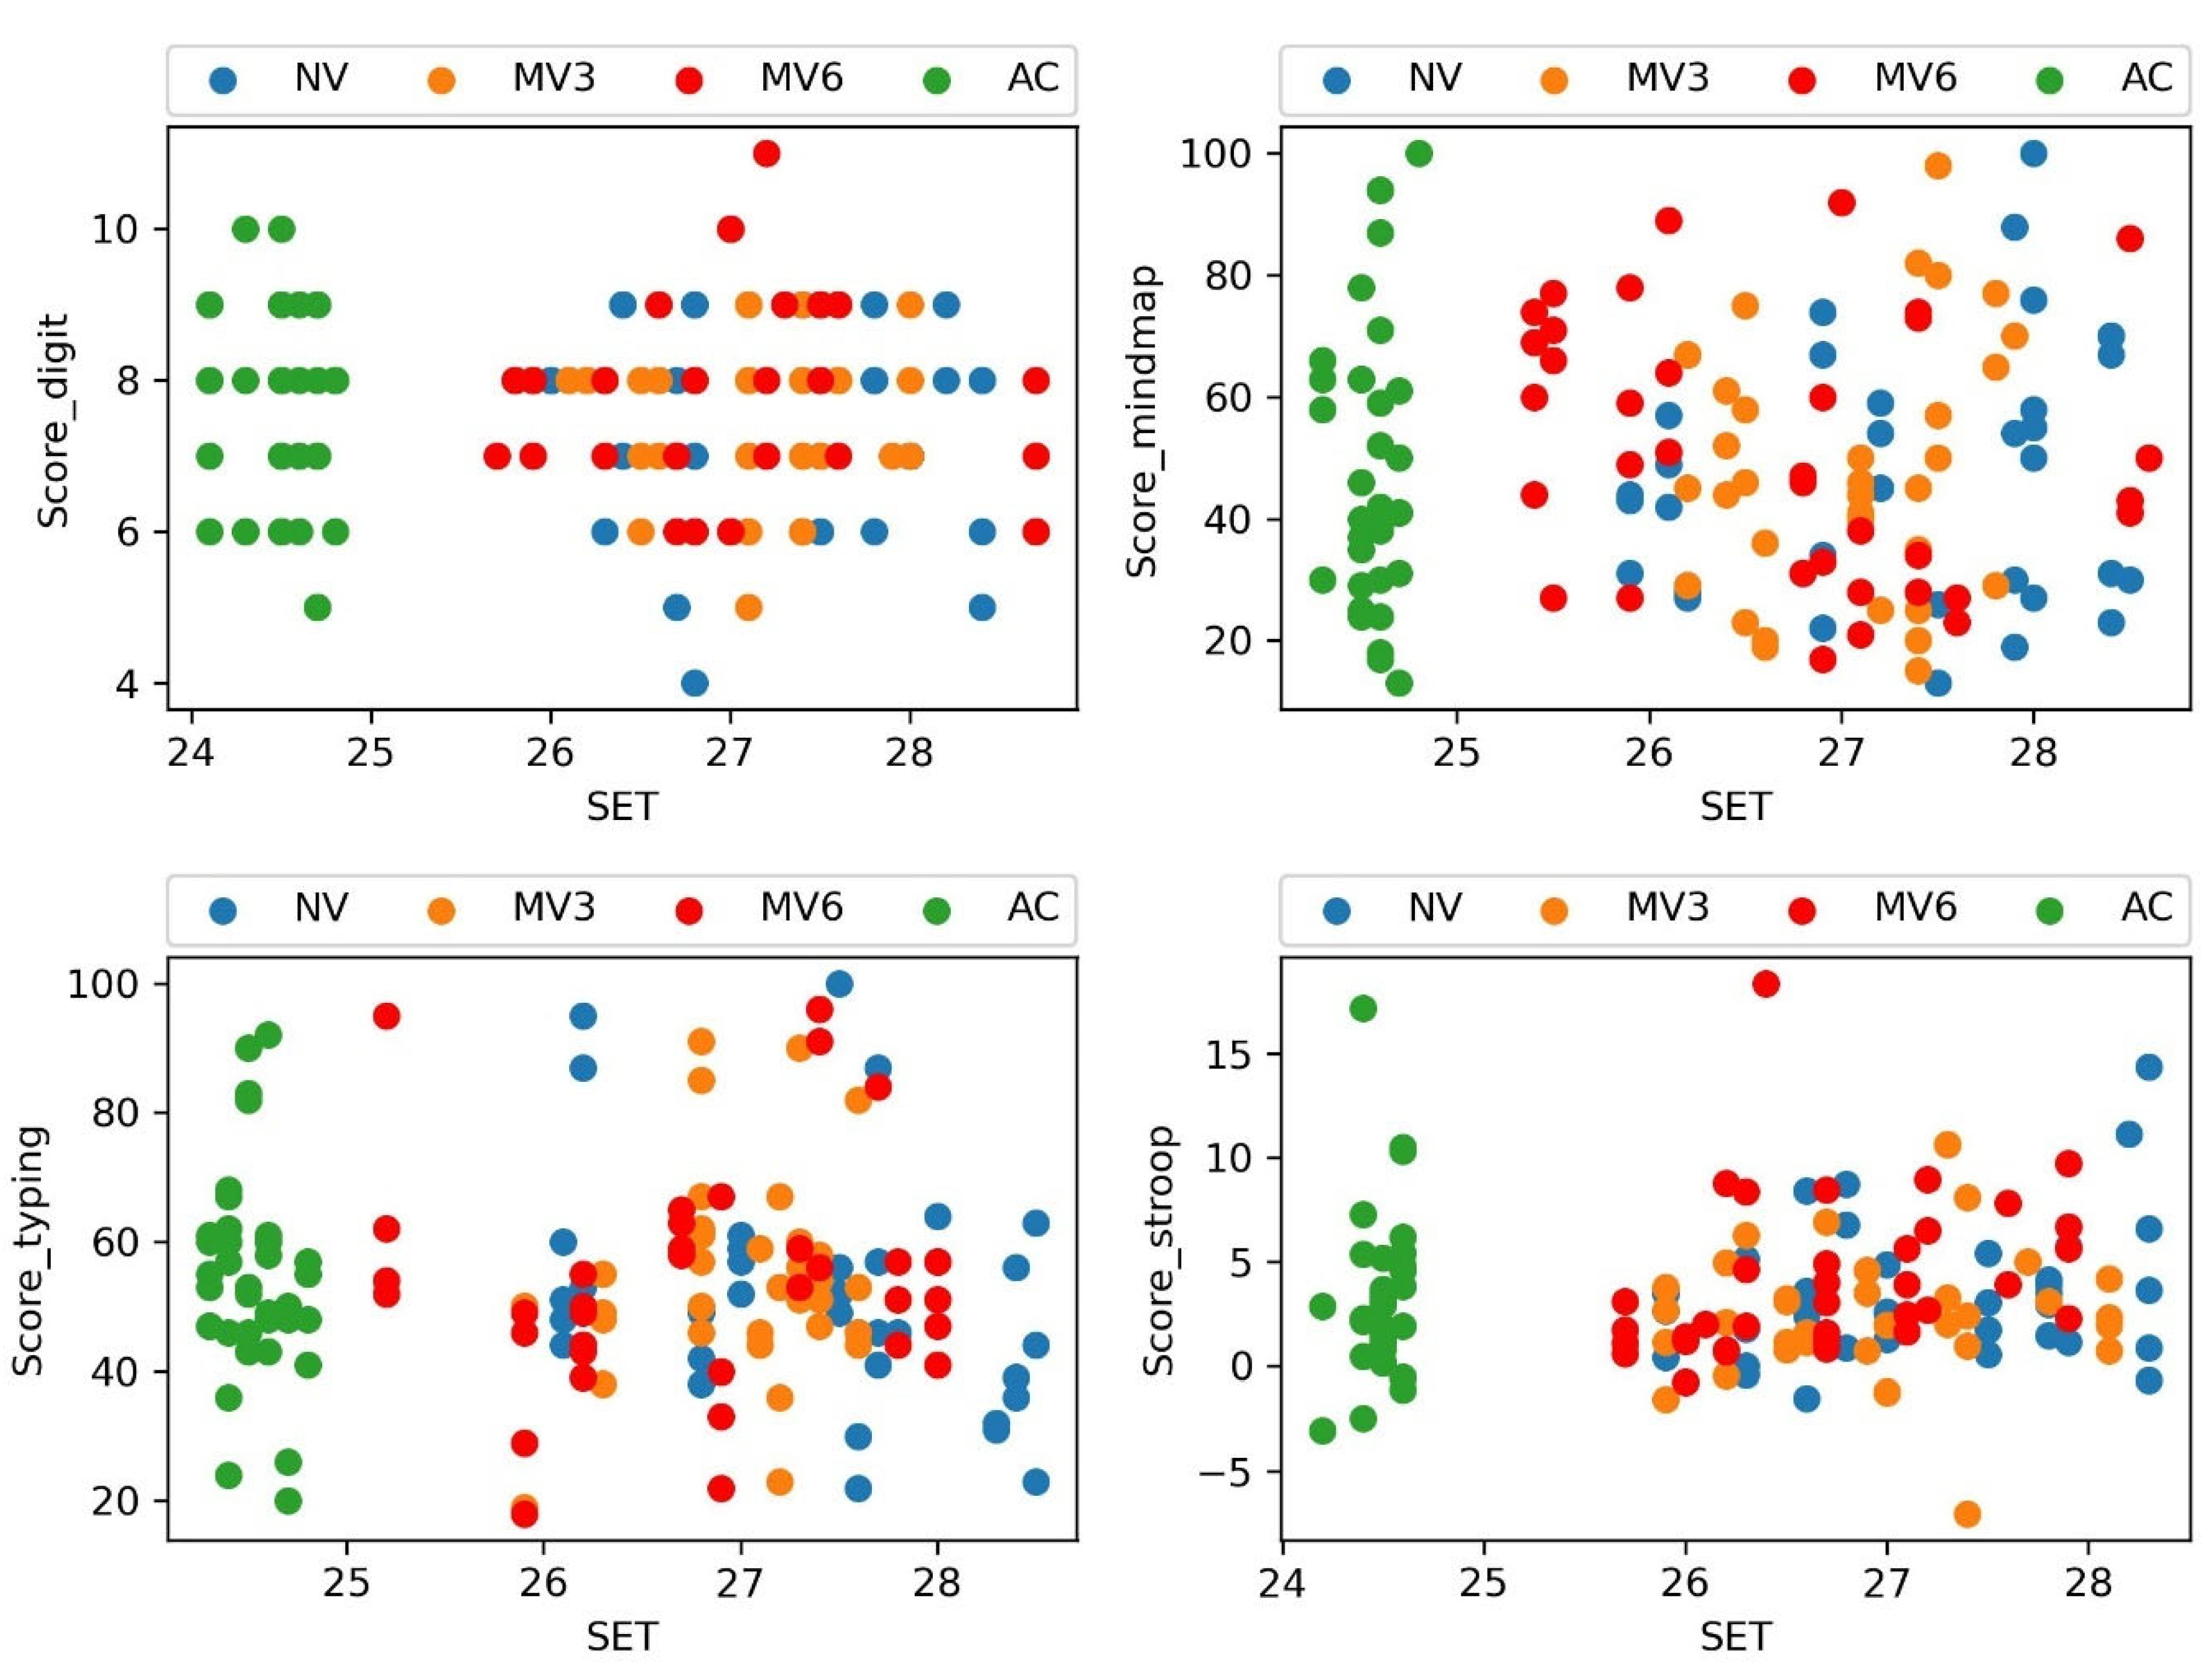
3.1. The Relationship between Environmental Settings and Cognitive Performance

A Pearson correlation analysis has been conducted between environmental factors (e.g., SET, illuminance, noise) and performance scores on the four cognitive tests for each case. Overall, the study found that the correlations between different environmental factors and cognitive performance were not statistically significant in most of the cognitive tests.
The correlations between SET and cognitive score in the warm period are shown in Figure 10 and Table 7. The results showed that the correlations between SET and DT scores ranged from −0.12 to 0.21 for different cases. These correlations were not statistically significant as the p-values were higher than 0.05. For MT, the correlations between SET and MT scores ranged from −0.2 to 0.17. These correlations were also not statistically significant (p-value > 0.05). For TT, the correlations between SET and TT scores ranged from −0.32 to 0.26, which were not statistically significant (p-value > 0.05), except for the NV case. There was a negative correlation (−0.32) at the significance level of 5% between the SET and TT score in the NV environment. The negative correlation between SET and the typing score of net words per minute indicated that the typing score decreased as the result of the increasing of SET. However, the correlation of −0.32 indicated a weak correlation between SET and TT score. For ST, the correlations between SET and ST scores ranged from 0.05 to 0.3. However, these correlations were not statistically significant (p-value > 0.05).

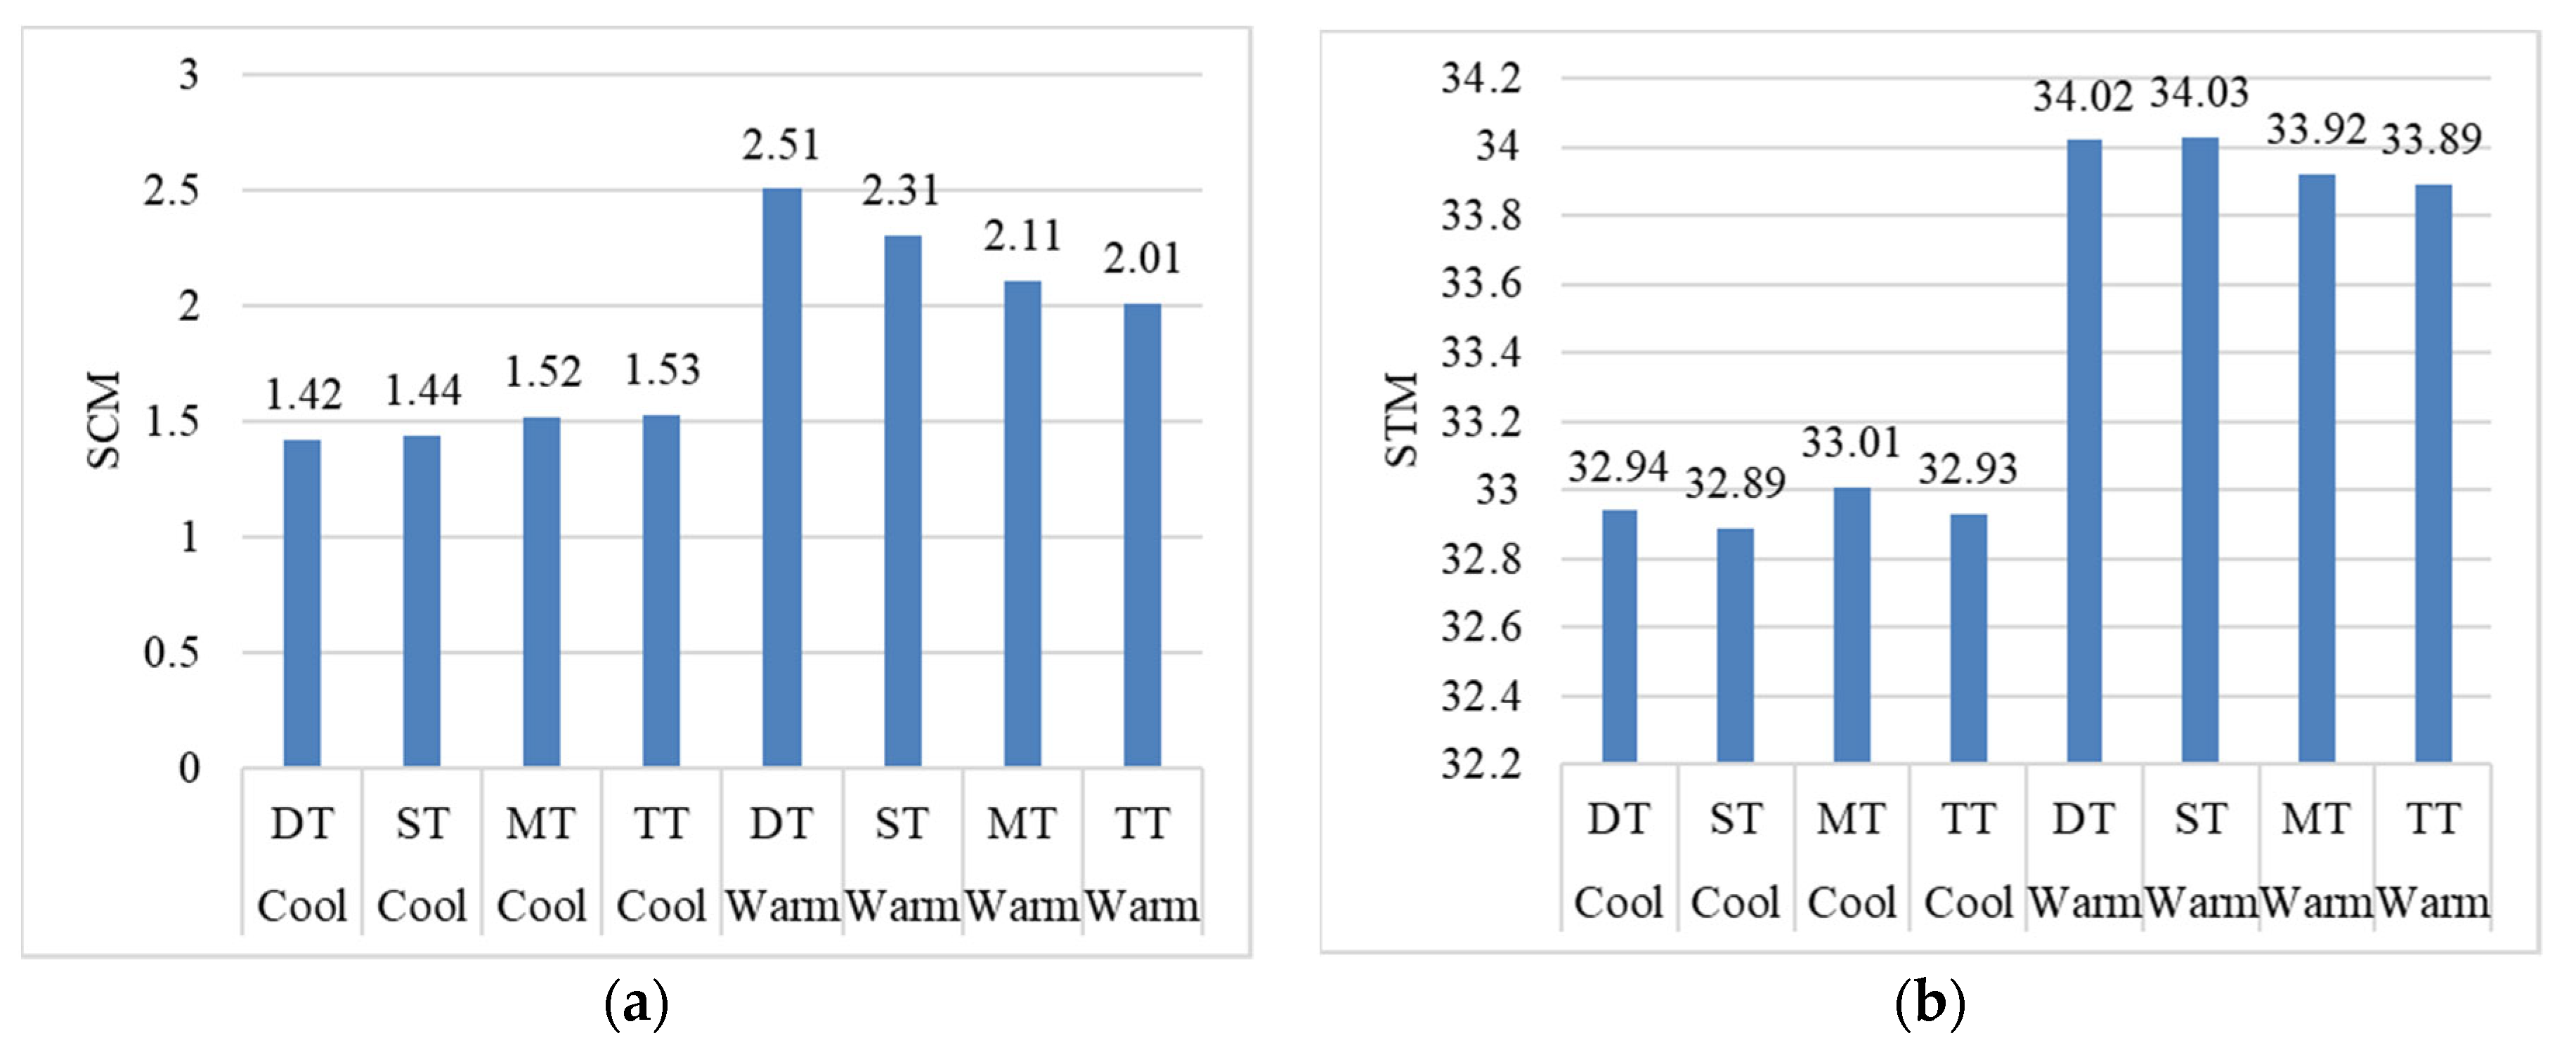
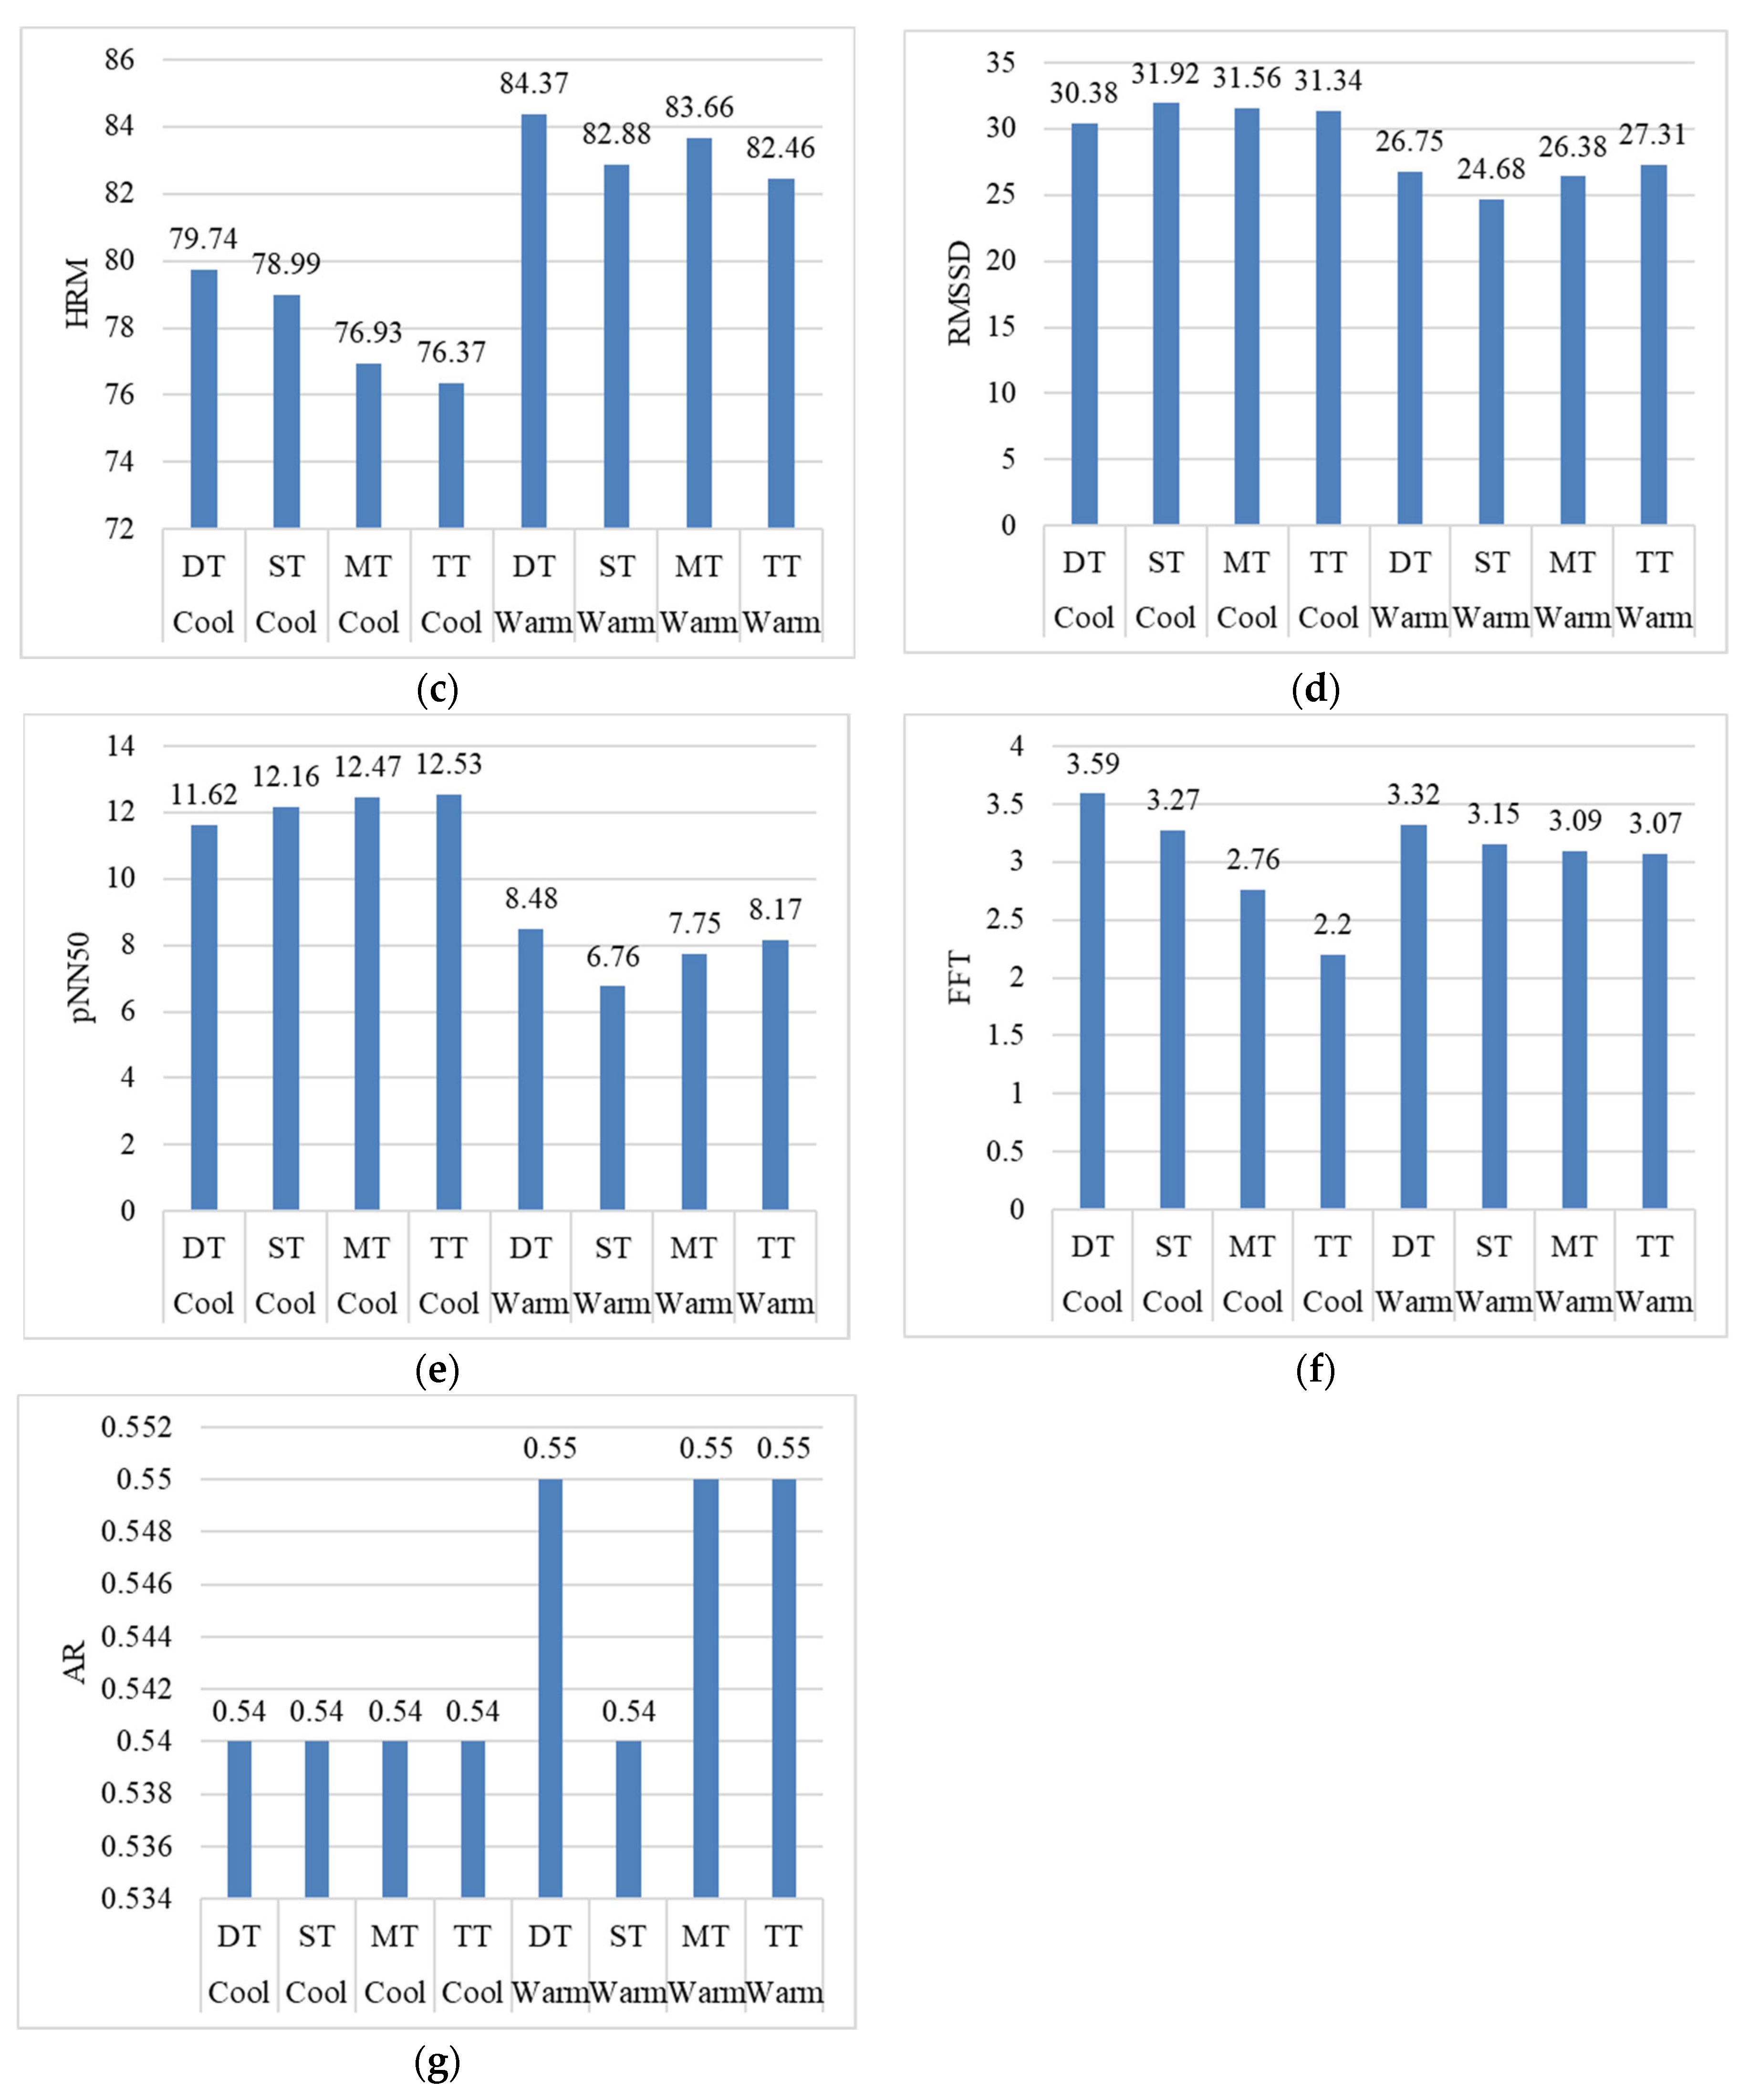
3.2. The Relationship between Physiological Parameters and Cognitive Performance

The mean SCM, STM, HRM, RMSSD, pNN50, FFT and AR are shown in Figure 11. The mean SCM in the cool period was about 0.5–1 μS lower than that in the warm period. Similarly, the mean STM in the cool period was also about 1 °C lower than that in the warm period. For heart rate variability, the mean HRM in the cool period during cognitive tests was also lower than that in the warm period. The RMSSD and pNN50 in the cool period were higher than that in the warm period. The mean FFT and AR varied slightly between the cool and warm periods.
For the cool period (Table 8), the statistical interference between physiological factors and cognitive performance score showed that the R2 of the digit span test, stroop test and mind map was all below 0.1, indicating poor correlations between physiological variables and cognitive test score. For the typing test, the R2 was 0.21. Few variables were statistically significant at 5%, including RMSSD and pNN50 in the digit span test (Equation (12)), SCM in the stroop test (Equation (13)), and HRM and FFT in the typing test (Equation (14)).
E ( D T ) = 0.05 R M S S D + 0.06 p N N 50   ( R 2 = 0.07 )
E ( S T ) = 0.59 S C M   ( R 2 = 0.11 )
E ( T T ) = 0.38 H R M + 1.54 F F T   ( R 2 = 0.21 )
For the warm period (Table 9), the statistical interference between physiological factors and cognitive performance score showed that the R2 of the cognitive tests were all below 0.2, indicating poor correlations between the physiological variables and the cognitive test score. Few variables were statistically significant at 5%, including HRM in the stroop test (Equation (15)), SCM, HRM, RMSSD, pNN50 in mind map (Equation (16)), and STM, HRM and FFT in the typing test (Equation (17)).
E ( S T ) = 0.09 H R M   ( R 2 = 0.09 )
E ( M T ) = 2.7 S C M + 0.49 H R M + 1.28 R M S S D 1.3 pNN 50   ( R 2 = 0.13 )
E ( T T ) = 327.16 6.32 S T M + 0.47 H R M + 3.51 F F T ( R 2 = 0.17 )

4. Discussion

This study explored the application of information technology in the study of human physiology, cognitive performance, and subjective performance in semi-outdoor space. The proposed framework can be used as a guide for the data management for projects involving thermal comfort, cognitive performance, physiological performance, and environmental parameters. The developed scripts can be used directly as useful tools for data extraction and processing of environmental and physiological performance measurements using similar measurement instruments. Other researchers can directly use the algorithms developed in this study for the digit span test and the stroop color and work test in the cognitive performance research. Overall, the proposed data management framework has the following key features and advantages. The framework supports data extraction and the pre-processing of raw data extracted from specific brands of instruments: temperature, humidity, air speed recorded by the Hioki data logger; heart rate measured by Polar H10; skin conductance measured by Shimmer 3; and skin temperature measured by iButton. Other data collected in csv and txt format are also supported. For data analysis and visualization, it supports statistical analysis such as correlation, regression, and clustering. The framework implemented through Python code supports the full reproducibility of data extraction, data preprocessing and data analysis, which has been implemented and demonstrated in this project. It helps researchers and project managers avoid human error and effectively reproduce results in the presence of any changes to the raw data. These codes can also be transferred to another similar project without major changes. The framework reduces the involvement of third-party software during data pre-processing such as HRV calculations. Traditionally, HRV calculations were processed using third-party software, and researchers had to extract and import data from different time periods multiple times. If there are some changes to the original data, the process is not repeatable or the cost of revising the data is expensive. The framework integrates packages from the Python community leveraging the powerful data manipulation and analysis functions of pandas and numpy, and significantly reduces the manual processing time.
This study showed weak or insignificant correlations between cognitive performance and environmental indicators (SET). SET is an evaluation index that considers air temperature, mean radiation temperature, air velocity, relative humidity, metabolic rate and clothing level [28]. The metabolic rate and clothing level were the same for indoor and semi-outdoor spaces because subjects maintained the same activities and wore the same clothing. Hence, the insignificant correlations between cognitive performance and SET suggested that subjects maintained their selective attention, short-term memory, attention and creativity during brief stays in semi-outdoor spaces in tropical regions. Similarly, there were weak or insignificant correlations between cognitive performances and physiological parameters including heart rate variability, skin conductance, and skin temperature. Similar findings were found in a study conducted in Australia, where researchers found that cognitive load and physiological indicators such as EEG and heart rate were not significantly affected by the elevated indoor ambient temperature (e.g., 22 °C to 25 °C) [9]. Other studies [7,8] conducted in hot and humid regions of China and Northern Europe have shown that cognitive load was significantly affected by temperature, with cognitive performance being optimal on the lower side of thermally acceptable temperature, such as 24 °C. Compared to the standard indoor setting of 24 °C, cognitive performance at the higher temperatures of 26 °C and 28 °C decreased by only 6% and 10%, respectively [8]. The study also found that some of the negative effects of increased temperature were mitigated by the air movement of the ceiling fans. This finding validates the results of this study that cognitive load can be maintained in semi-outdoor spaces due to the availability of natural and mechanical ventilation.
In terms of limitations, the framework involves the interpretation and implementation of code and requires users to have basic Python experience and skills. The use of this research code by other projects requires some variable values to be changed, thus limiting access to some outsiders. Except for running stroop color and word tests and digit span tests, the rest of the data extraction, data preprocessing, and data analysis codes were not packaged into the software. Further code integration by creating Python classes and objects may occur for more general use of this framework. In addition, some features were designed specifically for this study and may not be transferred to other projects. Energy consumption associated with different environments was not measured in this study, and this information can be added as information in future energy efficiency studies. The findings of this study applied to the entire experimental group including both men and women, which may indicate a bias in terms of gender differences. In future studies, perceptions of the environment could be processed by gender as a way to distinguish the effects of gender on physiological and cognitive performance.

5. Conclusions

This study proposes a data management framework for semi-outdoor research in the tropics. The framework supports the full reproducibility of data extraction and data pre-processing, providing an efficient and error-free method for data analysis. This semi-automatic data management framework reduces the involvement of third-party software, thereby reducing manual processing time. In addition, it leverages the powerful data manipulation and computation capabilities of pandas and numpy for data extraction, data pre-processing, and analysis processes. The proposed framework has been successfully used to process multidimensional data from measurements of environmental parameters, physiological parameters, subjective parameters and cognitive performance. The applications of the digit span test and the stroop color and word test were developed from scratch and can be modified to meet the different research needs.
Furthermore, this study concluded that subjects’ cognitive performance was not significantly affected by the elevated temperature (27 °C to 29 °C) in the semi-outdoor space, suggesting that people maintained their selective attention, short-term memory, attention, and creativity during brief stays in semi-outdoor spaces in tropical regions.

Author Contributions

Conceptualization, S.C., K.M., N.H.W., J.K.W.L. and C.L.T.; Data curation, S.C. and K.M.; Formal analysis, S.C. and K.M.; Funding acquisition, K.M., N.H.W., J.K.W.L. and C.L.T.; Investigation, S.C. and K.M.; Methodology, S.C. and K.M.; Project administration, K.M.; Resources, K.M., N.H.W., J.K.W.L. and C.L.T.; Software, S.C.; Supervision, N.H.W., J.K.W.L. and C.L.T.; Validation, S.C., K.M., N.H.W., J.K.W.L. and C.L.T.; Visualization, S.C.; Writing—original draft, S.C.; Writing—review & editing, S.C., K.M., N.H.W., J.K.W.L. and C.L.T. All authors have read and agreed to the published version of the manuscript.

Funding

This research was funded by Kajima Technical Research Institute Singapore, project X2440X004.

Institutional Review Board Statement

The study was approved by National University of Singapore and Kajima Technical Research Institute Singapore (X2440X004, November 2020).

Informed Consent Statement

Informed consent was obtained from all subjects involved in the study.

Data Availability Statement

The data are not available due to Non-Disclosure Agreement. The computer codes are publicly available at: https://github.com/dbechenss/semi-outdoor-study, accessed on 1 December 2022.

Acknowledgments

Special thanks to Si Ching Ong, Ching Hang Lam, Yijun Lu, Takamasa Hasama, and Yang He for their assistance in this project.

Conflicts of Interest

The authors declare that they have no conflict of interest.

Abbreviation and Symbols

AC Air conditioning
ARAR ratio
DTDigit span test
T a Dry-bulb air temperature
FFTFFT ratio
T globe Globe temperature
HRVHeart rate variability
HRMMean heart rate
T mrt Mean radiant temperature
V mean Mean air speed
MVMechanical ventilation
MTMind map test
NVNatural ventilation
T op Operative temperature
T pma ( out ) Prevailing mean outdoor air temperature
RHRelative humidity
RMSSD Root mean square of successive differences between normal heartbeats
σ U Standard deviation of air speed
SETStandard effective temperature
STStroop color and word test
pNN 50 The ratio between NN50 and total number of NN intervals
ITurbulence intensity
TTTyping test
UVector air speed
T m s Weighted mean skin temperature
VAir speed

References

  1. Cheung, T.; Schiavon, S.; Graham, L.T.; Tham, K.W. Occupant satisfaction with the indoor environment in seven commercial buildings in Singapore. Build. Environ. 2021, 188, 107443. [Google Scholar] [CrossRef]
  2. McArthur, J.J.; Powell, C. Health and wellness in commercial buildings: Systematic review of sustainable building rating systems and alignment with contemporary research. Build. Environ. 2020, 171, 106635. [Google Scholar] [CrossRef]
  3. Crosby, S.; Rysanek, A. Correlations between thermal satisfaction and non-thermal conditions of indoor environmental quality: Bayesian inference of a field study of offices. J. Build. Eng. 2021, 35, 102051. [Google Scholar] [CrossRef]
  4. Esfandiari, M.; Zaid, S.M.; Ismail, M.; Hafezi, M.R.; Asadi, I.; Mohammadi, S.; Vaisi, S.; Aflaki, A. Occupants’ Satisfaction toward Indoor Environment Quality of Platinum Green-Certified Office Buildings in Tropical Climate. Energies 2021, 14, 2264. [Google Scholar] [CrossRef]
  5. Lau, S.S.Y.; Zhang, J.; Tao, Y. A comparative study of thermal comfort in learning spaces using three different ventilation strategies on a tropical university campus. Build. Environ. 2018, 148, 579–599. [Google Scholar] [CrossRef]
  6. Byrne, J.; Ludington-Hoe, S.M.; Voss, J.G. Occupational Heat Stress, Thermal Comfort, and Cognitive Performance in the OR: An Integrative Review. AORN J. 2020, 111, 536–545. [Google Scholar] [CrossRef]
  7. Lan, L.; Xia, L.; Hejjo, R.; Wyon, D.P.; Wargocki, P. Perceived air quality and cognitive performance decrease at moderately raised indoor temperatures even when clothed for comfort. Indoor Air 2020, 30, 841–859. [Google Scholar] [CrossRef] [PubMed]
  8. Lan, L.; Tang, J.; Wargocki, P.; Wyon, D.P.; Lian, Z. Cognitive performance was reduced by higher air temperature even when thermal comfort was maintained over the 24–28 °C range. Indoor Air 2021, 32, e12916. [Google Scholar] [CrossRef]
  9. Zhang, F.; Haddad, S.; Nakisa, B.; Rastgoo, M.N.; Candido, C.; Tjondronegoro, D.; de Dear, R. The effects of higher temperature setpoints during summer on office workers’ cognitive load and thermal comfort. Build. Environ. 2017, 123, 176–188. [Google Scholar] [CrossRef] [Green Version]
  10. Schiavon, S.; Yang, B.; Donner, Y.; Chang, V.W.C.; Nazaroff, W.W. Thermal comfort, perceived air quality, and cognitive performance when personally controlled air movement is used by tropically acclimatized persons. Indoor Air 2017, 27, 690–702. [Google Scholar] [CrossRef]
  11. Luo, M.; Xie, J.; Yan, Y.; Ke, Z.; Yu, P.; Wang, Z.; Zhang, J. Comparing machine learning algorithms in predicting thermal sensation using ASHRAE Comfort Database II. Energy Build. 2020, 210, 109776. [Google Scholar] [CrossRef]
  12. Brimicombe, C.; Di Napoli, C.; Quintino, T.; Pappenberger, F.; Cornforth, R.; Cloke, H.L. Thermofeel: A python thermal comfort indices library. SoftwareX 2022, 18, 101005. [Google Scholar] [CrossRef]
  13. Tartarini, F.; Schiavon, S. pythermalcomfort: A Python package for thermal comfort research. SoftwareX 2020, 12, 100578. [Google Scholar] [CrossRef]
  14. Gomes, P.; Margaritoff, P.; Silva, H. pyHRV: Development and evaluation of an open-source python toolbox for heart rate variability (HRV). In Proceedings of the 6th International Conference on Electrical, Electronic and Computing Engineering, IcETRAN 2019, Silver Lake, Serbia, 3–6 June 2019; pp. 822–828. [Google Scholar]
  15. Zhao, Y.; Genovese, P.V.; Li, Z. Intelligent Thermal Comfort Controlling System for Buildings Based on IoT and AI. Futur. Internet 2020, 12, 30. [Google Scholar] [CrossRef] [Green Version]
  16. Mihara, K.; Chen, S.; Hasama, T.; Tan, C.L.; Lee, J.K.W.; Wong, N.H. Environmental satisfaction, mood and cognitive performance in semi-outdoor space in the tropics. Build. Environ. 2022, 216, 109051. [Google Scholar] [CrossRef]
  17. Scarpina, F.; Tagini, S. The Stroop Color and Word Test. Front. Psychol. 2017, 8, 557. [Google Scholar] [CrossRef] [PubMed] [Green Version]
  18. Jonides, J.; Lewis, R.L.; Nee, D.E.; Lustig, C.A.; Berman, M.G.; Moore, K.S. The Mind and Brain of Short-Term Memory. Annu. Rev. Psychol. 2008, 59, 193–224. [Google Scholar] [CrossRef] [Green Version]
  19. Keith, N.; Ericsson, K.A. A deliberate practice account of typing proficiency in everyday typists. J. Exp. Psychol. Appl. 2007, 13, 135–145. [Google Scholar] [CrossRef] [Green Version]
  20. Sanchez, J.A.; Ikaga, T.; Sanchez, S.V. Quantitative improvement in workplace performance through biophilic design: A pilot experiment case study. Energy Build. 2018, 177, 316–328. [Google Scholar] [CrossRef]
  21. Belabes, B.; Paraschivoiu, M. Numerical study of the effect of turbulence intensity on VAWT performance. Energy 2021, 233, 121139. [Google Scholar] [CrossRef]
  22. Thorsson, S.; Lindberg, F.; Eliasson, I.; Holmer, B. Different methods for estimating the mean radiant temperature in an outdoor urban setting. Int. J. Climatol. 2007, 27, 1983–1993. [Google Scholar] [CrossRef]
  23. Tartarini, F.; Schiavon, S.; Cheung, T.; Hoyt, T. CBE Thermal Comfort Tool: Online tool for thermal comfort calculations and visualizations. Softwarex 2020, 12, 100563. [Google Scholar] [CrossRef]
  24. ASHRAE. ANSI/ASHRAE Standard 55-2017: Thermal Environmental Conditions for Human Occupancy; American Society of Heating, Refrigerating and Air-Conditioning Engineers: Atlanta, GA, USA, 2017. [Google Scholar]
  25. Ramanathan, N.L. A new weighting system for mean surface temperature of the human body. J. Appl. Physiol. 1964, 19, 531–533. [Google Scholar] [CrossRef] [PubMed] [Green Version]
  26. Shaffer, F.; Ginsberg, J.P. An Overview of Heart Rate Variability Metrics and Norms. Front. Public Health 2017, 5, 258. [Google Scholar] [CrossRef] [Green Version]
  27. Scikit-Learn. sklearn.neighbors.LocalOutlierFactor. 2022. Available online: https://scikit-learn.org/stable/modules/generated/sklearn.neighbors.LocalOutlierFactor.html#sklearn-neighbors-localoutlierfactor (accessed on 1 June 2022).
  28. Ji, W.; Zhu, Y.; Du, H.; Cao, B.; Lian, Z.; Geng, Y.; Liu, S.; Xiong, J.; Yang, C. Interpretation of standard effective temperature (SET) and explorations on its modification and development. Build. Environ. 2022, 210, 108714. [Google Scholar] [CrossRef]
Figure 1. Experimental procedure [16].
Sustainability 15 00183 g001
Figure 2. Semi-outdoor space.
Sustainability 15 00183 g002
Figure 3. Types and interrelationships of measuring parameters.
Sustainability 15 00183 g003
Figure 4. Data flow diagram.
Sustainability 15 00183 g004
Figure 5. Structure of data collection and storage.
Sustainability 15 00183 g005
Figure 6. Raw data and processed data.
Sustainability 15 00183 g006
Figure 7. GUI of digit Span Test: (a) displaying digit; (b) asking for answer; (c) submit answer and return checking result.
Sustainability 15 00183 g007
Figure 8. GUI of Stroop Word and Color Test.
Sustainability 15 00183 g008
Figure 9. The data frame structures.
Sustainability 15 00183 g009
Figure 10. Example of scatter plot for cognitive scores and SET in the warm period.
Sustainability 15 00183 g010
Figure 11. The mean value of physiological parameters: (a) SCM; (b) STM; (c) HRM; (d) RMSSD; (e) pNN50; (f) FFT; (g) AR.
Sustainability 15 00183 g011aSustainability 15 00183 g011b
Table 1. Experimental cases.
CaseSpace Cooling during
Cognitive Tests
Total Occupation Time
IndoorSemi-Outdoor
1AC50 minN/A
2NV30 min40 min
3MV330 min40 min
4MV630 min40 min
Table 2. Sampling interval and data format of environmental and physiological parameters.
ParameterSampling IntervalData Format
Dry bulb air temperature5 mincsv
Relative humidity (RH)5 mincsv
Globe temperature5 mincsv
A-weighted sound pressure level1 minxls
Illuminance5 mintxt
Omni-directional air speed1 scsv
3D air speed and air direction20 Hztxt
Skin temperature10 scsv
Skin conductance5 Hzcsv
Heart rate1000 Hztxt
Facial skin temperatureSpecific timestampjpg
Table 3. Input table of questionnaire timestamps.
IDCaseOrderTimestamp in SecondsTimestamp in 1 minTimestamp in 5 min
N001C10th2021-06-22 14:13:092021-06-22 14:13:002021-06-22 14:15:00
N001C110th2021-06-22 14:20:592021-06-22 14:20:002021-06-22 14:20:00
N001C120th2021-06-22 14:30:162021-06-22 14:30:002021-06-22 14:30:00
N001C130th2021-06-22 14:38:092021-06-22 14:38:002021-06-22 14:40:00
N001C131st2021-06-22 14:41:382021-06-22 14:41:002021-06-22 14:40:00
N001C132nd2021-06-22 14:42:212021-06-22 14:42:002021-06-22 14:40:00
N001C135th2021-06-22 14:45:112021-06-22 14:45:002021-06-22 14:45:00
N001C140th2021-06-22 14:50:442021-06-22 14:50:002021-06-22 14:50:00
N001C155th2021-06-22 15:07:352021-06-22 15:07:002021-06-22 15:05:00
N001C170th2021-06-22 15:22:572021-06-22 15:22:002021-06-22 15:20:00
Table 4. Input table of cognitive test timestamps.
IDCaseStart TimestampEnd TimestampCognitive Test
N001C12021-06-22 14:52:392021-06-22 14:54:20Digit span
N001C12021-06-22 14:56:002021-06-22 15:08:00Mind map
N001C12021-06-22 14:46:002021-06-22 14:56:00Typing
N001C12021-06-22 14:51:002021-06-22 14:51:46Stroop
Table 5. Input table of physiological measurement using example of skin temperature.
Table IDLocationSerial Number
ID1Left upper chest1B-2BC41
ID1Left upper armCA-40141
ID1Right thighB1-26E41
ID1Right lower leg3F-4E541
ID2Left upper chest2F-56441
ID2Left upper armA2-60441
ID2Right thigh33-59641
ID2Right lower leg0F-31B41
ID3Left upper chest49-26541
ID3Left upper arm2F-75641
ID3Right thigh59-1D641
ID3Right lower legDA-3D641
ID4Left upper chest08-6D641
ID4Left upper arm03-43E41
ID4Right thigh30-24F41
ID4Right lower leg5E-24D41
Table 6. Input table of date, table ID and participant ID.
DateTable IDParticipant ID
2021-06-22ID1N032
2021-06-22ID2N478
2021-06-22ID3N001
2021-06-22ID4N896
2021-06-23ID1N664
2021-06-23ID2N687
2021-06-23ID3N213
2021-06-23ID4N978
2021-06-24ID1N032
2021-06-24ID2N478
2021-06-24ID3N001
2021-06-24ID4N896
Table 7. Example of Pearson correlation between cognitive scores and SET in the warm period.
Cognitive TestCaseSET MeanSET stdScore MeanScore stdCorrelationp Value
DTNV27.320.767.471.32−0.110.51
DTMV327.110.577.671.010.210.17
DTMV626.920.867.691.26−0.120.44
DTAC24.490.237.531.34−0.120.48
MTNV27.310.8946.3721.060.170.28
MTMV327.010.5448.0020.670.150.33
MTMV626.681.0051.3421.49−0.200.22
MTAC24.560.1248.5723.050.020.92
TTNV27.390.8052.0318.01−0.320.04 *
TTMV326.930.5253.8316.000.260.09
TTMV626.730.8853.4217.590.110.47
TTAC24.520.1654.1116.03−0.160.35
STNV27.220.773.543.340.300.06
STMV326.930.672.653.320.050.75
STMV626.700.674.103.770.260.09
STAC24.490.103.113.840.150.38
Notes: * p-Value < 0.05.
Table 8. Statistical interference between physiological factors and cognitive performance score in the cool period.
DTSTMTTT
β p-Value β p-Value β p-Value β p-Value
Intercept10.130.40−7.020.8711.050.9729.840.88
SCM−0.040.650.590.03 *−2.730.071.410.19
STM0.110.44−0.190.68−2.120.450.580.76
HRM0.000.780.040.39−0.130.590.380.05 *
RMSSD−0.050.04 *0.090.15−0.100.790.590.06
pNN500.060.03 *−0.080.270.340.48−0.110.73
FFT0.020.640.040.76−0.340.691.540.03 *
AR−9.240.6620.890.78211.940.67−96.490.80
R20.07 0.11 0.08 0.21
Notes: * p-Value < 0.05.
Table 9. Statistical interference between physiological factors and cognitive performance score in the warm period.
DTSTMTTT
β p-Value β p-Value β p-Value β p-Value
Intercept−13.400.26−41.790.29133.070.32327.160.01 *
SCM0.000.980.070.74−2.700.03 *−0.400.69
STM0.050.800.200.67−2.470.38−6.320.01 *
HRM0.010.62−0.090.01 *0.490.02 *0.470.01 *
RMSSD−0.010.67−0.080.211.280.00 **0.470.24
pNN500.040.200.110.13−1.300.01 *−0.020.95
FFT−0.080.08−0.080.360.730.653.510.02 *
AR35.030.0888.770.18−111.560.57−216.580.24
R20.07 0.09 0.13 0.17
Notes: * p-Value < 0.05, ** p-Value < 0.01.
Disclaimer/Publisher’s Note: The statements, opinions and data contained in all publications are solely those of the individual author(s) and contributor(s) and not of MDPI and/or the editor(s). MDPI and/or the editor(s) disclaim responsibility for any injury to people or property resulting from any ideas, methods, instructions or products referred to in the content.

