Article

Effect of Seismic Isolation on the Performance of High-Rise Buildings with Torsional Instability

1
Department of Civil Engineering, Technische Universität Darmstadt, 64289 Darmstadt, Germany
2
Department of Civil Engineering, Dicle University, Diyarbakir 21280, Turkey
*
Author to whom correspondence should be addressed.
Sustainability 2023, 15(1), 36; https://doi.org/10.3390/su15010036
Submission received: 26 October 2022 / Revised: 6 December 2022 / Accepted: 9 December 2022 / Published: 20 December 2022

Abstract

:
Seismic bearings have been used to mitigate the harmful effect of the earthquakes. Torsion mode, one of the most important irregularities, generally increases the shear forces to the vertical members such as columns and shear walls in turn this may results in brittle failure of the reinforced concrete (RC) members. Accordingly, it is vital to eliminate the torsion failure mode or switch to the higher modes with lower mass contribution. This study has evaluated the seismic performance of a high-rise building with torsion mode through push-over analysis including nonlinear time history analyses. The damage conditions of RC structural members are defined considering the Eurocode definitions and general performance assessments of the building have been evaluated accordingly. Lead rubber bearings have been used for base isolation system. By using enough number of rubber bearings, the dominant torsion mode (first free vibration mode) has been shifted to higher modes. Various earthquake records have been used in non-linear dynamic analysis to evaluate the positive effects of the bearings. The results revealed that proper arrangement of rubber bearings in structural plan of ground floor can effectively improve dynamic behavior of a high rise building with torsional instability to achieve better seismic performance.

1. Introduction

Many either newly designed or existing buildings may suffer from the harmful effect of dominant high torsion modes in case of an earthquake mainly due to the asymmetric placement of vertical structural members particularly reinforced concrete shear walls in the structural plan of the building. In most cases due to architectural limitations, it is not easy to arrange the places of the structural members where it challenges structural design engineers and eventually this challenge may end up with large distance between mass and rigidity centers. Luck of design experience of the structural designers may also result in building plans with torsional instability. Several earthquake investigations show that torsion has substantial negative effect on the performance of buildings with increasing forces to its members and may cause collapse of the building [1] particularly for those buildings with low material qualities and improper reinforcement details [2]. Figure 1 [3,4] shows two buildings having torsion dominated behavior and heavily damaged during earthquakes where one of the buildings is just brand new before even accommodation where it clearly shows the poor engineering design. There are plenty similar examples of building failures from past earthquakes that show the effects of torsion failure. This clearly shows that buildings with torsional irregularity are more vulnerable under seismic influences compared to the regular buildings.
For those kinds of irregular buildings, the inelastic response models are more appropriate to understand seismic behavior the structural system. Inelastic strains should be considered in nonlinear models which allows suitable force-deformation material model in nonlinear dynamic analysis. Many variables may have different effects on the performance of the buildings particularly the ones with irregularities such as torsion. Force-based method (FBD) and displacement-based method (DBD) have been commonly used to evaluate the performance of the structures. The DBD method may give more realistic prediction of damage levels where this method directly provides plastic hinge deformations for the target displacement. Through combining this method to the capacity design principles, nonductile formations can be avoided and more economical outcomes can be achieved [5,6].
On the other hand, there are some studies regarding the torsion effect but studies on limiting the effect of torsion are very limited particularly for real buildings including shear walls. Athanatopoulou [7] investigated critical angle of the earthquakes on a virtual asymmetric structural plan. Fontara [8] used asymetric simple storey bulding for investigattion and it was found that seismic incident angle, ground-motion reference axes and seismic intensity level have important effects on the structural responses. Askouni [9] investigated the effect of soil-structure interaction on the behavior of symmetric and asymmetric RC framed buildings. Seo and Hun [10] used lead-rubber bearing (LRB) isolation systems with super elastic shape memory alloy (SMA) bending bars functioning as damper and self-centering devices. The research concluded that SMA bending bars provide more flexiblity and recentering force to the superstructure. Study by Buzuk [11] where 11 earthquake records were implemented in performance analysis of 24 story RC building shows that using Turkish Building Earthquake code (TBEC) [12] and Eurocode [13] produces parallel outcomes. Rahul [14] investigated effect of the height of the building on the torsional behavior of base isolation considering a small asymmetric plan, and it was observed that friction pendulum system has effectively decreased the torsional rotation when compared to lead rubber bearing. It has also been observed that base isolation is less effective in case of near fault earthquakes and generally they concluded that base isolation will decrease the torsional amplification but still may lead to torques that cannot be ignored. In base-isolated structures, although the superstructure responses are reduced considerably by addition of the isolation devices to the structural system, torsional amplification may be important depending on the device and superstructure eccentricity as well as the lateral and torsional flexibility [15].
There are some studies on eliminating the negative effects of irregularities including torsion are available. Adibramezani et al. [16] investigated torsional behavior of sample buildings having L shape plans. This study concluded that torsional moments can be decreased even in case with the large structural eccentricities and this reduction is more for lower story buildings. Naderpour et al. [17] investigated effect of hybrid control by combining base isolation and tuned mass dampers on the behavior of low and high-rise buildings. The results showed that influence of base isolation is much larger comparing to the influence of non-traditional tuned mass dampers. Shiravand and Ketabdari [18] observed that friction pendulum system balances the applied forces with mass of the building and prevent the occurrence of the torsion. As can be seen studies on mitigations of buildings with torsional irregularity are limited and mostly together use of lead rubber bearing, and friction pendulum system cases has been investigated. On the other hand, all the studies on the topic have used virtual sample plans which is far from representing real structural plans of existing high-rise buildings and some of the do not consider shear walls. It should be note that most of the design regulations requires a minimum certain amount of shear walls particularly for high-rise buildings. According to the best knowledge of the authors there is not any available studies in the literature that considered a real structure with shear walls and having torsional irregularity particularly high-rise structures with RC shear walls.
This work mainly focusses on eliminating or decreasing the negative effect of torsion mode by using seismic isolation techniques. To alleviate the effect of torsion, the use of rubber bearing has been investigated through displacement-based performance analyses. This study is based on analysis of a constructed high-rise building with torsional issues which are caused by improper arrangements of RC shear walls during the design process. Buildings with and without having rubber bearings have been considered. User-defined plastic hinge model (see Section 3.2) has been used and response quantities are defined by strains and rotations. Performance analyses are performed by nonlinear static pushover procedure and time history analyses. The analysis mainly focusses on eliminating or decreasing the negative effect of torsion mode by using seismic isolation techniques.

2. The Model Building System

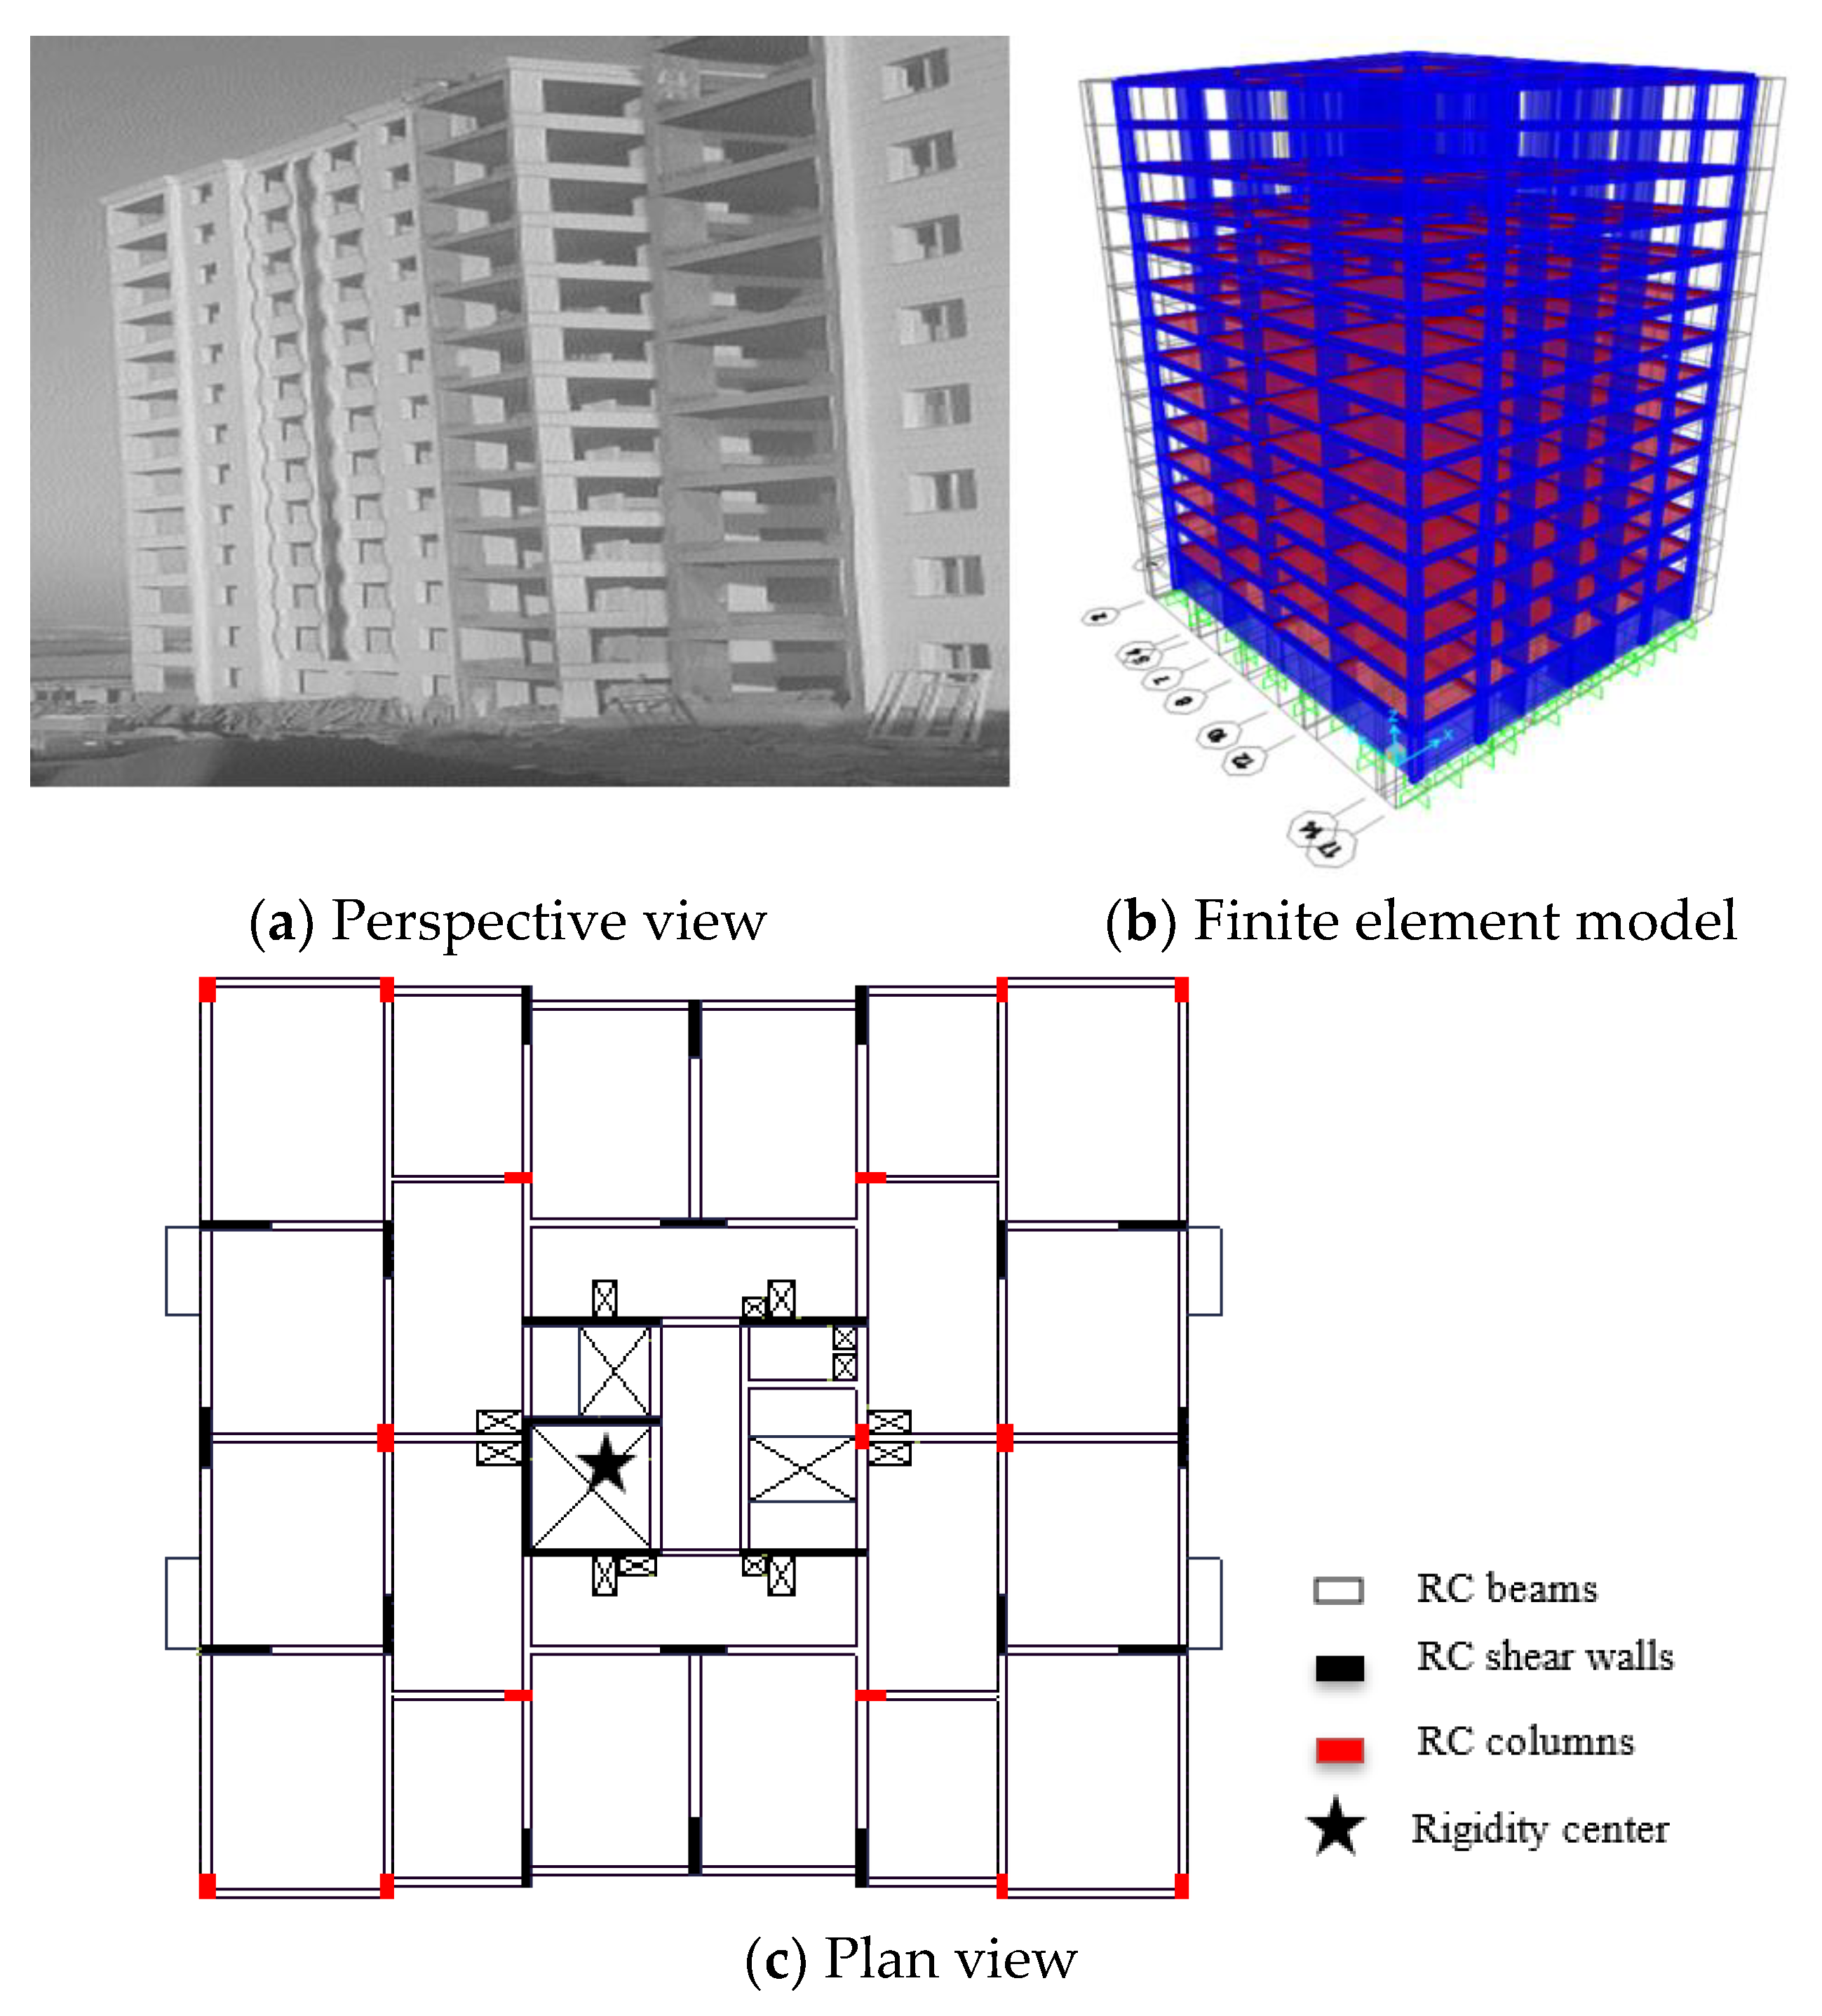
An RC building with shear walls was designed asymmetrically which led to long distance between mass and rigidity centers has been analyzed to investigate its seismic performance under the effects of strong ground motions. The building has 14 stories including basement and one-story penthouse as seen in Figure 2. The slabs are flat with RC beams and the building is 49 m in height. The RC structural system is a frame system of columns and shear walls (Figure 2c). This building was constructed with a torsional irregularity due to pure engineering design. The building has 15 columns, 6 long shear walls and 18 short shear walls. The five of the long shear walls (>3 m) were placed in x-direction. To balance allocation of the shear walls in both directions, 12 short shear walls (<2 m) were placed in y direction, the rest were in x direction. The total length of the shear walls is 37 m in x and 30 m y direction. On the other hand, if the inertia moment is considered, the building is far from having equivalent rigidity in both directions. Therefore, this design approach has caused serious structural issues like torsional problem. Asymmetric rigidity of the shear wall system has deteriorated the torsional stability and furthermore shear walls were generally concentrated in the plan center of the building. Although the sectional areas of shear walls are almost the same in both directions (6.94 m2 area in x direction, 6.34 m2 area in y direction), the total inertia moments of shear walls are Iy = 4.96 m4 and Ix = 2.96 m4, where x and y are global axes. However, the shear walls should have been positioned in the outer of the building to prevent the torsional issues. This building was constructed in 2018 and many existing structures may have the same torsional instability problem.
The building is discretized as given in Figure 2b to construct finite element model which is required in the analyses. Mesh areas are generated in three dimensions (3D) by using various mesh sizes. The mesh intervals have been assigned related with the size of the member in lateral and vertical direction. Material properties are taken from the structural project, the characteristic strength of concrete, fc, is 25 MPa and the modulus of elasticity, Ec is 31 GPa. Steel bar parameters yield strength fy is 420 MPa and steel modulus of elasticity Es is 210 GPa. Furthermore, it is located in a high seismic zone of Turkey (city of Diyarbakir) and corresponding seismic design acceleration is 0.27 g. In order to determine the soil properties on which the structure was built, boreholes with a length of 20 m were drilled at four points, undisturbed samples were taken at different depths from each borehole, and index, classification, shear strength and consolidation tests were performed on the samples taken. In addition, a geophysical study was carried out by making seismic measurements at a depth of 30 m along two lines. The structure was built on a gravelly clay soil and there is no groundwater available. From the laboratory test results performed on the samples taken from the soil, the bearing capacity value of the soil was determined as 294.2 kN/m2 and the bearing coefficient of was 35,610 kN/m3. More details can be found in the reference [19].
In earthquake resistance designs, base isolation system has been commonly considered to restrict the inelastic damage. In addition, an isolation system enables lower cost solutions by shifting natural periods of the structural system and limiting the relative deformations and base forces.
In this manner, natural vibration periods can be kept in outside range of the dominant soil periods provoked by earthquake motions. Thus, resonance effects would be prevented by considering more flexible bearings. A proper isolation system provides more structural performance and lower seismic demand [6]. For this purpose, lead-rubber bearings (LRB) are added as an alternative solution to improve seismic performance and devices are placed between both ends of the column and shear-walls at the ground floor. The bearing system consisted of cover plates and rubber layers having steel shims where the configuration of the bearing device is given in Figure 3. The bearing properties such as bearing height (Hb) are presented in Table 1. Tr is the total rubber thickness, S is the shape factor (the ratio of loaded area divided by force-free area). High shape factor values provide stiffer bearings, and the bearing stiffness has been considered through the following relations [20]:
K d = G · A T r
K e f f = F m a x D m a x = K p + Q D m a x
K v = E c · A T r  
In Table 1, Kd, Keff and Kv are the post-yield, the effective and the vertical stiffness, respectively (Equations (1)–(3)). A is the rubber area and G is the shear modulus of rubber. Q is the characteristic strength and Dy is the yielding displacement. Fmax and Dmax are peak force and displacement in the isolation device, respectively. Rubber material can deform up to 400–500% and rubber bearings may be analyzed with the maximum shear-strain levels of 150% [21]. To limit the shear displacement of a bearing, the maximum displacement capacity (δs,) is defined [22,23],
δ s = S a 1 · T e f f · g / B M · 4 π 2
where, Teff is the effective period of the building, Sa1 is the design spectral response factor at T = 1 s, g is the gravity acceleration, BM is the damping coefficient (BM = 1.35 for 14.8% effective viscous damping). Using this approach, the design displacement of the bearing is 0.428 m including torsional effects. Another restriction for maximum bearing displacement is also presented by 0.7 times of maximum shear strain value [24]. Additionally, a different shear displacement (δs) restriction is Tr ≥ 2 × δs [25]. Bilinear behavior model is adopted for LRB devices in the inelastic analyses. As it is known, the seismic bearings seriously increase the free vibration periods of a structural system. While the fundamental period (T1) is 2.94 s for non-isolated building, this value has increased to T1 = 3.89 s for the isolated building. The vibration periods are comparatively presented in Table 2. Furthermore, the effect of rubber bearings is showed on an acceleration spectrum as seen in Figure 4. With increasing period values, lower spectral coefficients have appeared for the isolated building.

3. Performance Based Analysis

The structural design of buildings should compile with structural stability and integrity without total collapse even after a strong earthquake beside the life safety of people should be ensured. The traditional FBD procedure is known as strength-based method, and it considers the equal displacement principle with a force-reduction factor (R) or a ductility factor (µ). However, earthquake waves (time-varying and broad-banded) propagate in complex form and hence the FBD method may not precisely estimate the real performance levels and the inelastic response displacements during an earthquake. Disadvantages of FBD method led researchers to focus on the displacement-based method. On the other hand, the DBD method is based on inelastic material behavior and this method allows to obtain more economic and precise outcomes. The DBD method initially was introduced by Kowalsky and Priestly [26,27]. Afterwards, some reports were released of “Vision 2000: Performance based seismic engineering of buildings” (1995) [28]. The codes of “Seismic Evaluation and Retrofit of Concrete Buildings” [29] and “Prestandard and Commentary for the Seismic Rehabilitation of Buildings” [23] have been widely used as guidelines in performance assessments. While a structural damage is related to the strain capacity, plastic hinges provide valuable information of the damage mechanism. Performance based assessment targets for a performance objective (damage level based on a limit state) related with an earthquake hazard. This procedure predicts the displacement/rotation demand and calculates the structural member capacities. Namely, this effective method creates a relationship between forces and damages. Finally, the assigned performance criteria are assessed with reference to capacity values of the structural components.

3.1. Moment-Curvature Relationship

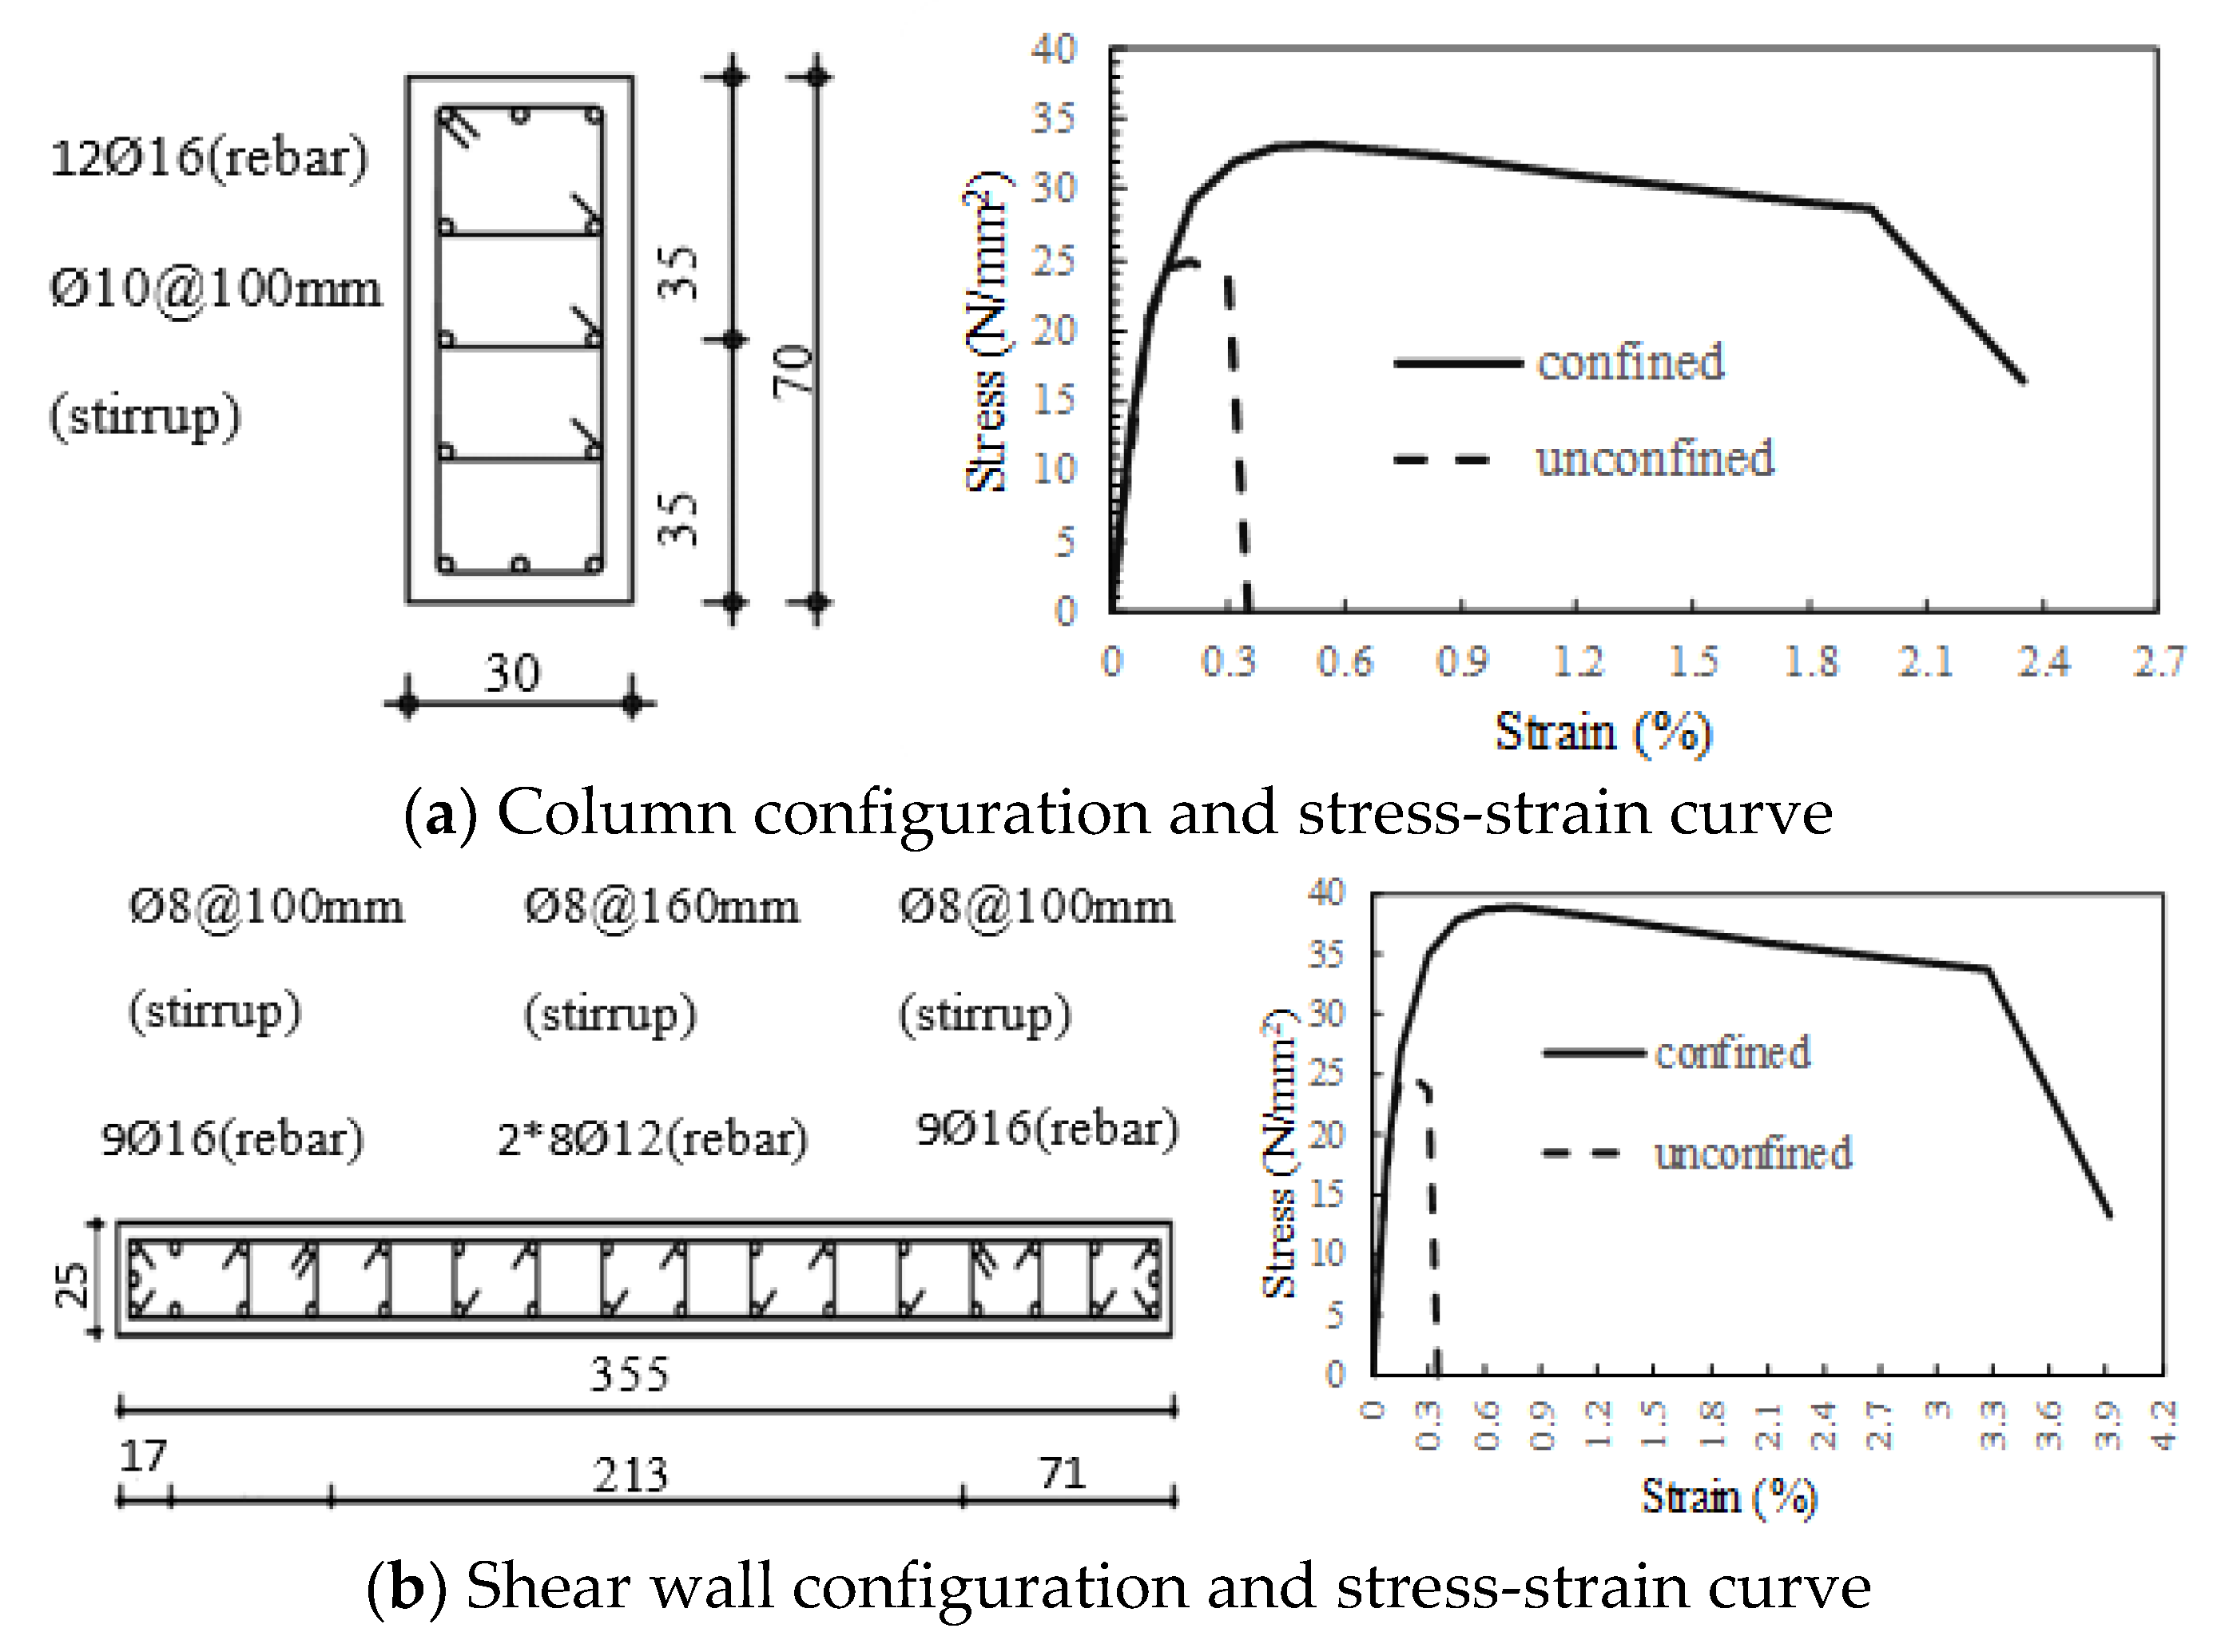
All reinforced concrete columns and shear walls have different sizes where their heights are equal to 3 m. The Mander’s model [30] has been used to calculate mechanical properties of confined concrete. The stress-strain curves of a sample column and shear wall sections are given for confined and unconfined concrete in Figure 5. The flexural and shear reinforcements are shown in Figure 6 for a center column. The ultimate failure (spalling) strain for the concrete cover, εcs, is considered as 0.0035 and the ultimate strain capacity of steel, εsu, is defined as 0.08 with yielding strain (εsy) of 0.0021. The strain hardening value, εsh, is considered by 0.011. According to the analysis, it is worth nothing to declare that crushing strain limit of the concrete is impotent in the structural response of the members. In RC members, the steel confinement enables high restriction in lateral deformations, and it provides a significant increase in ductility [31]. Thus, the ultimate strains, plastic rotations and core concrete strength capacities have been increased. Lateral confinement effect both in terms of ductility and strength provided by stirrups has been shown in Figure 5a,b.
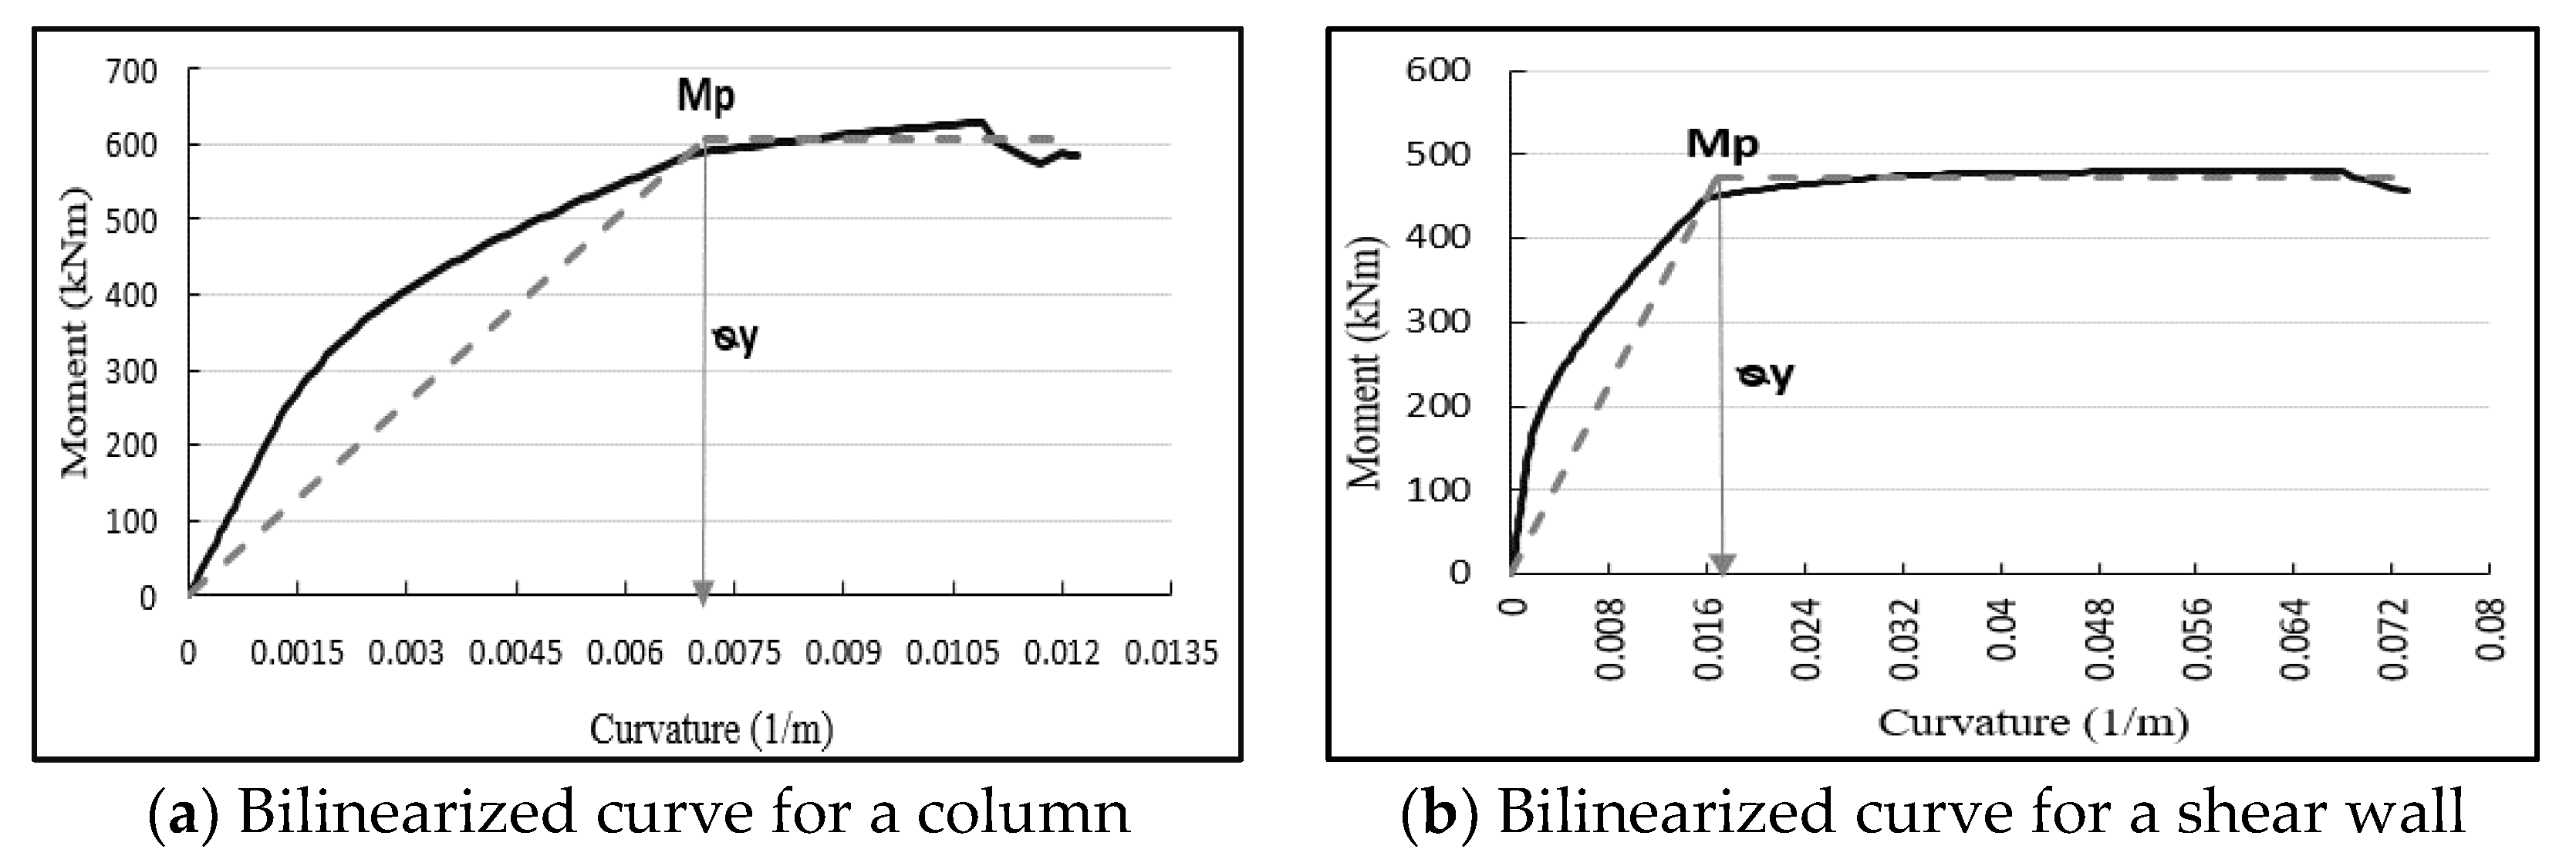
Deformation capacity of columns and shear walls (critical sections) is an important benchmark in performance assessments. Furthermore, moment-curvature (M-Ø) analysis is realized, and force-displacements curves are defined by rotations and deformations. Axial forces have important effect on the behavior of RC sections and as known high forces cause to decrease section-ductility. In the analyses, gravity loads have been used to determined axial forces and they are assumed to be constant during the earthquake. The moment-curvatures are presented together with idealized form for a sample column and shear wall in Figure 6. Ultimate and yielding strains, rotations (Øy, Øu) and displacements (Δy, Δu) are calculated by considering elastic and plastic deformations. Member ductility (μΔ, μØ) of the considered column and the shear wall is given in Table 3 in terms of displacement and rotation, respectively.

3.2. Nonlinear Static Analysis

The nonlinear static analysis plays an important role in the safety evaluation of RC structures to ensure the seismic capacity of an existing building. In this study pushover analysis technique has been used for predicting inelastic displacements of the structural members. Valuable response information and damage levels of structural members have been derived.
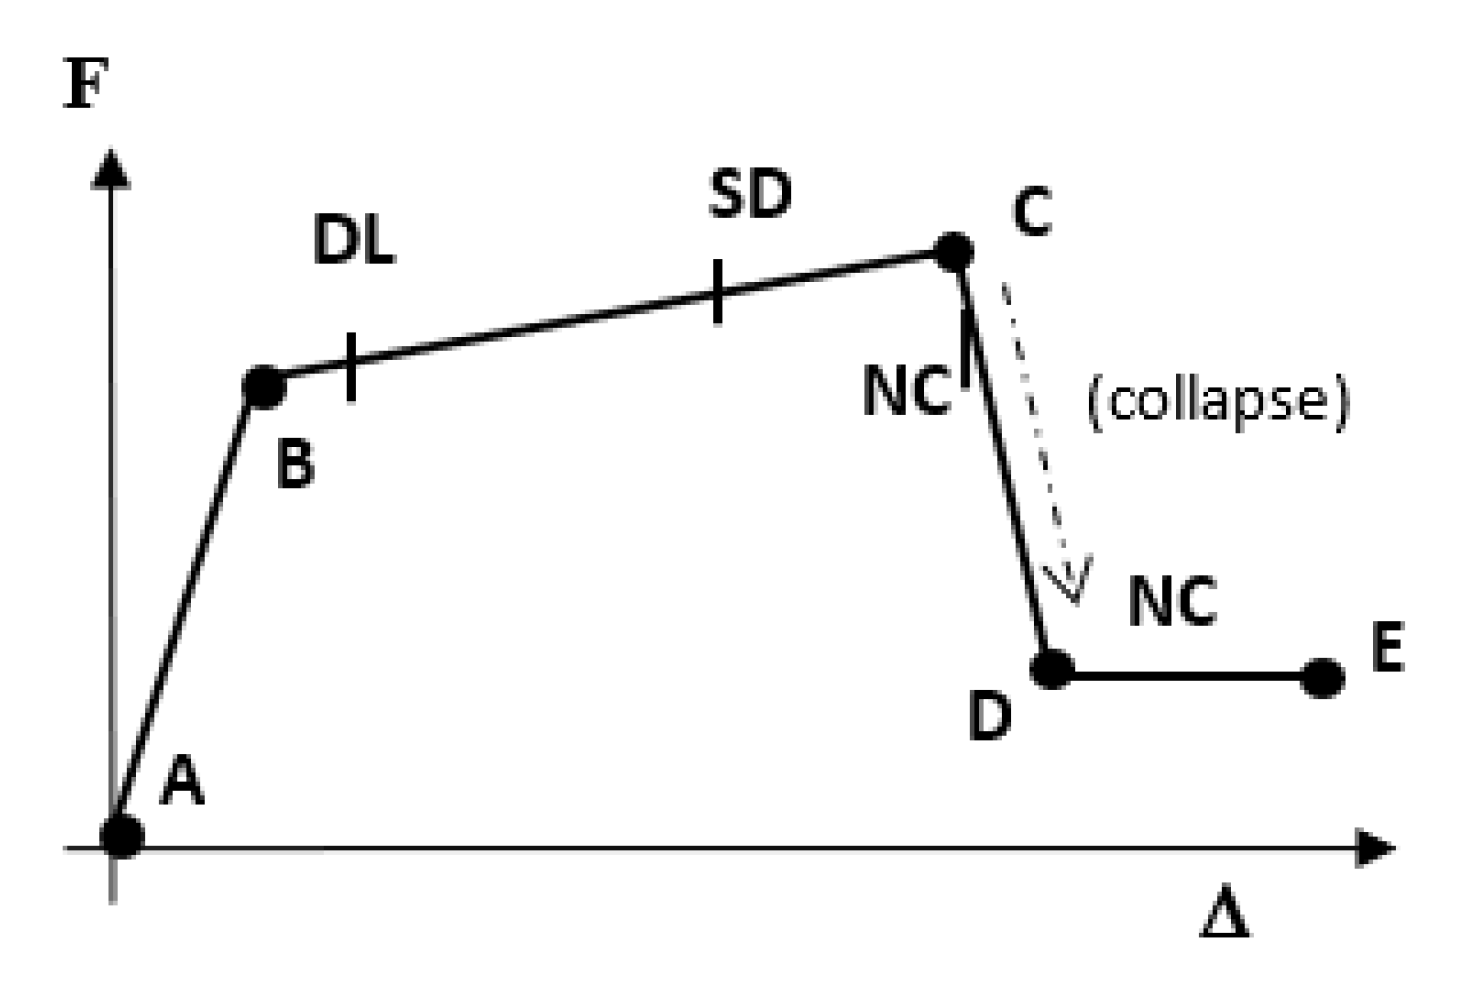
Nonlinear static method (pushover) is an approximate procedure, and it uses iterative calculations and estimations to capture real inelastic behavior. The performance assessments related with pushover analysis are implemented by the capacity spectrum procedure [29], the displacement coefficient procedure [22] and the equivalent linearization technique [32]. Additionally, there are improved procedures known as modal pushover analysis was introduced to overcome deficiencies [33]. Furthermore, research by Aydinoglu 2003 [34] has been presented to improve the accuracy of the results by using incremental modal analysis. Although standard plastic hinge models are defined by many codes ([13,23,32]), a user-defined plastic hinge model (P-M2-M3) is used in the analyses as given in Figure 7. The hinge parameters are determined on the basis of sectional analysis and these values are given in idealized form in Table 4. A software package [35] is used for obtaining the performance of the building system. Three performance limits have been assigned for structural members: damage limitation (DL), significant damage (SD) and near collapse (NC).
Performance criteria are assigned according to plastic rotations in the structural elements. While the performance criteria are calculated for all members, and they are showed only for a shear wall and a column in Table 4. As seen from the Table 4, performance levels are assigned between yielding case (point B) and final section capacity (point E). In the failure zone (from point C to point D), moment capacity has decreased about 80% amount.

3.3. Plastic Hinge Zone and Length

There are two equations for calculating the length of the plastic hinge depending on the method used to obtain the ultimate curvature [13]. The plastic hinge length (Lp) is,
L p = L V 30 + 0.2 h + 0.11   d b L   f y f c
where Lv is the shear span (the point of contra-flexure), h is the section-height and dbL is the of tension bar. The chord rotation at yielding θy is for beam and column [13],
θ y = Ø y L v + α v z 3 + 0.0014 ( 1 + 1.5   h L v ) + ε y d d d b L   f y 6 f c
where αvz is the tension shift of the bending moment and z is the effective sectional depth. The h, d and d′ are sectional height, useful height and concrete cover. If shear cracking firstly expected then αv = 1, otherwise αv = 0. The yielding rotation for walls of rectangular, T, or barreled section [13]:
θ y = Ø y L v + α v z 3 + 0.0013 + ε y d d d b L   f y 6 f c
For beam and column, the ultimate total rotation capacity (θum) is [13],
θ u m = 1 γ e l   0.016 · ( 0.3 v )   max 0.01 ; ω max 0.01 ; ω   f c 0.225 · [ min ( 9 ;     L v h ) ] 0.35     25   α ρ s x   f y w f c 1.25 100 ρ d
where, γ e l = 1.5 for primary seismic elements and γ e l = 1 for secondary seismic elements, v is the ratio of axial forces (N) to axial strength. The parameters of ώ and ω are mechanical ratio of the compression and tension steel bars in longitudinal direction. fyw denotes the yield strength of the lateral confinements. ρsx is the steel ratio of confinement bars parallel to loading direction x and ρd is the steel ratio of the diagonal bars if applicable. α denotes the effective factor for the confinement. In case of walls, θ u m = 0.58 × θ u m beam,column. The part of plastic rotation,   θ u m p , is [13],
θ u m p = 1 γ e l   0.0145 · ( 0.25 v ) max 0.01 ; ω max 0.01 ; ω 0.3 f c 0.2 · [ min ( 9 ;   L v h ) ] 0.35   25   α ρ s x   f y w f c 1.275 100 p d
where γ e l = 1.8 for primary seismic elements and γ e l = 1 for secondary seismic elements. In case of walls,
θ u m p = 0.6   ×   θ u m beam , column
Performance limits used in the analysis are given in Table 5 for assessment of the building. These limits are directly related to the damage levels of the structural members.
The performance criteria are computed for the considered building, and they are presented in Table 6 for some structural members.
Elastic design spectrum is assigned by site-spectral coefficients suggested by earthquake hazard maps. Peak spectral value is found as PGA = 0.27 g (peak ground acceleration), from seismic maps [36] for the building site. Local soil property of the seismic zone is considered as ZD (predominantly soft-to-firm cohesive soil) (Vs30 = 180 m/s). Influence coefficients of local soil are Fs = 1.25 and F1 = 1.5. The building position to the active fault zone is more than 25 km and near-fault effects are neglected. Design spectrum is obtained on the basis of EC8-code [13] with 5% damping and the spectrum is given in Figure 8.
Structural damping increases with increasing inelastic displacements and this case reduces the earthquake forces. To show this influence, spectral reduction factors are applied over 5% damped elastic demand spectrum.
The spectral reduction factors (SFA, SFV) are obtained by following relations [23];
S F A = 3.21 0.68 l n β e f f / 2.12                               S F V = 2.31 0.41 l n β e f f / 1.65  
The value of effective damping, βeff, is 0.096 of critical damping and the reduction factors have been obtained as SFA = 0.789 and SFV = 0.838. For lateral capacity, the building system is pushed by applying gradually increasing forces in horizontal direction. Pushover curves of the building are obtained and comparatively presented with capacity curves in Figure 9 in terms of base isolation effect. Target response values are determined by considering Eurocode design earthquake. As known, pushover curves describe the relationship between base forces against roof displacements. Thus, those curves provide valuable information about structural performance. Thereby, the performance targets can be defined with the corresponding forces and displacements by courtesy of pushover curve. Performance point (P) corresponds the intersection of structural capacity and reduced demand spectrum.
For obtaining the required structural performance, capacity spectrum method is used, and a transformation is realized from force-displacement (V-d) to spectral acceleration-displacement (Sa–Sd). The capacity spectrum is comparatively shown with reduced demand function and the performance points (P) are seen in Figure 9b for isolated and fixed buildings. The nonlinear static analyses pointed that the performance levels are beyond the target displacement and thus the analyzed building has reasonable structural behavior. As a result, capacity of the building is enough to fulfill the earthquake displacement demand. The required performance values are Δp = 0.156 m and Vp = 5290 kN and these response values such as spectral accelerations (Sa) and displacements (Sd) are given in Table 7. Likewise, the non-isolated system is also analyzed, and the responses are seen comparatively in the Figure 10a and Table 7. While the building capacity distinctly increase in initial zone for fixed base system, the isolation system has reduced the spectral acceleration (from 0.076 to 0.062) and increased the damping (from 0.087 m to 0.096). Thus, the isolation system has enabled lower base forces (from 5934 kN to 5290 kN) and quake demand. Nonlinear deformations define the capable of plastic displacements and rotations. Despite the isolation system has caused to higher roof-displacements (from Δ = 0.477 m to Δ = 0.95 m), it has generally reduced the relative rotations and absolute accelerations.
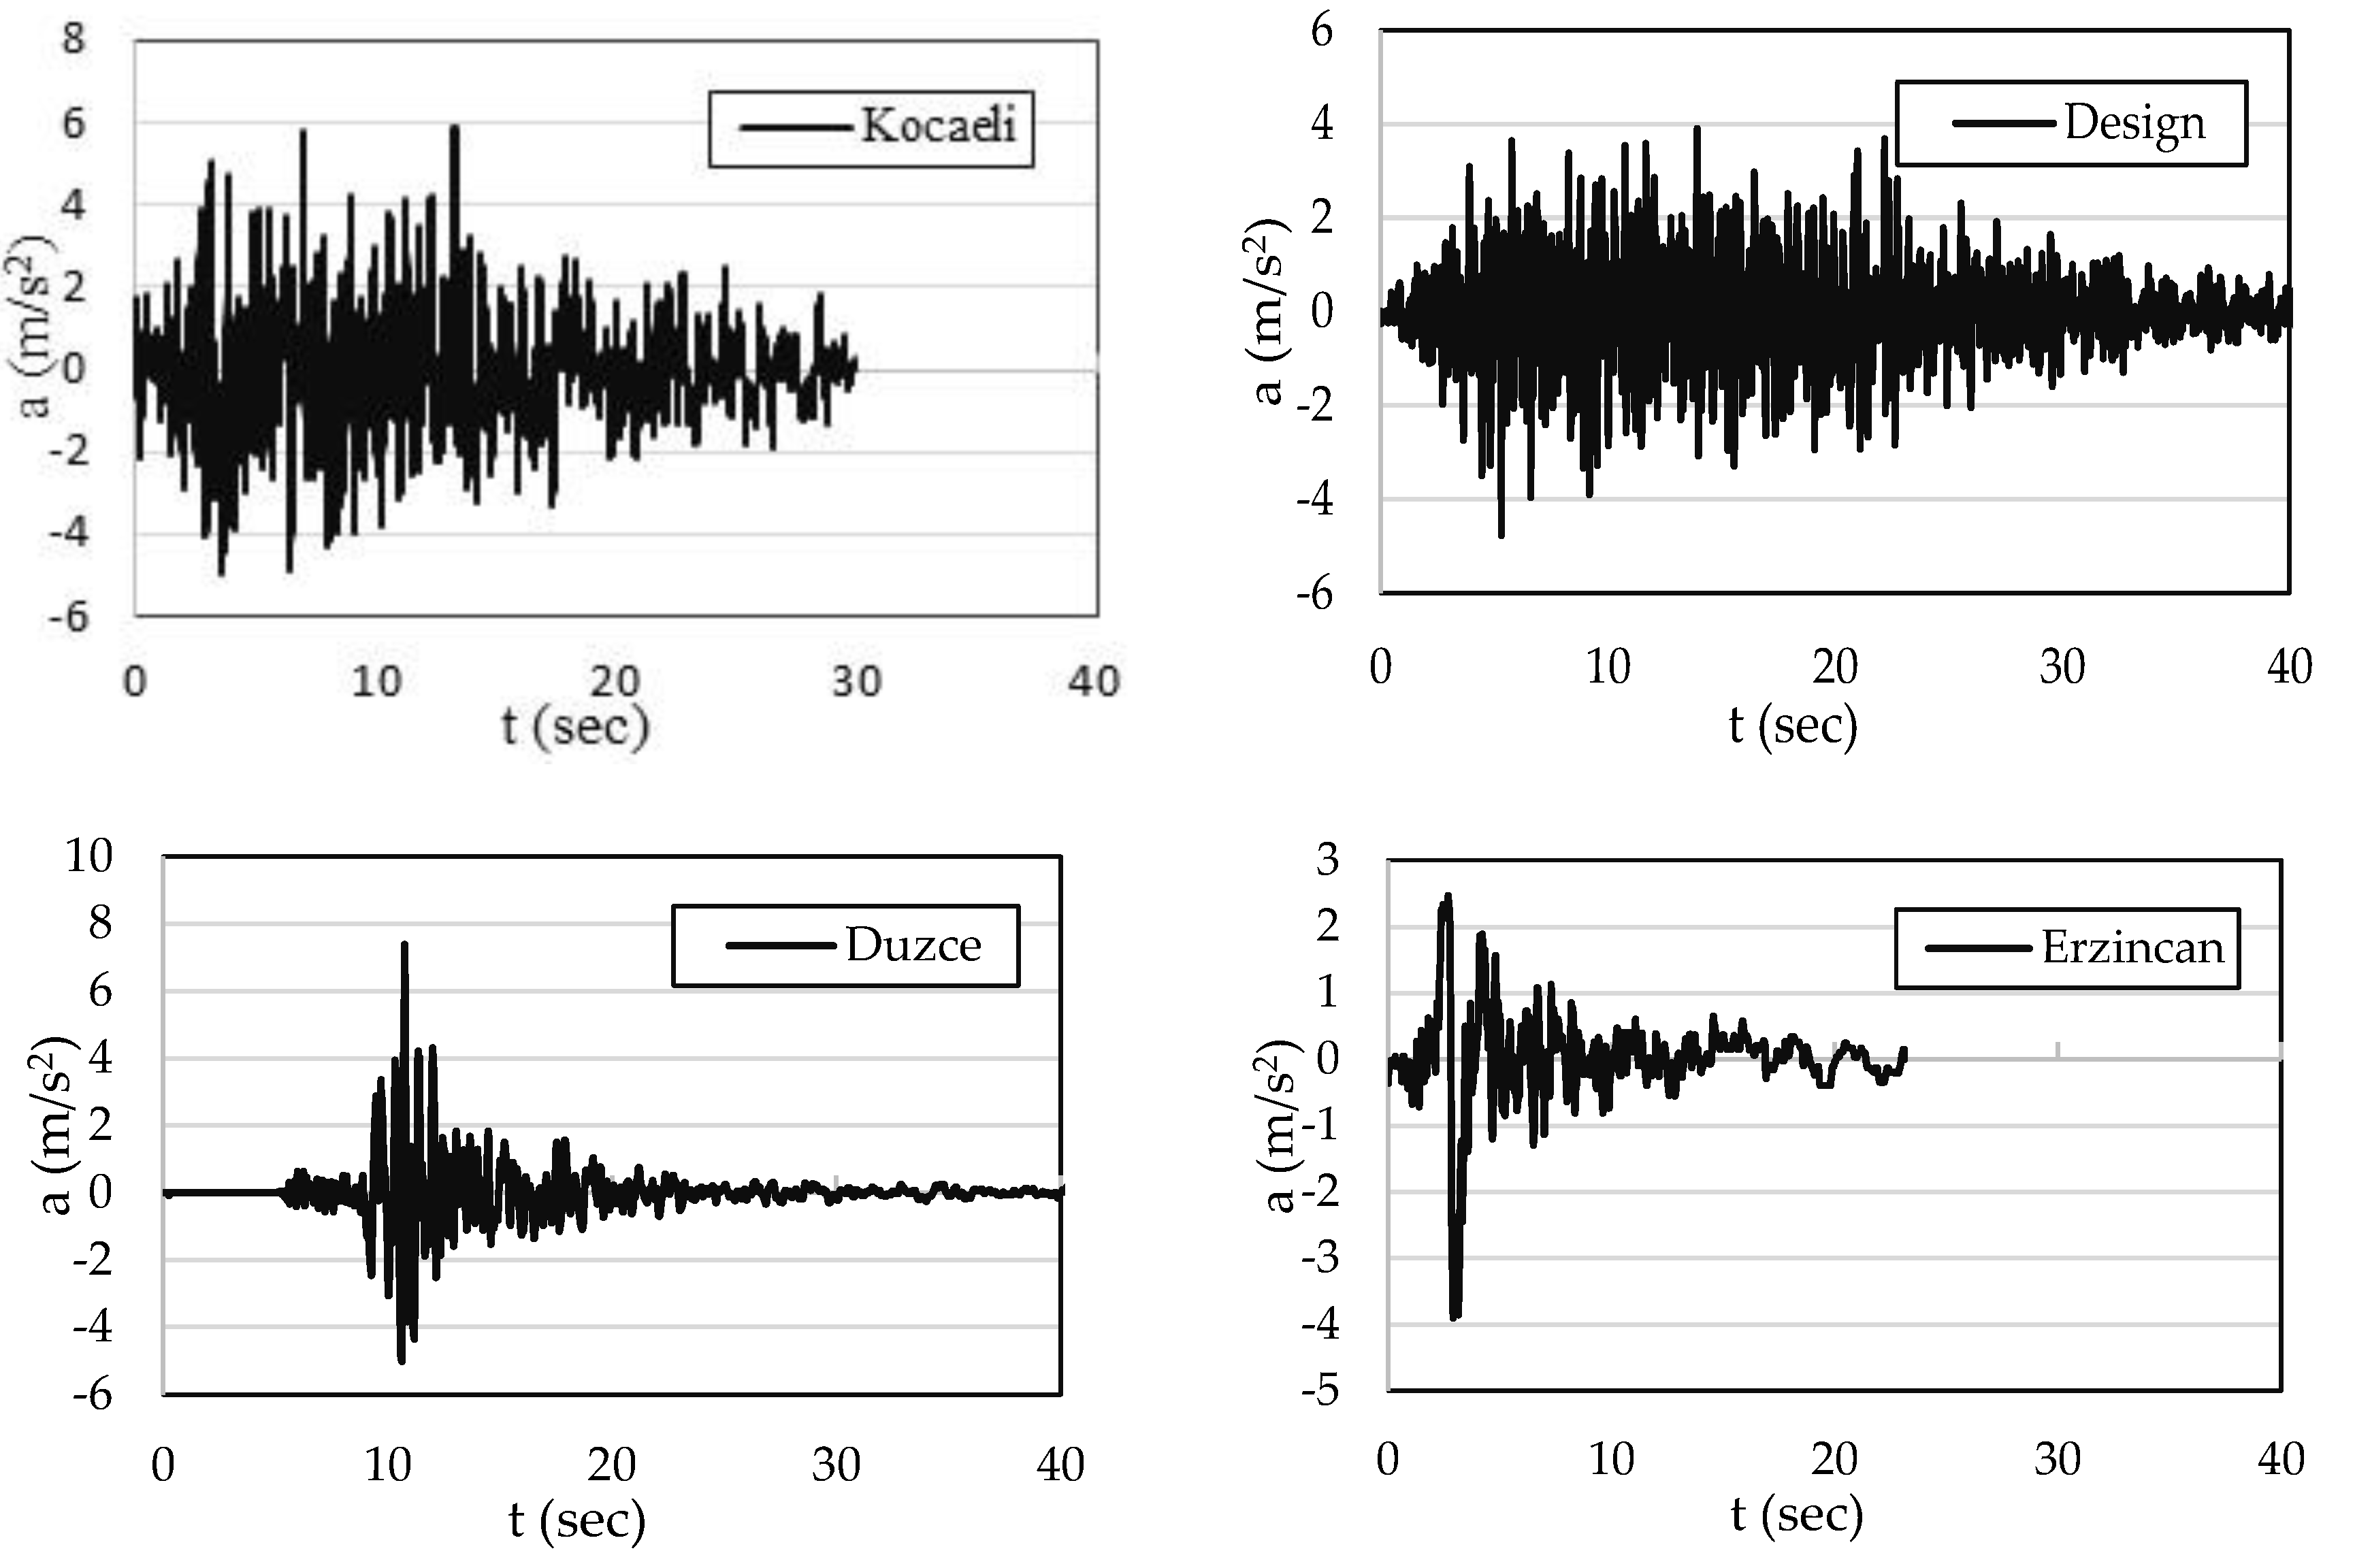
For the isolated building, horizontal displacement ductility is obtained as µΔ = 3.0 and for fixed system is µΔ = 2.20. For the design earthquake (EC8), building performance is in elastic zone for the target displacement levels. Generally, performance of a structure is related with earthquake demand and structural capacity. The performance levels of the studied building have been also determined for recorded ground motions and a design quake (EC8 code-based motion). The acceleration records of the mentioned quakes will be presented in the following section.

3.4. Time History Functions

For obtaining the time-dependent deformations and inelastic responses, time history solutions have been implemented under generated and recorded strong earthquakes of Düzce 1999 and Kocaeli 1999, Erzincan 1992 earthquakes [37]. Furthermore, another simulated record has been generated compatible with EC8 design spectrum. The generated accelerations are illustrated in Figure 10.

4. Building Performance Assessment

Seismic performance level of a building is defined by the damage levels in the structural members. In performance-based design processes, this concept requires to pre-assign a performance level for building performance. Afterwards, structural damage are determined for the considered earthquakes and plastic damage should be in acceptable limits according to the considered seismic code. In this study, the structural damage levels are comparatively obtained for the isolated and non-isolated building systems. In Table 8, number of damaged columns and shear-walls are presented for each performance intervals under effects of design quake. Since the intensity of the design-quake is moderate, the number of damaged members is very limited. The isolation system has almost resulted in undamaged elements for the buildings.
For Düzce earthquake, decreasing in the number of damaged columns and shear-walls are seen in Table 9. For column members, there is a normal reduction in the damages of DL-SD intervals. The number of damaged columns in DL-SD interval has decreased from 12 to 9. No damages have been observed for SD-NC and beyond the CP level. However, a very strong reduction has been observed in the number of damaged shear-wall elements in case of base isolation system. The number of damaged members has dropped from 51 to 7 for DL-SD level and from 8 to 6 for NC level.
Table 10 shows the damaged columns and shear-walls for Erzincan earthquake. While there is no effective reduction in the damages of DL-SD intervals for column members, a significant decrease has developed in the number of damaged shear-wall elements by using rubber bearings. As it is seen from the table, the number of damaged members has decreased from 91 to 47 for DL-SD level and from 8 to 6 for NC level.
The effect of isolation system is also studied in terms of damages in beam elements by considering Erzincan earthquake. Table 11 shows the variations in the damaged beams of the considered building. For low damage levels, no distinct reductions have been observed. On the other hand, the number of damaged beams in the SD-NC intervals has seriously decreased from 108 to 87. However, the reduction in the damage level NC is observed as powerful. From the table, the number of collapsed beams has dropped from 45 to 22. This reduction in beyond NC level is very important because severe damages are seen in this region and this case is undesirable behavior (leads to total collapse risk) in structural stability.
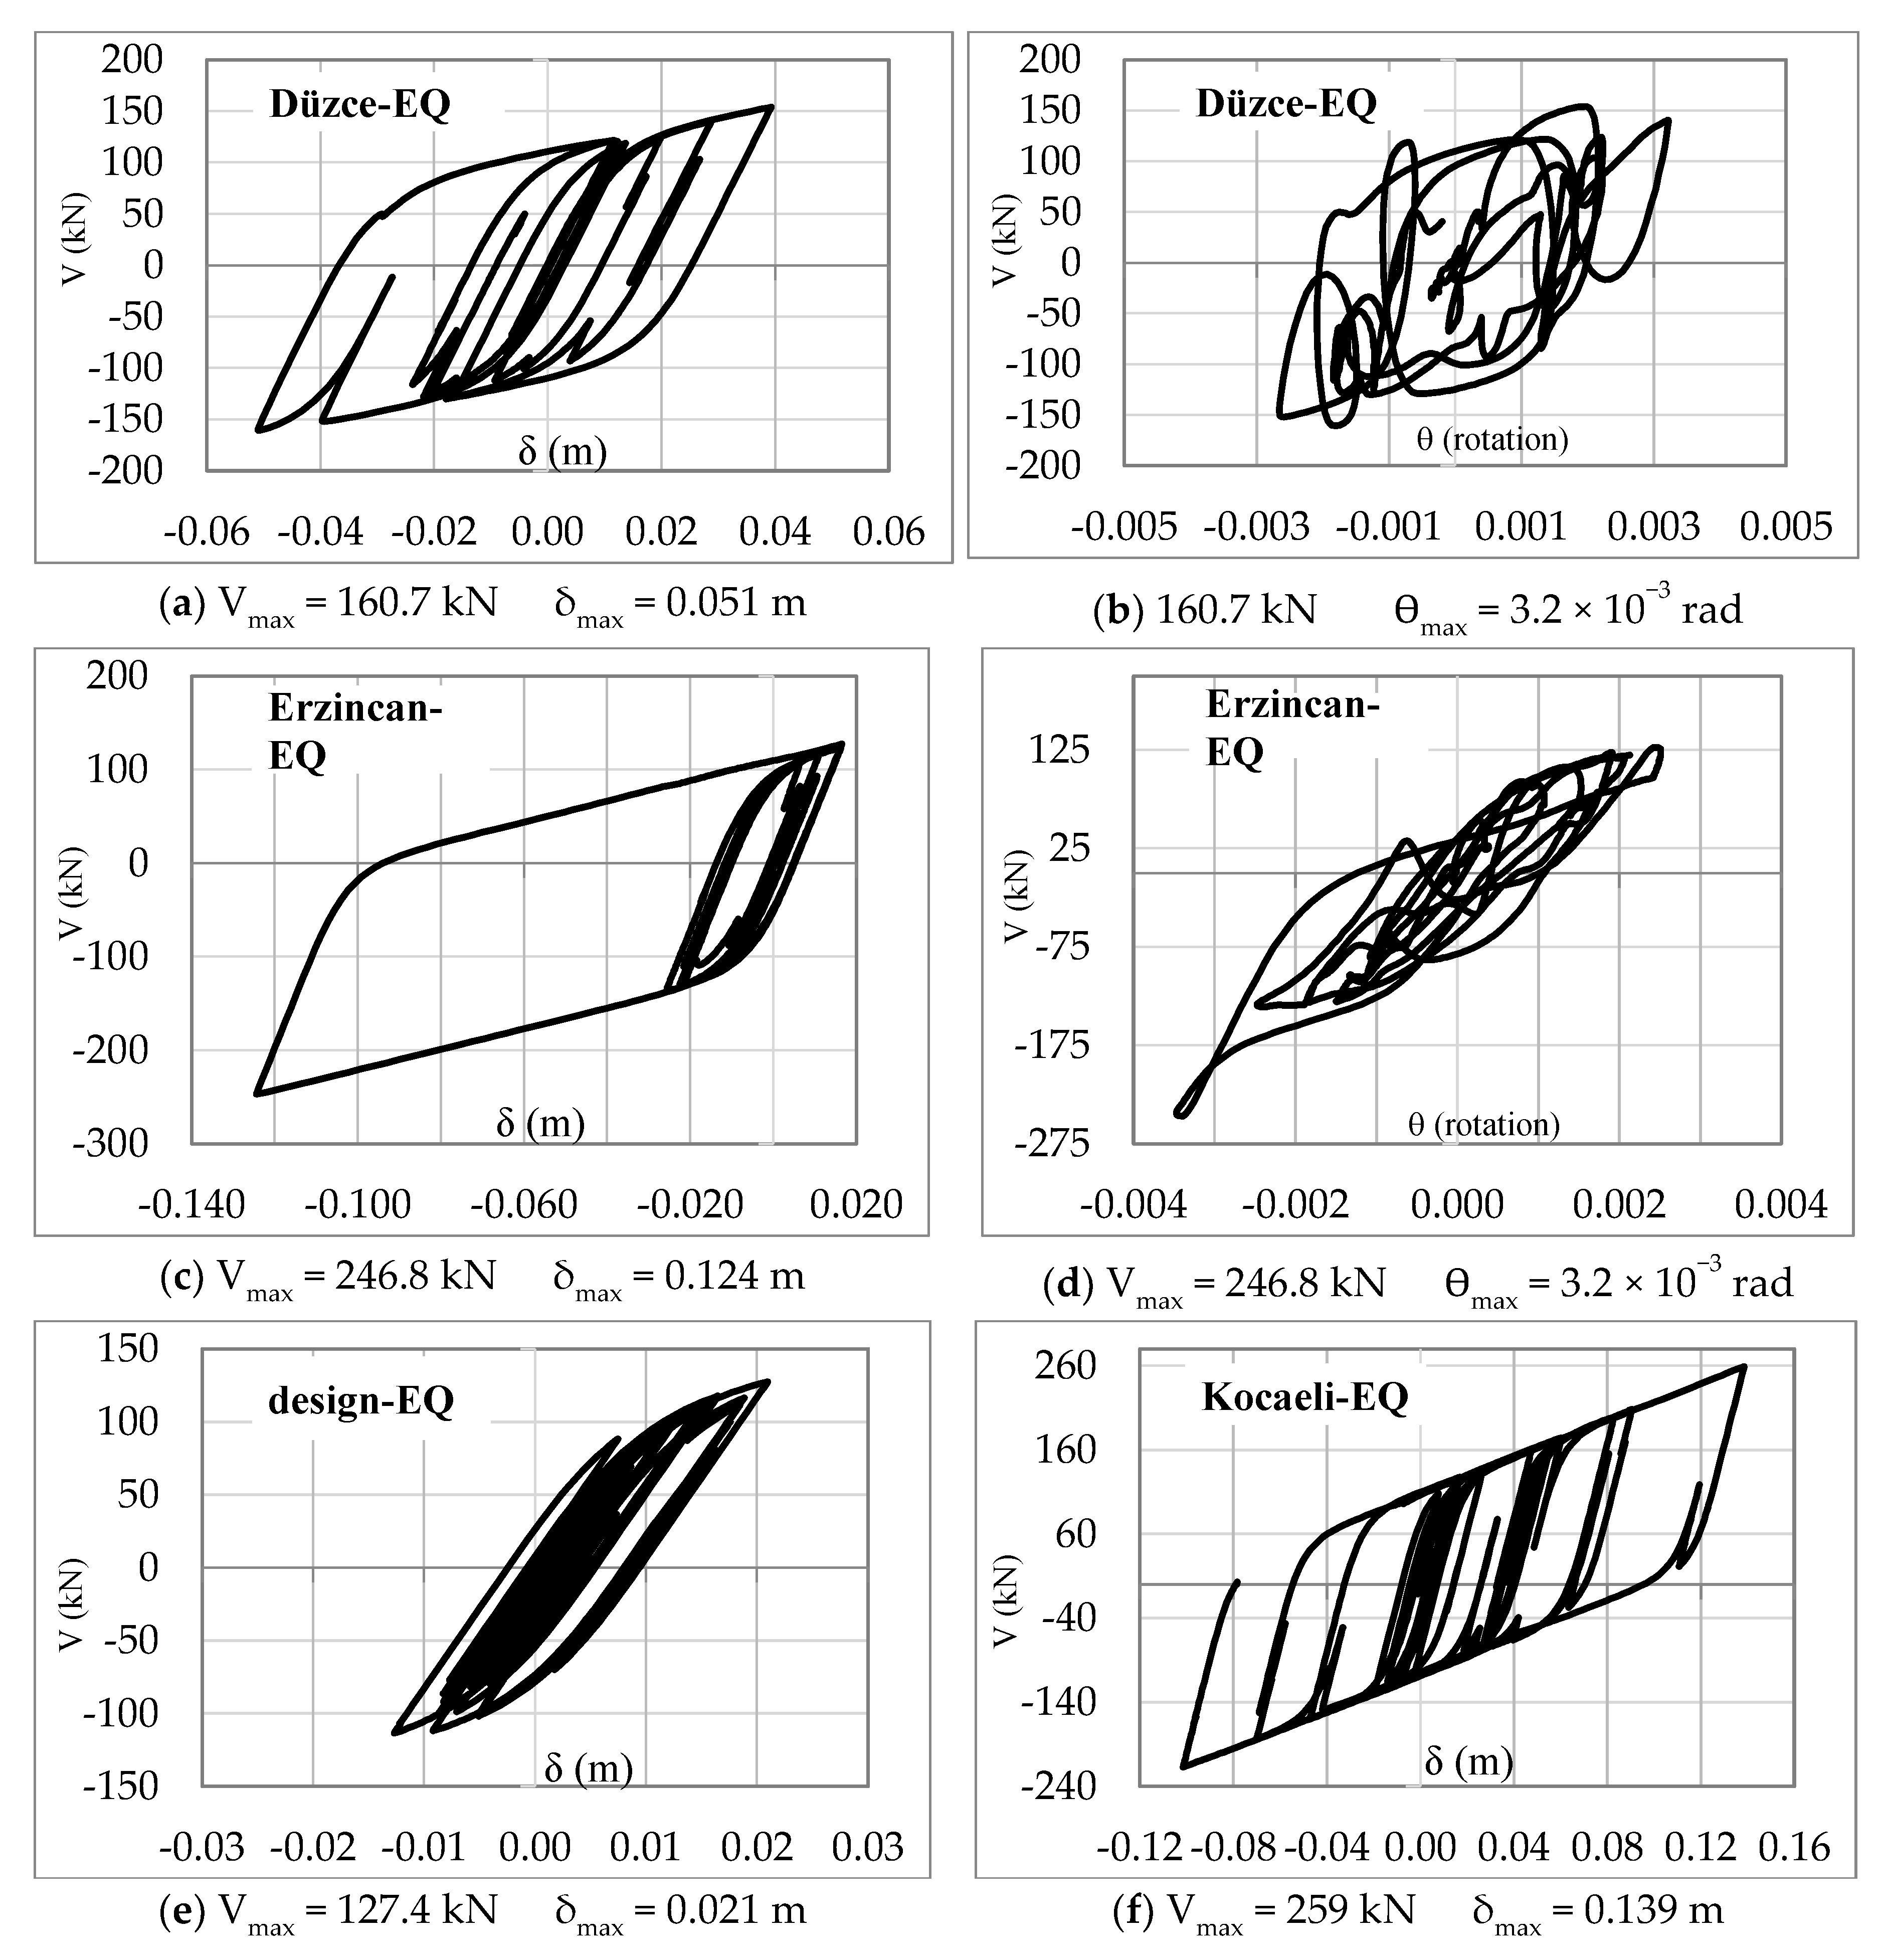
In design of structural systems, the lateral displacement capacity of rubber bearings modifies significantly the dynamic behavior because much more flexible bearings prolong the vibrational periods. From past earthquakes, it has been observed that capacity of the isolation devices could be inadequate in case of a strong ground motion. The maximum bearing deformations are computed for all ground motions considered and they are presented in Table 12. The maximum displacements of the lead-rubber bearings are obtained as 0.139 m for Kocaeli quake and 0.124 m for Erzincan quake. On the other hand, maximum deformations in the bearings are not allowed to exceed the acceptable limits given by seismic codes or manufacturers. The maximum shear strains (γs) of the bearings are limited by 150% (Caltrans v2.0). The deformation demand values given in Table 12 are compared with the allowable deformation limit (0.168 m) given by the Caltrans-code and the bearing maximum displacement capacity is determined as 0.41 m by manufacturer company. Peak rotations in the bearings are limited by θmax = σbTr2/(0.5GSL2) where σb is the axial stress in the bearing and L is the bearing length in the direction of load application. By considering the most unfavorable cases, the allowable maximum rotation is restricted by 0.079 rad. In the analyses, the maximum bearing rotation is found as 0.006 in Kocaeli quake loading. While the rotations in the bearings are also in acceptable ranges for all earthquakes, the peak demand displacement in the Kocaeli quake is in the region close to the allowable limit. Consequently, the rotations are generally within the acceptable range and the shear deformations of the bearings are also lower than the limit values. As a result, the designed bearings are seemed to be adequate to reduce the seismic responses including torsional effects.
For earthquake loadings, hysteretic behaviors indicate the energy consumption capacity absorbed by a structural member. In Figure 11, the hysteretic responses of the bearings are presented in terms of lateral displacements (δ) and rotations (θ) under effects of the earthquakes. Among the considered earthquakes, the peak hysteretic responses are obtained from Kocaeli earthquake for shear force (Vmax = 259.0 kN) and displacement value (δmax = 0.139 m). The maximum bearing displacement has occurred in the first floor and this peak displacement value (δmax = 0.139 m) is lower than design displacement o(0.168 m) of the bearing. As the intensity of the earthquake decreases, behaviors close to linear are observed as seen in the design earthquake. On the other hand, plastic rotations occur on a wide scattering zone under effects of ground motions. In the strong quakes, a wider distribution has occurred in the hysteretic curves that indicating nonlinear behavior and higher damping.
The isolated building is also investigated in terms of seismic base responses and roof displacements as seen in Figure 12. The decreases in the seismic base forces have appeared more distinctly in the early stages of the ground motion. From the response variations, the isolation system has effectively reduced the total base shear forces from Vmax = 10,919 kN to Vmax = 7971 kN for Erzincan earthquake and Vmax = 19,171 kN to Vmax = 14,694 kN for Kocaeli earthquake. Significant reductions in lateral seismic responses have developed approximately 39% (Design quake), 30% (Erzincan) and 23% (Kocaeli). On the hand, the roof displacements have increased as it is expected due to more flexible superstructure. As an example, the increase in the roof displacements is about 9%.
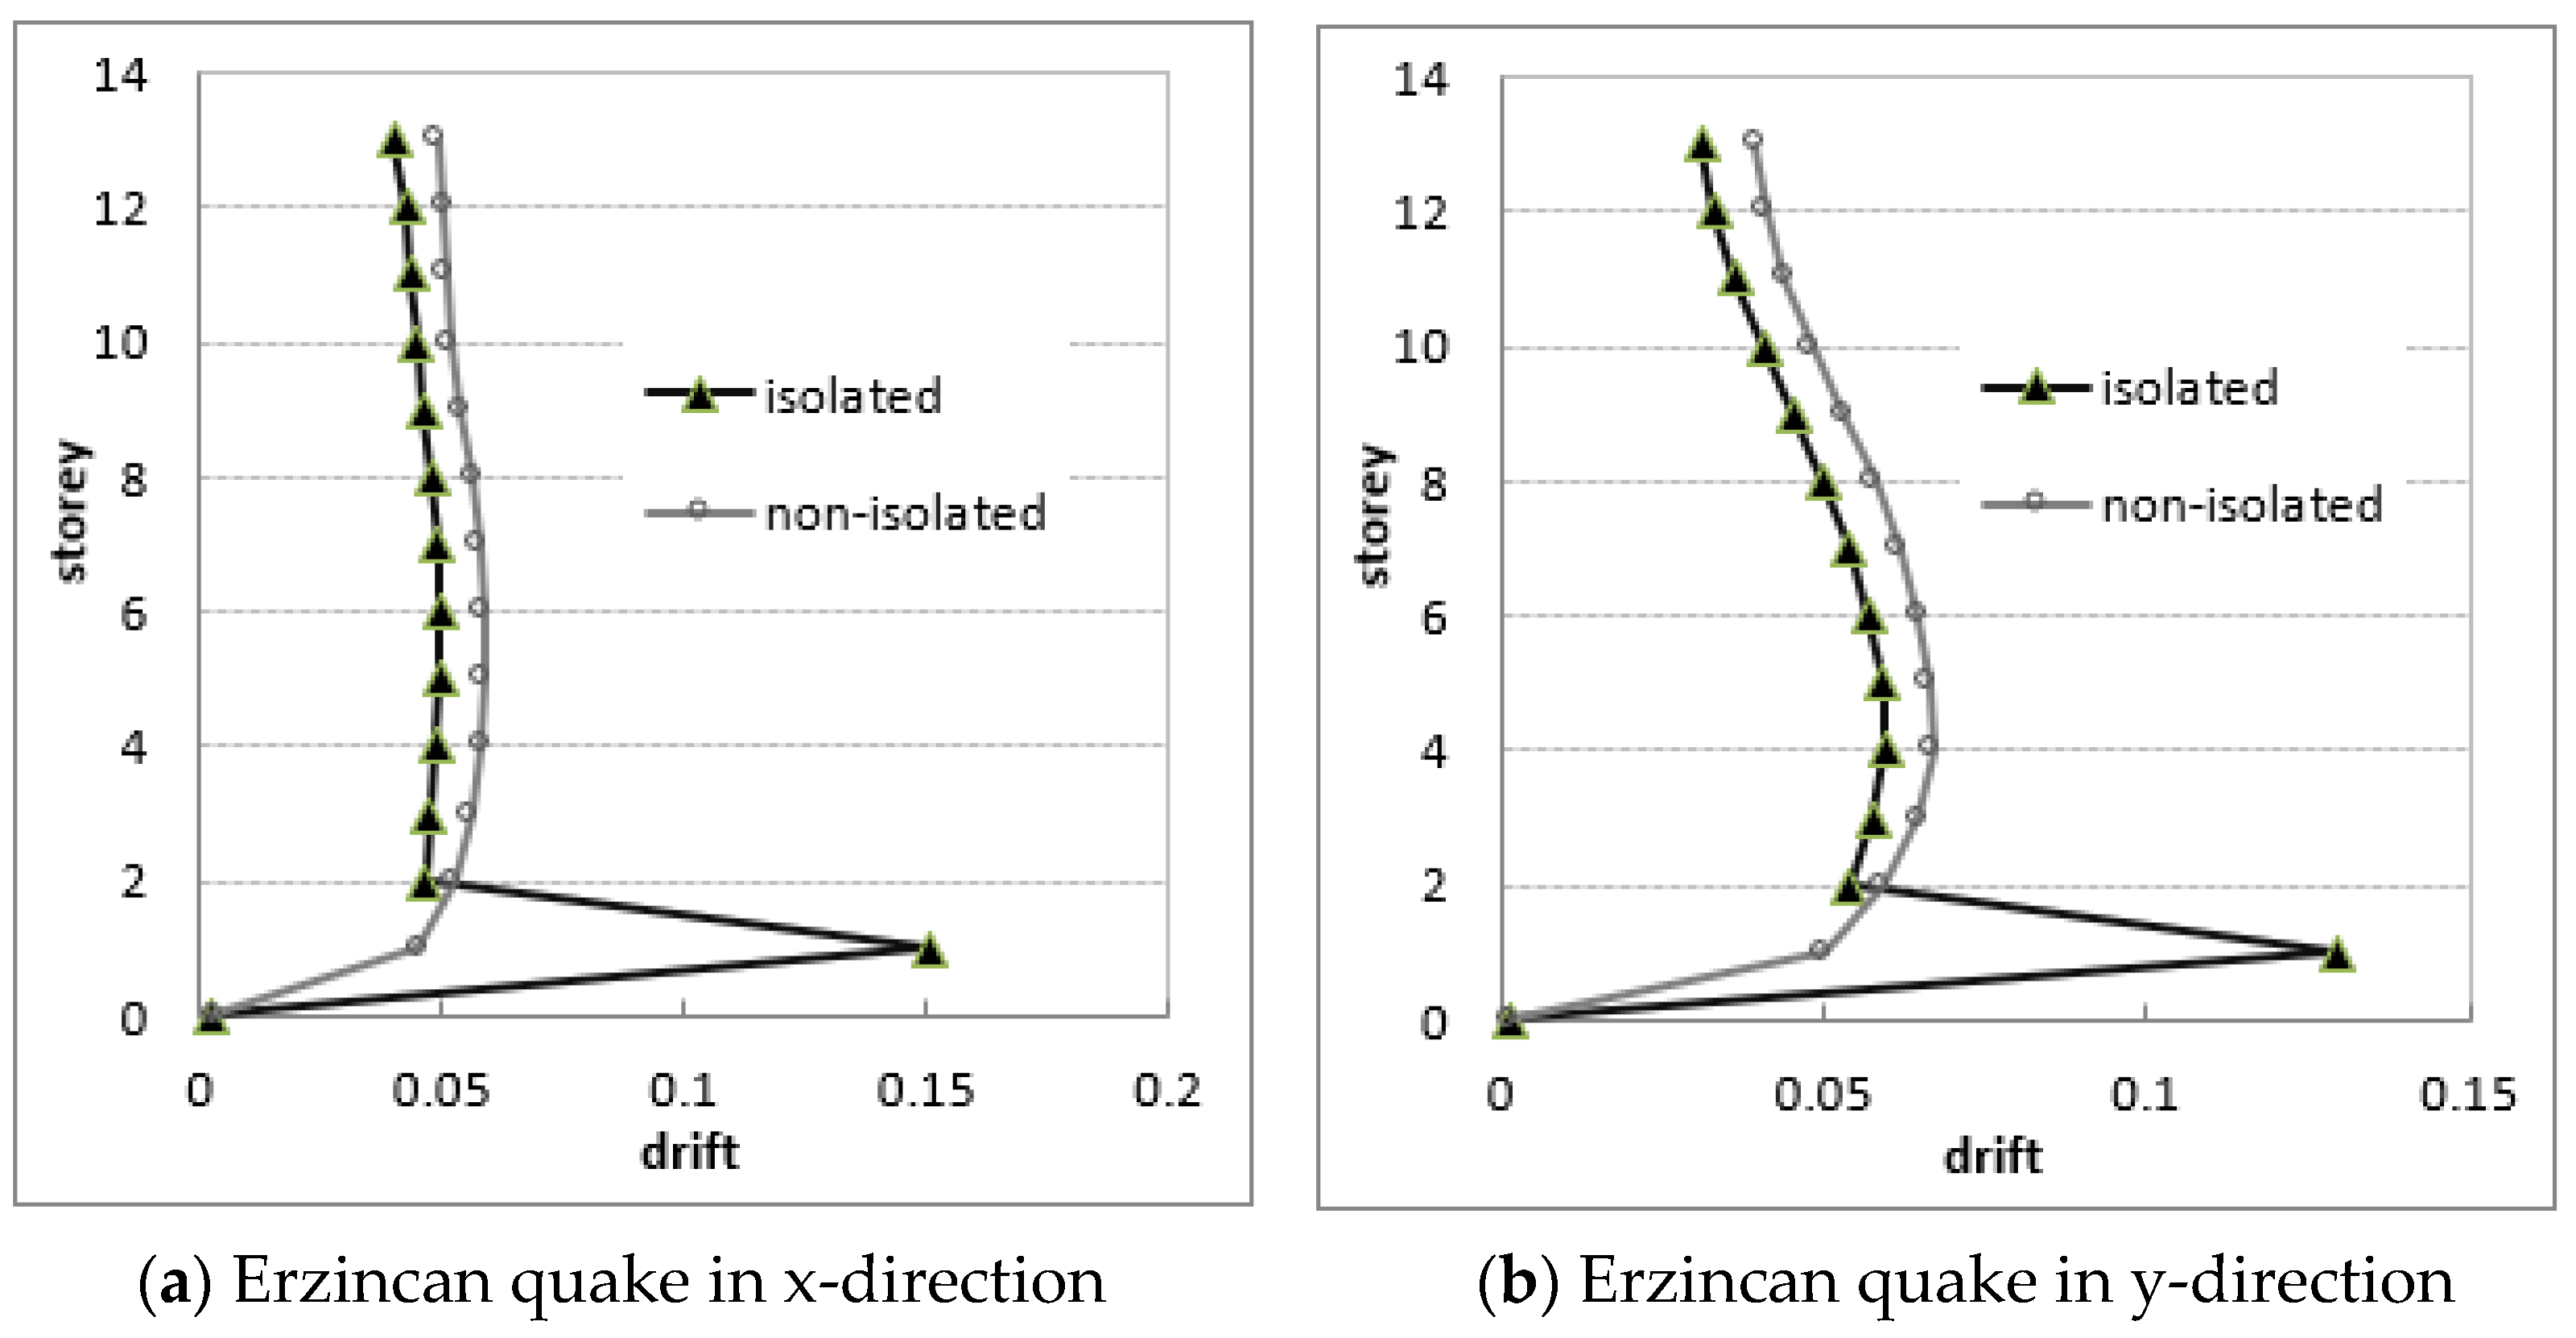
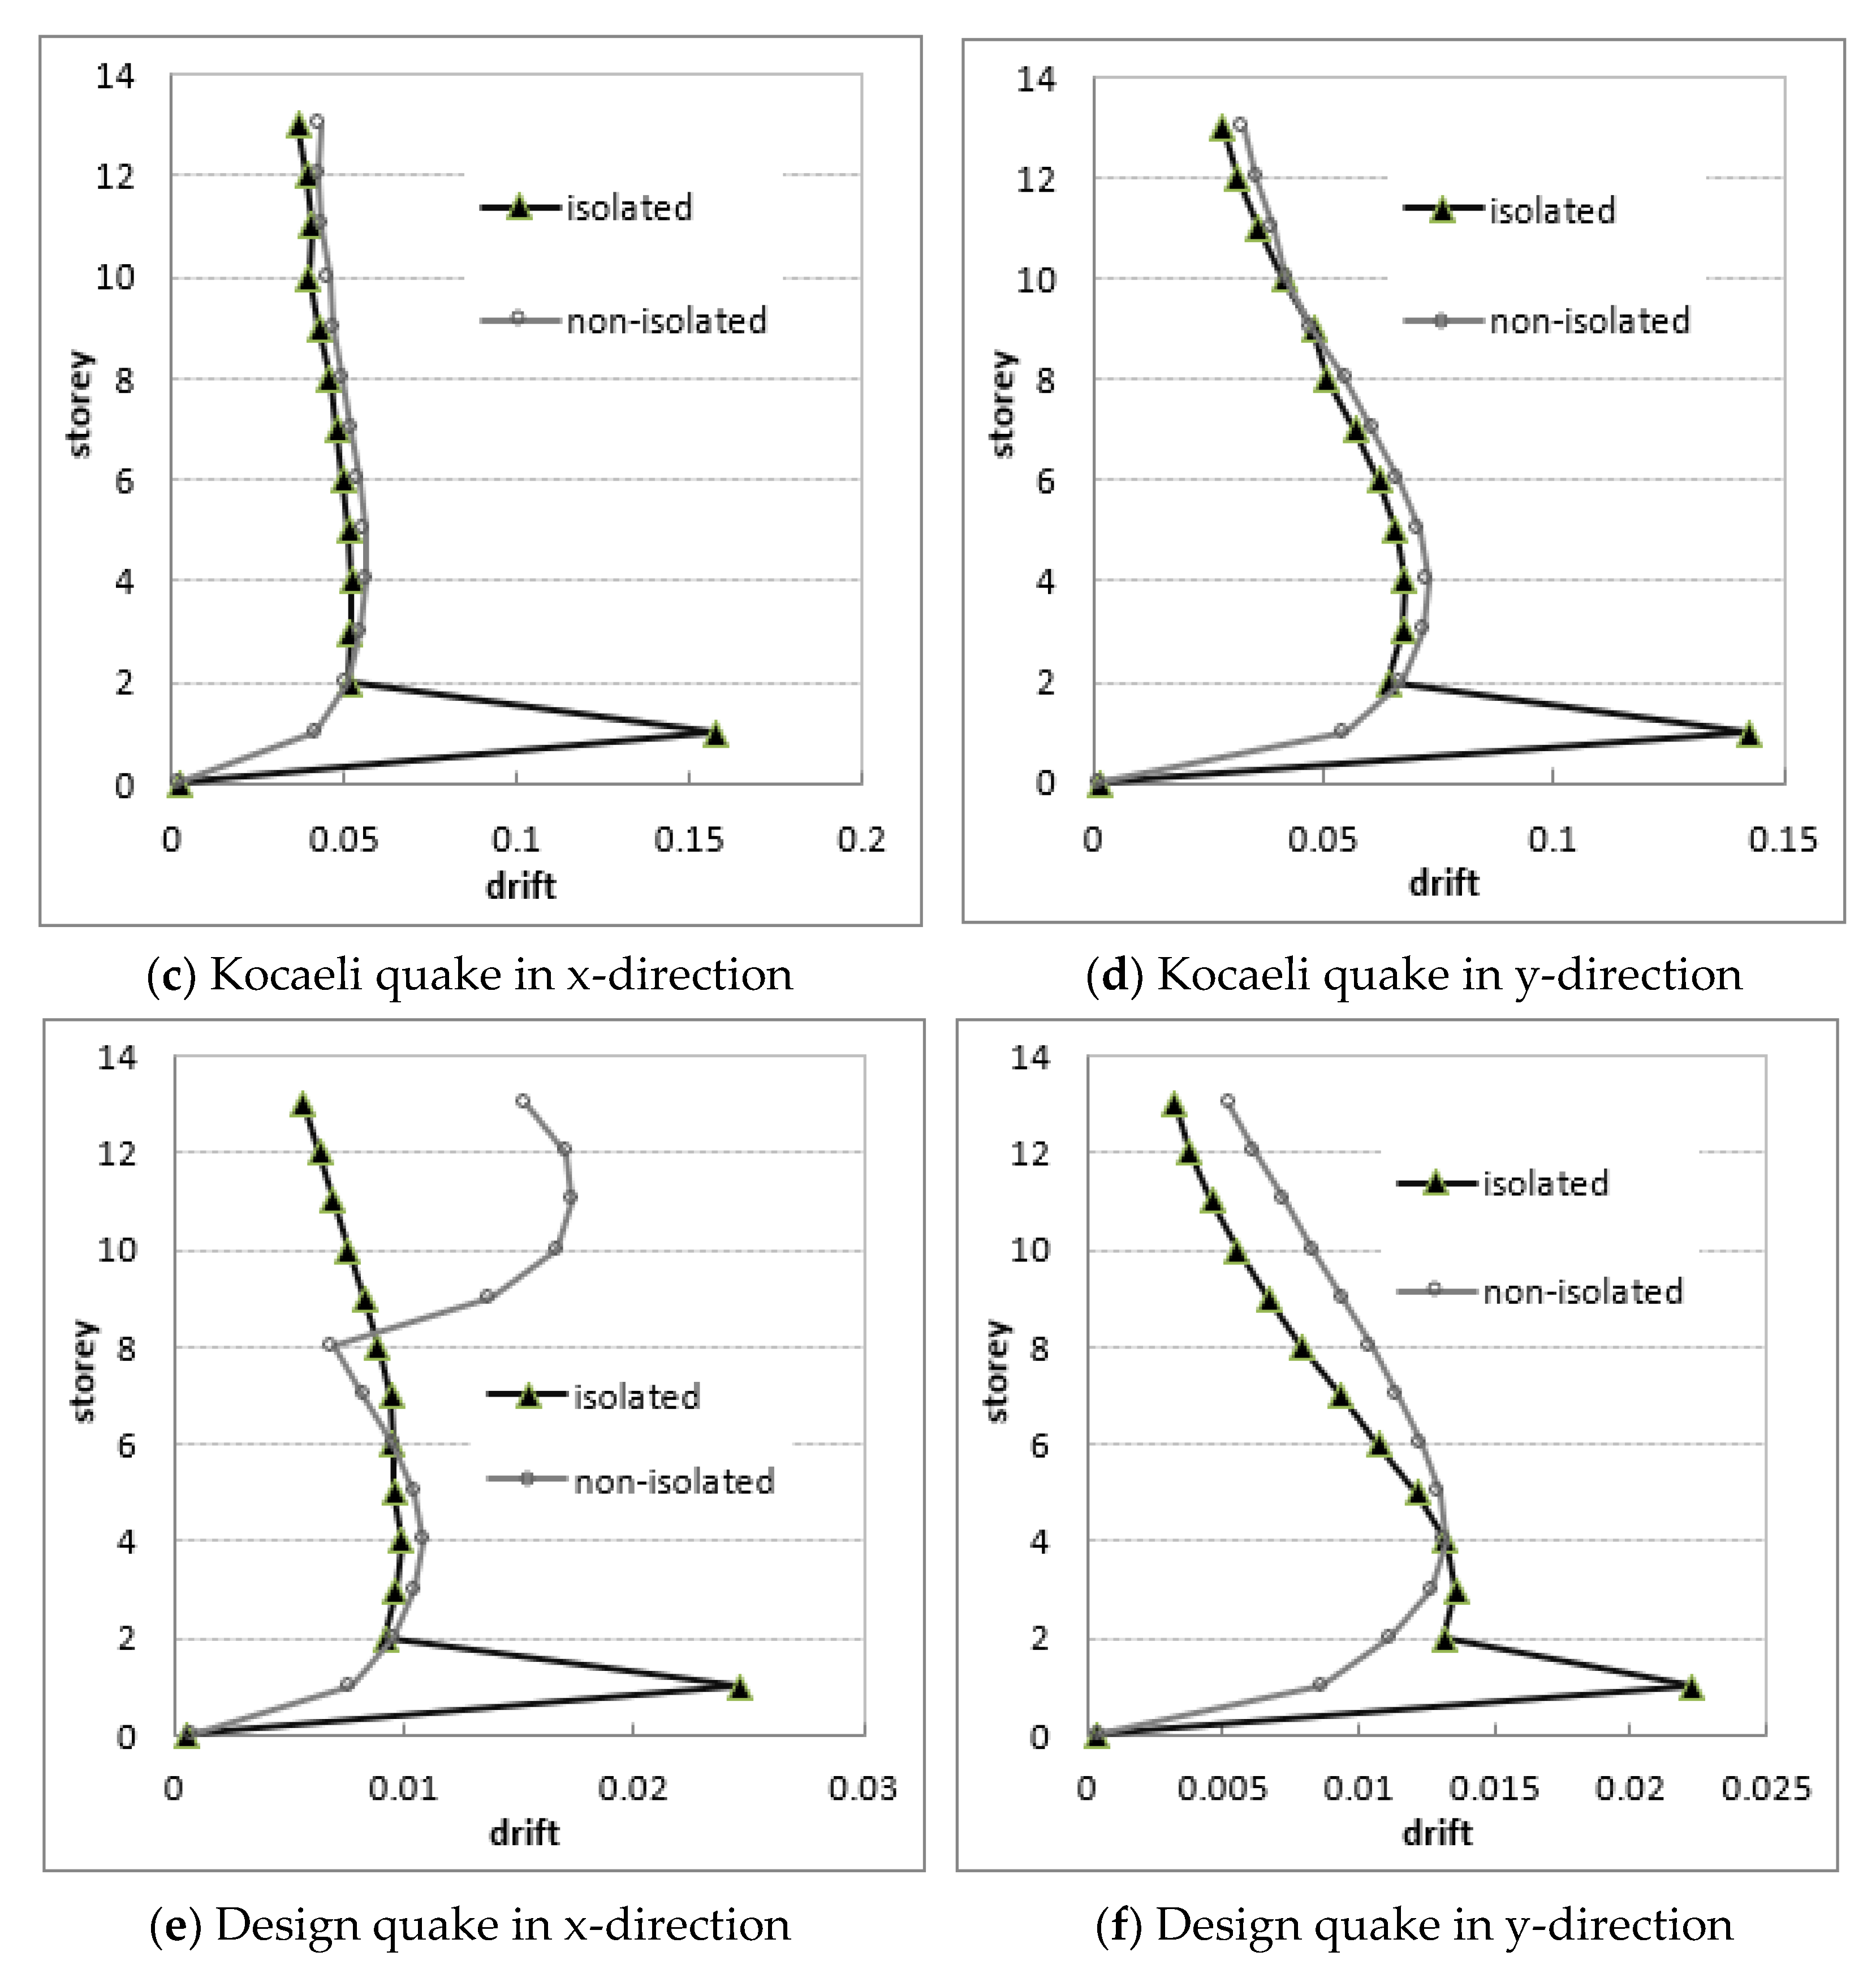
In terms of torsional effects, floor displacements of the roof slab are examined, in x-y plane, with reference to the deviations between the displacements of the corner joints. While the maximum displacement deviation is 9.5 cm for non-isolated building, this displacement deviation has occurred as 4.3 cm for the isolated building. The effective reduction in the relative joint displacement on the same floor is around 55% and this improvement has proven that the isolation system is an effective tool against to seismic effects and torsional irregularity. In seismic performance assessments, relative floor displacements are pioneer indicators of damage levels. To show relative influences, floor displacements of the analyzed building are illustrated in Figure 13 along the building height.
From a general point of view, the base isolation system has effectively prevented undesirable relative large displacements. Since the isolation devices have been mounted on 1st floor, large relative displacements are expected on this floor due to LRB deformations. But in direction of x, where more stiffer frames, the LRB effects have appeared differently depending on the severity of the earthquake as well. For strong quakes, while lower displacement demands have occurred on the middle floors of the isolated building, higher relative displacements have resulted in on the top floors in case of more structural stiffness. For moderate quakes, the isolation system has increased the relative displacements on the middle floors and decreased forcefully the displacements in the top floors. The results showed that the usage of the isolation system has seriously caused to different changes in the seismic responses. Decreases in the relative displacements show that the building has gained improvements to meet earthquake demands. In Figure 13, it has also proven that how the values of relative displacements of the floors are decreased by means of the isolation system.
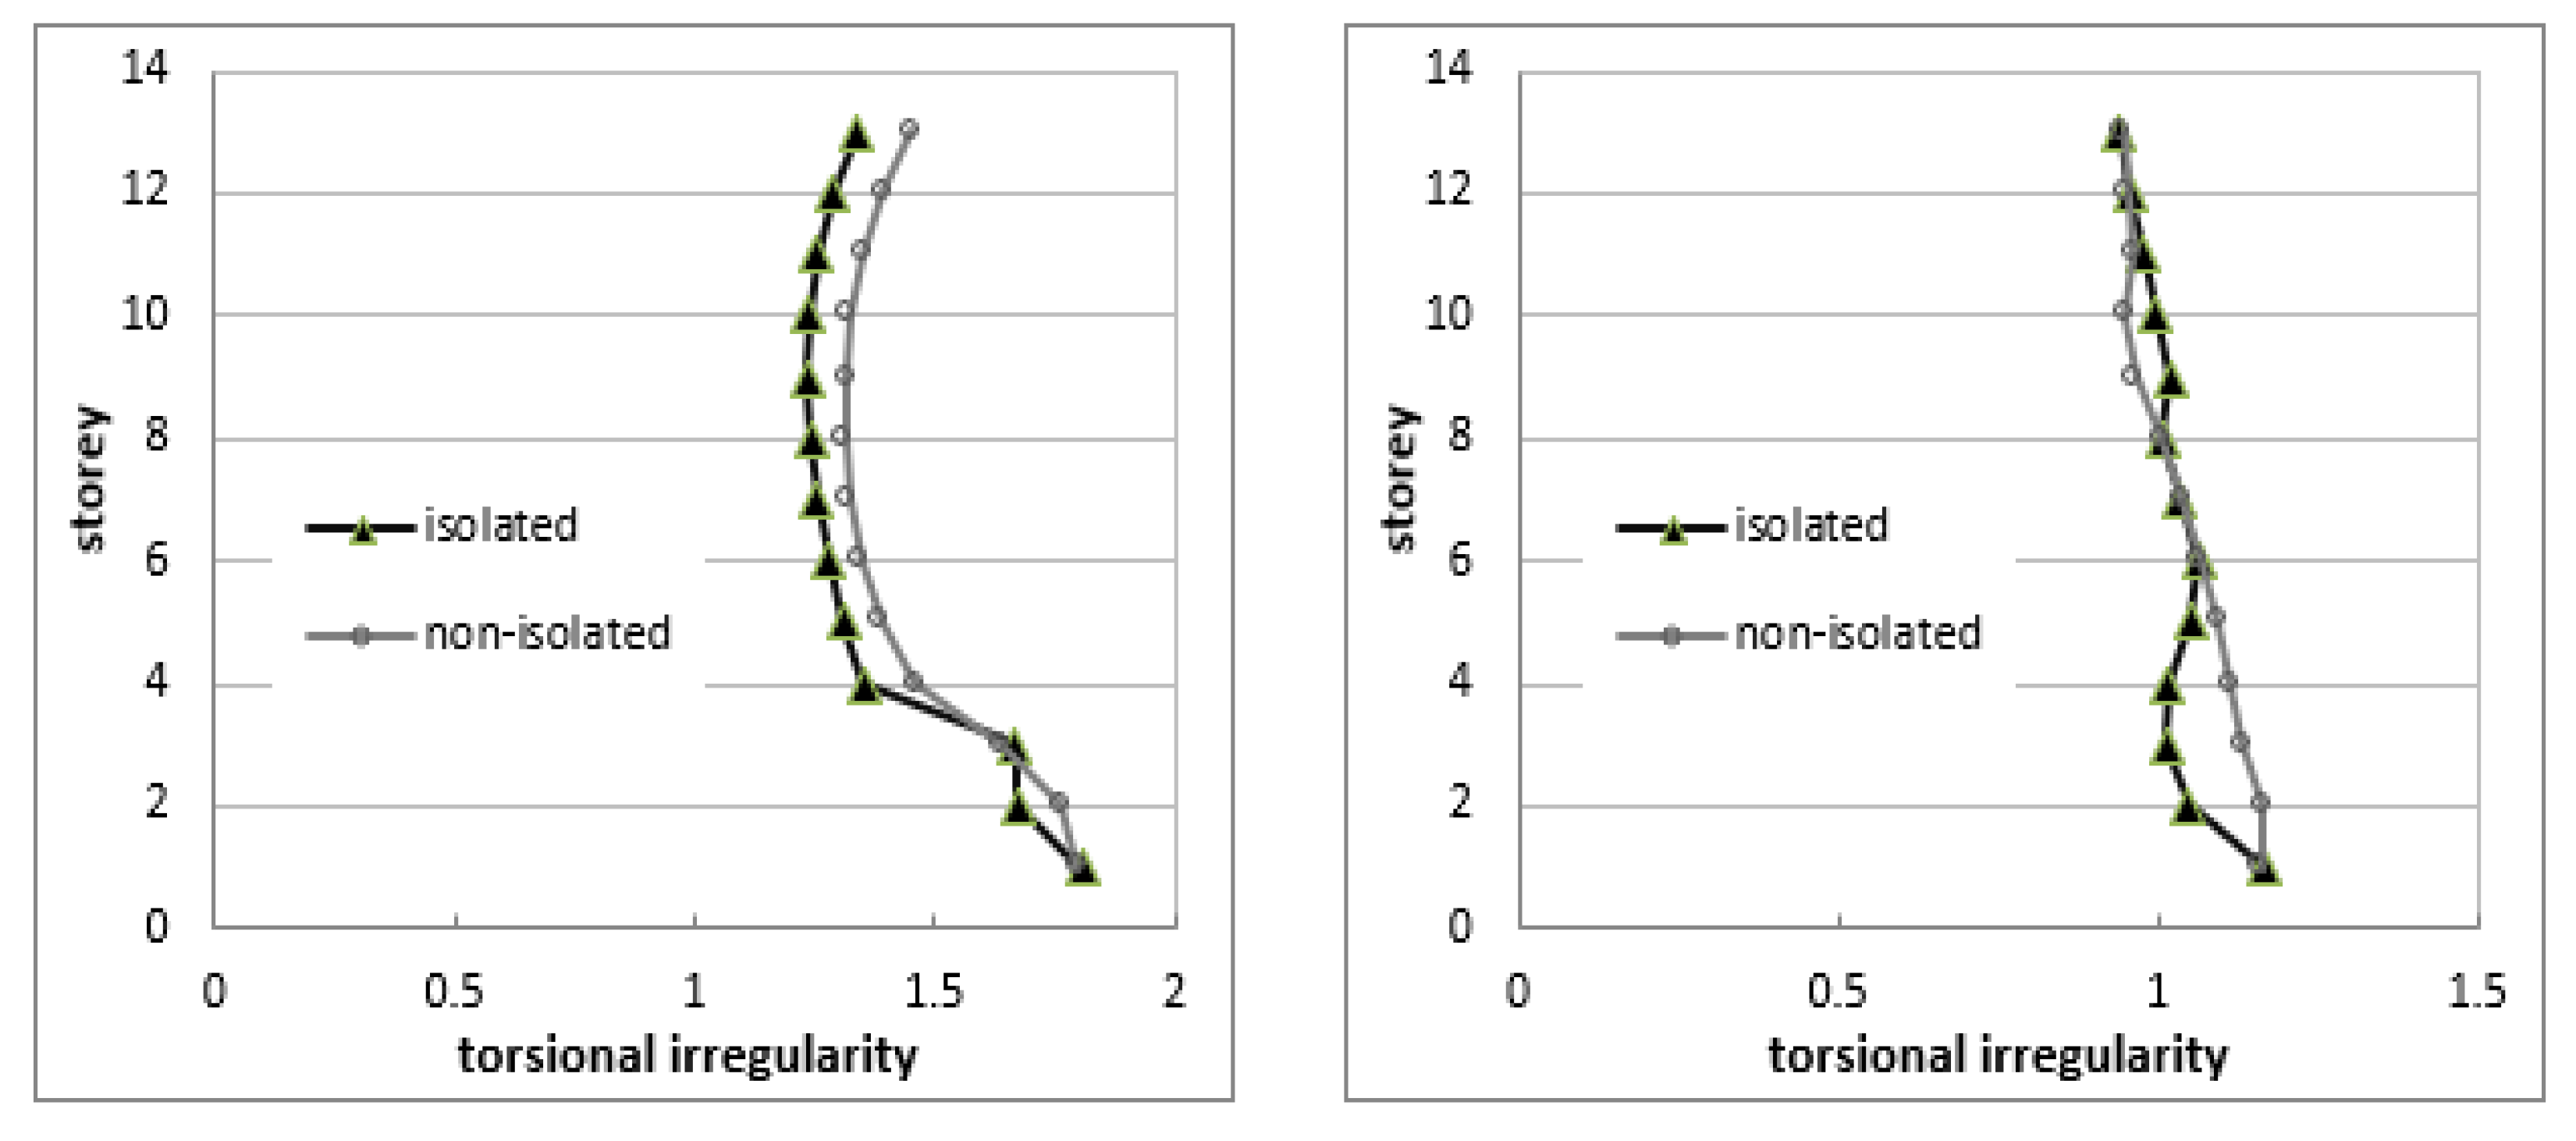
The differentiations in dimensions and positions of structural members have caused torsional irregularity. To determine the severity of this influence, a torsional irregularity coefficient (ηc), generally given by the seismic codes (TBEC-2018 [12], AASHTO [24], EC8 [13] and etc.), has been defined as,
ηc = δfmaxfave   and    δf ave = (δfmax + δfmin)/2
where δfmax, δfmin and δfave are the maximum, minimum and average displacements, respectively, of a considered floor. In Figure 14, the computed irregularity criteria have been illustrated for floor displacements under effects of Erzincan and design quakes. As seen, the base isolation system has partly improved the torsional irregularity. As an example, the irregularity coefficient has strongly dropped from 1.45 to 1.34 (about 7.6%) for the roof floor in case of Erzincan earthquake. In case of design quake, despite reductions in the irregularity coefficients for lower floors, it has been observed the increases in the upper floors. This means that, the responses of LRB devices develop depending on the frequency content of the ground motion. In fact, structural properties, soil layer properties, bearing characteristics and ground motion frequency-contents are coupled parameters. Therefore, the design and usage of seismic bearings requires special attentions due to complex relationships. However, better solutions can be achieved by determining the optimum characteristics of a LRB device, but this procedure requires extensive case studies and research.
The obtained results showed that the torsional irregularity of a building can be improved or modified by using a base isolation system.
On the other hand, floor displacements and rotations are important damage indicators for torsional irregularity. The average displacements and maximum rotations of the roof floor are given in Table 13 by considering various earthquakes. Thanks to isolation system, very effective reductions have occurred in the floor displacements and especially in the rotations. Alternatively, though adding mass or new structural members to an available structure can be implemented to limit torsional irregularity of a building, however, it should not be disregarded that the increase in the mass produces undesirable higher seismic forces.
Finally, an overall performance framework has been drawn up for the considered ground motions. In Table 14, the performance levels of critical structural members, columns and shear walls, are listed with maximum rotations in terms of number of vulnerable elements. For seismic base shear force, a dimensionless response factor (Vbsc) stating the ratio of Vb/W is defined for each earthquake loading. Vb is the total base shear force and W is the building weight. As seen from Table 12, effective decreases have occurred in the base forces by means of LRB devices. Reduction percentages in the base forces have resulted in the range of 20.2–39.1%. Decreases in roof displacements have been observed up to 48.4% and 37.5% reductions in relative roof displacements. From the inspection of the damage, the shear walls have showed larger damage compared to columns. Because there is no any damaged column in the collapse zone. In addition, damage beyond the collapse prevention also has developed apart from the damages in SD-NC range. However, valuable decreases in the damages are seen with the use of the base isolation system. For Kocaeli earthquake, the number of heavily damaged elements has dropped from 6 to 4 for the SD-NC level and the collapsed members from 9 to 6 for beyond the NC level. In slightly damaged zone (DL-SD), the number of elements has dropped from 110 to 55. The plastic rotations have generally dropped in considerable quantities (up to 15%) but in case of the strongest earthquake (Kocaeli 1999) this variation has reversed for shear walls and the maximum plastic rotations have increased up to 12%.

5. Conclusions

This study has investigated the seismic performance of an existing high-rise building having torsion irregularity. For improvement, lead rubber bearings have been designed considering forces in shear walls and columns and incorporated into the building to modify the superstructure’s deformations under effects of recorded and simulated earthquakes. Main target is to improve seismic performance of the building by eliminating the harmful torsion effects and decreasing the seismic forces. The 14 storey RC building with frame-shear wall system has been analyzed by nonlinear pushover and time history analyses to minimize the torsional insatiability problem. User-defined plastic hinges have been used for force-displacement relationships where these hinges have yielded reasonable results. The user-defined plastic hinge model is constructed with performance criteria of DL = 0, SD = 0.75 θ u m σ p and NC = θ u m σ p .
The main conclusions based on the analyses are summarized by the following findings:
  • The torsional irregularity is mainly caused by asymmetric placement of the shear walls in floor plan. Since center of mass of the investigated building differs greatly from center of rigidity, torsional effects have become very important factor over the seismic responses.
  • To minimize torsional effects, proper design and placement of shear walls are more critical than design of alternative techniques such as rubber bearings. Therefore, special attentions should be paid in design process for preventing possible torsional issues.
  • The base isolation system has partly improved the torsional irregularity. By using the rubber bearings, the torsional irregularity coefficients have remarkably dropped up to 7.6% for Erzincan earthquake and 10.7% for Kocaeli earthquake. In arrangement of bearings, the center of bearings should be coincided with mass-center of the structure in plan as much as possible. Some different displacement fluctuations in the responses have been observed and because the responses of LRB devices developed depending on the frequency content of the ground motion.
  • It should be pointed that the seismic performance of the high-rise building has distinctly increased thanks to later installed rubber bearings. Although the undesirable torsional effects have decreased for the considered building, these effects may drastically increase for some buildings in case of unfavorable structural rigidity and soil conditions.
  • The total base shear force effectively decreased with installment of base isolation system. A dimensionless response factor for seismic base shear force (Vbsc) stating the ratio of Vb/W is obtained to assess the isolation effects on the seismic forces. Reduction percentages in the base forces have resulted in the range of 20.2–39.1%. Decreases in roof displacements have been observed up to 48.4% and 37.5% reductions in relative roof displacements.
  • Thanks to isolation system, very effective reductions have occurred in the floor displacements and especially in the rotations. Average relative floor displacements have decreased about 44.4% for design quake and 62.3% reductions for rotations.
  • The effective reduction in the relative joint displacements on the same floor has developed up to 55% which shows how the values of relative displacements of the floors have decreased by means of the isolation system.
  • Performance levels of the critical structural elements have been obtained for the considered ground motions. Valuable decreases in the damage have been seen with the use of the base isolation system. For the Kocaeli earthquake the number of heavily damaged elements has decreased from 6 to 4 for the SD-NC level and the collapsed members from 9 to 6 for beyond the NC level. The number of elements in slightly damaged zone (DL-SD), has decreased substantially from 110 to 55. The plastic rotations have generally limited in considerable quantities (up to 15%) but in the strongest earthquake (Kocaeli 1999) this variation has reversed for shear walls and the maximum plastic rotations have increased up to 12%.
  • The peak displacements of the LRB devices are 0.139 m for the Kocaeli earthquake and 0.124 m for Erzincan earthquake. The seismic deformation demand values of the LRB devices are the allowable design limit of 0.168 m where the LRB maximum displacement capacity is determined as 0.41 m by manufacturer company. While the peak shear strains (γs) of the LRB are limited by 150%, the maximum shear strain has been obtained as 68% for the strongest earthquake.
  • With reference to the most unfavorable cases, the maximum allowable rotation of the LRB configuration is taken by 0.079 rad. In the analyses, the maximum bearing rotation is found as 0.006 in the Kocaeli EQ loading. While the rotations in the bearings are also in acceptable ranges for all earthquakes, the peak demand displacement in the Kocaeli EQ is in the region close to the allowable limit.
  • It is important to note that although the analyses could present good performance for the LRB devices, deformations in bearings can exceed the allowable limits in case of a strong ground motion. Therefore, bearing displacement capacity plays a crucial role in designs and this critical issue should be checked for bearing rotations as well.
  • The results have been presented here are only for the considered structural parameters and recorded ground motions. To generalize the results of the study, future research can focus on buildings that have various number of stories with different columns and shear wall types.
  • In this study, the LRB devices have been designed directly to meet seismic demand forces. However, the results showed that the responses of LRB devices develop depending on the amplitudes and frequency contents of the ground motion. Investigating the optimum characteristics of LRB devices to find the more accurate solution would further limit damage and effectively minimize torsional effects.
The results of this research can guide structural engineers to develop a solution technique against torsional effects by adding rubber bearings. A framework has been built and it could be used for different building models to be studied by researchers to develop the sustainable buildings.

Author Contributions

All the authors (F.S., I.B., A.K. and M.S.K.) contributed to every part of the research described in this paper. All authors have read and agreed to the published version of the manuscript.

Funding

This research was funded by DUBAP (Dicle University Scientific Research Project). Project number: FBE.21.023.

Data Availability Statement

All data. models. and code that were generated or used in the study appear in the published article.

Acknowledgments

The grant provided by DUBAP with the project number FBE.21.023 gratefully appreciated.

Conflicts of Interest

The authors declare no conflict of interest.

References

  1. Bedirhanoglu, I.; Ilki, A.; Triantafillou, T.C. Seismic Behavior of Repaired and Externally FRP Jacketed Short Columns Built with Extremely Low-Strength Concrete. ASCE J. Compos. Constr. 2022, 26, 04021068. [Google Scholar] [CrossRef]
  2. Bedirhanoglu, I. The Behavior of Reinforced Concrete Columns and Joints with Low Strength Concrete under Earthquake Loads: An Investigation and Improvement. Ph.D. Thesis, Civil Engineering Faculty, Istanbul Technical University, Istanbul, Turkey, 2009. [Google Scholar]
  3. Bedirhanoglu, I.; Onal, T. 23 Ekim 2011 Van Depremi Ön Değerlendirme Raporu (Preliminary Evaluation Report for 23 October 2011 Van Earthquake); Chamber of Civil Engineers Diyarbakir Brach: Diyarbakir, Turkey, 2011. [Google Scholar] [CrossRef]
  4. Bedirhanoglu, I. Preliminary Report on 12 November 2017 Halabja Earthquake; Civil Engineering Department, Engineering Faculty, Dicle University: Diyarbakir, Turkey, 2017. [Google Scholar]
  5. Saritas, F. Performance-based seismic assessment of a base-isolated bridge-pier. Eur. J. Environ. Civ. Eng. 2019, 26, 21–38. [Google Scholar] [CrossRef]
  6. Saritas, F. Performance assessment of an isolated Multispan bridge. Arab. J. Sci. Eng. 2022, 47, 12993–13008. [Google Scholar] [CrossRef]
  7. Athanatopoulou, A.M. Critical orientation of three correlated seismic components. Eng. Struct. 2005, 27, 301–312. [Google Scholar] [CrossRef]
  8. Fontara, I.K.M.; Kostinakis, K.G.; Manoukas, G.E.; Athanatopoulou, A.M. Parameters affecting the seismic response of buildings under bi-directional excitation. Struct. Eng. Mech. 2015, 53, 957–979. [Google Scholar] [CrossRef]
  9. Askouni, P.K.; Karabalis, D.L. The Modification of the Estimated Seismic Behaviour of R/C Low-Rise Buildings Due to SSI. Buildings 2022, 12, 975. [Google Scholar] [CrossRef]
  10. Seo, J.; Hu, J.W. Seismic Response and Performance Evaluation of Self-Centering LRB Isolators Installed on the CBF Building under NF Ground Motions. Sustainability 2016, 8, 109. [Google Scholar] [CrossRef] [Green Version]
  11. Buzuk, J. Seismic Performance Evaluation Of 24 Story Rc Building By Nonlinear Time History Analysis Utilizing TBDY2018 And EC8. Master’s Thesis, Fen Bilimleri Enstitüsü, İstanbul Teknik Üniversitesi, Istanbul, Turkey, 2019. [Google Scholar]
  12. Turkish Building Earthquake Code (TBEC). Disaster and Emergency Management Presidency; T.C. Resmi Gazete; TBEC: Ankara, Turkey, 2018. [Google Scholar]
  13. EN 1998-1. Eurocode 8: Design of Structures for Earthquake Resistance—Part 1: General Rules, Seismic Actions and Rules for Buildings; [Authority: The European Union Per Regulation 305/2011, Directive 98/34/EC, Directive 2004/18/EC]; European Union: Maastricht, The Netherlands, 2004. [Google Scholar]
  14. Rahul, N.K. Effect of building height on torsional rotation of base isolated structures. Int. J. Recent Technol. Eng. 2019, 8, 1754–1760. [Google Scholar] [CrossRef]
  15. Nagarajaiah, S.; Reinhorn, A.M.; Constantinou, M.C. Torsion in base-isolated structures with elastomeric isolation systems. J. Struct. Eng. 1993, 119, 2932–2951. [Google Scholar] [CrossRef]
  16. Adibramezani, M.; Moghadam, A.S.; Ziyaeifar, M. Assessment of a technique for the torsional response reduction of isolated asymmetric structures. J. Appl. Sci. 2009, 9, 2653–2670. [Google Scholar] [CrossRef] [Green Version]
  17. Naderpour, H.; Naji, N.; Burkacki, D.; Jankowski, R. Seismic response of high-rise buildings equipped with base isolation and Non-traditional tuned mass dampers. Appl. Sci. 2019, 9, 1201. [Google Scholar] [CrossRef] [Green Version]
  18. Shiravand, M.R.; Ketabdari, H. Evaluating Seismic Response of Plan Irregular Buildings Using combination of Lead Rubber Bearing Isolator and Friction Pendulum System. JSCE 2021, 8, 141–163. [Google Scholar] [CrossRef]
  19. Konak, A. Nonlinear Performance Assessment of Rc Buildings Based on Displacement Design By Implementing TSC2018 with Comparison to the Eurocode. Master’s Thesis, Dicle University, Diyarbakir, Turkey, 2022. [Google Scholar]
  20. Naeim, F.; Kelly, J.M. Design of Seismic Isolated Structures: From Theory to Practice; John Wiley & Sons: Hoboken, NJ, USA, 1999. [Google Scholar]
  21. CALTRANS. Caltrans Seismic Design Criteria Version 2.0; State of California Department of Transportation: Street Sacramento, CA, USA, 2019. [Google Scholar]
  22. FEMA-356. Update to ASCE/SEI-41 Concrete Provisions; Federal Emergency Management Agency: Washington, DC, USA, 2007. [Google Scholar]
  23. FEMA-356. Prestandard and Commentary for the Seismic Rehabilitation of Buildings; Federal Emergency Management Agency: Washington, DC, USA, 2000. [Google Scholar]
  24. DIN 4141-14. Structural Bearings, Laminated Elastomeric Bearings Design and Construction; Deutsche Institut für Normung: Berlin, Germany, 1985. [Google Scholar]
  25. AASHTO. LRFD Seismic Analysis and Design of Bridges Reference Manual; American Association of State Highway and Transportation Officials: Washington, DC, USA, 2014. [Google Scholar]
  26. Kowalsky, M.J.; Priestley, M.J.N.; MacRae, G.A. Displacement Based Design—A Methodology for Seismic Design Applied to Single Degree of Freedom RC Structures; Structural Systems Research, University of California: San Diego, CA, USA, 1994; p. 131. [Google Scholar]
  27. Priestly, M.J.N.; Seible, F.; Calvi, G.M. Seismic Design and Retrofit of Bridges; John Wiley & Sons: New York, NY, USA, 1996; p. 704. [Google Scholar]
  28. Vision 2000. Performance Based Seismic Engineering for Buildings, Volume I and II; Structural Engineers Association of California: Sacramento, CA, USA, 1995. [Google Scholar]
  29. ATC-40. Seismic Evaluation and Retrofit of Concrete Buildings; Applied Technology Council, California Seismic Safety Commission: West Sacramento, CA, USA, 1996. [Google Scholar]
  30. Mander, J.B.; Priestley, M.J.N.; Park, R. Theoretical stress-strain model for confined concrete. J. Struct. Eng. 1998, 114, 1804–1826. [Google Scholar] [CrossRef] [Green Version]
  31. Bedirhanoglu, I.; Ilki, A. Theoretical Moment-Curvature Relationships for Reinforced Concrete Members and Comparison with Experimental Data. In Proceedings of the Sixth International Congress on Advances in Civil Engineering, Istanbul, Turkey, 6–8 October 2004; pp. 231–240. [Google Scholar]
  32. FEMA-440. Improvement of Nonlinear Static Seismic Analysis Procedures; Federal Emergency Management Agency: Washington, DC, USA, 2005. [Google Scholar]
  33. Chopra, A.K.; Goel, R.K. A modal pushover analysis procedure for estimating seismic demands for buildings. Earthq. Eng. Struct. Dyn. 2002, 31, 561–582. [Google Scholar] [CrossRef] [Green Version]
  34. Aydinoglu, M.N. An Incremental Response Spectrum Analysis Procedure Based on Inelastic Spectral Displacements for MultiMode Seismic Performance Evaluation. Bull. Earthq. Eng. 2003, 1, 3–36. [Google Scholar] [CrossRef]
  35. SAP 2000 CSI. Integrated Software for Structural Analysis and Design; Computers and Structures Inc.: Berkeley, CA, USA, 2020. [Google Scholar]
  36. AFAD. Ministry of Interior Disaster and Emergency Management Presidency: Ankara, Turkey. Available online: www.en.afad.gov.tr (accessed on 15 June 2022).
  37. PEER Data Base. Available online: https://ngawest2.berkeley.edu/site (accessed on 12 May 2022).
Figure 1. Failure of buildings due to torsional instability (Images by Idris Bedirhanoglu [3,4]). (a) Van earthquake, 2011 [3]. (b) Halabja earthquake, 2018 [4].
Sustainability 15 00036 g001
Figure 2. Building model with columns and shear walls.
Sustainability 15 00036 g002
Figure 3. Rubber bearing system.
Sustainability 15 00036 g003
Figure 4. Effect of bearing system on period the building.
Sustainability 15 00036 g004
Figure 5. Stress-strain curves for column and shear wall.
Sustainability 15 00036 g005
Figure 6. Moment-curvature relationship of a RC cross sections of a column and a shear wall.
Sustainability 15 00036 g006
Figure 7. Performance levels and hinge model.
Sustainability 15 00036 g007
Figure 8. Design spectrum.
Sustainability 15 00036 g008
Figure 9. Pushover and capacity curves.
Sustainability 15 00036 g009
Figure 10. Earthquake records.
Sustainability 15 00036 g010
Figure 11. Bearing hysteric loops for Erzincan EQ.
Sustainability 15 00036 g011
Figure 12. Seismic response variations in the Kocaeli quake.
Sustainability 15 00036 g012
Figure 13. Bearing effect on the relative floor displacements.
Sustainability 15 00036 g013aSustainability 15 00036 g013b
Figure 14. Variation of torsional irregularity for the seismic effects.
Sustainability 15 00036 g014
Table 1. Characteristic of rubber bearings.
Bearing
Type
Bearing
Diameter (m)
Hb
(m)
S-Shape FactorTr
(m)
Kd
(kN/m)
Kv
(kN/m)
Keff
(kN/m)
type-10.700.20514.480.112900261 × 1041121
type-20.700.20515.600.1121200351 × 1041464
type-30.850.23014.580.1371400328 × 1041739
Table 2. Building vibration periods (s).
TypeT1T2T3
isolated3.893.783.65
non-isolated2.942.752.55
Table 3. Building vibration periods (s).
TypeØy
(rad)
Øu
(rad)
Δy
(m)
Δu
(m)
μΔμØ
Column 0.00690.01220.0066 0.01 1.621.768
Shear wall0.01580.07320.00240.00582.454.63
Table 4. Performance values for a shear-wall and a column.
Shear-WallColumn
PointForceRotationPointForceRotation
B10B10
C1.240.019C1.0480.028
D0.20.019D0.20.028
E0.20.029E0.20.038
Table 5. Performance limits for total deformation [13].
Limit State (LS) (Total)
MemberDLSDNC
ductile primaryθdl ≤ θyθsd ≤ 0.75 θ u m σ θNC θ u m σ
ductile secondaryθsd ≤ 0.75 θ u m θNC θ u m
Table 6. (a). Performance criteria in y-direction. (b). Performance criteria in x-direction.
(a)
Section StrainsComputed Criteria
Column NoSectionLp (mm)My (kNm)ØyØuN (kN)DLSDNC
1-2-3-4-12-13-14-1530/70329.5582.10.006890.091671837.600.010990.0146
830/70329.5531.90.006440.079681522.300.010960.01461
5-6-10-1170/30249.5265.70.020400.220001984.800.014640.01951
735/80349.5836.10.006300.0850652565.600.011450.01526
940/80349.51022.80.006080.082002993.600.011810.01574
(b)
Section StrainsComputed Criteria
Column NoSectionLp (mm)My (kNm)ØyØuN (kN)DLSDNC
1-2-3-4-12-13-14-1530/70249.5257.360.01960.2411837.5600.015040.02
830/70249.5237.3930.018050.2121522.3000.01480.0198
5-6-10-1170/30329.5600.7690.0070.0841984.8300.010680.0142
735/80259.5403.30.01630.1692565.600.014640.0195
940/80269.5525.70.01380.1612993.59000.013440.0179
Table 7. Performance requirements and spectral responses.
Performance ValuesPeak Values
Building SystemV
(kN)
Δp
(m)
SaSd
(m)
βeffTeff
(s)
Δroof
(m)
Isolated5289.850.1560.0620.1160.0962.7430.95
Non-isolated5933.880.1330.0760.1010.0872.3120.477
Table 8. Damage in columns and shear-walls for design earthquake.
ColumnsShear Walls
Non-IsolatedIsolated Non-IsolatedIsolated
Floor LevelNumber of ColumnsDL-SDSD-NC>NCDL-SDSD-NC>NCNumber of Shear WallsDL-SDSD-NC>CPDL-SDLS-CP>NC
11500000024100000
21500000024000000
31500000024000000
41500000024000000
51500000024000000
61500000024100000
71500000024100000
81500000024100000
91500000024000000
101500000024000000
111500000024000000
121530000024000000
Total180300000288400000
Table 9. Damage in columns and shear-walls for Düzce earthquake.
ColumnsShear Walls
Non-IsolatedIsolated Non-IsolatedIsolated
Floor LevelNumber of ColumnsDL-SDSD-NC>NCDL-SDSD-NC>NCNumber of Shear WallsDL-SDSD-NC>CPDL-SDLS-CP>NC
11500000024600300
21500000024400000
31500000024300000
41500000024600100
51500000024600100
61500000024600200
71500000024600000
81500000024600000
91500000024400000
101510000024200000
111510010024200000
1215100080024000000
Total18012009002885100700
Table 10. Damage in columns and shear-walls for Erzincan earthquake.
ColumnsShear Walls
Non-IsolatedIsolated Non-IsolatedIsolated
Floor LevelNumber of ColumnsDL-SDSD-NC>NCDL-SDSD-NC>NCNumber of Shear WallsDL-SDSD-NC>CPDL-SDLS-CP>NC
1155006002416011401
215200200241201201
31510010024401201
41510010024301301
51510010024301201
61510010024301201
71520010024501110
815200200241001300
915300200241010500
1015400300241200400
111530030024500400
12151500150024800500
Total1804000380028891184716
Table 11. Damage in beams for Erzincan earthquake.
Columns
Non-IsolatedIsolated
Floor LevelNumber of BeamsDL-SDSD-NC>NCDL-SDSD-NC>NC
163461034790
2634010643103
363511064394
463411074294
563391074194
663421064294
7634411442112
863431144771
96345924860
106349804840
116349604830
126344304110
Total756533108455328722
Table 12. Bearing peak responses.
Quakeδmax (m)γi (%)θmaxVmax (kN)
Düzce0.051300.003160.7
Erzincan0.124610.003246.8
Kocaeli0.139680.006258.9
Design0.02150.001127.4
Table 13. Floor relative average displacements and maximum rotations.
Quakeδfave (m) θfmax (×10−3)
Non-IsolatedIsolatedReductions %Non-IsolatedIsolatedReductions %
Erzincan0.0270.02314.86.63 × 10−34.11 × 10−325.2
Kocaeli0.0350.03014.38.90 × 10−37.65 × 10−314.0
Design0.0090.00544.42.47 × 10−30.93 × 10−362.3
Table 14. Demand values and building performance.
LoadingVBSC
%
δrelativeδroof
(m)
ColumnsShear WallsƟmax
(rad)
(DL-SD)(SD-NC)(DL-SD)(SD-NC)(>NC)ColumnShear-Wall
Kocaeli Ex isolated13.250.0120.70822054000.01090.0083
Kocaeli-Ex fixed17.260.0140.6432088120.01250.008
Kocaeli Ey isolated13.430.0090.76433065460.008060.014
Kocaeli-Ey fixed16.440.0110.718390110690.00950.0125
Design Ex isolated5.880.0020.126200000.000160
Design Ex fixed9.60.0050.15300000.002280
Design Ey isolated5.470.0010.1260000000
Design Ey fixed6.780.0020.129304000.000740.00029
Duzce Ex isolated8.630.0050.269907000.003120.00057
Duzce Ex fixed11.90.0080.26112051000.00440.0019
Duzce Ey isolated12.220.0040.2941208000.0020.000459
Duzce Ey fixed15.840.0060.27318028000.00370.00205
Erzincan Ex isolated7.180.0130.70822059000.01070.0064
Erzincan Ex fixed9.840.0160.70227076100.01180.0066
Erzincan Ey isolated6.040.010.70838047160.01080.0108
Erzincan Ey fixed8.630.0130.71940091180.01270.0125
Disclaimer/Publisher’s Note: The statements, opinions and data contained in all publications are solely those of the individual author(s) and contributor(s) and not of MDPI and/or the editor(s). MDPI and/or the editor(s) disclaim responsibility for any injury to people or property resulting from any ideas, methods, instructions or products referred to in the content.