Article

The Influence of Operation Platform on the Energy Consumption of Container Handling

1
Policy Research Center, Tianjin Research Institute for Water Transport Engineering, M.O.T., Tianjin 300456, China
2
National Engineering Research Center of Port Hydraulic Construction Technology, Tianjin 300456, China
*
Author to whom correspondence should be addressed.
Sustainability 2023, 15(1), 385; https://doi.org/10.3390/su15010385
Submission received: 14 November 2022 / Revised: 17 December 2022 / Accepted: 21 December 2022 / Published: 26 December 2022

Abstract

:
Because container terminals are facing pressure to achieve carbon neutrality in China, saving energy has become an important objective of container terminals. This paper analyzed the movement path of containers between the quay carne and the yard, and found that paths in the vertical direction existed, requiring unnecessary energy consumption. To solve the unnecessary energy consumption problem, a completely new work mode called the high platform operation mode was proposed. In this new mode, a high platform is built above the yard and container trucks drive onto the high platform. By building an energy consumption model to compare the energy consumption of the traditional and new modes, we found that the new mode is able to save 1.478 kWh of electricity compared to the traditional mode when handling one container. A terminal company in Tianjin Port was taken as an example to examine and validate the efficiency of the proposed mode. The computational results indicate that the electricity saved in 12 years would be able to cover the cost of building the high platform, meaning that the new mode could reduce container terminals’ energy consumption and accelerate the achievement of carbon neutrality.

1. Introduction

In order to realize the goals of the Paris Agreement on climate change, the International Maritime Organization (IMO) has committed to a strategy to reduce international shipping emissions by at least 50% by 2050 compared to 2008 levels. As an important part of international shipping, emissions from ports are also significant. For this reason, the concept of “Green Ports” was established [1]. Green ports are those that favor healthy ecological environments and strive for a reasonable use of resources, low energy consumption and low pollution levels [2]. In this context, reducing energy consumption is an important way of building green ports.
In Section 2, a literature review on reducing energy consumption through quay crane scheduling, yard scheduling, truck scheduling and terminals layout is presented. These studies have one thing in common, which is that they are based on current modes of container handling operation. No scholars have studied changing the current mode to build new high platforms above container yards. In this new mode, containers are still stacked in the original yard, while trucks for loading and unloading ships and yard cranes are assigned to drive on the new platform.
The reason for proposing the building of these new high platforms is that we found unnecessary energy consumption with the use of existing paths in the vertical direction by analyzing the movement path of containers between the quay crane and the yard (Section 3). Therefore, in Section 4 we developed energy consumption models for the new mode and the traditional mode. To verify the validity of the new mode, we carried out a case study and analyzed the economic benefit. The results indicated that the new mode could result in a reduction in energy consumption compared to traditional mode, and that the electricity saved would be able to cover the cost of building the high platform (Section 5). The conclusions are drawn in Section 6, and further research directions are also proposed.

2. Literature Review

Reasonable container-handling operations can improve efficiency and reduce energy consumption during loading and unloading, which are operations that have great significance for energy saving. Numerous quantitative models of quay-crane scheduling, yard scheduling, truck scheduling and terminal layout have been proposed with the aim of reducing energy consumption [3,4,5,6,7,8,9,10].
Regarding the quay-crane scheduling aspect, Ref. [5] considered the coordinated scheduling of quay cranes, internal trucks and yard cranes with the objective of minimizing the total departure delay and transportation energy consumption, realizing an optimal trade-off between savings of time and energy. Ref. [11] studied the allocation and scheduling problem of a single ship-quay crane, and established an AGV queuing model with the goal of minimizing carbon dioxide emissions during unloading. Ref. [12] formulated a mixed integrated programming model to address quay-crane scheduling in an automated container terminal to achieve a trade-off between operation efficiency and energy consumption. Ref. [2] used two mixed-integer programming models to solve the integrated quay-crane assignment and scheduling problem while taking into consideration carbon-regulatory policies.
With respect to the yard scheduling aspect, Ref. [13] proposed a mixed-storage strategy in which outbound and inbound containers were stacked in the same bay, but in different rows. Ref. [14] evaluated the effect of a mixed-storage strategy, and designed stacking principles for mixed storage. Their study indicated that using a mixed-storage strategy could reduce the travel distance and the number of trucks. The Hong Kong port is already using mixed storage. Ref. [6] used a dual-cycle strategy to focus on a quay-crane and yard-truck scheduling problem in conjunction with a mixed-storage strategy. This strategy could significantly reduce empty trips and the number of reshuffling operations. Ref. [15] developed a dual model that was able to achieve the shortest total task completion time and the minimum total energy consumption in the traditional yard-crane scheduling problem with high efficiency and light environmental protection, and designed a comprehensive simulation-optimization method to solve this problem. Ref. [4] developed an integer-programming model to optimize the parameters in the container terminal yard-scheduling problem with the purpose of minimizing the total energy consumption of rubber-tired gantry cranes. In their research, they were able to reduce the movements of the yard crane. Ref. [7] proposed a digital-twin-driven energy-efficient multi-crane scheduling and crane-number-selection approach. Their study was able to reduce energy consumption in transportation using multi-crane systems.
With respect to the truck-scheduling aspect, Ref. [16] put forward a dynamic allocation rule and path optimization model addressing the trailer routing problem at a maritime container terminal, and dynamic scheduling was able to shorten the driving distance of empty container trucks. Ref. [17] studied the integrated scheduling problem of crane handling and trucking with consideration of some of the unique characteristics of container terminals, in which yard trucks are shared among different ships, and designed a three-stage algorithm to obtain an overall solution that was not only able to improve equipment coordination, but was also able to improve the efficiency of the terminal. Ref. [18] addressed the truck-routing problem considering truck energy consumption and carbon emissions. They built a model with the goal of minimizing fixed costs, variable costs, and generated carbon emissions, and designed a multi-objective optimization algorithm based on simulated annealing and a multi-objective decision-support system based on the mobile cloud. Ref. [8] formulated a multi-objective optimization model to address integrated scheduling of yard cranes, external trucks, and internal trucks in a maritime container-terminal operation. In their research, they were able to reduce both the total longitudinal distance of the yard cranes and the total waiting time of internal and external trucks.
With respect to the terminal-layout aspect, there are three main types of container terminals, i.e., parallel, perpendicular and U-shaped layout. The parallel layout is the typical terminal layout. Most studies are based on parallel layouts [19]. Several studies have focused on resolving layout-optimization problems under perpendicular layout, i.e., block length and width, to realize emission reduction and efficiency improvement [20,21,22]. Ref. [23] proposed a multi-equipment coordinated scheduling strategy of s U- shaped layout automated to reduce the overall operation energy. Refs. [24,25,26] studied equipment scheduling problems in U- shaped terminals to improve efficiency. Ref. [27] estimated the energy consumption and CO2 emissions in container terminals according to their layouts and the results of the case study indicated that CO2 emissions in parallel and perpendicular layouts were relatively similar Ref. [28] conducted detailed simulation research on different types of layout designs to compare their terminal performance from efficiency, economic and environment perspectives. Their study indicated that U-type automated terminals have the lowest energy consumption and operation costs in most cases.
These studies were based on current modes of container handling operation. There have been no studies on changing the current mode by building new high platforms above container yards in order to reduce energy consumption. Therefore, we propose a new operation mode to achieve minimum energy consumption during container handling.

3. Problem Description

3.1. Work Scope and Process

The scope of container handling is a three-dimensional space, which extends to the whole yard with the quay-crane side as the horizontal boundary. In the vertical direction, the lower boundary is the yard ground, and the upper boundary is a certain height from which containers are ready to be lowered down to a container truck. This paper refers to this three-dimensional space as the workspace of container handling and takes imported containers as an example to introduce the handling process and corresponding energy consumption in the workspace.

3.2. Energy Consumption

Regarding the process of imported container handling, firstly, a quay crane hoists a container from the ship to a container truck; secondly, the container truck transports the container to the storage yard; thirdly, the yard crane stocks the container; finally, the empty container truck returns to the quay crane in preparation for loading the next container. During this process, the corresponding energy consumption consists of seven aspects: (1) the energy consumption of the quay crane when lowering the container vertically from the upper boundary of the workspace; (2) the energy consumption of the container truck when transporting the container from the quay crane to the yard crane; (3) the energy consumption of the yard crane when hoisting the container vertically from the truck to a certain height; (4) the energy consumption of the yard crane when moving the container horizontally for a certain distance; (5) the energy consumption of the yard crane when lowering the container vertically to the predetermined position in the yard; (6) the energy consumption of the empty container truck during the trip from the yard crane to the quay crane; (7) the energy consumption of the yard-crane spreader and quay-crane spreader when returning to their original positions.

3.3. Existing Problems

By analyzing the change in location of an imported container, we determined that unnecessary energy consumption exists with respect to seven aspects. The container’s location changes five times in the workspace, as shown in Figure 1.
X1 is the distance that the container moves vertically from a certain height to the container truck by quay crane. X2 is the distance that the container moves horizontally from the quay crane to the yard crane by container truck. X3 is the distance that the container moves vertically from the container truck to a certain height. X4 is the distance that the container moves horizontally by yard crane. X5 is the distance that the container moves vertically by yard crane. There are unnecessarily repeated energy-consuming paths, represented by X1, X3 and X5. The effective movement distance of the container in the vertical direction is X1X5. However, it is a fact that the actual vertical movement distance of the container is X1 + X3 + X5. Therefore, the unnecessary repeated energy-consuming path is equal to X3 + 2X5. To reduce the unnecessary energy-consuming paths (X3 + 2X5), this paper proposes a new operation mode.

4. Theoretical Model

In this paper, the operation mode in which the container truck drives on the ground is defined as the traditional low-platform operation mode. l1 represents the low platform (i.e., the ground). In the traditional low-platform operation mode, all of the quay cranes, yard cranes and trucks work on l1. To change the traditional low-platform operation mode, this paper proposes a new high-platform operation mode. The built high platform is located over the container yard, and l2 represents the high platform. In the new high-platform operation mode, all of the quay cranes, yard cranes and trucks are on l2, while the container yard is still located on l1. The area of l2 located above the containers in the yard includes an open rectangle, so that the spreader of the yard crane is able to be lifted and lowered in order to handle containers through this open rectangle. To make a comparison of the energy consumption of container handling between the traditional mode and new mode, a model is built in this paper.

4.1. Assumptions of the Model

The model makes the following assumptions.
(1)
The study is carried out under ideal conditions, so there is no friction or energy loss.
(2)
All of the imported containers are 20 ft standard containers, and all of the quay cranes, yard cranes and trucks have the same dimensions.
(3)
If a container needs to cross over another container by yard crane, the vertical distance between the bottom of the upper container and the top of the lower container can be no less than the fixed value d1.
(4)
If the spreader needs to cross over a container, the vertical distance between the spreader and the container can be zero.

4.2. Model Building

(1)
Traditional low-platform operation mode
When handling imported containers in the workspace using the traditional low-platform operation mode, there are eight phases in a complete operational loop.
Phase 1: The spreader of the quay crane vertically lowers the container onto the container truck.
Phase 2: The container truck transports the container horizontally from the quay crane to the yard crane.
Phase 3: The spreader of the yard crane vertically hoists the container from the container truck to a certain height.
Phase 4: The spreader of the yard crane moves the container horizontally a certain distance.
Phase 5: The spreader of the yard crane vertically lowers the container to a predetermined position in the yard.
Phase 6: The spreader of the yard crane rises vertically to a certain height.
Phase 7: The spreader of the yard crane moves horizontally to a position above the truck.
Phase 8: The spreader of the yard crane is vertically lowered in preparation to hoist the next container.
After the completion of Phase 1 and Phase 2, the spreader of the quay crane and the container truck return to their original positions. These operations occur in parallel with other phases, so it is assumed that two separate operations occur during Phase 2 and Phase 3.
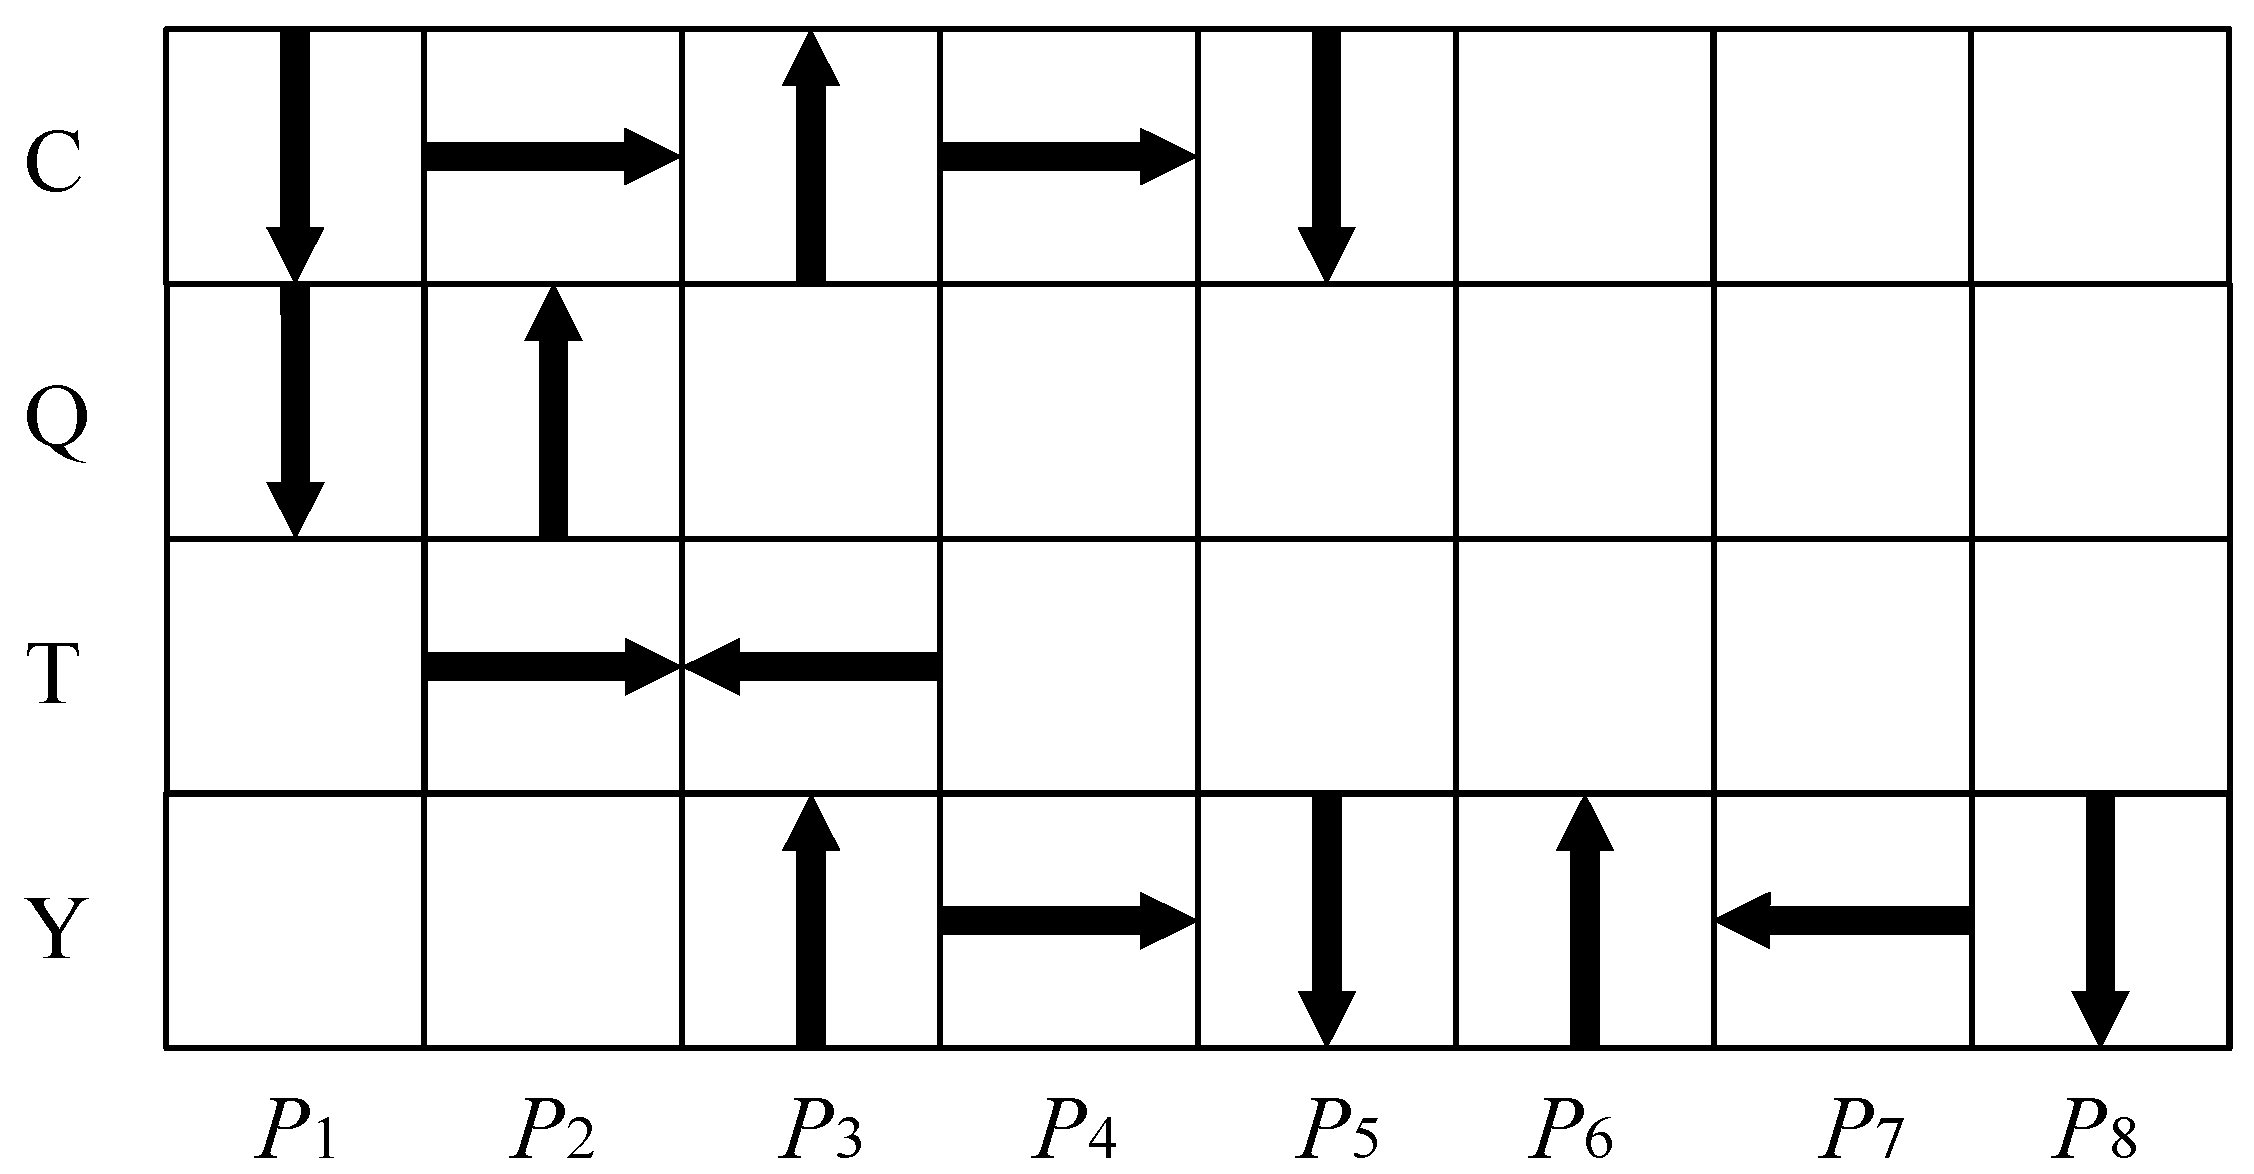
The movement of the container (C), the spreader of the quay crane (Q), the container truck (T) and the spreader of the yard crane (Y) in each phase are shown in the Figure 2.
The energy consumption E required to complete i operation loops when using the traditional low-platform operation mode is as follows:
E = i ( E P 1 + E P 2 + E P 3 + E P 4 + E P 5 + E P 6 + E P 7 + E P 8 ) .
i represents the i-th container, and it also represents the i-th operation loop.
E P 1 , ……, E P 8 are the values of energy consumption in the corresponding phases.
According to Figure 2:
E = i ( E Q v i + E T h i + E i Q v + + E Y v i + + E i T h + E Y h i + E Y v i + E i Y v + + E i Y h + E i Y v ) .
In the formula:
“+”, “−” represent the direction of motion—upward and downward, respectively;
E Q v i represents the energy consumption of the quay-crane spreader when vertically hoisting container i in Phase 2;
E T h i represents the energy consumption of the container truck when horizontally transporting container i in Phase 2;
E i Q v + represents the energy consumption of the quay-crane spreader when being vertically lifted in the i-th operation loop in Phase 2;
E Y v i + represents the energy consumption of the yard-crane spreader when vertically hoisting container i in Phase 3;
E i T h   represents the energy consumption of container truck when horizontally driving in the i-th operation loop in Phase 3;
E Y h i represents the energy consumption of the yard-crane spreader when moving container i horizontally in Phase 4;
E Y v i represents the energy consumption of the yard-crane spreader when vertically lowering container i in Phase 5;
E i Y v + represents the energy consumption of the yard-crane spreader when being vertically lifted in the i-th operation loop in Phase 6;
E i Y h represents the energy consumption of the yard-crane spreader when moving horizontally in the i-th operation loop in Phase 7;
E i Y v represents the energy consumption of the yard-crane spreader when vertically lowering for handling next container in the i-th operation loop in Phase 8.
(2)
New high-platform operation mode
A complete operational loop in new high-platform operation mode has eight phases.
Phase1: The spreader of the quay crane vertically lowers the container onto the container truck.
Phase2: The container truck transports the container horizontally from the quay crane to the yard crane.
Phase3: The spreader of the yard crane hoists the container vertically from the container truck to a certain height.
Phase 4: The spreader of the yard crane moves the container horizontally a certain distance.
Phase 5: The spreader of the yard crane vertically lowers the container to the predetermined position in the yard.
Phase 6: The spreader of the yard crane vertically rises to a certain height.
Phase 7: The spreader of the yard crane horizontally moves to a position above the truck.
As in the traditional mode, it is assumed that the operation of the quay-crane spreader and the container truck returning to their original positions occur in Phase 2 and Phase 3.
Compared to the traditional model, the new mode has two differences. One is that there is no Phase 8. The other is that the certain height is a fixed value d2 for Phase 3, because the container moves down after Phase 3. The movements of the container (C), the spreader of the quay crane (Q), the container truck (T) and the spreader of the yard crane (Y) in each phase are shown in the Figure 3.
In the new mode, the energy consumption required to complete i operation loops is as follows:
E * = i ( E P 1 + E P 2 + E P 3 + E P 4 + E P 5 + E P 6 + E P 7 ) ,
E * = i ( E Q v i * + E T h i * + E i Q v * + + E Y v i * + + E i T h * + E Y h i * + E Y v i * + E i Y v * + + E i Y h * ) .
In Equation (4):
E * represents the energy consumption required to complete i operation loops when using the new high-platform operation mode;
E Q v i * represents the energy consumption of the quay-crane spreader when vertically lowering container i in Phase 2;
E T h i * represents the energy consumption of the container truck when horizontally transporting container i in Phase 2;
E i Q v * + represents the energy consumption of the quay-crane spreader when being vertically lifted in the i-th operation loop in Phase 2;
E Y v i * + represents the energy consumption of the yard-crane spreader when vertically hoisting the container i in Phase 3;
E i T h * represents the energy consumption of the container truck when horizontally driving in the i-th operation loop in Phase 3;
E Y h i * represents the energy consumption of the yard-crane spreader when moving container i horizontally in Phase 4;
E Y v i * represents the energy consumption of the yard-crane spreader when vertically lowering container i in Phase 5;
E i Y v + represents the energy consumption of the yard-crane spreader when being vertically lifted in the i-th operation loop in Phase 6;
E i Y h * represents the energy consumption of the yard-crane spreader when moving horizontally in the i-th operation loop in Phase 7.
(3)
Model of energy consumption difference
The model is as follows.
Δ E = E * E = i ( Δ E P 1 + Δ E P 2 + Δ E P 3 + Δ E P 4 + Δ E P 5 + Δ E P 6 + Δ E P 7 E P 8 ) ,
Δ E = i ( Δ E Q v i * + Δ E T h i * + Δ E i Q v * + + Δ E Y v i * + + Δ E i T v * + Δ E Y h i * + Δ E Y v i * + Δ E i Y v * + + Δ E i Y h * E i Y v ) .
Δ E is the difference in energy consumption between the new mode and the traditional mode.

5. Calculation and Analysis

5.1. Example Description

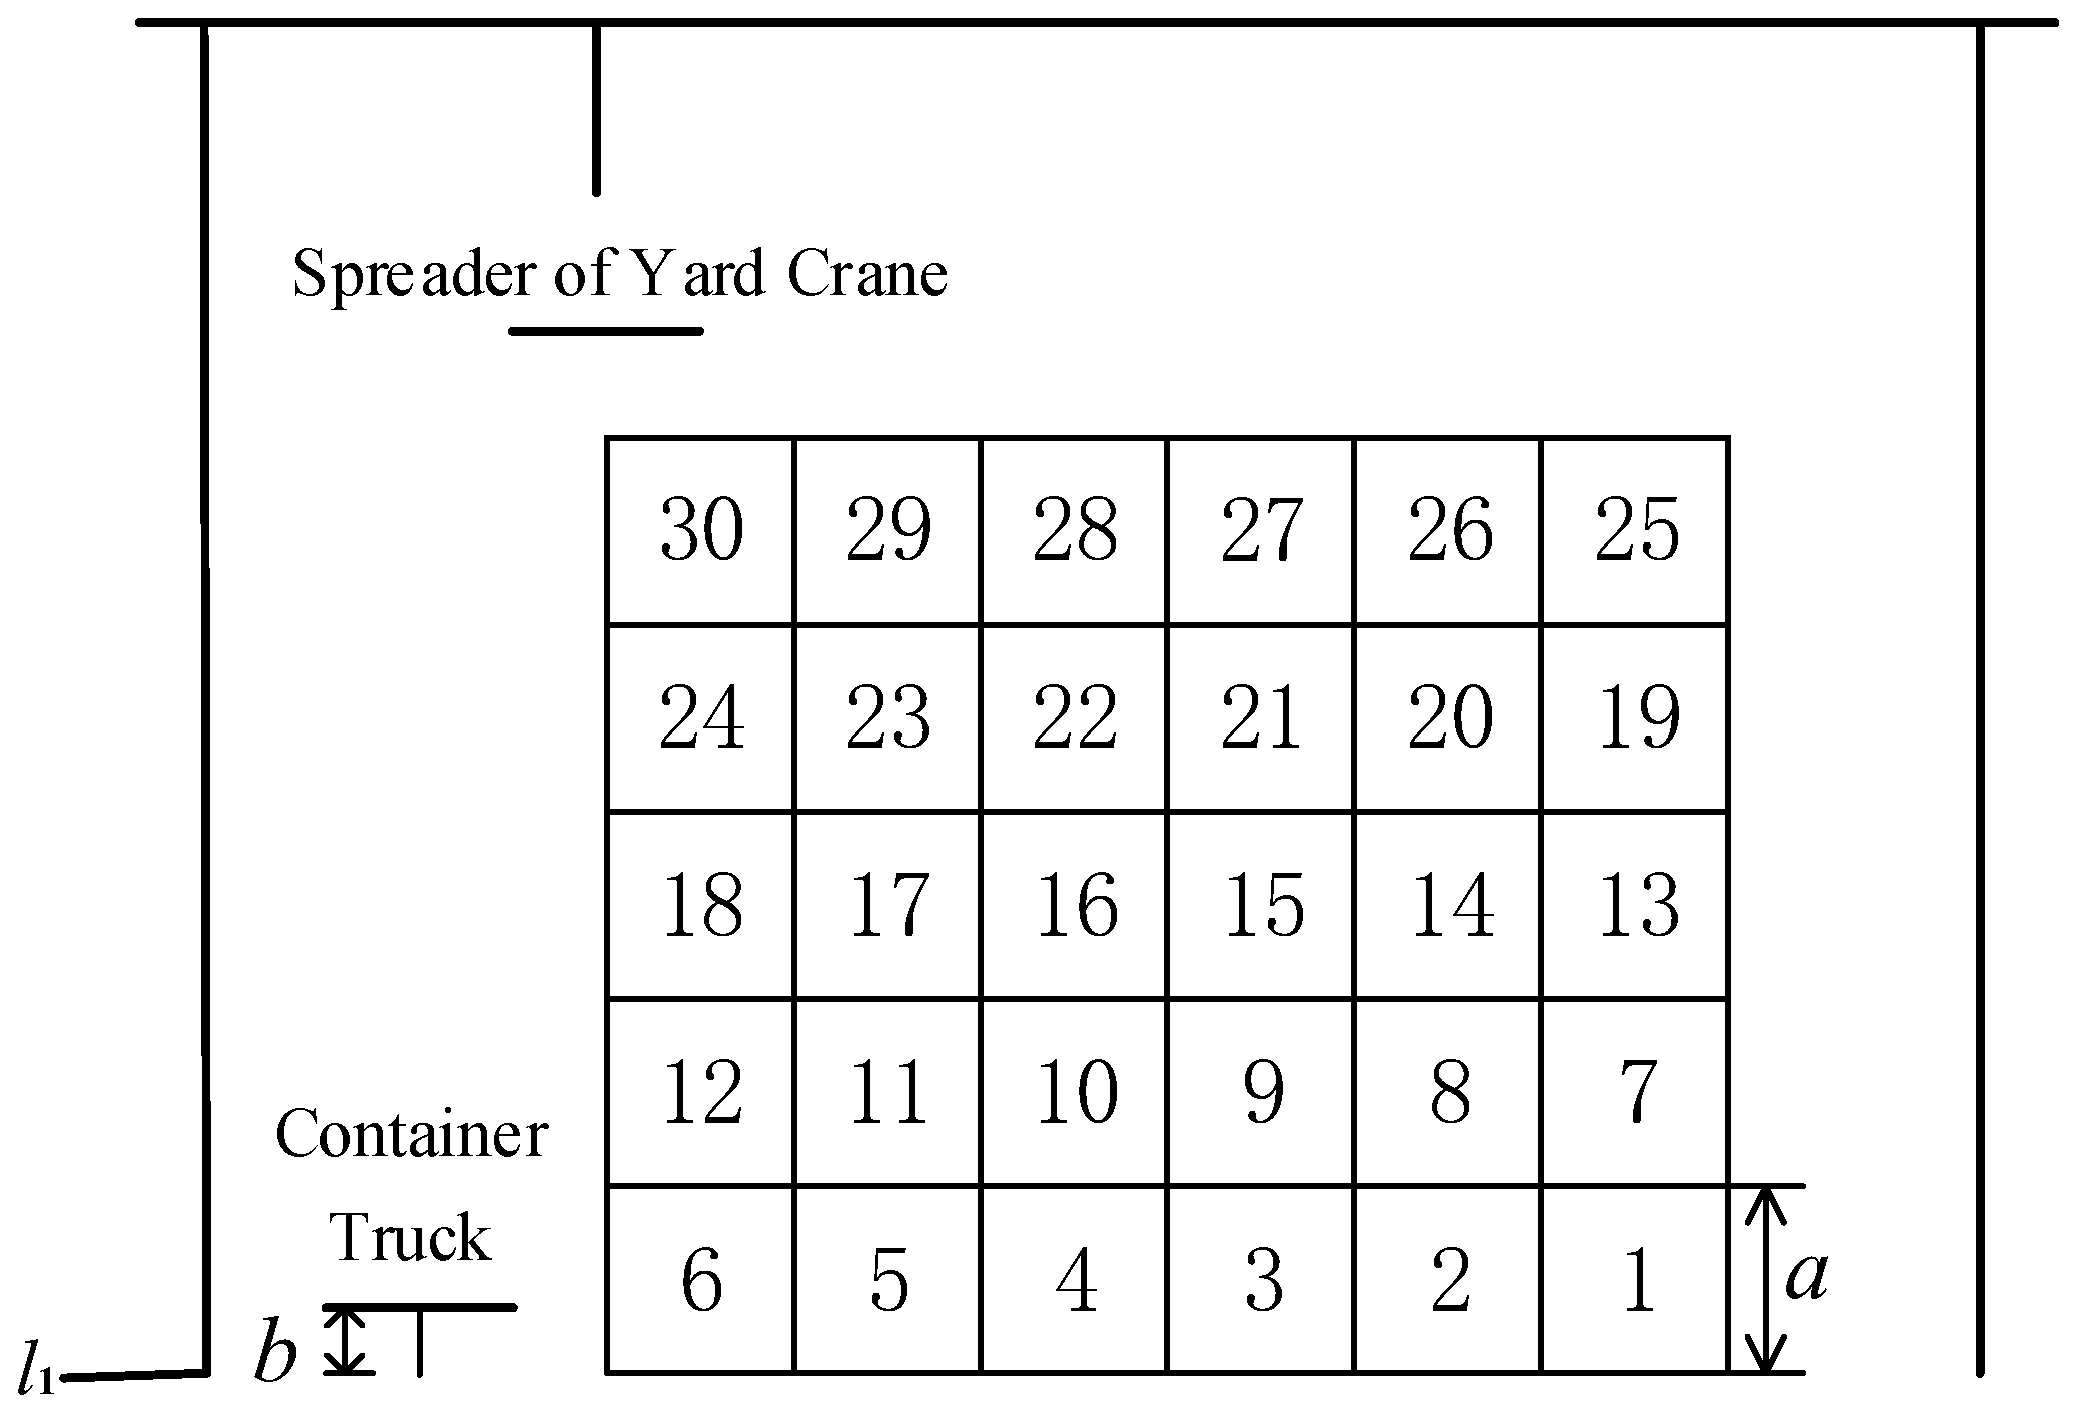
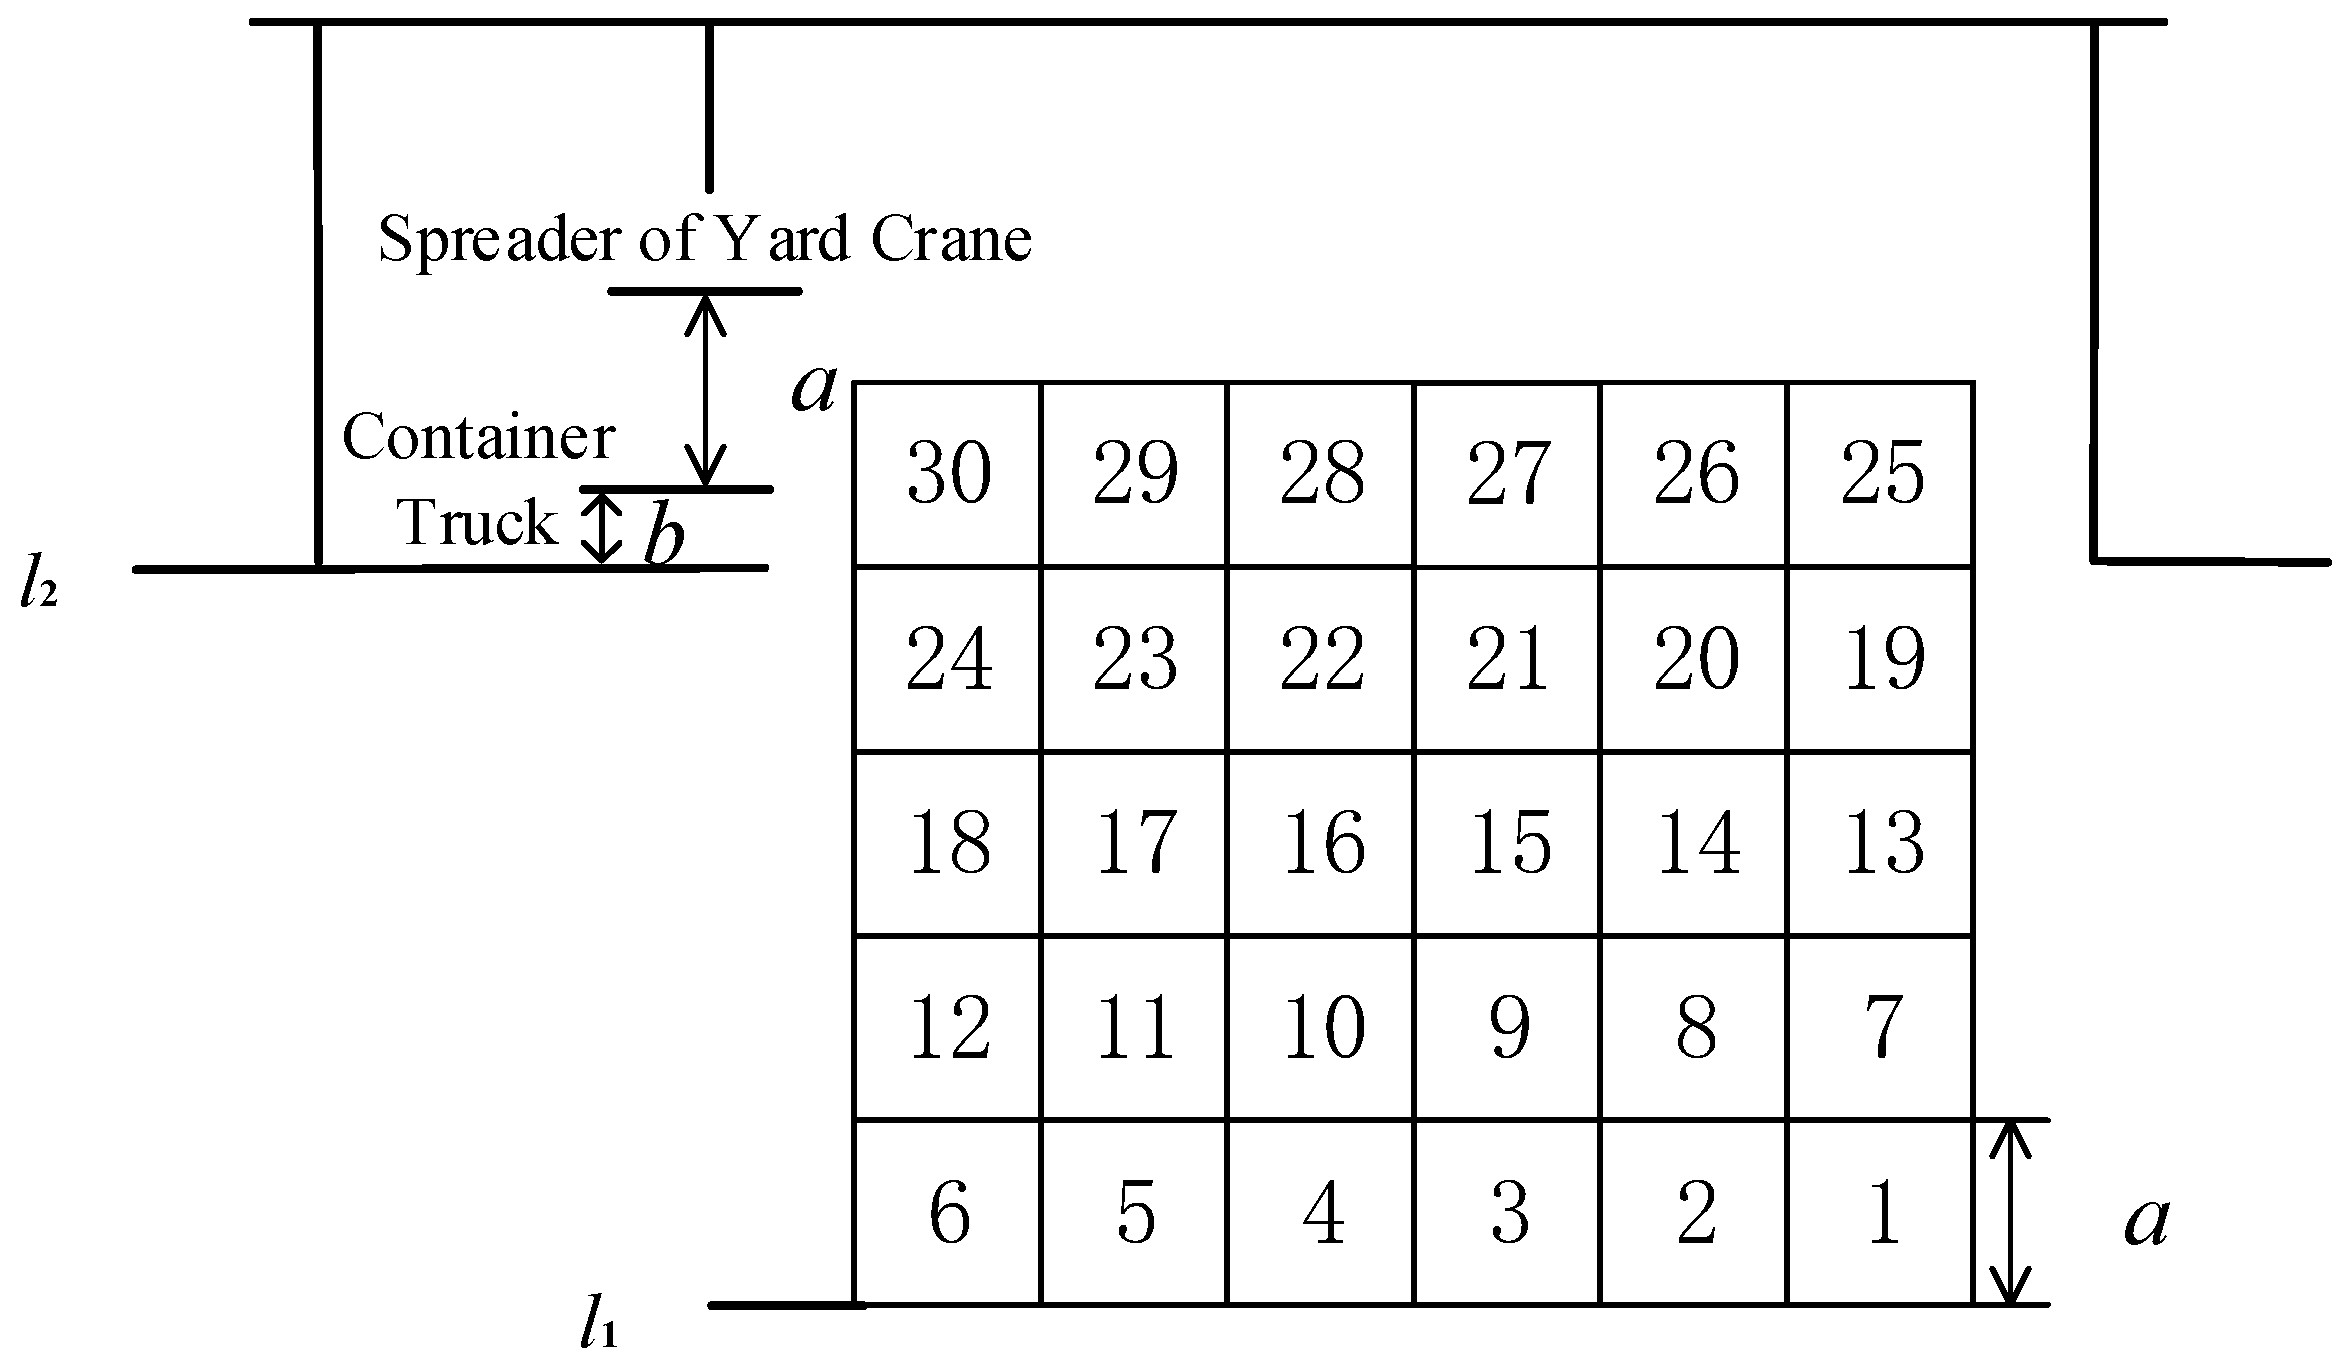
At present, containers are usually stacked in layers four to five deep in the container yard of an automatic terminal. In the example presented in this paper, the number of layers of containers in the yard is set to five, and there are 30 containers to handle. The quay crane unloads 30 containers from the same bay of the container ship and stores them in the same bay in the yard. The numbers provided for the containers in Figure 4 or Figure 5 represent their order of handling. Figure 4 and Figure 5 present the layout of the containers and equipment in the traditional and new mode, respectively.

5.2. Model Calculation

According to Equation (6), the energy consumption includes energy in the vertical direction and in the horizontal direction. The energy consumption in the vertical direction can be calculated as follows.
Δ E Q v i * = ( m C + m Q S ) · g · ( h Q v i * h Q v i ) ,
Δ E i Q v * + = m Q S · g · ( h i Q v * h i Q v ) ,
Δ E Y v i * + = ( m C + m Y S ) · g · ( d 2 h Y v i + ) ,
Δ E Y v i * = ( m C + m Y S ) · g · ( h Y v i * h Y v i ) ,
Δ E i Y v * + = m Y S · g · ( h i Y v * + h i Y v + ) ,
E i Y v = m Y S · g · h i Y v ,
h Q v i * = h 0 * h 1 , *
h i Q v = h 0 h 1 .
In Equations (7)–(14):
m C   represents the quality of the container, and the unit is kg;
m Q S represents the quality of the quay-crane spreader, and the unit is kg;
m Y S represents the quality of the yard-crane spreader, and the unit is kg;
h Q v i * represents the vertical distance that the quay-crane spreader moves in the new mode in Phase 1, and the unit is m;
h Q v i   represents the vertical distance that the quay-crane spreader moves in the traditional mode in Phase 1, and the unit is m;
h i Q v * represents the vertical distance that the quay-crane spreader moves in the new mode in Phase 3, and the unit is m;
h i Q v represents the vertical distance that the quay-crane spreader moves in the traditional mode in Phase 3, and the unit is m;
h Y v i * + represents the vertical distance that the yard-crane spreader moves in the new mode in Phase 3, the value of h Y v i * + is set to d2, and the unit is m;
h Y v i + represents the vertical distance that the yard-crane spreader moves in the traditional mode in Phase 3, and the unit is m;
h Y v i * represents the vertical distance that the yard-crane spreader moves in the new mode in Phase 5, and the unit is m;
h Y v i represents the vertical distance that the yard-crane spreader moves in the traditional mode in Phase 5, and the unit is m;
h i Y v * + represents the vertical distance that the yard-crane spreader moves in the new mode in Phase 6, and the unit is m;
h i Y v + represents the vertical distance that the yard-crane spreader moves in the traditional mode in Phase 6, and the unit is m;
h i Y v represents the vertical distance that the yard-crane spreader moves in the traditional mode in Phase 8, and the unit is m;
h 0 * represents initial height of the quay-crane spreader in new mode and also represents the height of upper boundary of workspace, and the unit is m;
h 1 * represents the vertical distance from l1 to the upper layer of the container, when the container has been loaded onto the truck in the new mode, and the unit is m;
h 0 represents the initial height of the quay-crane spreader in the traditional mode, and also represents the height of the upper boundary of the workspace, and the unit is m;
h 1 represents the vertical distance from l1 to the upper layer of the container, when the container has been loaded onto the truck in the traditional mode, and the unit is m;
g represents gravitational acceleration and is 9.8 m/s2.
l1 is set as the foundation, and the height is 0 m. a represents the height of the container. b represents the height of the container truck platform. As containers are stacked in layers five containers deep, the height of l2 is set to 4a; then:
h 0 * = h 0 = 5 a + b ,
h 1 * = 5 a + b ,
h 1 = b .
For horizontal operation, because both the truck track and the spreader track are the same on l1 and l2, the energy consumption of the truck and the spreader will be the same between the two modes; therefore:
Δ E T h i * = Δ E i T v * = 0 ,
Δ E Y h i * = Δ E i Y h * = 0 .
Then, we have:
Δ E = i [ ( m C + m Q S ) · g · ( 5 a ) + m Q S · g · ( 5 a ) + ( m C + m Y S ) · g · ( h Y v i * + h Y v i + ) + ( m C + m Y S ) · g · ( h Y v i * h Y v i ) + m Y S · g · ( h i Y v * + h i Y v + ) m Y S · g · h i Y v ] .
Because the energy consumption required to move containers vertically to the same height is the same, 30 containers are divided into five groups (1–6, 7–12, 13–18, 19–24, 25–30). Therefore,
Δ E = 6 ( Δ E 1 + Δ E 7 + Δ E 13 + Δ E 19 + Δ E 25 ) .
Table 1 shows the computational results of the relevant parameters in Equations (20) and (21).
Finally, taking Equation (20) and Table 1 in Equation (21), we have:
Δ E = ( 150 a + 48 b 48 d 1 + 48 d 2 ) · m C · g 300 a · m Q S · g + ( 30 a + 96 b 48 d 1 + 48 d 2 ) · m Y S · g .
Table 2 presents the computational results of the relevant parameters.
Then, we have:
Δ E = 154,432,320   J ,     m C = 20,000 ,
Δ E = 17,369,520   J ,     m C = 2000 .
As shown in Equations (23) and (24), if all 30 containers are heavy containers, the energy consumption in the new mode is less than that in the traditional mode by 154,432,320 J (42.898 kWh); if all 30 containers are empty containers, the energy consumption in the new mode is less than that in the traditional mode by 17,369,520 J (4.825 kWh).
Tianjin Port in China is taken as an example. The container throughput of Tianjin Port was 20.27 million TEU in 2021, and the proportion of empty containers was 30%. According to the calculated weighted average, 29.9627 million kWh of electricity could be saved by using the new high-platform operation mode. On average, the new mode could save 1.478 kWh of electricity when handling one container.

5.3. Economic Benefit Estimation

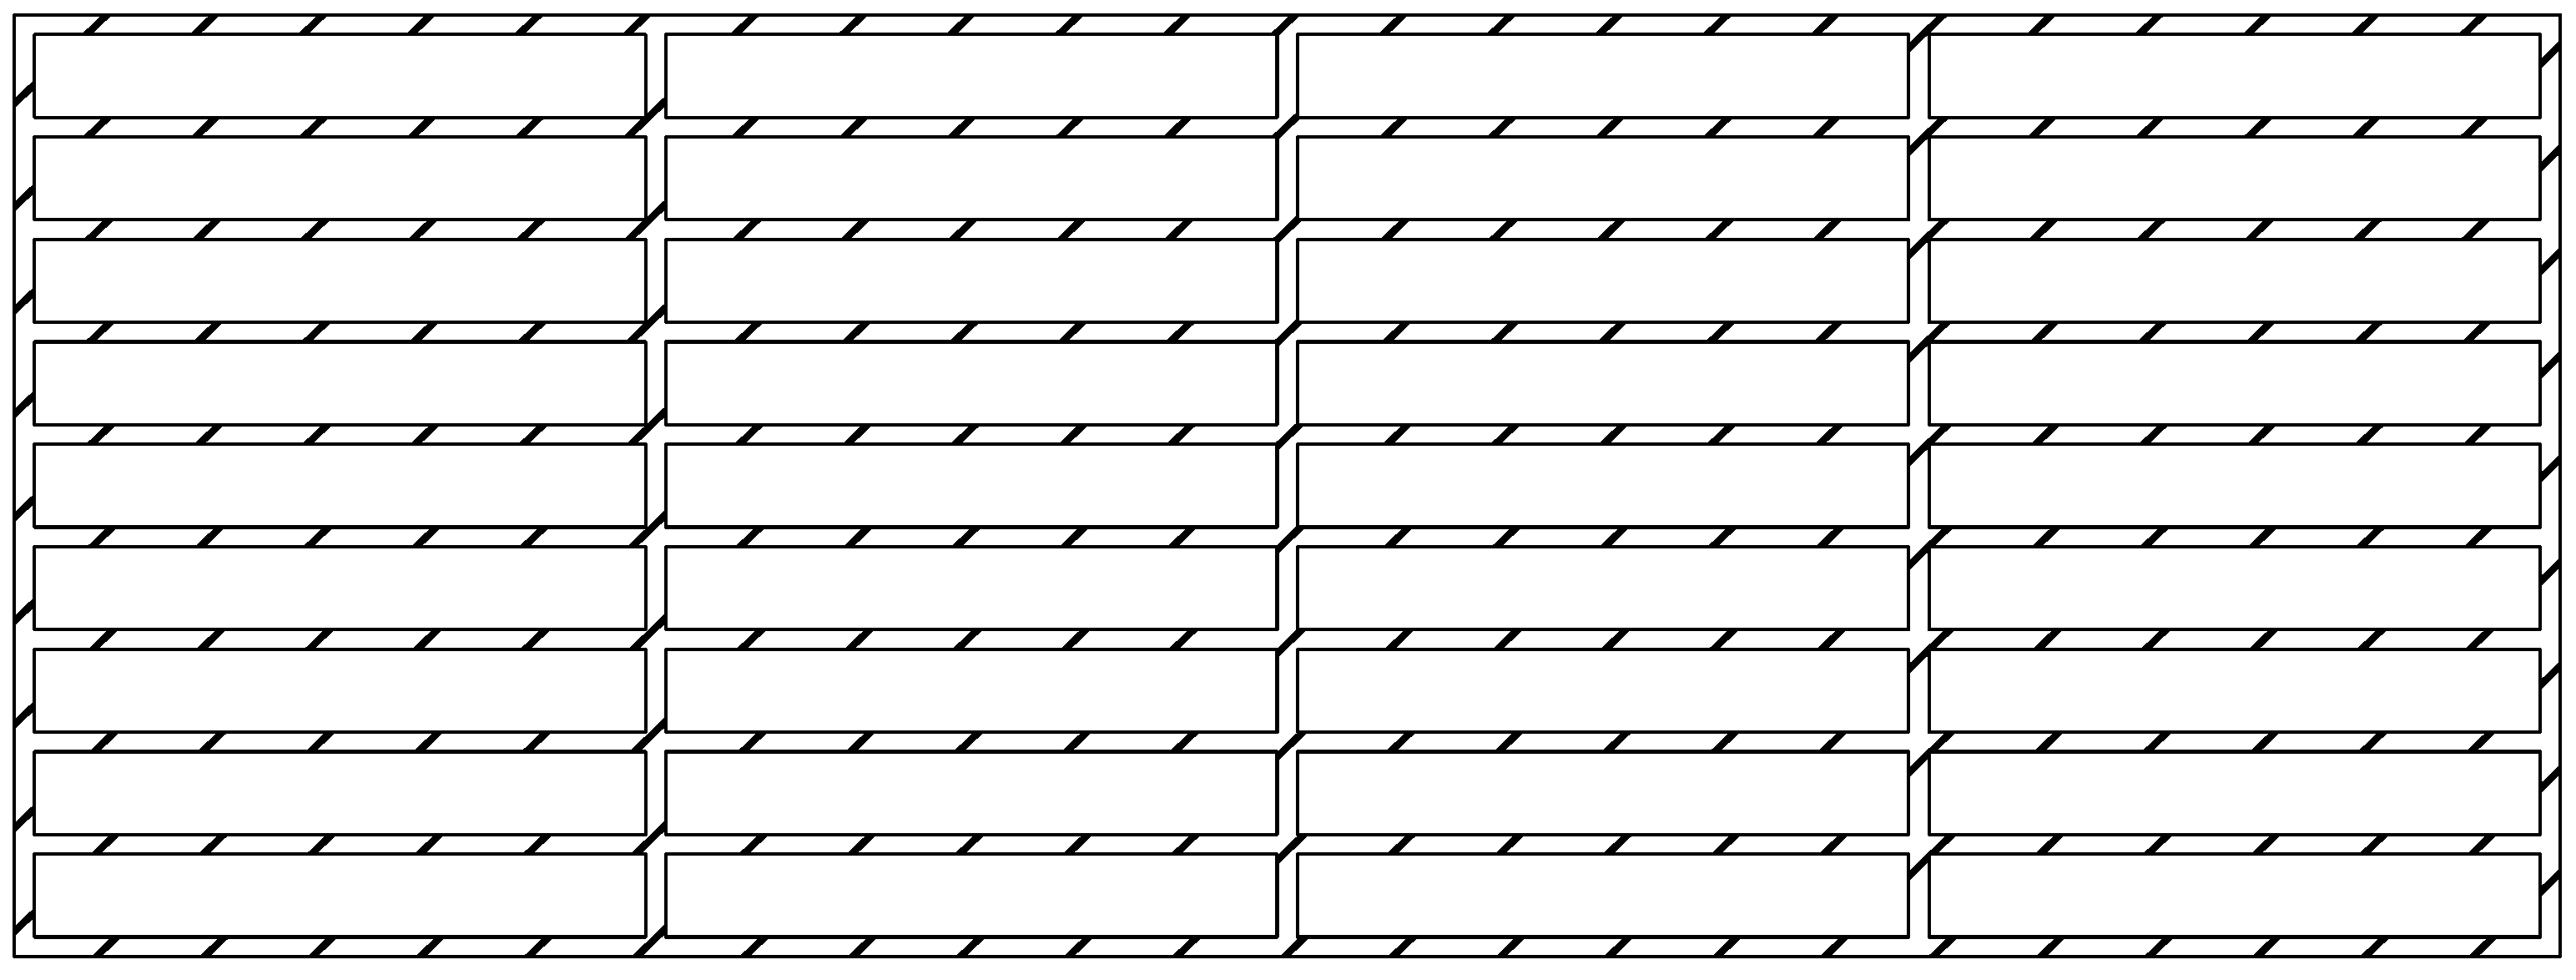
We take Tianjin Port Alliance International Container Terminal Co., Ltd. as an example in order to estimate the economic benefit of the new mode. We assume that the terminal builds the high platform. The new high platform consists of columns and platforms. The columns and platforms are constructed using steel-reinforced concrete. Figure 6 presents a diagram of the platform.
Diagram of the high platform:
v p represents the volume of steel-reinforced concrete required to build the platform;
v c represents the volume of steel-reinforced concrete required to build the columns;
l p represents the length of the platform (main storage yard);
w p represents the width of the platform (main storage yard);
t p represents the thickness of the platform;
n h represents the number of horizontal roads on the platform;
n l represents the number of longitudinal roads on the platform;
w r represents the width of the road;
l r represents the total length of all roads, where l r = l p · n h + ( w p n h · w r ) · n l ;
r c represents the radius of the column;
h c represents the height of the column, where h c = 4 a t p ;
d c represents the distance between two columns;
n c represents the number of columns, where   n c = l r d c = l p · n h + ( w p n h · w r ) · n l d c ;
C represents the cost of building the high platform;
p represents the price per cubic meter of steel-reinforced concrete, which includes labor cost, material cost and installation cost.
Then, we have:
v p = l r · w r · t p = [ l p · n h + ( w p n h · w r ) · n l ] · w r · t p ,
v c = π · r c 2 · h c · n c = π · r c 2 · ( 4 a t p ) · l p · n h + ( w p n h · w r ) · n l d c ,
C = ( v p + v c ) · p .
The values of the relevant parameters are presented in Table 3.
Then, we have:
C = USD   7.19   million .
The container throughput of Tianjin Port Alliance International Container Terminal was 2.9 million TEU in 2021; therefore, the energy consumption of the terminal can be reduced by 4.2862 million kWh with the use of the new high-platform operation mode. The price per kWh of electricity is USD 0.1417 in China, so the terminal could save USD 0.5953 million in one year. It would take 12.08 years to recoup costs. The terminal-operation cycle is more than 30 years, so there are economic benefits to building the new platform, especially for busy ports.

6. Conclusions

Since container terminals in China are facing pressure to achieve carbon neutrality and to cap carbon emissions, saving energy has become an important objective of container terminals. In this paper, we propose an innovative new high-platform operation mode to reduce energy consumption. The major contributions of this paper with respect to other research are as follows:
(1)
We analyze the movement path of containers between the quay carne and the yard, and find that there are unnecessary energy-consuming paths in the vertical direction. As calculated in Section 3.3, the length of unnecessary energy-consuming paths is equal to X3 + 2X5.
(2)
To reduce the burden of unnecessary energy-consuming paths, we propose a new high-platform operation mode, where container trucks drive onto a high platform. By developing a model of energy consumption, we calculate that the new mode will be able to save 1.478 kWh of electricity compared to the traditional mode when handling a single container.
(3)
A terminal company in Tianjin Port is taken as an example to perform an economic benefit analysis. The results indicate that the electricity saved over about 12 years will be able to cover the cost of building the high platform.
There are some possibilities for further research. Firstly, further research and calculations are required with respect to the construction and cost of the platform. Secondly, as different terminals berth vessels that are different in both size and number, the optimal platform height requires further research in order to adapt it to the characteristics of different ports. Thirdly, not all ports are suitable for building high platforms, so the criteria for building new platforms need to be worked out.

Author Contributions

Conceptualization, X.L.; Methodology, R.Z. and X.L.; Data curation, L.Z.; Writing—review and editing, X.L., R.Z. and L.Z. All authors have read and agreed to the published version of the manuscript.

Funding

This research was funded by the National Key Research and Development Program, grant number 2022YFE0113500 and the Tianjin Key Research and Development Program, grant number 22YFZCSN00030.

Conflicts of Interest

The authors declare no conflict of interest.

References

  1. Yang, L.; Cai, Y.; Wei, Y.; Huang, S. Choice of technology for emission control in port areas: A supply chain perspective. J. Clean. Prod. 2019, 240, 118105. [Google Scholar] [CrossRef]
  2. Kenan, N.; Jebali, A.; Diabat, A. The integrated quay crane assignment and scheduling problems with carbon emissions considerations. Comput. Ind. Eng. 2022, 165, 107734. [Google Scholar] [CrossRef]
  3. Wei, M.; He, J.; Tan, C.; Yue, J. Quay crane scheduling with time windows constraints for automated container port. Ocean. Coast. Manag. 2023, 231, 106401. [Google Scholar] [CrossRef]
  4. Sha, M.; Zhang, T.; Lan, Y.; Zhou, X. Scheduling optimization of yard cranes with minimal energy consumption at container terminals. Comput. Ind. Eng. 2017, 113, 704–713. [Google Scholar] [CrossRef]
  5. He, J.; Huang, Y.; Yan, W.; Wang, S. Integrated internal truck, yard crane and quay crane scheduling in a container terminal considering energy consumption. Expert Syst. Appl. 2015, 42, 2464–2487. [Google Scholar] [CrossRef]
  6. Zhu, S.; Tan, Z.; Yang, Z.; Cai, L. Quay crane and yard truck dual-cycle scheduling with mixed storage strategy. Adv. Eng. Inform. 2022, 54, 101722. [Google Scholar] [CrossRef]
  7. Zhao, N.; Fu, Z.; Sun, Y.; Pu, X. Digital-twin driven energy-efficient multi-crane scheduling and crane number selection in workshops. J. Clean. Prod. 2022, 336, 130175. [Google Scholar] [CrossRef]
  8. Gao, Y.; Ge, Y.-E. Integrated scheduling of yard cranes, external trucks, and internal trucks in maritime container terminal operation. Marit. Policy Manag. 2022, 10, 1–22. [Google Scholar] [CrossRef]
  9. Yue, L.; Fan, H.; Zhai, C. Joint Configuration and Scheduling Optimization of a Dual-Trolley Quay Crane and Automatic Guided Vehicles with Consideration of Vessel Stability. Sustainability 2020, 12, 24. [Google Scholar] [CrossRef] [Green Version]
  10. He, J. Berth allocation and quay crane assignment in a container terminal for the trade-off between time-saving and energy-saving. Adv. Eng. Inform. 2016, 30, 390–405. [Google Scholar] [CrossRef]
  11. Liu, D.; Ge, Y.-E. Modeling assignment of quay cranes using queueing theory for minimizing C02 emission at a container terminal. Transp. Res. Part D 2018, 61, 140–151. [Google Scholar] [CrossRef]
  12. Tan, C.; Yan, W.; Yue, J. Quay crane scheduling in automated container terminal for the trade-off between operation efficiency and energy consumption. Adv. Eng. Inform. 2021, 48, 101285. [Google Scholar] [CrossRef]
  13. Chung, R.; Li, C.; Lin, W. Interblock crane deployment in container terminals. Transp. Sci. 2002, 36, 79–93. [Google Scholar] [CrossRef]
  14. Zhang, X.; Zeng, Q.; Yang, Z. Modeling the mixed storage strategy for quay crane double cycling in container terminals. Transp. Res. Part E 2016, 94, 171–187. [Google Scholar] [CrossRef]
  15. He, J.; Huang, Y.; Yan, W. Yard crane scheduling in a container terminal for the trade-off between efficiency and energy consumption. Adv. Eng. Inform. 2015, 29, 59–75. [Google Scholar] [CrossRef]
  16. Nishimura, E.; Imai, A.; Papadimitriou, S. Yard trailer routing at a maritime container terminal. Transp. Res. Part E 2005, 41, 53–76. [Google Scholar] [CrossRef] [Green Version]
  17. Chen, L.; Langevin, A.; Lu, Z. Integrated scheduling of crane handling and truck transportation in a maritime container terminal. Eur. J. Oper. Res. 2013, 225, 142–152. [Google Scholar] [CrossRef]
  18. Leonard, H.; Eduardo, L.-R.; Stefan, V. Multi-objective inter-terminal truck routing. Transp. Res. Part E 2017, 106, 178–202. [Google Scholar]
  19. Zhou, C.; Lee, B.K.; Li, H. Integrated optimization on yard crane scheduling and vehicle positioning at container yards. Transp. Res. Part E Logist. Transp. Rev. 2020, 138, 101966. [Google Scholar] [CrossRef]
  20. Gharehgozli, A.H.; Vernooij, F.G.; Zaerpour, N. A simulation study of the performance of twin automated stacking cranes at a seaport container terminal. Eur. J. Oper. Res. 2017, 261, 108–128. [Google Scholar] [CrossRef] [Green Version]
  21. Wang, N.; Chang, D.; Shi, X.; Yuan, J. Analysis and Design of Typical Automated Container Terminals Layout Considering Carbon Emissions. Sustainability 2019, 11, 2957. [Google Scholar] [CrossRef]
  22. Kemme, N. Effects of storage block layout and automated yard crane systems on the performance of seaport container terminals. OR Spectr. 2012, 34, 563–591. [Google Scholar] [CrossRef]
  23. Niu, Y.; Yu, F.; Yao, H.; Yang, Y. Multi-equipment coordinated scheduling strategy of U-shaped automated container terminal considering energy consumption. Comput. Ind. Eng. 2022, 174, 108804. [Google Scholar] [CrossRef]
  24. Li, J.; Yang, J.; Xu, B.; Yang, Y. Hybrid Scheduling for Multi-Equipment at U-Shape Trafficked Automated Terminal Based on Chaos Particle Swarm Optimization. J. Mar. Sci. Eng. 2021, 9, 1080. [Google Scholar] [CrossRef]
  25. Xu, B.; Jie, D.; Li, J.; Yang, Y. Integrated scheduling optimization of U-shaped automated container terminal under loading and unloading mode. Comput. Ind. Eng. 2021, 162, 107695. [Google Scholar] [CrossRef]
  26. Xiang, X.; Liu, C.; Lee, L.H.; Chew, E.P. Performance Estimation and Design Optimization of a Congested Automated Container Terminal. IEEE Trans. Autom. Sci. Eng. 2022, 19, 2437–2449. [Google Scholar] [CrossRef]
  27. Budiyanto, M.A.; Huzaifi, M.H.; Sirait, S.J.; Prayoga, P.H.N. Evaluation of CO2 emissions and energy use with different container terminal layouts. Sci. Rep. 2021, 11, 5476. [Google Scholar] [CrossRef]
  28. Li, X.; Peng, Y.; Huang, J.; Wang, W. Simulation study on terminal layout in automated container terminals from efficiency, economic and environment perspectives. Ocean. Coast. Manag. 2021, 213, 105882. [Google Scholar] [CrossRef]
Figure 1. Movement of the imported container in the workspace.
Sustainability 15 00385 g001
Figure 2. The movement of the container (C), the spreader of the quay crane (Q), the container truck (T) and the spreader of the yard crane (Y) in each phase of the traditional low-platform operation mode.
Sustainability 15 00385 g002
Figure 3. The movement of the container (C), the spreader of the quay crane (Q), the container truck (T) and the spreader of the yard crane (Y) in each phase of the new high-platform operation mode.
Sustainability 15 00385 g003
Figure 4. Yard container layout in traditional low platform mode.
Sustainability 15 00385 g004
Figure 5. Yard container layout in new high-platform mode.
Sustainability 15 00385 g005
Figure 6. Diagram of the high platform.
Sustainability 15 00385 g006
Table 1. Expression of the relevant parameters.
Parameters (i)17131925
h Y v i * + d2d2d2d2d2
h Y v i + d2ab + d12ab + d13ab + d14ab + d1
h Y v i * 4a + b + d23a + b + d22a + b + d2a + b + d2b + d2
h Y v i B + d2d1d1d1d1
h i Y v * + 5a + b4a + b3a + b2a + ba + b
h i Y v + b0000
h i Y v 0ab2ab3ab4ab
Table 2. Computational results of the relevant parameters.
Parametersabd1d2 m C m Q S m Y S g
Numerical value2.59 m1.5 m0.3 m0.15 mHeavy box: 20,000 kg
Empty box: 2000 kg
2000 kg2000 kg9.8 m/s2
Table 3. The relevant parameters of the high platform.
Parameter l P w p t p n h n l w r r c d c a p
Numerical value1000 m390 m0.6 m1058 m0.4 m4 m2.59 mUSD 104.167
Disclaimer/Publisher’s Note: The statements, opinions and data contained in all publications are solely those of the individual author(s) and contributor(s) and not of MDPI and/or the editor(s). MDPI and/or the editor(s) disclaim responsibility for any injury to people or property resulting from any ideas, methods, instructions or products referred to in the content.