Article

Study on the Identification and Classification of Key Influencing Factors of Debris-Flow-Prone Areas in Liaoning Province Based on Self-organizing Clustering and Sensitivity Analysis

1
School of Geographical Sciences, Liaoning Normal University, Dalian 116029, China
2
Academy of Ecocivilization Development for Jing-Jin-Ji megalopolis, Tianjin Normal University, Tianjin 300387, China
3
School of Public Administration, Dongbei University of Finance and Economics, Dalian 116025, China
*
Authors to whom correspondence should be addressed.
Sustainability 2023, 15(1), 412; https://doi.org/10.3390/su15010412
Submission received: 25 October 2022 / Revised: 16 December 2022 / Accepted: 21 December 2022 / Published: 27 December 2022

Abstract

:
Due to the characteristics of sudden occurrence, fast disaster speed, and severe damage, debris-flow disasters can easily result in the loss of human lives and cause serious damage to property and social infrastructure. In this study, taking the debris-flow events in Liaoning province from 1960 to 2020 as the study period, the natural geographical characteristics and key influencing factors of the debris-flow-prone areas were explored utilizing the self-organization mapping clustering method and nonlinear global sensitivity analysis. The main conclusions were as follows: (1) The key influencing factors of debris flow are the content of clay, sand, and silt; the first type of debris flow is sensitive to the fluctuation in slope and elevation; the second and third types of debris flows are more significantly affected by changes in land use and geomorphology; the third type of debris flow is weakly sensitive the NDVI value, vegetation type, slope direction, and soil type; (2) The first type of debris flow was widely distributed, mainly located in most of the hills of eastern and the southwest part of Liaoning province; the focus of the second type of debris flow focus was further in Xiuyan County and scattered in the hills of northeast Liaoning province; the third type of debris flow was mainly distributed on the peninsula of Liaodong and the southwest of Liaoning province. (3) When the clay content is 12–27%, sand content is 49–70%, silt content is 18–29%, the elevation is 0–500 m, the slope is 0°–30°, and the land use is at the junction of arable land, medium cover grassland, and forested land, etc., debris flow disasters are very likely to occur.

1. Introduction

Debris flow is a particular torrent that flows along the valley or slope to lower terrain, carrying a large amount of solid debris such as sediment and rocks under gravity and water and contains at least 50% solids such as sand or large particles. It occurs suddenly, has a broad impact, and has destructive power [1,2,3]. In general, broken undulating terrain [4], an unstable geological structure [5], loose debris [6], and a complex extreme climate [7] are the main factors leading to the occurrence of debris flow. However, due to the different terrain and landforms where the debris flow is located, the local climate conditions vary. Each debris flow has different causes and morphological characteristics. Therefore, it has become the purpose of many scholars′ research to investigate the occurrence mechanism of debris flow and analyze the key factors leading to the occurrence of debris flow to provide scientific and accurate early warnings for disaster prevention and mitigation [8,9,10].
The determination of debris-flow-prone factors by domestic and foreign scholars has experienced an evolution from qualitative evaluation to semi-quantitative evaluation and then to quantitative, digital, and visual assessment [11]. Since the middle of the 19th century, international research on debris flow hazards has been carried out. Due to the lack of geological data and the limitation of technical means, the research methods have mainly been based on qualitative expert scoring methods. For example, Liu X L [12] determined the main risk factors representing the scale and intensity of debris flow by issuing questionnaires to 96 debris-flow experts. Among them, the largest number of votes were obtained for the debris flow outwash and the maximum flow velocity of debris flow, accounting for 32.52% and 27.67%, respectively. Li G [13] used a combination of expert scoring and fuzzy mathematical methods to evaluate three options for debris-flow control qualitatively. The expert scoring method is more intuitive and straightforward to calculate. However, there is still subjectivity in terms of the selection of prone factors and the quantification of different eigenvalues among factors and the same factor, which should be comprehensively considered in combination with other methods. The analytic hierarchy process (AHP) [14] combines qualitative and quantitative analysis, decomposes the research object as a system, and can transform a multi-objective and challenging problem into a multi-level single-objective problem, which is easy to understand and operate. However, it is difficult to determine the weight when too many indicators exist. For example, this method has been used by scholars to explore the impact factors of debris flow in small and medium-sized areas such as Zhouqu County in Gansu Province [15], Dongchuan District in Yunnan Province [16], Ardesen in Turkey [17], etc.
With the progress of science and technology, remote sensing technology and GIS software have been applied to the observation and research of debris flow [18], and quantitative and visual evaluation methods have gradually developed. At present, the widely used domestic and foreign methods mainly include the logistic regression model [19,20], artificial neural network model [21,22], and deterministic coefficient method [23], etc. These methods have a solid mathematical foundation, can consider various complex influencing factors, and have high simulation accuracy. This is especially suitable for the analysis of complex multi-objective problems. These methods are mature in their development and are widely used. For example, Cama et al. combined the model portability method and binary logistic regression model to analyze the influence of variable selection on model performance. They found that topography significantly impacted debris flow in the Saponara and Itala catchment watersheds [24]. Li et al. established the SPH–DEM–FEM coupled numerical analysis method to explore the impact of slope on the force of debris flow and obtained relatively ideal simulation results [25]. Shan Bo established the sensitivity analysis model of debris flow based on the minimum entropy theory and the unascertained measure theory. It was found that the material source amount per unit area and the average gradient of the main gully bed and the watershed area contributed the most to the occurrence of debris flow [26]. Nikolova explored the debris flow occurrence parameters of Eastern Rhodopes (Bulgaria) according to the field survey data and digital elevation model and believed that a slope of 30°–45° was an important topographic factor leading to the debris flow in this area [27]. Li u Y used an adaptive neuro-fuzzy inference system (ANFIS) and an adaptive neuro-fuzzy inference system based on a learning optimization algorithm ( TLOAANFIS) for sensitivity evaluation of the debris flow; It is concluded that the debris flow in ShaGa Gully was mainly triggered by heavy rainfall, but rainfall frequency was inversely proportional to the debris flow hazard area [28], that is, the debris flow disaster was more likely to occur under low-frequency rainfall conditions.
Sensitivity analysis is a technique for quantitatively analyzing the changes in dependent variables caused by changes in each independent variable. It is applicable to a large number of independent variables, and the relationship between the dependent variables and independent variables is relatively complex; it is widely used in robustness evaluation, identification of key influencing factors, model sensitivity testing, and parameter optimization [29,30]. The occurrence of debris flow is the result of the comprehensive action of many factors. Each factor is independent and related to one another, with diversity, continuity, similarity, uncertainty, and nonlinearity [31]. In addition, as a large geographical unit, the study area of Liaoning province has a wide distribution of debris flow and a complex disaster environment, so it is more accurate to identify the sensitivity of debris flows to each environmental factor by using the sensitivity analysis method to analyze the key influencing factors on large and medium scales.
Cluster analysis refers to the categorization of data according to a certain degree of similarity between data so that the objects classified into the same category have maximum similarity and different categories have the lowest similarity. There are certain similarities and differences in the spatial distribution of debris flow disasters in different regions [32]. The application of the cluster analysis method in debris flow evaluation can better identify similar characteristics, and the algorithm has a clear meaning and can quantitatively evaluate the research object [33].
The eastern and western parts of Liaoning province are dominated by medium and low mountains. The hills are widely distributed, the terrain is undulating, and there are many rivers. In addition, tectonic movement is frequent, the degree of crust cracking is high, and the loose soil and rock mass after weathering are eroded by heavy rain, which makes it easy for debris flow disasters to occur. Most of the previous studies on debris flows have focused on single debris flows in the mid to low latitudes, and few have explored the environmental space of debris flows in the low hilly areas at mid to high latitudes. In order to accurately screen the key physiographic elements affecting the occurrence of debris flow disasters in Liaoning province, in this study, the statistical data of 538 debris flow sampling points occurring between 1960 and 2020 were used. GIS spatial analysis technology, self-organized mapping clustering, and sensitivity analysis were adopted. Meanwhile, the background environmental characteristics of debris flow occurrence sites in Liaoning province and the correlation between each environmental factor and the occurrence of debris flows were analyzed. On this basis, the key physiographic factors were identified, and a mid- and long-term early warning distribution map of debris-flow disasters was drawn.

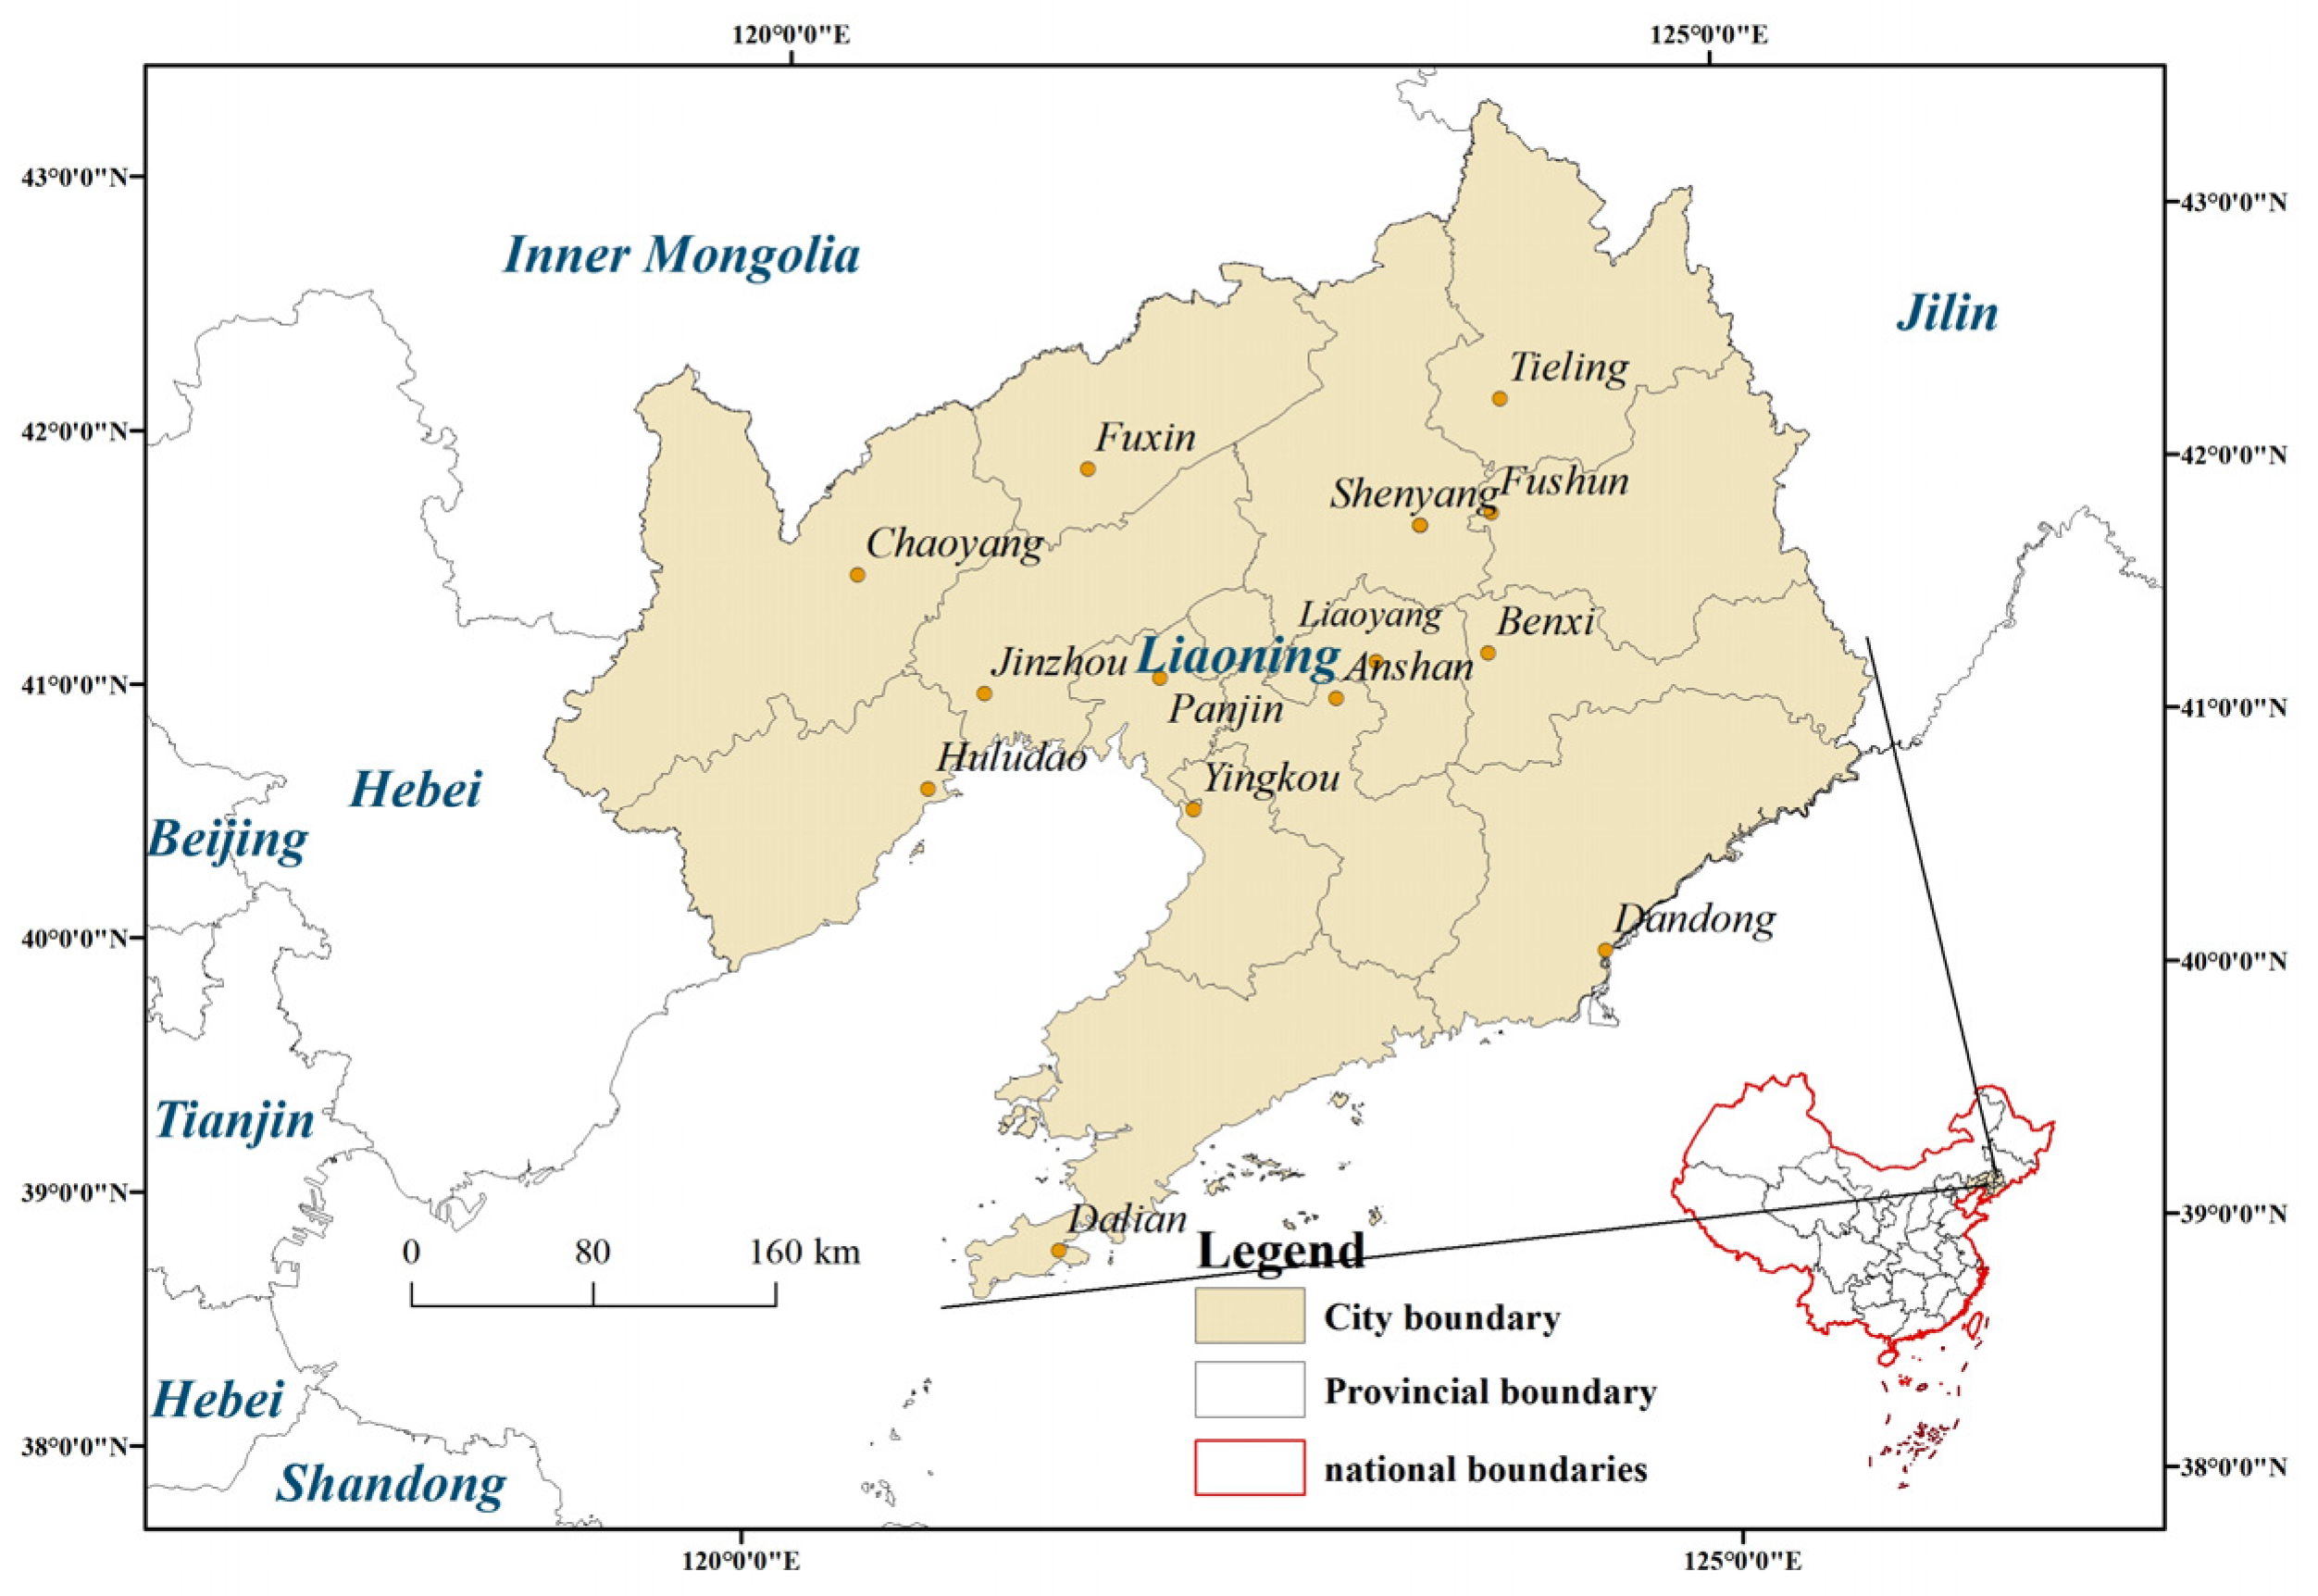
2. Study Area Overview

Liaoning province spans from 118°53′ E to 125°46′ E and from 38°43′ N to 43°26′ N (Figure 1). It is located in the southern part of northeast China. The topography is generally inclined from east to west and north to south. There are three major topographic areas: Liaodong Mountain and Hill Area, Liaoxi Mountain and Hill Area, and the Liaoning River Plain Area. There are more than 300 rivers with more than 30 dry and tributary rivers with a watershed area of 1000 km2 or more. The annual rainfall of the province is roughly 400 mm–1200 mm, showing a decreasing trend from southeast to northwest.
The study area was in the overlapping area of two major global hazard clusters between the Pacific Rim coast and the Northern Hemisphere at 20°–50°, which makes Liaoning province one of the provinces most seriously threatened by geological hazards [34]. The low and middle mountainous areas in eastern and southern Liaoning show a long-term uplifting trend, the distribution of activated fractures is extensive, and seismic activities occur frequently; the low mountainous, hilly areas in Liaoning West have sparse vegetation cover, severe soil erosion, and strong denudation effects such as tectonic movements, ice splitting, and freeze-thaw. The Liaoning River Plain is distributed with various special soils such as permafrost, soft soils, and saline soils.
In recent years, with urban construction and unreasonable human living and production activities, the originally fragile geological environment has become even worse, thus intensifying the frequency of geological disasters.

3. Methods and Data

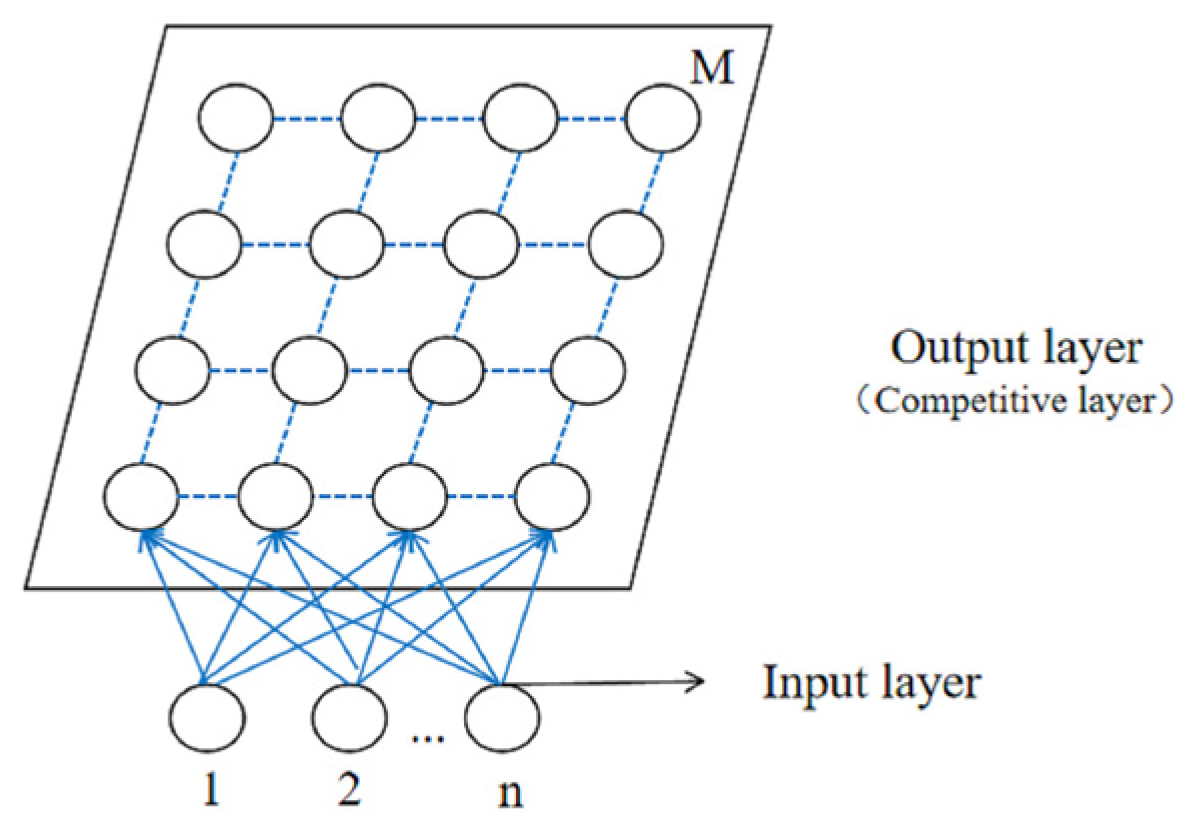
3.1. Self-Organizing Mapping Clustering Method

A self-organizing map (SOM) is a self-clustering method based on neural networks in the absence of guidance [35]. Different regions have different response characteristics, similar to the cellular division of labor in different regions of the human brain. The automatic clustering process of self-organizing mapping networks is accomplished by finding the optimal reference vectors, each of which is a vector of connection weights corresponding to one output unit. Assuming that there are m nodes on the output (competitive) level of the network and n nodes on the input level, and the latter is connected to the former through the weights, the topology of the self-organizing mapping network is shown in Figure 2. In this paper, this method was used to classify debris flow disaster events.
The basic principles and implementation steps of self-organizing mapping are as follows:
(1) Set time count t = 0 , determine the number of competing layer neurons M, and randomly initialize the weight vector w j ( 0 ) ( j = 0 , 1 , 2 , , M ) ;
(2) Enter a pattern vector for the network x k   ( t ) = ( x 1   k ,   x 2   k , ,   x r   k ) , where r is the total number of vectors of data sets to be input;
(3) Calculate the distance between the input vector x k   ( t ) and the competing layer neurons;
(4) Obtain the winning neuron q   ( t ) , q   ( t ) with the smallest distance from the competing layer;
(5) Adjust the weights connected by q   ( t ) to its output node and the vector of weights within the neighborhood of the winning neuron N q ( t ) , where η   ( t ) is the learning rate parameter, and 0 < η ( t ) < 1 ;
w j ( t ) + η ( t ) ( x k ( t ) w j ( t ) ) j N q ( t )
w j ( t ) w j ( t + 1 ) = { j N q ( t ) }
(6) Determine whether there is still data to be input and if yes, go to the next step; conversely, make t = t + 1 , return (2);
(7) Update the learning rate η ( t ) and neighborhood radius;
(8) Repeat the process from step (2) before the number of iterations is reached; otherwise, the algorithm ends.

3.2. Nonlinear Global Sensitivity Analysis

Sensitivity analysis is an analytical technique to quantitatively study the extent of change in the dependent variable due to changes in the independent variable [36]. Global sensitivity analysis considers not only the changes in the dependent variable with the independent variables but also the interactions between the independent variables; in this paper, the global sensitivity analysis method based on multivariate and nonlinear systems [29] was used for the identification of key influences on the debris-flow natural geographic environment.
With independent variables x 1 , x 2 , …, x n , the mapping relationship between the dependent variable y and the independent variable is y = f ( x 1   x 2 , ,   x n ) . If each independent variable x i varies within its respective space of possible values, the degree of influence of the variation on the dependent variable y is analyzed, and the magnitude of the influence is called the sensitivity of the dependent variable y depending on the independent variable x i . If the sensitivity of an independent variable is greater, the greater the effect of a change in that variable on the dependent variable. Conversely, it is smaller [37].
(1) Sensitivity definition
Let a system have a time series based on random dependent variable Y with independent variables X 1 ,   X 2 , ,   X i , ,   X n , Y varies with X 1 ,   X 2 , ,   X i , ,   X n . Define the degree to which the independent variable X i ( i = 1 , 2 , 3 , , n ) perturbation leads to a change in Y as the sensitivity of the dependent variable depends on the independent variable, and let the system sample series t from 1 to t , there is a nonlinear deterministic mapping relationship Y = f ( X 1 , X 2 , , X i , , X n ) , then the relation expressed by the sample is as follows:
y 1 = f ( x 1 , 1 , x 2 , 1 , , x i , 1 , , x n , 1 ) y 2 = f ( x 1 , 2 , x 2 , 2 , , x i , 2 , , x n , 2 ) y k = f ( x 1 , k , x 2 , k , , x i , k , , x n , k ) y m = f ( x 1 , m , x 2 , m , , x i , m , , x n , m ) }
where m is the sample size and n is the number of independent variable dimensions.
Define the sensitivity of the sample y k according to sample x i , k as: β i , k = η i , k η i , k , defining the sensitivity of the dependent variable Y according to the independent variable X i β i as
β i = k = 1 m | β i , k | m
(2) Mapping recognition based on BP network
The nonlinear mapping g ( ) forms independent variables x 1 , k , x 2 , k , , x i , k , , x n , k , Δ x 1 , k k + 1 , Δ x 2 , k k + 1 , , Δ x i , k k + 1 , , Δ x n , k k + 1 to the dependent variable η k can be identified using a BP network with the following logical relationship:
g ( ) : input ( x i , k , Δ x i , k k + 1 , i = 1 , 2 , , n ) B P   network output   η k ( k = 1 , 2 , , m )
The error metric on which the network weights are modified is:
E = e 2 = η d , i , k η i , k 2 ε   ( k = 1 , 2 , ,   m )
where η d , i , k is the desired output, η i , k is the network output, and ε is the allowed error.
(3) Calculation steps
① Tissue samples. Independent variable X and dependent variable Y are observed data; according to x i , k and y k , calculate the respective variables X i from k to k + 1 in increments of Δ x i , k k + 1 and the dependent variable y k to y k + 1 in relative increment η k , where i = 1 , 2 , , n .   k = 1 , 2 , , m .
② Train the network. The BP network parameters and training parameters are selected, and the samples x 1 , k , x 2 , k , , x i , k , , x n , k , Δ x 1 , k k + 1 , Δ x 2 , k k + 1 , , Δ x i , k k + 1 , , Δ x n , k k + 1 as input, sample η_k as output (such samples have m pairs), and the network is trained to identify the mapping g ( ) .
③ Introduce the independent variable perturbation. The completed training BP network is able to simulate the mapping relationship g ( ) at this point. Assuming that the independent variable x i is the increment Δ x i , k k + 1 = 0 from k to k + 1 , and the new sample ( x 1 , k , x 2 , k , , x i , k , , x n , k , Δ x 1 , k k + 1 , Δ x 2 , k k + 1 , , Δ x i , k k + 1 = 0 , , Δ x n , k k + 1 ) is substituted into the completed training BP network as the input. The network output is η i , k . The amount of effect of this independent variable perturbation on the dependent variable is β i , k , that is, y k according to the sample x i , k is sensitive to β i , k = η i , k η i , k .
④ Carry out the sensitivity calculation. Calculate β i , k ( k = 1 , 2 , 3 , , m), substituting into Equation (4), and finally obtaining the sensitivity β i of the dependent variable Y to the independent variable X i .

3.3. Data Source

In order to comprehensively investigate the natural geographical characteristics affecting the generation of debris flows in Liaoning province, 11 influencing factors were selected from three aspects: topography (elevation, slope, slope direction, and landform), soil (clay, sand, silt, and soil type), and vegetation (land use, NDVI, and vegetation type). Among them, the required DEM data were selected from the geospatial data cloud ASTERGDEM 30 m resolution elevation data, and the attributes of the slope, slope direction, and river network were further extracted through the DEM data; The topography and geomorphology and vegetation cover data were obtained from the 1 km data set provided by the Resource and Environment Science Data Center of Chinese Academy of Sciences (http://www.resdc.cn (accessed on 15 December 2022)).
The debris-flow events were mainly obtained by the Resource and Environment Science and Data Center of the Chinese Academy of Sciences and the compilation of the results of flash flood investigation and evaluation in Liaoning province. In addition, corrections were supplemented with the help of data from the National Bureau of Statistics as well as fieldwork data, and the debris flows with incomplete information, such as unclear year of occurrence and fuzzy longitude and latitude location, were eliminated. A total of 538 debris flows were retained.

4. Results and Analysis

4.1. Analysis of Physical and Geographical Characteristics of Debris-Flow-Prone Areas

4.1.1. Influence of Terrain on Debris Flows

Topographic conditions are the primary conditions affecting debris-flow formation. In general, the elevation change is positively correlated with the frequency of debris flows, i.e., the lower the elevation, the smaller the elevation difference, and the more stable the geological structure, the less debris flows occur; where the elevation change is large, and the terrain is high, debris flows occur more frequently [38]. The elevation of Liaoning province has a large number of changes (Figure 3); located at −291 m–1322 m, the central plain has a low elevation, and the two sides are mostly mountainous, hilly areas with higher elevation. The differences in topographic relief lead to an extremely unstable geological structure, which provides potential energy for the physical source of debris flow disasters. Changes in slope and slope direction can lead to changes in soil stability and surface hydrodynamics, affecting the size and intensity of fluid sources in the ground [39,40]. The topographic slope of Liaoning province ranges from 0° to 53.25°, and the mountains are mostly oriented towards the south and southeast slopes. Debris flows frequently occur when the slope is between 0° and 30°, occasionally in the lower mountains between 30° and 40°, and infrequently when the slope is greater than 45°. It can be seen that due to the influence of geomorphological characteristics, the slope was not the main controlling factor for the occurrence of debris flow in areas with a topographic slope greater than 30° in Liaoning province.

4.1.2. Effect of Soil on Debris Flow

Loose rock fragments and soil bodies are the physical source conditions for debris-flow formation. The absorption of soil particles into the water body is different. With the infiltration of rainwater, the permeability coefficient of soil mass increases, and the probability of debris flow increases [41]. From the perspective of soil type (Figure 4), the soils in Liaoning province mainly contain clay, sand, and silt. When the clay content was 17–25%, the soil was most widely distributed in the northwestern Liaoning and low hill areas of eastern Liaoning. The clay content in the central plain area ranges from 25% to 100%, most of the sand content ranges from 41% to 52%, and the silt content ranges from 23% to 32%. The eastern, northeastern, and southwestern parts of Liaoning province are dominated by lacustrine soils. The northwestern part of Liaoning province is mostly composed of semi-lacustrine soils and primordial soils. Semi-hydromorphic soils are distributed along the mountain rivers, while the central part includes mostly semi-hydromorphic soils and anthropogenic soils, etc. A small part with saline soils and waters is distributed in the coastal areas in the south-central part. Soil types in the debris-flow occurrence area are mostly brown loam, brown loamy soil, meadow soil, acidic-coarse bone soil, and a small part is rice soil, latent rice soil, and brown soil.

4.1.3. The Effect of Vegetation on Debris Flows

Vegetation can reflect soil and water conservation, and the root system of vegetation penetrates deep into the soil layer, and at the beginning of rainfall, the root system absorbs precipitation and has an anchoring effect on the soil [42]. In terms of land use types and vegetation types (Figure 5), the eastern part of Liaoning province is dominated by woodlands, with interspersed broad-leaved forests, mixed coniferous forests, coniferous forests, and thickets, and also mountainous cultivated lands, and the NDVI value is high overall, maintaining a level greater than 0.5; the central plains and southern hills are dominated by cultivated lands and also urban construction lands, and the NDVI value fluctuates widely, varying between 0 and 0.5. In western Liaoning, grassland, grass, meadow, and scrub are dominant, and cultivated vegetation and broad-leaved forest are also present. There were debris flows distributed in all land use forms, among which were mainly concentrated in the junction of dry land and medium-coverage grassland, forested land, etc. A small part was distributed in rural settlements, shrubland, paddy fields, urban land, sparse forest areas, etc. Some bare rocky gravel land also had debris-flow disasters, and the overall vegetation cover of disaster sites was high.

4.2. Cluster Analysis of Physiographic Features in Debris-Flow-Prone Areas

Debris flow hazards are affected by a variety of factors. On the basis of the earlier stage, MATLAB 7.0 software was used to carry out a self-organizing mapping cluster analysis of 538 recorded debris-flow events (noted as S0 to S537) and explore the natural geographic characteristics of 11 influencing factors that lead to the occurrence of debris flows. The clustering results were divided into three categories (Table 1).
Overall, the number of debris flows was basically equal for all three types. The first category accounted for 38.85% of the total number of debris-flow events, with the clay content ranging from 12% to 29%, the sand content ranging from 32% to 54%, and the silt content ranging from 16% to 38%. They were distributed on hills and terraces with elevations from 0 m to 977 m and a slope of less than 40.84°, mostly located on cultivated and forested land around lakes and reservoirs. The vegetation types were coniferous forests, broad-leaved forests, mixed coniferous and broad-leaved forests, scrub, and cultivated plants. The second type of debris-flow event accounted for a smaller proportion, which was distributed on plains, terraces, hills, and small and medium-sized rolling hills at elevations of 200 m–666 m, with slopes between approximately 10° and 45°. These were mostly located on cultivated land, woodland, and grassland. The vegetation types were coniferous forests, broad-leaved forests, mixed coniferous and broad-leaved forests, scrub, meadows, and cultivated vegetation, and soil types of brown loam, tidal brown soil, neutral coarse bone soil, and meadow soil. The content of clay and silt changed slightly, fluctuating between approximately 12% to 16% and 18% to 32%, respectively. The content of sandy soil was higher at 60% to 70%. The third category of debris flow events accounted for the highest proportion, which was distributed on plains, terraces, hills, and mountains with elevations of 0 m–558 m and slopes of less than 30°. The soil types were brown loam, brown soil, and meadow soil, and they occurred around lakes and reservoirs, with land use types of arable land, woodland, and grassland. The vegetation types were mainly coniferous forest, broadleaf forest, scrub, meadow, and cultivated vegetation. The clay content was 10% to 19%. The sand content fluctuated from 33% to 66%, and the silt content ranged from 22% to 38%.

4.3. Analysis of Key Physiographic Factors in Debris-Flow-Prone Areas

Based on the clustering analysis of debris flows, the global sensitivity analysis of 11 physiographic factors affecting the occurrence of debris flows was further carried out. As shown in Table 2, the occurrence of debris flows is most sensitive to the contents of clay, sand, and silt in the soil. The sensitivity of the three types of debris flows to clay content was 0.986, 0.992, and 0.792, respectively. The sensitivity of the first and second types of debris flows to clay content was the highest. Generally speaking, the level of clay content in the soil was negatively correlated with the occurrence of debris flows. The higher the clay content, the better the soil water retention, and the less likely debris flow was to occur.
The first type of debris-flow-occurrence area was widely distributed (Figure 6), mainly located in Dalian City in southern Liaoning, most of eastern Liaoning and northern Liaoning, as well as in low mountainous areas in southern Liaoning, and the clay content varied widely, ranging from 12% to 29%.
The second type of debris flow was concentrated in Xiuyan County of Liaoning province and scattered in the mountains and hills of northeast Liaoning. This mainly occurred in coarse bone soil, meadow soil, and paddy soil with a clay content of 12% to 16%, a sand content of 60% to 70%, a silt content of 18 to 32%, and a height of 200 m–666 m. These soils generally have a high sand content and coarse pores. In addition, frequent seismic activity and fracture development in this area provide a large amount of source material for the occurrence of debris flow.
The third type of debris flow was mainly sensitive to the content of sand and clay, followed by the land use type. This type of debris flow mainly occurs in woodland and grassland with a good vegetation status and on arable land with water sources. The changes in slope, elevation, land use, and landform type were moderately correlated with the occurrence of debris flows. In Liaoning province, debris flows mainly occurred in the middle and low mountainous areas in the eastern and southern regions, where the slope of the mountains is large, and the difference in elevation is obvious. Taizi river, green river, and other rivers in this area provide a rich source of water conditions, and the area is mainly dominated by woodland, grassland, and farmland. Therefore, the difference in land use easily causes debris-flow disasters. The NDVI index, vegetation type, slope direction, and soil had little correlation with the occurrence of debris flows.
In summary, the content of clay, sand, and silt was the main factor influencing the occurrence of debris flow, and the impact on the three types of debris flow was very similar. The first type of debris flow was more sensitive to the change in slope and elevation, while the second and third types of debris flow were more sensitive to changes in land use type and geomorphology.

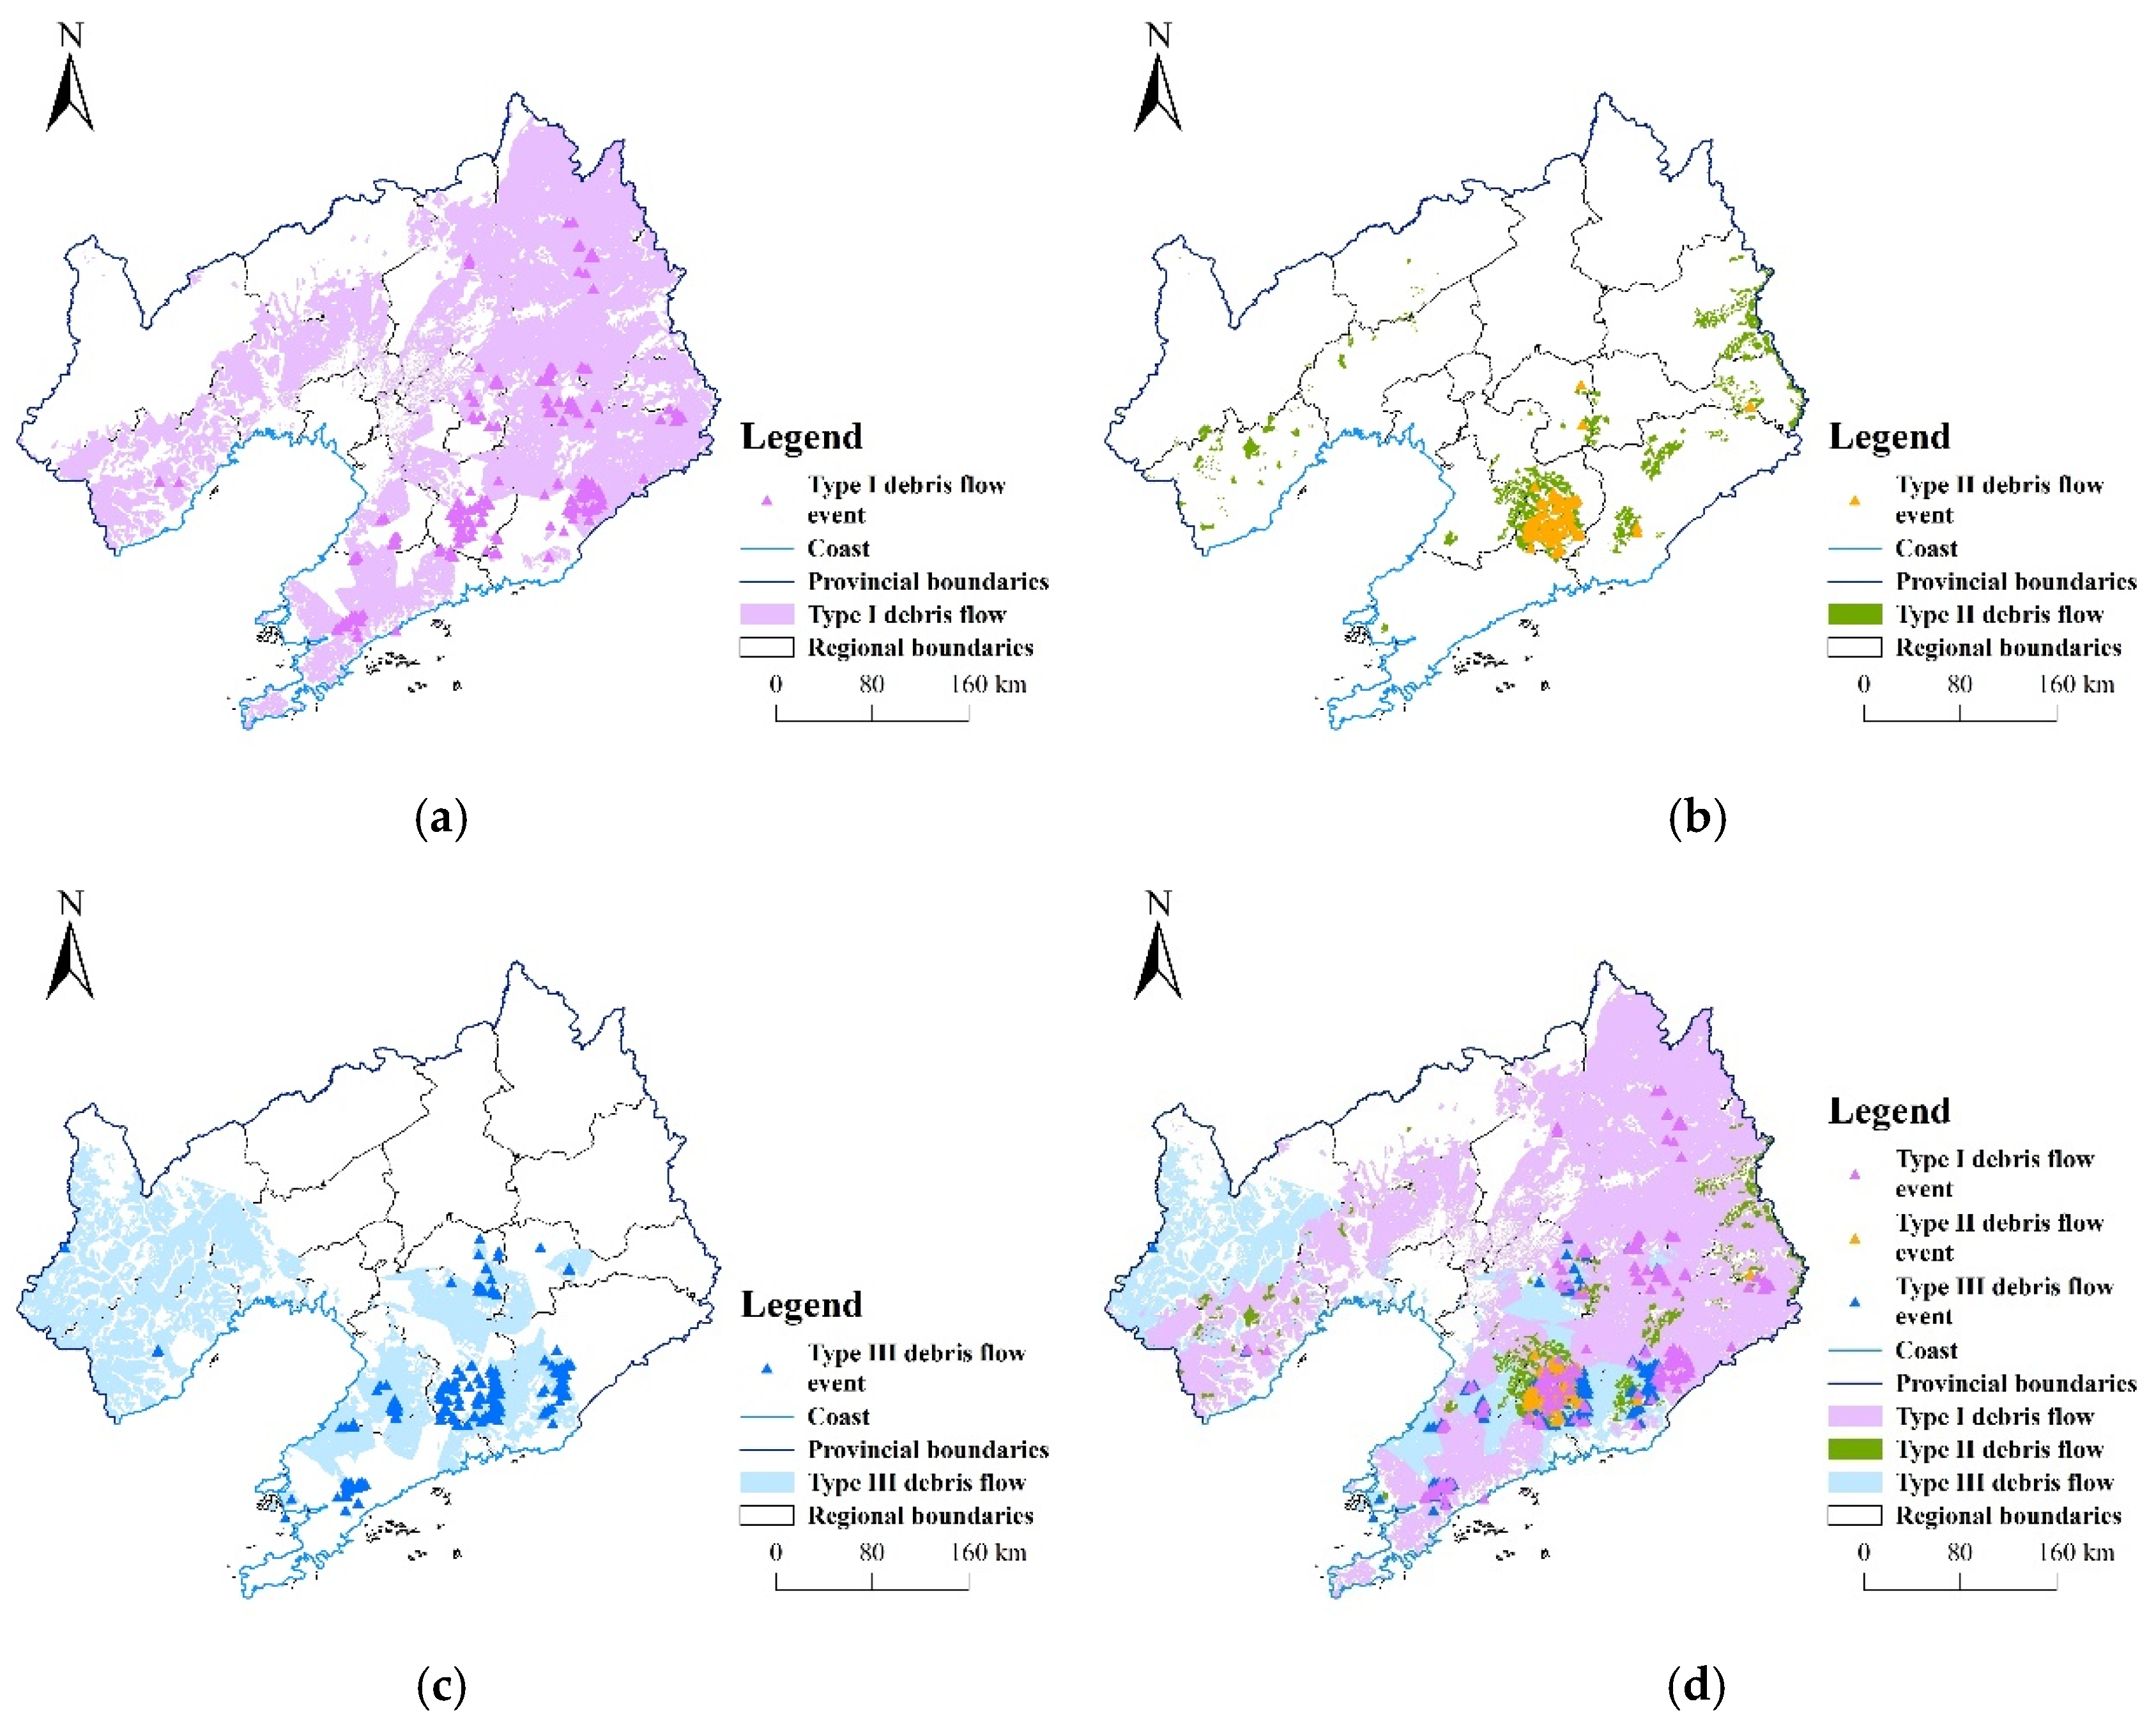
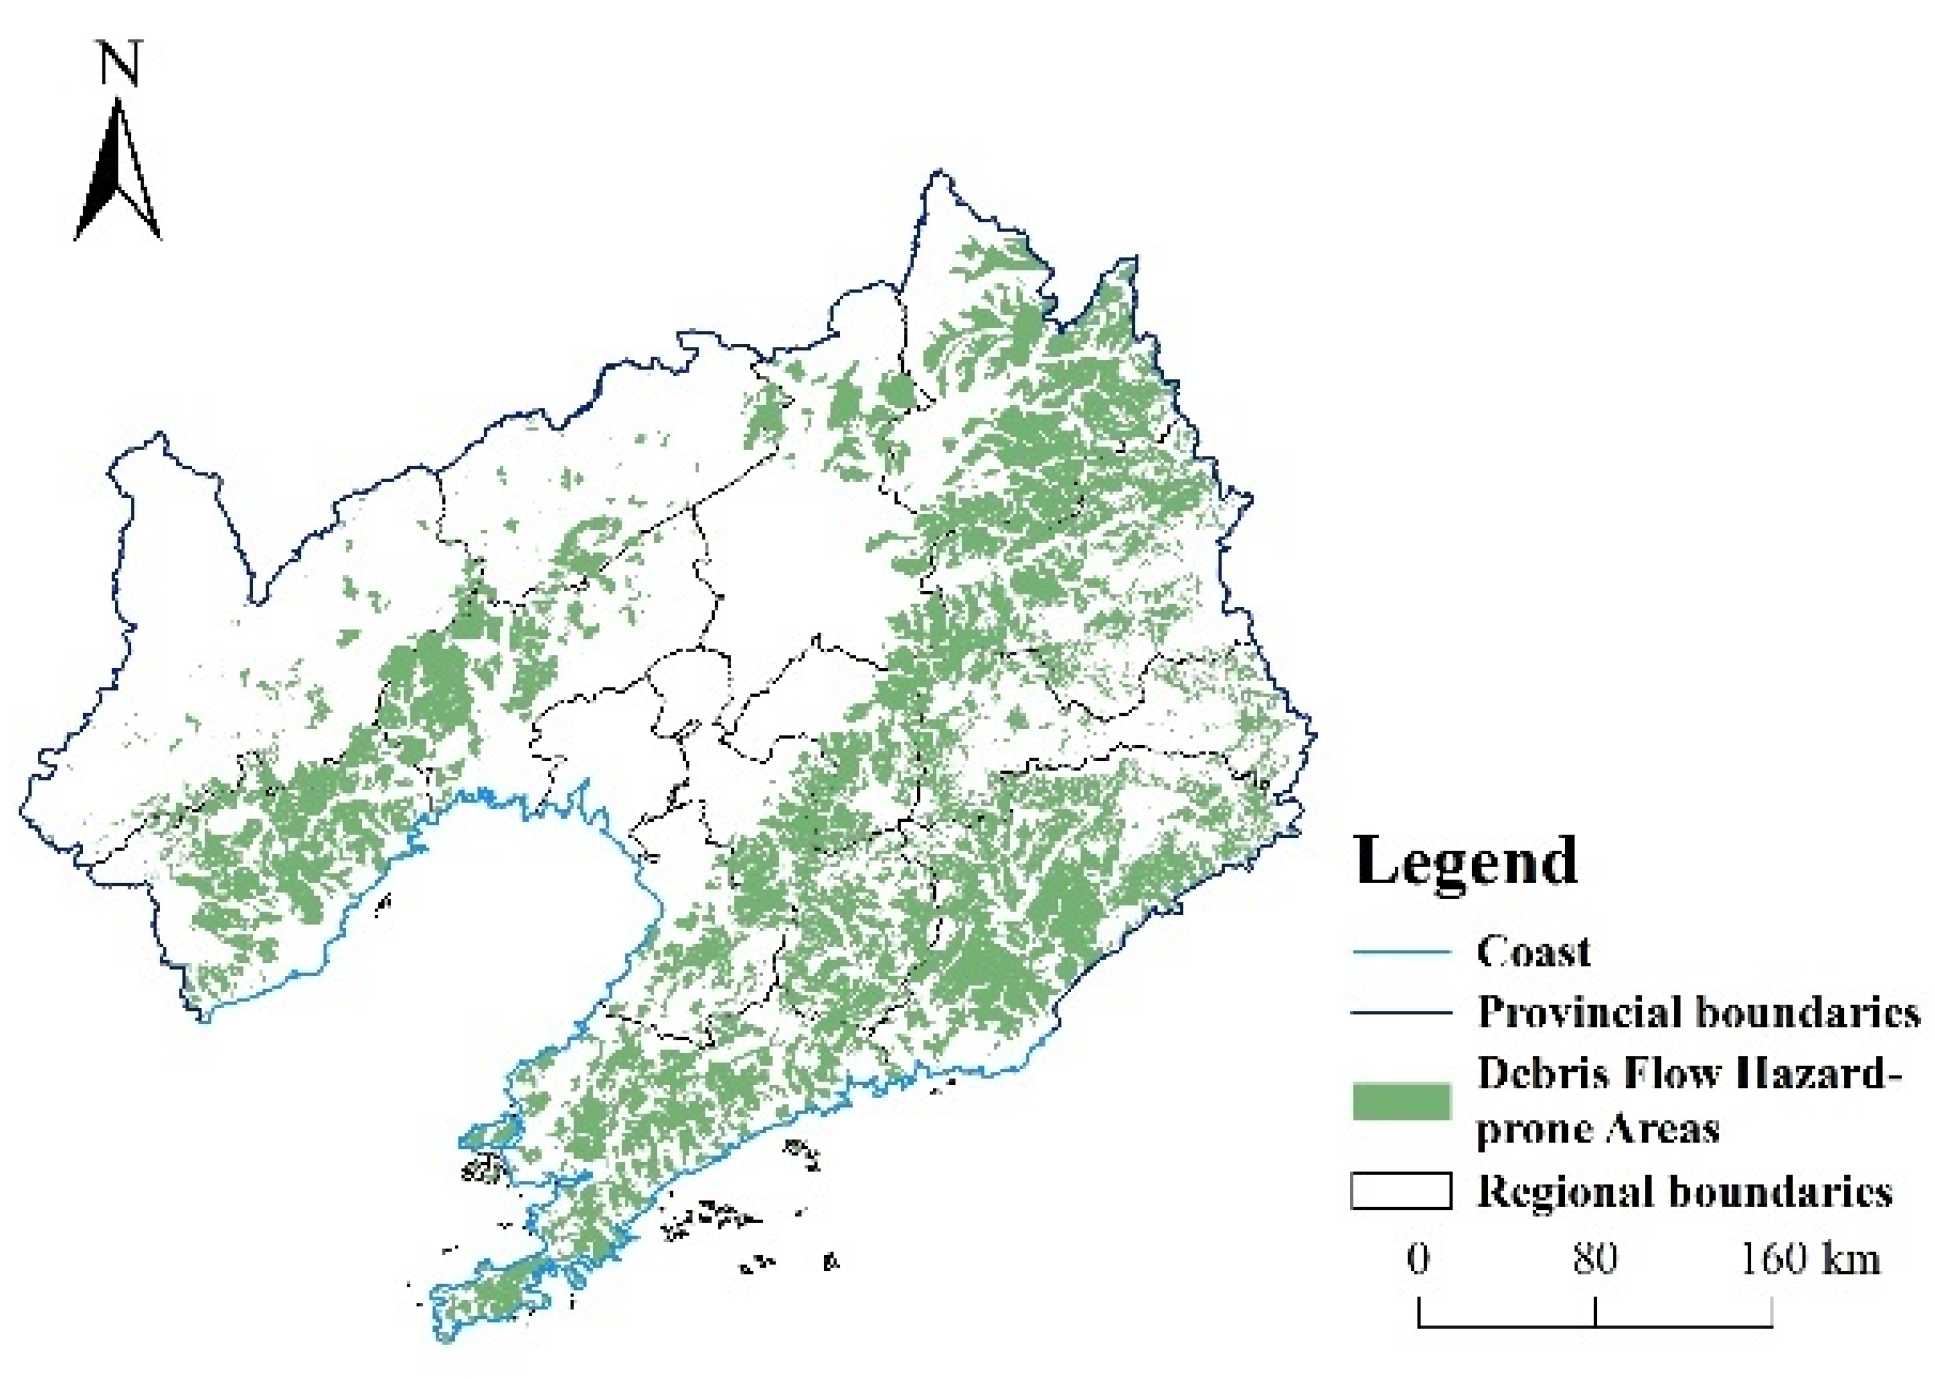
4.4. Distribution of Debris-Flow-Prone Areas and Prevention and Control Measures

Through the analysis of the characteristic indices such as elevation, slope, soil types, and land use type of debris-flow disaster-prone areas in Liaoning province, it was found that debris-flow disasters were distributed at 0–1000 m, and the main susceptible areas were in the medium and small undulating mountains of 0–500 m elevation. The slope was concentrated at 0°–25°. The clay content was 12–27%, the sand content was 49–70%, and the silt content was 18–29%. The land use type was more diverse, including cultivated land, forest land, grassland, water body, impermeable surface, etc. There were more debris flow outbreaks at the junction of arable land and medium-coverage grassland, forested land, etc. After combining the above physical geographic characteristics and removing the four unimportant factors of NDVI index, vegetation type, slope direction, and soil types, the areas with a frequency of debris-flow occurrences of more than 90% were defined as susceptible areas, and the mid- and long-term warning distribution map of debris-flow disaster in Liaoning province is shown in Figure 7.
It can be seen that the debris-flow-prone areas in Liaoning province are mainly located in the eastern region and the mountainous, hilly areas in the southwest region. Sufficient debris in this area, together with the influence of human construction of reservoirs and tunneling, undermines the stability of mountains in some areas and intensifies fault structures. During the Quaternary period, the Liaodong Peninsula was uplifted due to neotectonic movement, which made the ground stress concentrated and intensified the changes in rock formations. When the stress becomes too large, earthquakes may occur, which provides the source material for the occurrence of debris flow disasters [43]. Therefore, monitoring stations for ground stress should be added to improve monitoring accuracy.
The changes in clay, sand, and silt content directly lead to the occurrence of debris flows, which are related to the soil formed by the climate and latitude of the place. Soil with high clay content and low powder sand content has small pores, high viscosity, high water retention, and adhesion. Thus, it is not easy to move, and vice versa. Therefore, it is necessary to strengthen the protection of soil and ecological restoration, introduce plants that can preserve soil and water, enhance the soil and water conservation ability of plants in these areas, reduce the solid substances that cause debris flow disasters, control the hydrodynamic conditions needed for debris flow, and restore the balance and stability of the ecosystem [44]. In addition, the area concerned is not high in elevation and is dominated by medium and small undulating hills, where trees, shrubs, and grasses can be planted to prevent soil erosion, reduce the amount of sediment loss, and decrease the activity of debris flows. For hillside cultivated land with a slope of more than 25°, all farmland should be returned to a forested state, while land with a slope of less than 25° can be planted with an economic forest [45,46].

5. Discussion and Conclusions

5.1. Discussion

Correctly identifying the key factors that affect the occurrence of debris flow is the first step in preventing the occurrence of debris-flow disasters. In this study, based on the 538 historical debris-flow events, with the help of a self-organized mapping method and nonlinear global sensitivity analysis, the pattern of mudslide events and physical geography were revealed. The results are helpful in better understanding the development of debris flows and provide a theoretical basis for predicting debris flows in the region.
The study found that the change in clay, sand, and silt content in the soil directly affects the occurrence of debris flow. This is consistent with the research of Cui C F [47] on debris flow in the Taohe River basin, where the geotechnical structure was the basic condition for the generation of debris-flow disasters, the soil content had a critical value, and debris flows easily formed when the clay content was 5% to 18% [48,49].
In Liaoning Province, debris flows occurred easily when the slope of mountains was less than 25°, which is consistent with the conclusion of Fu H C [50]. The slope of the mountains in Liaoning Province is between 5° and 15°, which makes it a high-risk area. However, there is not a simple relationship between slope and the generation of debris flow. Although the slope is high and the potential energy is high, the debris may not easily accumulate.
It is generally believed that vegetation is an important factor in inhibiting the development of debris flow, which can reduce the hydrodynamic force and prolong the confluence time. When the vegetation coverage rate is lower than 10%, debris flow occurs easily; with an increase in the vegetation coverage rate, the probability of debris flow is reduced; when the vegetation coverage rate reaches 30%, debris flow does not easily occur [51].
However, this paper argues that the NDVI vegetation index and vegetation type have little correlation with the occurrence of debris flow. In the early stage of rainfall, vegetation roots can absorb a large amount of water and can thus play a balancing role. However, with the increase in water volume, the soil becomes oversaturated, which will accelerate the soil looseness and increases the potential energy of the debris flow. On the contrary, it will promote the growth of the debris flow [52]. Therefore, high vegetation coverage cannot reduce the slack of debris-flow control projects. The reason for this contradictory view may be related to the selection of the research area. The overall vegetation status of Liaoning Province is good, and the areas where debris flow occurred were mostly woodland, dryland, and grassland areas; therefore, vegetation status is no longer the main factor affecting debris flow. On the other hand, the vegetation in the Xiaojiang Basin [53] and alpine region [51] is poor, and the debris flow mostly occurs in the area with little vegetation cover. The amount of vegetation directly affects the occurrence of debris flow.
Changes in slope orientation and soil types also have less influence on debris flow, mainly because the influencing factors leading to the occurrence of debris flow not only included substrate conditions but also included the intensity of rainfall; ephemeral rainfall was found to be highly associated with debris flow. Consequently, precipitation conditions need to be added to further improve the debris-flow-inducing factors in later studies [54,55].

5.2. Limitation

Similar to other studies, this study has several limitations. First of all, the occurrence of a debris flow is the result of multiple factors. In this paper, only 11 factors from three aspects of terrain, soil, and vegetation were selected for analysis, without considering the impact of gully bed deposits, geological lithology, precipitation intensity, accumulated precipitation, earthquake, and other factors. Human activities such as engineering and road construction, hydropower development, and excessive land reclamation also play a role in promoting the occurrence of a debris flow. Secondly, when categorizing and summarizing the debris-flow data, it was found that the occurrence time of individual debris flows was not accurate, which may have caused some errors in the results of this study; however, in general, the results have a certain reference value. Third, when analyzing the terrain, soil, vegetation, and other geographical environments that affect the occurrence of debris flow, this paper mainly relied on remote sensing data, and experiments should be added in future research to improve the accuracy of the research results.

5.3. Conclusions

The geological environment in Liaoning province is relatively complex, especially in the low mountainous, hilly areas in the east and west of the province, where geological disasters occur frequently. According to the unique geographical environment and the distribution law of debris flow in the study area, the key influencing factors leading to the occurrence of debris flow, alongside recommendations for zoning and early warning, were identified. Finally, the following conclusions were reached:
(1) The elevation variation in Liaoning province ranges from −291 m to 1322 m; the central plain has a low elevation, and the two sides are mostly mountainous and hilly areas with a high elevation. The slope of the terrain ranges from 0° to 53.25°. The distribution area was the widest when the clay content ranged from 17% to 25%. In the central plain, the clay content ranges from 25% to 100%, most of the sand content ranges from 41% to 52%, and silty sand content ranges from 23% to 32%.
The eastern, northeastern, and southwestern parts of Liaoning Province are dominated by lacustrine soils, which are mainly distributed by broad-leaved forests, mixed coniferous forests, coniferous forests, and scrubs, as well as inter-mountain arable land. The central plains and southern hills are dominated by arable land and urban construction land. The western part of Liaoning Province is dominated by grasslands, grasses, meadows, and shrubs, with cultivated vegetation and broad-leaved forests.
(2) According to the results of the cluster analysis, the key influencing factors for debris flows are the content of clay, sand, and silt. The first type of debris flow was more sensitive to changes in slope and elevation, while the second and third types of debris flows were more sensitive to changes in land use and geomorphology. All three types of debris flows were weakly sensitive to NDVI value, vegetation type, slope aspect, and soil types.
The first type of debris flow was widely distributed, mainly located in most of the hills in the eastern and southwestern parts of Liaoning. The second type of debris flow was concentrated in Xiuyan County of Liaoning province and scattered hills in the mountains and hills of northeast Liaoning. The third type of debris flow was mainly distributed on the peninsula of Liaodong and the southwest part of Liaoning.
(3) When the clay content is 12–27%, sand content is 49–70%, and the silt content is 18–29%, a debris-flow disaster is very likely to occur. At the same time, the limited conditions also include an elevation between 0 and 500 m, with medium and small rolling mountains; a slope of 0°–30°; and the land use at the junction of arable land, medium-cover grassland, and woodland, etc., The monitoring of debris flow in Anshan, Dandong, Benxi, and Dalian should be strengthened.

Author Contributions

Software, F.W.; writing—original draft preparation, F.W.; supervision, Y.C.; conceptualization, S.F.; resources, R.Z. All authors have read and agreed to the published version of the manuscript.

Funding

This research was funded by The Belt and Road Special Foundation of the State Key Laboratory of Hydrology-Water Resources and Hydraulic Engineering, Grant number 2021nkzd02; National Natural Science Foundation of China, Grant number 52079060 and 51779114.

Institutional Review Board Statement

Not applicable.

Informed Consent Statement

Not applicable.

Data Availability Statement

Not applicable.

Conflicts of Interest

We declare that we do not have any commercial or associative interest that represents a conflict of interest in connection with the work submitted.

References

  1. Tian, F.; Ran, Y. Hazard assessment and impact factor analysis of debris flow disasters in Hexi Corridor. J. Nat. Disasters 2017, 26, 139–146. Available online: https://www.cnki.net/kcms/doi/10.13577/j.jnd.2017.0317.html (accessed on 20 October 2022).
  2. Iverson, R.M. The Physics of Debris Flows. Geophysics 1997, 35, 245–296. [Google Scholar] [CrossRef] [Green Version]
  3. Shu, A.P.; Tian, L.; Wang, S.; Rubinato, M.; Zhu, F.Y.; Wang, M.Y.; Sun, J.T. Hydrodynamic characteristics of the formation processes for non-homogeneous debris-flow. Water 2018, 10, 452. [Google Scholar] [CrossRef] [Green Version]
  4. Zhang, G.S. Study on Starting Conditions and Flow Characteristics of Debris Flow; Central University for Nationalities: Beijing, China, 2020. [Google Scholar]
  5. Zhou, C.H.; Guo, G.B.; Guo, Y.X.; Chen, J.H.; Chen, J.H. Analysis of the causes of mud rock flow in the Xueshan River, Yangbi County, the southeast margin of the Qinghai Tibet Plateau. China Water Transp. 2022, 22, 122–124. [Google Scholar]
  6. Su, J.D.; Gao, L.B.; Kong, X.; Diao, P.; Gao, N.N. The cause of formation and temporal and spatial distribution characteristics of debris flow in the Bailong River basin. Renmin Changjiang River 2017, 48, 23–25+59. [Google Scholar]
  7. Panagoulia, D. Assessment of daily catchment precipitation in mountainous regions for climate change interpretation. Hydrol. Sci. J. 1995, 40, 331–350. [Google Scholar] [CrossRef]
  8. Miller, S.; Brewer, T.; Harris, N. Rainfall thresholding and susceptibility assessment of rainfall-induced landslides: Application to landslide management in St Thomas, Jamaica. Bull. Eng. Geol. Environ. 2009, 68, 539–550. [Google Scholar] [CrossRef]
  9. Guzzetti, F.; Gariano, S.L.; Peruccacci, S.; Brunetti, M.T.; Marchesini, I.; Rossi, M.; Melillo, M. Geographical landslide early warning systems. Earth-Sci. Rev. 2019, 200, 102973. [Google Scholar] [CrossRef]
  10. Wang, Y.; Nie, L.; Zhang, M.; Wang, H.; Xu, Y.; Zuo, T. Assessment of Debris Flow Risk Factors Based on Meta-Analysis—Cases Study of Northwest and Southwest China. Sustainability 2020, 12, 6841. [Google Scholar] [CrossRef]
  11. Aruth. Study on Risk Assessment of Debris Flow Disaster Chain on the North Slope of Changbai Mountain Induced by Multiple Disaster Factors Based on Multi model Coupling; Northeast Normal University: Changchun, China, 2021. [Google Scholar]
  12. Liu, X.L.; Tang, C.; Zhang, S.L. Quantitative determination method of debris flow risk in mountain valleys of China. Disaster Sci. 1993, 8, 1–7. [Google Scholar]
  13. Li, G.; Zhao, X.S.; Feng, L.H.; Liang, S.C.; Li, S.; Shi, X.S. Optimization of debris flow prevention scheme based on fuzzy evaluation method—Taking the debris flow in Qinghe County as an example. Chin. J. Geol. Hazards Prev. 2014, 25, 18–23. Available online: https://www.cnki.net/kcms/doi/10.16031/j.cnki.issn.1003-8035.2014.04.005.html (accessed on 20 October 2022).
  14. Panchal, S.; Shrivastava, A.K. Landslide hazard assessment using analytic hierarchy process (AHP): A case study of National Highway 5 in India. Ain Shams Eng. J. 2022, 13, 101626. [Google Scholar] [CrossRef]
  15. Shu, H.P.; Liu, D.F.; Gu, C.J.; Zhang, P.; Ma, J.Z. Risk Assessment of Small and Medium Scale Regional Debris Flow Disasters. J. Mt. Sci. 2014, 32, 754–760. [Google Scholar]
  16. Han, X. Risk Assessment of Debris Flow Disaster in Dongchuan District, Yunnan Province; Southwest Jiaotong University: Chengdu, China, 2018. [Google Scholar]
  17. Yalcin, A. GIS-based landslide susceptibility mapping using analytical hierarchy process and bivariate statistics in Ardesen (Turkey): Comparisons of results and confirmations. CATENA 2008, 72, 1–12. [Google Scholar] [CrossRef]
  18. Grelle, G.; Rossi, A.; Revellino, P.; Guerriero, L.; Guadagno, F.M.; Sappa, G. Assessment of Debris-Flow Erosion and Deposit Areas by Morphometric Analysis and a GIS-Based Simplified Procedure: A Case Study of Paupisi in the Southern Apennines. Sustainability 2019, 11, 2382. [Google Scholar] [CrossRef] [Green Version]
  19. Elkadiri, R.; Sultan, M.; Youssef, A.M.; Elbayoumi, T.; Chase, R.; Bulkhi, A.B.; Al-Katheeri, M.M. A Remote Sensing-Based Approach for Debris-Flow Susceptibility Assessment Using Artificial Neural Networks and Logistic Regression Modeling. IEEE J. Sel. Top. Appl. Earth Obs. Remote Sens. 2015, 7, 4818–4835. [Google Scholar] [CrossRef]
  20. Yu, M.; Xing, H.G.; Hu, S.Y. Debris flow vulnerability assessment based on information volume logic regression model—Taking Shimian County, Sichuan Province as an example. Renmin Changjiang River 2021, 52, 107–114. Available online: https://kns.cnki.net/kcms/detail/detail.aspx?doi=10.16232/j.cnki.1001-4179.2021.12.016 (accessed on 20 October 2022).
  21. Zhang, M. Analysis of artificial neural network early warning model of debris flow caused by rainfall. Heilongjiang Water Conserv. Sci. Technol. 2015, 43, 55–56+90. Available online: https://www.cnki.net/kcms/doi/10.14122/j.cnki.hskj.2015.12.020.html (accessed on 20 October 2022).
  22. Panagoulia, D.; Tsekouras, G.J.; Kousiouris, G. A multi-stage methodology for selecting input variables in ANN forecasting of river flows. Glob. Nest J. 2017, 19, 49–57. [Google Scholar]
  23. Wu, J.H.; Zhang, C.S.; Yang, W.M.; Meng, H.J.; Guo, H.; Wan, F.P. Risk assessment of debris flow in Zhujiagou Valley based on entropy weight variation coefficient fusion algorithm and FLO-2D. J. Nat. Disasters 2022, 31, 81–91. Available online: https://kns.cnki.net/kcms/detail/detail.aspx?doi=10.13577/j.jnd.2022.0108 (accessed on 7 December 2022).
  24. Cama, M.; Lombardo, L.; Conoscenti, C.; Rotigliano, E. Improving transferability strategies for debris flow susceptibility assessment: Application to the Saponara and Itala catchments (Messina, Italy). Geomorphology 2017, 288, 52–65. [Google Scholar] [CrossRef]
  25. Li, B.L.; Wang, C.M.; Li, Y.Y.; Zhang, S.H. Dynamic Response Study of Impulsive Force of Debris Flow Evaluation and Flexible Retaining Structure Based on SPH-DEM-FEM Coupling. Adv. Civ. Eng. 2021, 2021, 90098250. [Google Scholar] [CrossRef]
  26. Shan, B.; Chen, J.P.; Wang, Q. Sensitivity analysis of debris flow based on minimum entropy theory and unascertained measurement theory. Geotech. Mech. 2014, 35, 1445–1454. Available online: https://www.cnki.net/kcms/doi/10.16285/j.rsm.2014.05.015.html (accessed on 20 October 2022).
  27. Nikolova, V.; Kamburov, A.; Rizova, R. Morphometric analysis of debris flows basins in the Eastern Rhodopes (Bulgaria) using geospatial technologies. Nat. Hazards 2020, 105, 159–175. Available online: http://link-springer-com-443.beijingjiaoda.tsg211.com/article/10.1007/s11069-020-04301-4 (accessed on 20 October 2022). [CrossRef]
  28. Liu, Y.; Bai, H.; Wang, H.Y.; Wang, W.B.; Zeng, N. Comprehensive evaluation of debris flow based on sensitivity mapping and numerical simulation—Taking Shaga Valley of Jiujiang Mianyang Expressway as an example. Sci. Technol. Eng. 2021, 21, 9264–9274. [Google Scholar]
  29. Li, H.Y.; Tian, Q.; Wang, X.J.; Wu, Y.N. Multivariate coupling sensitivity analysis method based on a back-propagation network and its application. J. Hydrol. Eng. 2015, 20, 06014013. [Google Scholar] [CrossRef]
  30. Li, Q.; Lu, Y.; Wang, Y.; Xu, P. Debris Flow Risk Assessment Based on a Water–Soil Process Model at the Watershed Scale Under Climate Change: A Case Study in a Debris-Flow-Prone Area of Southwest China. Sustainability 2019, 11, 3199. [Google Scholar] [CrossRef] [Green Version]
  31. Hou, P.L. Development Law and Vulnerability Assessment of Debris Flow in the Upper Reaches of Minjiang River; Southwest University of Science and Technology: Mianyang, China, 2022; Available online: https://www.cnki.net/kcms/doi/10.27415/d.cnki.gxngc.2022.000280.html (accessed on 5 December 2022).
  32. Wang, C.M.; Tian, S.W.; Wang, Y.H.; Ruan, Y.K.; Ding, G.L. Debris flow risk assessment: Fuzzy c-means clustering support vector machine method. J. Jilin Univ. 2016, 46, 1168–1175. Available online: https://www.cnki.net/kcms/doi/10.13278/j.cnki.jjuese.201604203.html (accessed on 20 October 2022).
  33. Li, X.; Fan, J.R.; Zhang, J.Q. Application of WKFCM clustering algorithm based on weight in debris flow evaluation. Disaster Sci. 2015, 30, 214–218. [Google Scholar]
  34. Zheng, S. Spatial Characteristics Analysis and Zoning of Rainfall Induced Debris Flow in Liaoning Province; Liaoning Normal University: Dalian, China, 2018. [Google Scholar]
  35. Li, H.Y.; Yuan, R.X.; Wang, X.J.; Zhang, L.; Yu, W.Q. Analysis of rainfall characteristics in debris flow prone areas in Jilin Province. J. Nat. Resour. 2016, 31, 1222–1230. [Google Scholar]
  36. Wei, X.; Zhang, J.; Zhou, H.; Živanović, S. Sensitivity analysis for pedestrian-induced vibration in footbridges. Buildings 2022, 12, 883. [Google Scholar] [CrossRef]
  37. Yin, G.F.; Zhang, Y.J.; Hu, L.; Yu, S.H.; Xiao, X.; Wang, H.B.; Shi, C.Y.; Duan, J.B.; Liu, W.Q. Sensitivity analysis of BP neural network water bloom prediction model. J. Beijing Univ. Technol. 2012, 32, 1288–1293. [Google Scholar]
  38. Qiang, D.X.; Ma, H.Z.; Zhu, Z.P.; Gou, Y.M. Spatial Distribution and Analysis of Debris Flow in Jishishan County, Gansu Province. Surv. Mapp. Bull. 2022, 107–111+117. Available online: https://kns.cnki.net/kcms/detail/detail.aspx?doi=10.13474/j.cnki.11-2246.2022.0212 (accessed on 20 October 2022).
  39. Li, C.X.; Ma, Y.; He, Y.X. Sensitivity analysis of debris flow disaster causing factors—Taking the Longxi River Basin in Dujiangyan, Sichuan Province as an example. Chin. J. Geol. Hazards Prev. 2020, 31, 32–39. [Google Scholar]
  40. Walter, F.; Amann, F.; Kos, A.; Kenner, R.; Phillips, M.; de Preux, A.; Huss, M.; Tognacca, C.; Clinton, J.; Diehl, T.; et al. Direct observations of a three million cubic meter rock-slope collapse with almost immediate initiation of ensuing debris flows. Geomorphology 2020, 351, 106933. [Google Scholar] [CrossRef]
  41. Xu, H. Research on the Estimation Model of the Critical Concentration of Loose Solid Matter in Debris Flow. J. Southwest Jiaotong Univ. 1995, 30, 212–217. [Google Scholar]
  42. Gao, Y.C.; Li, M.H.; Wang, D.H.; Bai, Y.J. Preliminary study on the inhibition of vegetation on different types of debris flows. Res. Water Soil Conserv. 2013, 20, 291–295+299. [Google Scholar]
  43. Jin, S.G.; Zhu, W.Y. Analysis of Atlantic expansion change based on global plate motion model. Surv. Mapp. Sci. 2002, 1, 32–35. [Google Scholar]
  44. Zhang, G.X.; Wang, S.G. Preliminary Study on the Ecological Environment of the Xiaojiang River Basin in Dongchuan, Yunnan Province and Protection Countermeasures. Res. Water Soil Conserv. 2006, 13, 50–52. [Google Scholar]
  45. Hu, J.; Qin, G.H.; Wang, R.Y.; Wang, S.R.; Xiao, H. Numerical simulation of slope surface flow characteristics under different slopes and vegetation coverage. J. Soil Water Conserv. 2022, 36, 37–43. Available online: https://kns.cnki.net/kcms/detail/detail.aspx?doi=10.13870/j.cnki.stbcxb.2022.03.006 (accessed on 20 October 2022).
  46. Wang, G.Z.; Li, Z.Y.; Cheng, H.L.; Zhang, J.Y.; Gao, J.Q.; Yang, D.; Li, X.H.; Lu, Y.Z. Study on Vegetation Coverage Distribution in Different Slope Zones in Yanshi District. Hubei Agric. Sci. 2022, 61, 106–110. Available online: https://kns.cnki.net/kcms/detail/detail.aspx?doi=10.14088/j.cnki.issn0439-8114.2022.05.020 (accessed on 20 October 2022).
  47. Cui, C.F. GIS and AHP Based Debris Flow Vulnerability Assessment on Both Sides of Daban Tangwang Section of Taohe River; Henan Polytechnic University: Jiaozuo, China, 2019. [Google Scholar]
  48. Chen, Z.X.; Wang, R.; Hu, M.J.; Wang, Z.B.; Xu, D.S. Analysis of the impact of clay particle content on the initiation of debris flow in Jiangjia Valley. Geotech. Mech. 2010, 31, 2197–2201. Available online: https://www.cnki.net/kcms/doi/10.16285/j.rsm.2010.07.007.html (accessed on 6 December 2022).
  49. Cao, Y.Q.; Zhang, R.N.; Li, L.H.; Lu, J.; Ning, Y. Study on the relationship between debris flow and precipitation factors at different time scales in Liaoning Province. Disaster Sci. 2021, 36, 51–56. [Google Scholar]
  50. Fu, H.C.; Xu, X.C. Evaluation of sensitivity of debris flow to slope. China Water Transp. 2017, 17, 353–355. [Google Scholar]
  51. Cao, L. Impact of Plateau Vegetation on Debris Flow. Agric. Disaster Res. 2021, 11, 92–93. [Google Scholar]
  52. Shao, Z.C. Analysis of the impact of vegetation coverage on the development of debris flow. Value Eng. 2017, 36, 151–152. Available online: https://www.cnki.net/kcms/doi/10.14018/j.cnki.cn13-1085/n.2017.10.060.html (accessed on 20 October 2022).
  53. Peng, R. Comprehensive Exploration and Analysis of Debris Flow Characteristics in Xiaojiang River Basin; Kunming University of Science and Technology: Kunming, China, 2019; Available online: https://www.cnki.net/kcms/doi/10.27200/d.cnki.gkmlu.2019.001484.html (accessed on 5 December 2022).
  54. Zhang, L. Analysis on the Characteristics of Rainstorm and Flood Induced Debris Flow in Jilin Province; Jilin University: Changchun, China, 2015. [Google Scholar]
  55. Tian, X.H.; Zhu, H.Y.; Han, J.Y.; Chu, Y.X.; Xue, K.X.; Xu, G.B.; Qi, X.H. Dynamic assessment of rainfall induced debris flow risk. Sci. Technol. Eng. 2022, 22, 5411–5416. [Google Scholar]
Figure 1. Geographical location of Liaoning Province.
Sustainability 15 00412 g001
Figure 2. Self-organizing mapping network topology. Note: The blue arrows represent the mapping direction of the winning neuron.
Sustainability 15 00412 g002
Figure 3. Topographical features and frequency of debris flows in Liaoning province: (a) Elevation; (b) Slope; (c) Slope direction; (d) Landforms.
Sustainability 15 00412 g003
Figure 4. Soil types and frequency of debris flows in Liaoning province: (a) Clay; (b) Sand; (c) Silt; (d) Soil types.
Sustainability 15 00412 g004
Figure 5. Vegetation cover and frequency of debris flows in Liaoning province: (a) Land use; (b) NDVI; (c) Vegetation.
Sustainability 15 00412 g005
Figure 6. Classification chart of debris-flow events in Liaoning province: (a) Type I debris-flow event; (b) Type II debris-flow event; (c) Type III debris-flow event; and (d) Type I, II, III debris-flow events.
Sustainability 15 00412 g006
Figure 7. Mid-to long-term warning distribution of debris-flow-prone areas in Liaoning province.
Sustainability 15 00412 g007
Table 1. Quantitative characteristics of environmental factors for different types of debris flow sites.
CategoryFirst SpeciesSecond SpeciesThird Species
Debris flow eventT6, T10, T41, T42, T52……T1, T2, T20, T36, T37……T0, T3, T4, T5, T7……
Number209114215
Clay12–29%12–16%10–19%
Sand32–54%60–70%33–66%
Silt16–38%18–32%22–38%
Slope<40.84°10°–45°<30°
Altitude0 m–977 m200 m–666 m0 m–558 m
Land useCropland, Forest, Grassland, Water, ImperviousCropland, Forest, Grassland, ImperviousCropland, Forest, Grassland, Water, Impervious
LandformsPlain, Platform, Hill, Small undulating mountain, Medium undulating mountainPlain, Platform, Hill, Small undulating mountain, Medium undulating mountainPlain, Platform, Hill, Small undulating mountain, Medium undulating mountain
NDVI0.30–0.590.36–0.590.28–0.62
VegetationConiferous forest, Broad-leaved forest, Coniferous Broad-leaved mixed forest, Thicket, Meadow, Cultivated plantsConiferous forest, Broad-leaved forest, Coniferous Broad-leaved mixed forest, Thicket, Meadow, Cultivated plantsConiferous forest, Broad-leaved forest, Coniferous Broad-leaved mixed forest, Thicket, Meadow, Cultivated plants
Slope direction0–360°0–360°0–360°
SoiltypesNeutral coarse skeletal soil, Meadow soil, Brown loamy soil, Rice soilNeutral coarse skeletal soil, Meadow soil, Brown Soil, Tidal brown soil, Brown loamy soil, Dark brown soil, Cinnamon soilCoarse bony soil, Neutral coarse skeletal soil, Meadow soil, Brown Soil, Tidal brown soil, Brown loamy soil, Cinnamon soil, Lakes and Reservoirs
Table 2. Analysis of the degree of impact of environmental factors for three types of debris-flow events.
CategoryFirst SpeciesSecond SpeciesThird Species
Clay0.9860.9920.792
Sand0.7260.8910.981
Silt0.8310.8110.625
Slope0.7680.6440.647
Altitude0.7070.6810.636
Land use0.6680.7460.778
Landforms0.6660.7030.706
NDVI0.6220.6860.616
Vegetation0.4340.5920.527
Slope direction0.2900.5780.32
Soil types0.5020.4940.406
Disclaimer/Publisher’s Note: The statements, opinions and data contained in all publications are solely those of the individual author(s) and contributor(s) and not of MDPI and/or the editor(s). MDPI and/or the editor(s) disclaim responsibility for any injury to people or property resulting from any ideas, methods, instructions or products referred to in the content.

