
Research on Wind Power Energy Storage Joint Optimization Operation under the Double Detailed Rules Assessment Taking into Account the Benefits of Green Certificate

Abstract
:1. Introduction
1.1. Background
1.2. Literature Review
- (1)
- Based on the double-rule assessment system for power plants adopted by many provinces in China, this paper first considers the assessment costs when new energy is connected to the grid, which leads to the important role of energy storage in improving the accuracy of new energy prediction, which can effectively reduce the assessment costs of new energy, improve the revenue from electricity sales, reduce wind abandonment, guide new energy stations to configure energy storage, and solve the security problems of large-scale new energy grid connection in the future. Promoting the sustainable development of green energy plays an important role.
- (2)
- Secondly, this paper considers the benefits of green electricity in the green certificate market, constructs a green certificate revenue model, and designs a green certificate quantity assessment model based on the accuracy of forecast output to promote energy storage to better track the new energy output, further reduce the grid connection assessment fees of new energy stations, which is of great significance for paying attention to the value of green certificates, more reasonable arrangement of energy storage charging and discharging, and promoting the consumption of new energy.
- (3)
- In addition, considering the disadvantage of local convergence of traditional particle swarm optimization algorithms, this paper improves the learning factor and inertia coefficient of the algorithms. The results of numerical examples show that the improved algorithm has better stability and superiority.
- (4)
- This paper couples the electric energy market and the green certificate market, build the optimal operation model of the wind storage consortium based on the maximum revenue of the combined market, and obtains the optimal charging and discharging strategy of energy storage. The feasibility of the model is verified by an example, which improves the electricity sales revenue and green certificate revenue of new energy manufacturers and is of great significance for new energy stations to guide energy storage operations.
- (5)
- This paper compares and analyzes the benefits under different deviation coefficient and penalty factor scenarios and draws reasonable conclusions. Furthermore, the reliability of the model used in this paper shows the flexible regulation of energy storage.
2. Strategy and Modeling
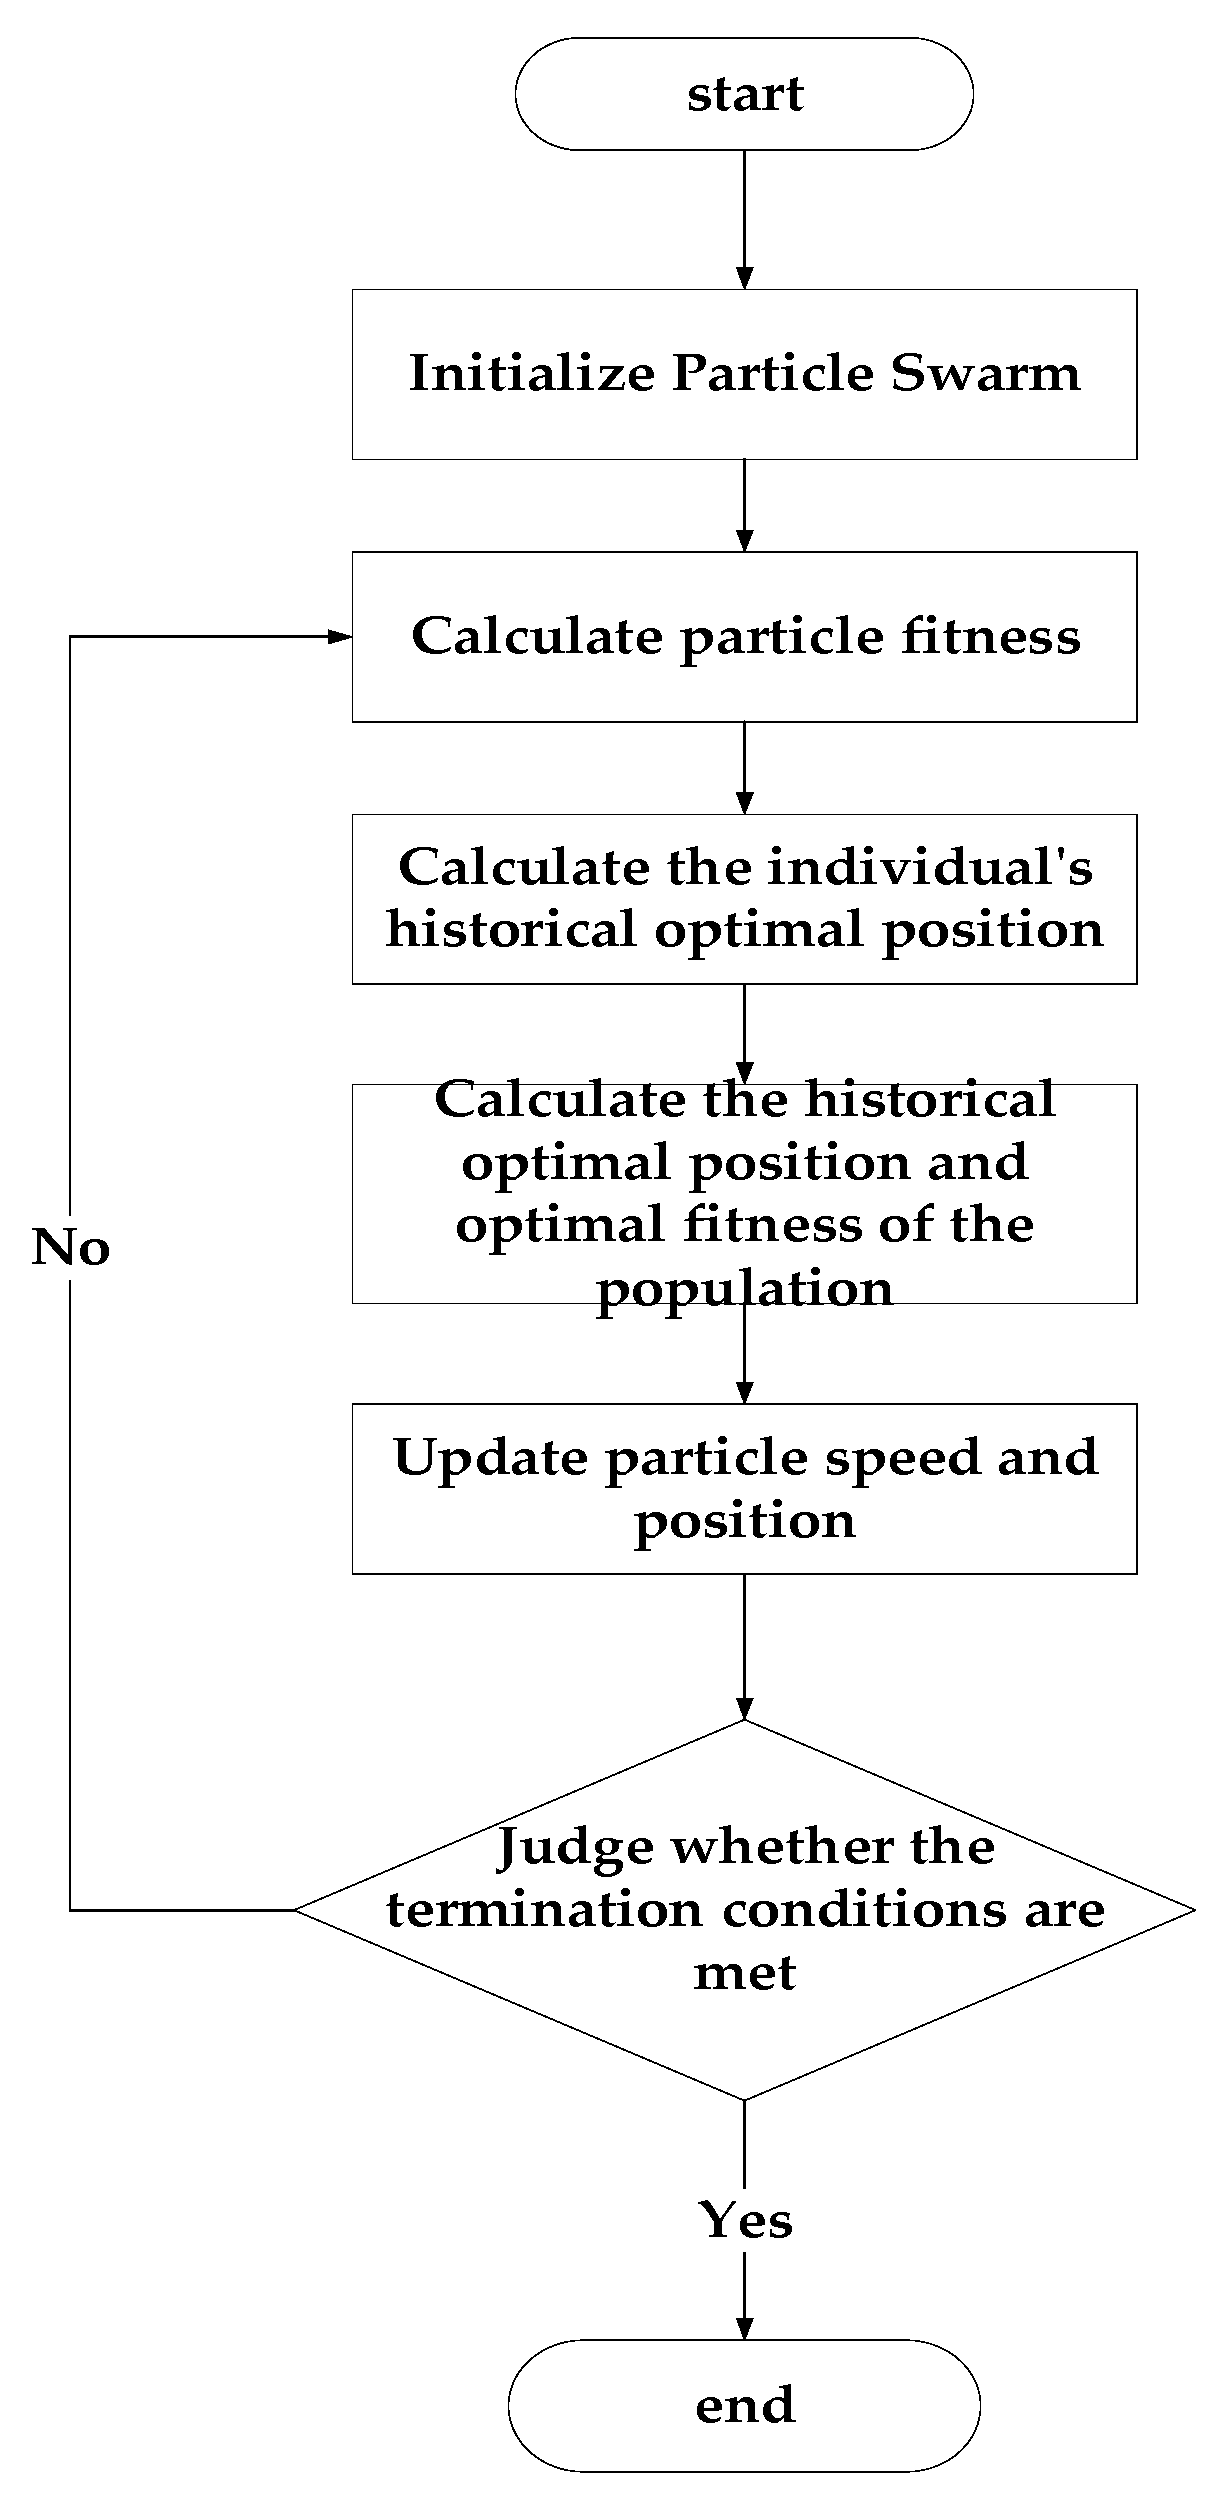
2.1. Basic Particle Swarm Optimization
2.2. Improved Particle Swarm Optimization Algorithm
3. Construction of Daily Profit Model of Wind Storage Joint Operation Taking into Account Green Certificate Income
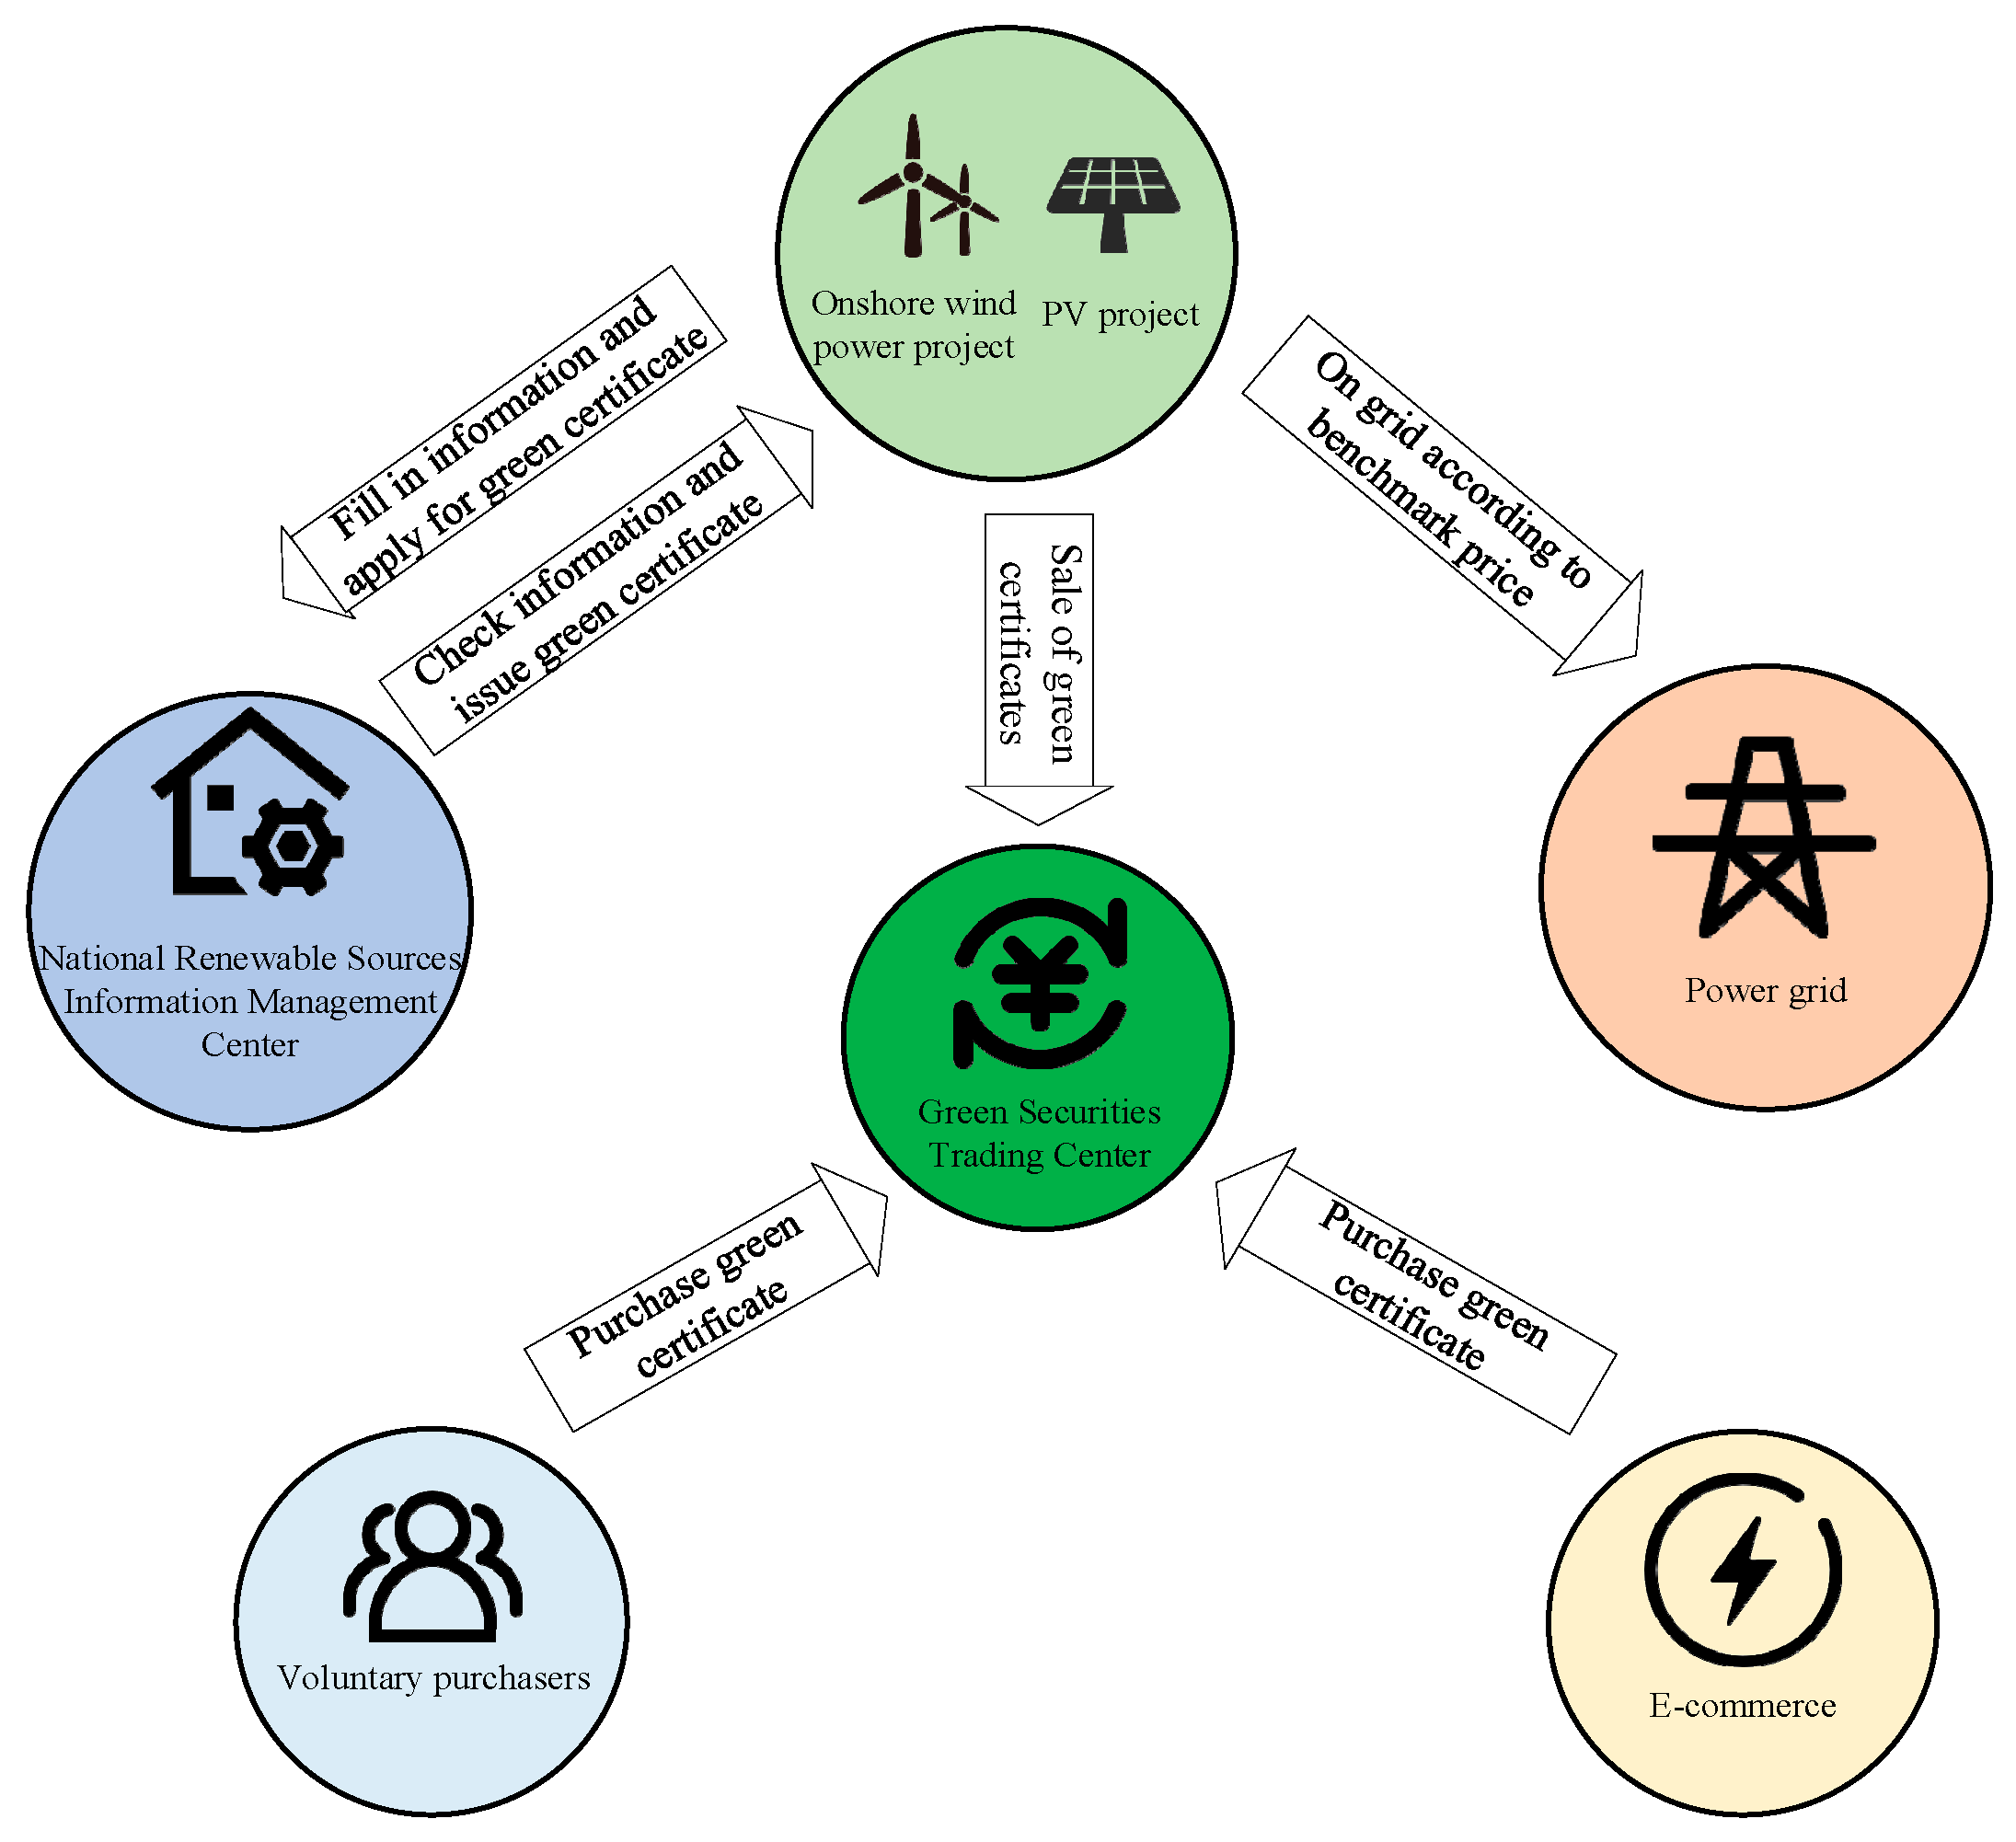
3.1. The Construction of the Green Certificate Income Model
- (1)
- Issuing subject and object: The National Renewable Energy Information Management Center will issue the green certificate and issue the corresponding certificate to the enterprise according to the standard of 1 MWH of settlement electricity for each certificate.
- (2)
- Transaction subject and transaction method: Onshore wind power and ground centralized photovoltaic power stations and also wind power generation projects with low prices and low prices that are included in the national renewable energy price subsidy catalog can apply for green certificates. Distributed photovoltaic projects and offshore wind power projects are not qualified to apply for the green certificate. The buyer of green certificates refers to government agencies, enterprises, institutions, social institutions, and individuals at all levels. The trading methods are mainly listed as sale and agreement transfers.
- (3)
- Pricing of green certificates and separation of securities and electricity: China adopts a voluntary subscription system for green certificates. The subscription price is determined by the buyer and the seller through self-negotiation or bidding by the amount of additional fund subsidies of renewable energy electricity price not higher than the corresponding electricity quantity of the certificate. In addition, each green certificate transaction does not correspond to the physical transportation or use of green electricity one by one. That is, the purchase of green certificates declaring the use of green electricity does not mean that enterprises consume the corresponding green electricity. As an asset certificate, green certificates show the support of government agencies, enterprises, or individuals on the attitude of new energy power generation.
- (1)
- Separation of syndrome and electricity
- (2)
- Voluntary transactions
3.2. Construction of Daily Revenue Model of Wind Storage Joint Operation
3.2.1. Objective Function
3.2.2. Constraints
- (1)
- Energy storage system constraints
- (2)
- Penalty constraint for a combined output of wind power and energy storage
4. Case Study
4.1. Model Basic Parameter Setting
4.2. Result Analysis
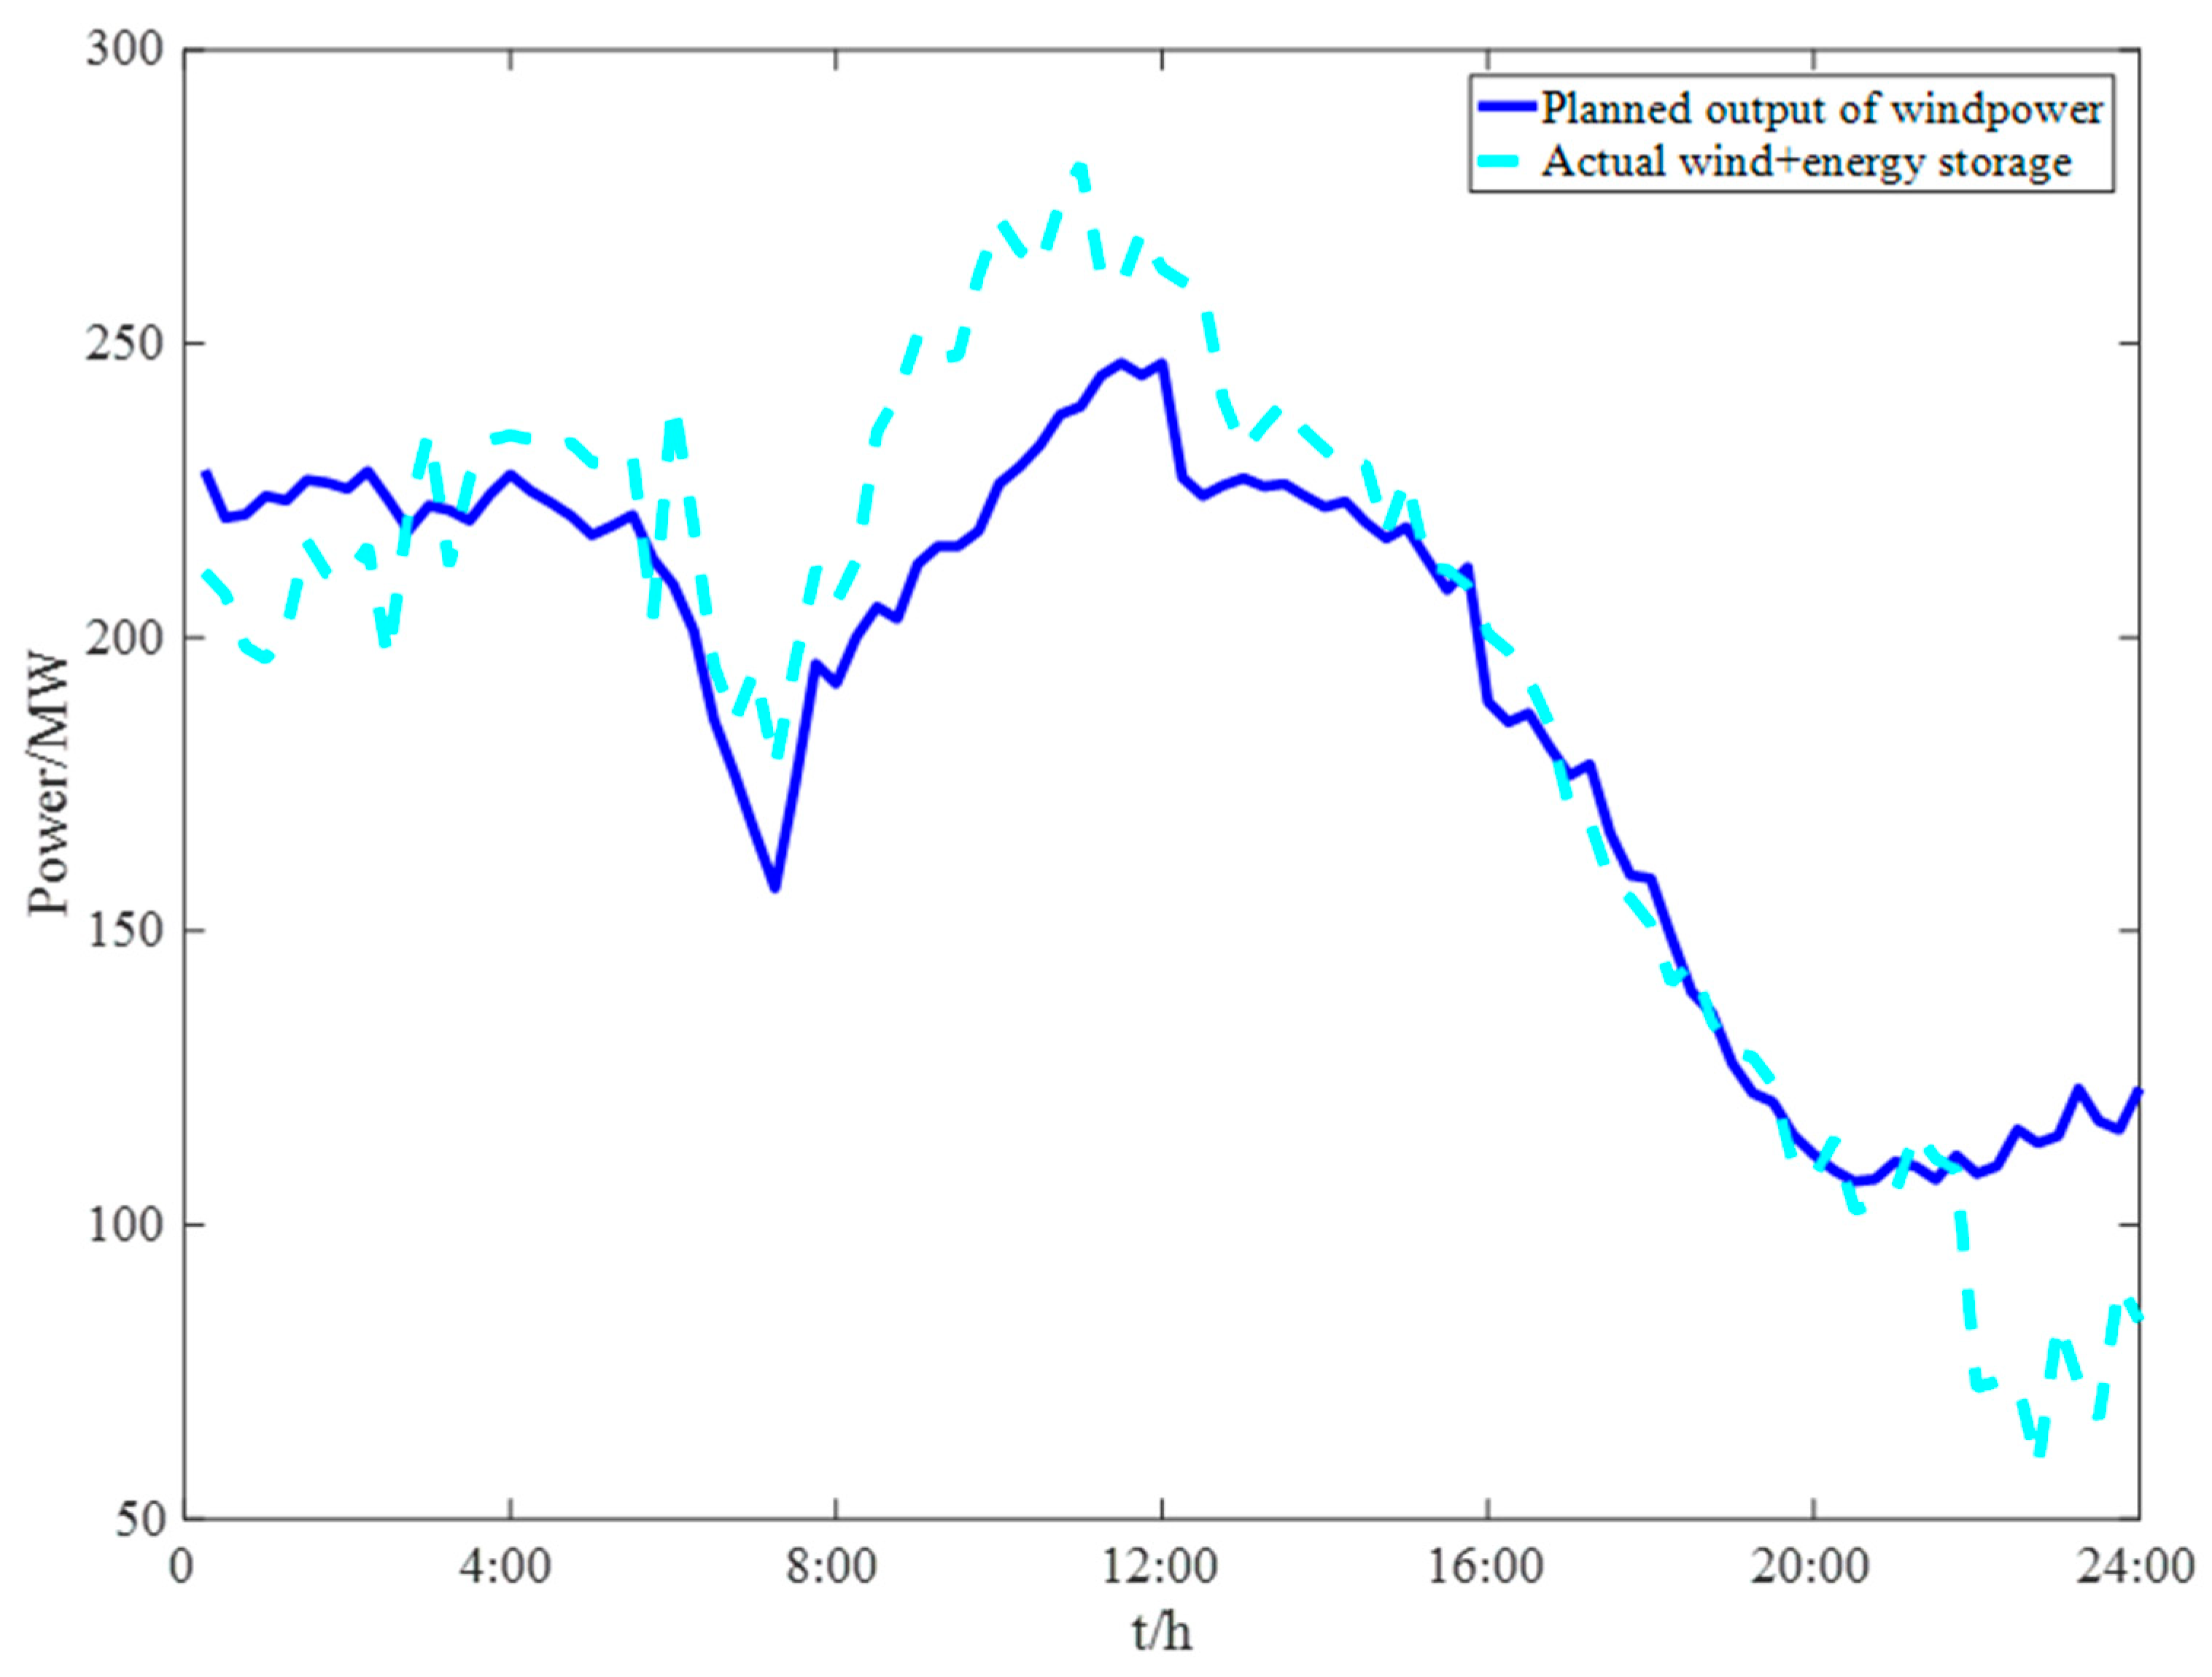
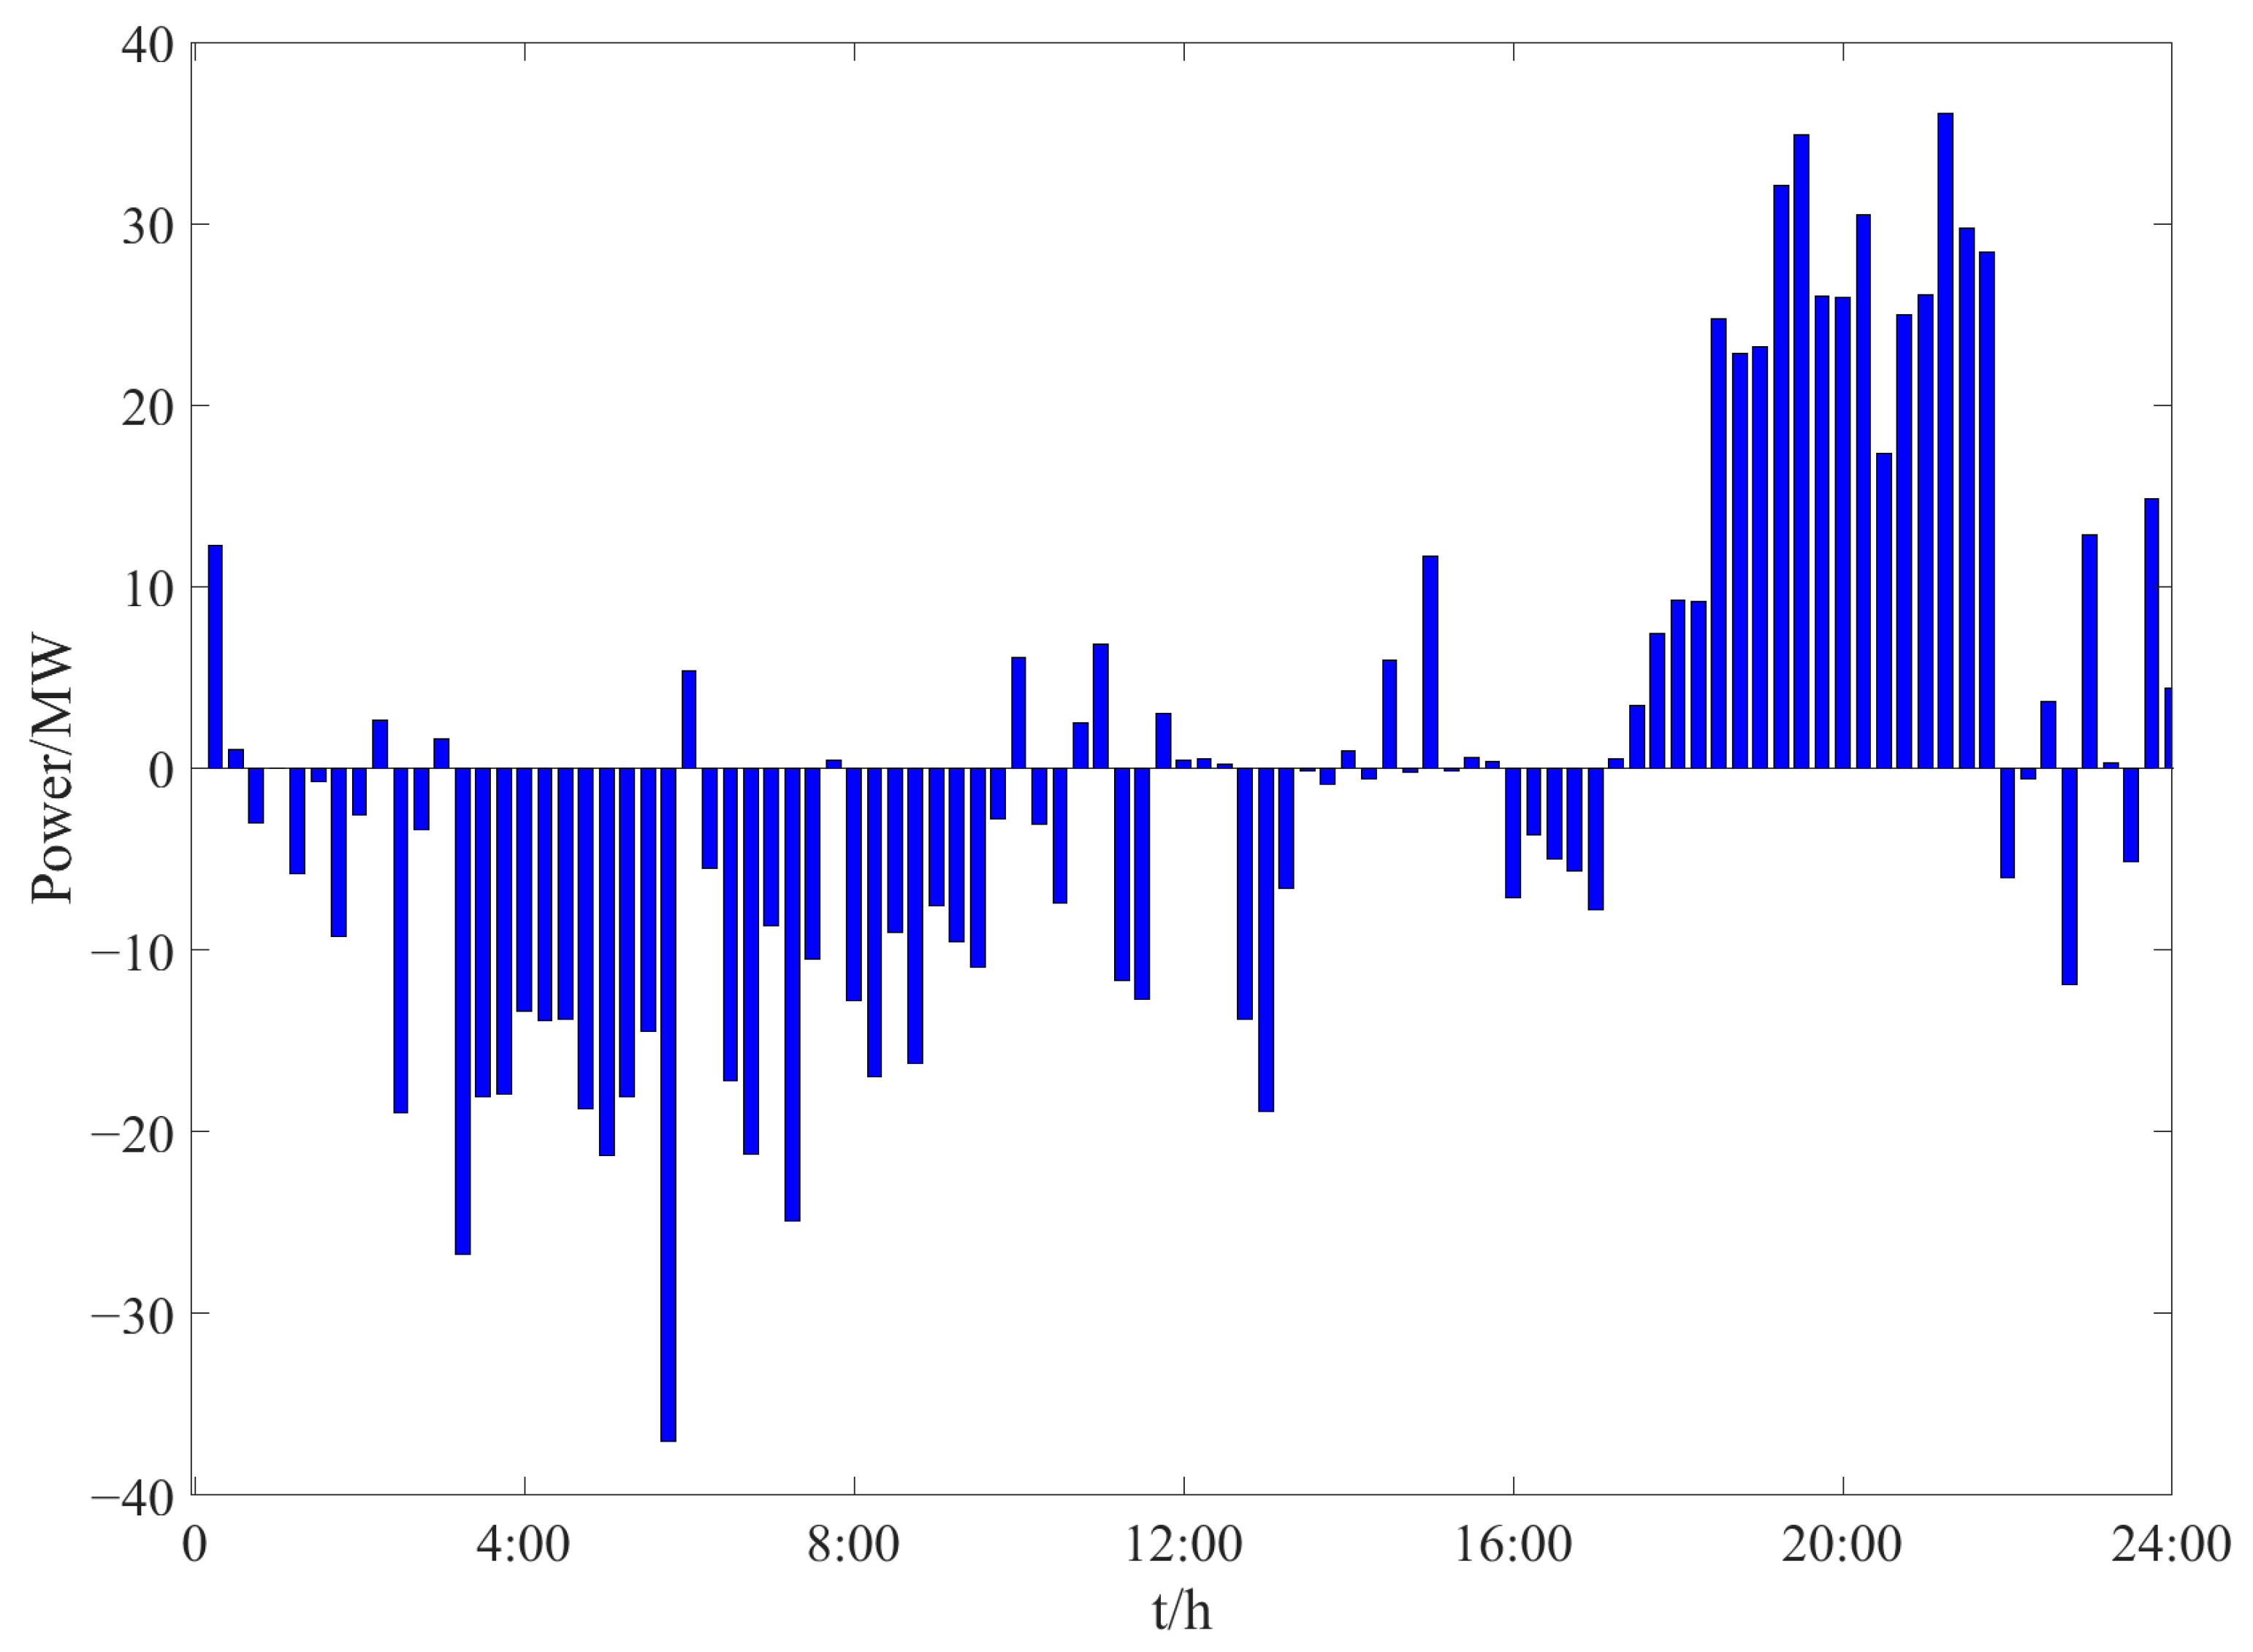
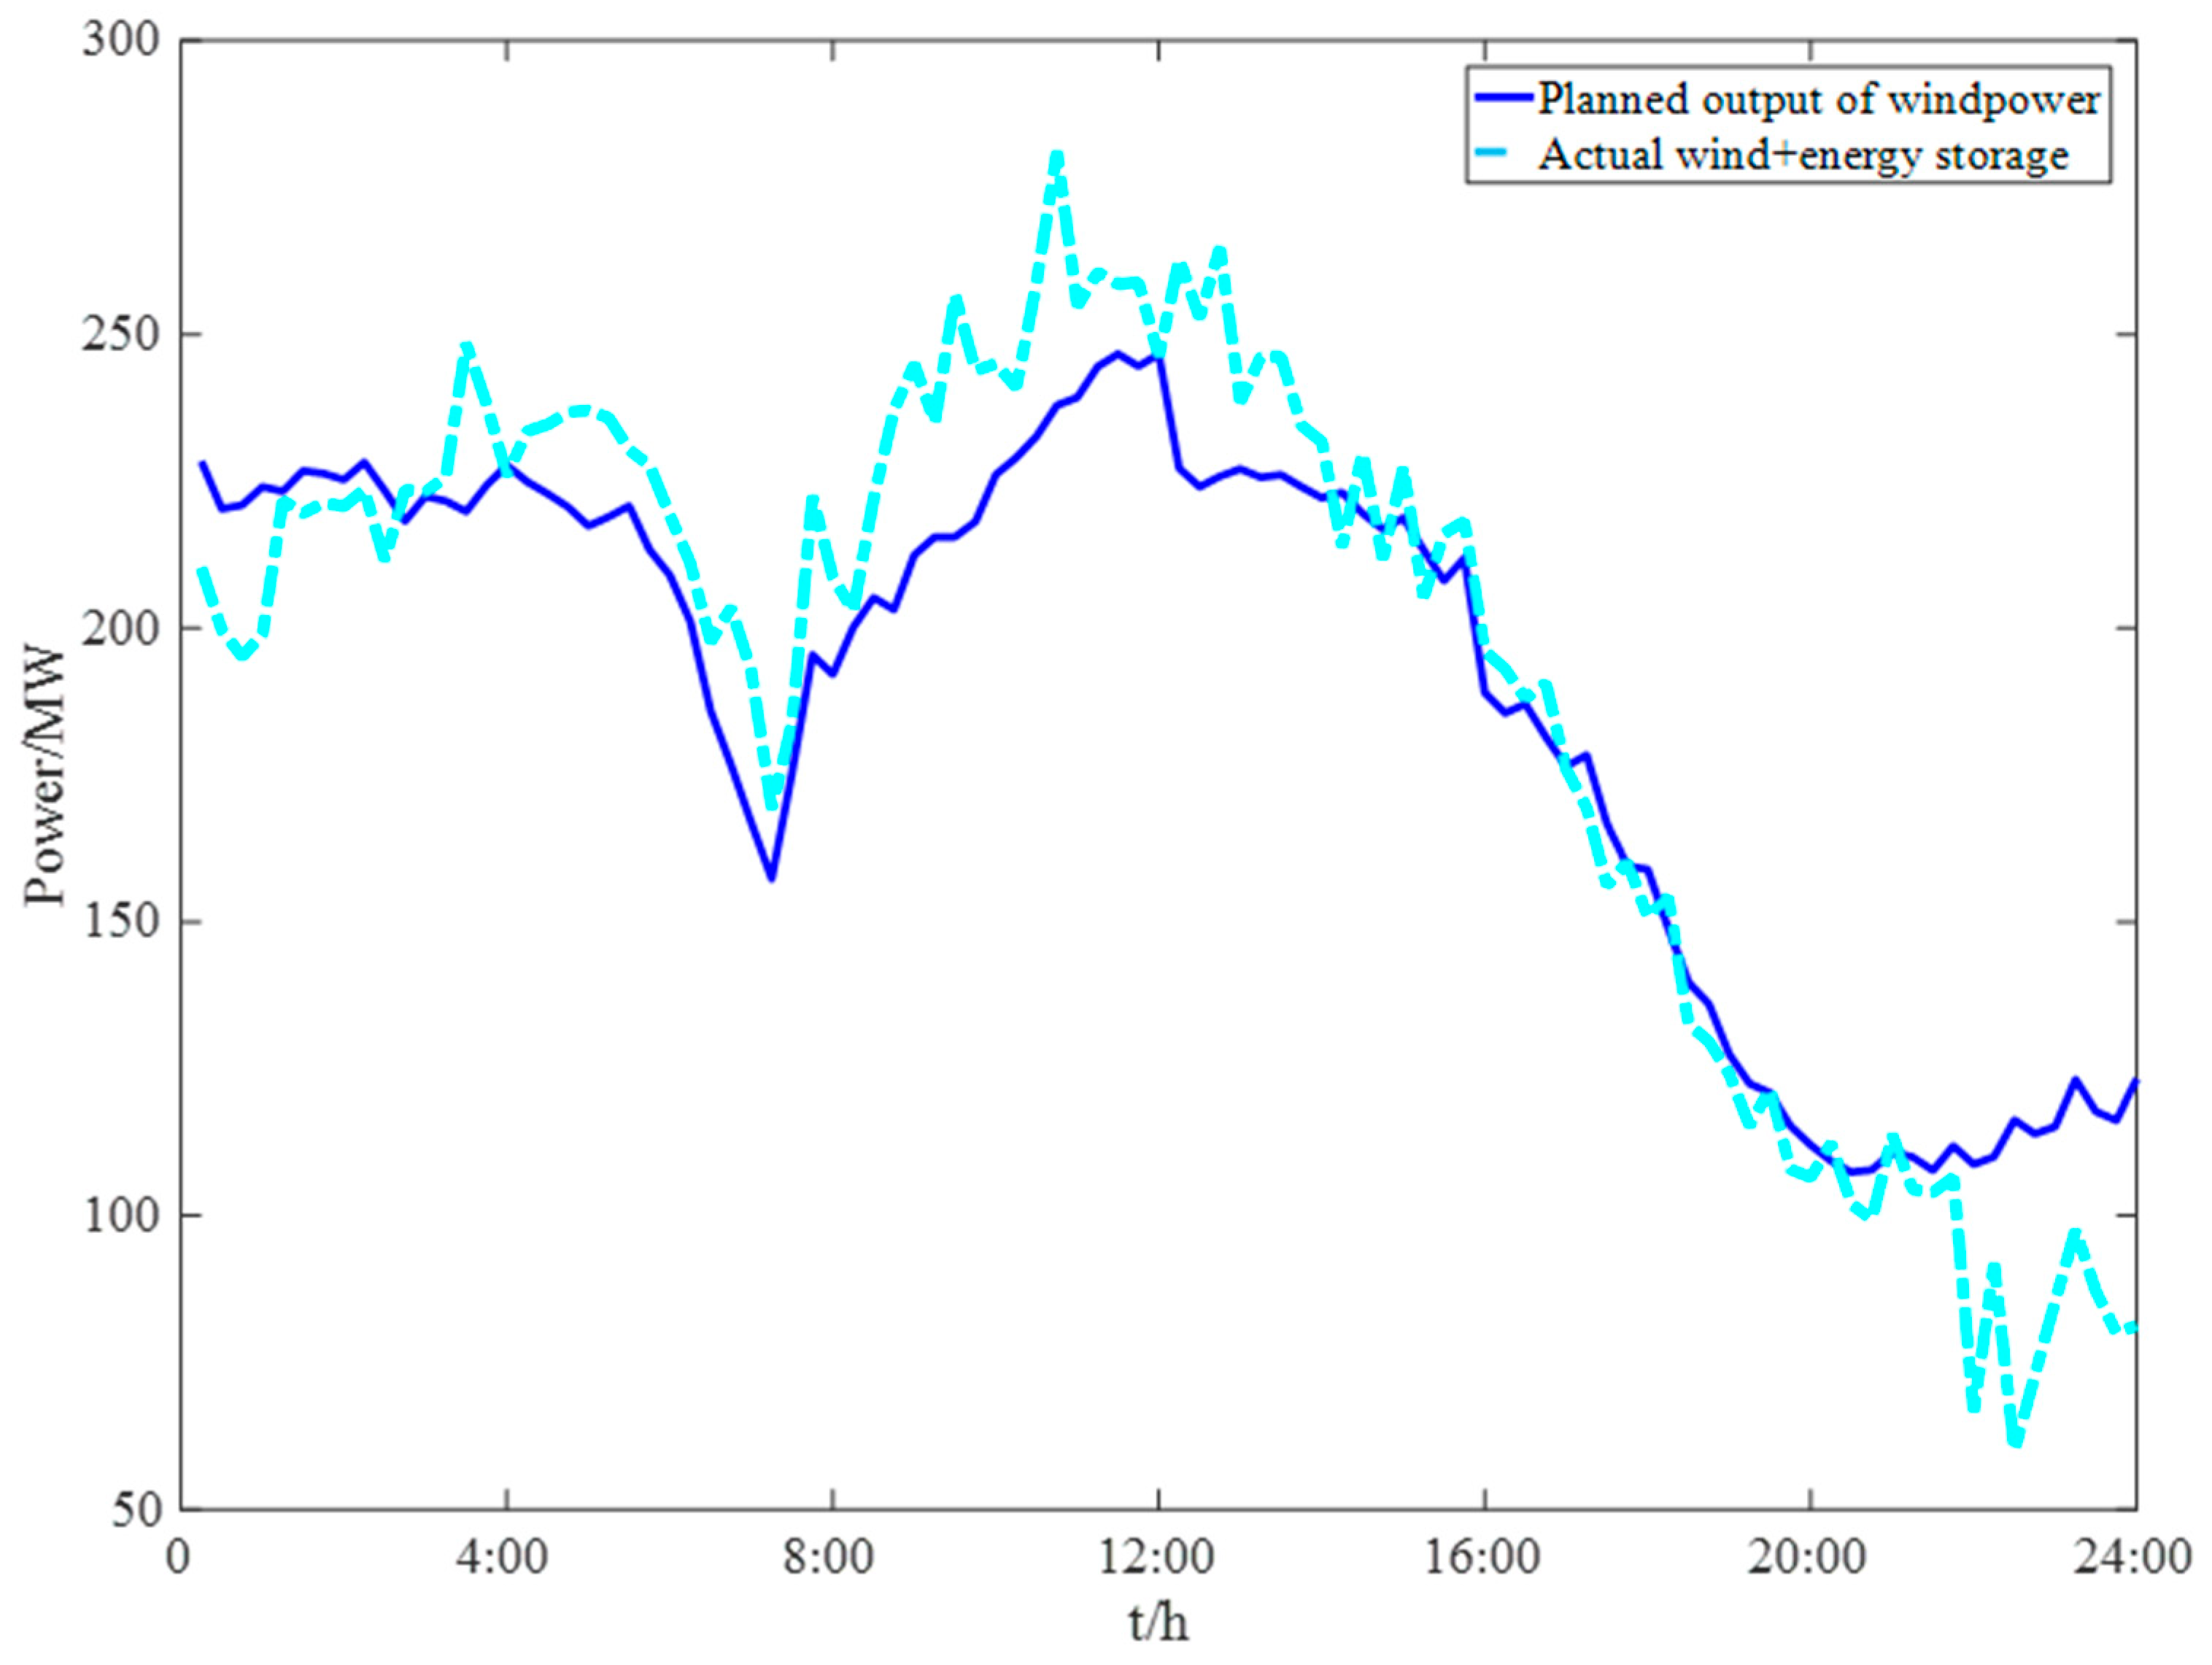
4.2.1. Independent Operation of Wind Power Plant
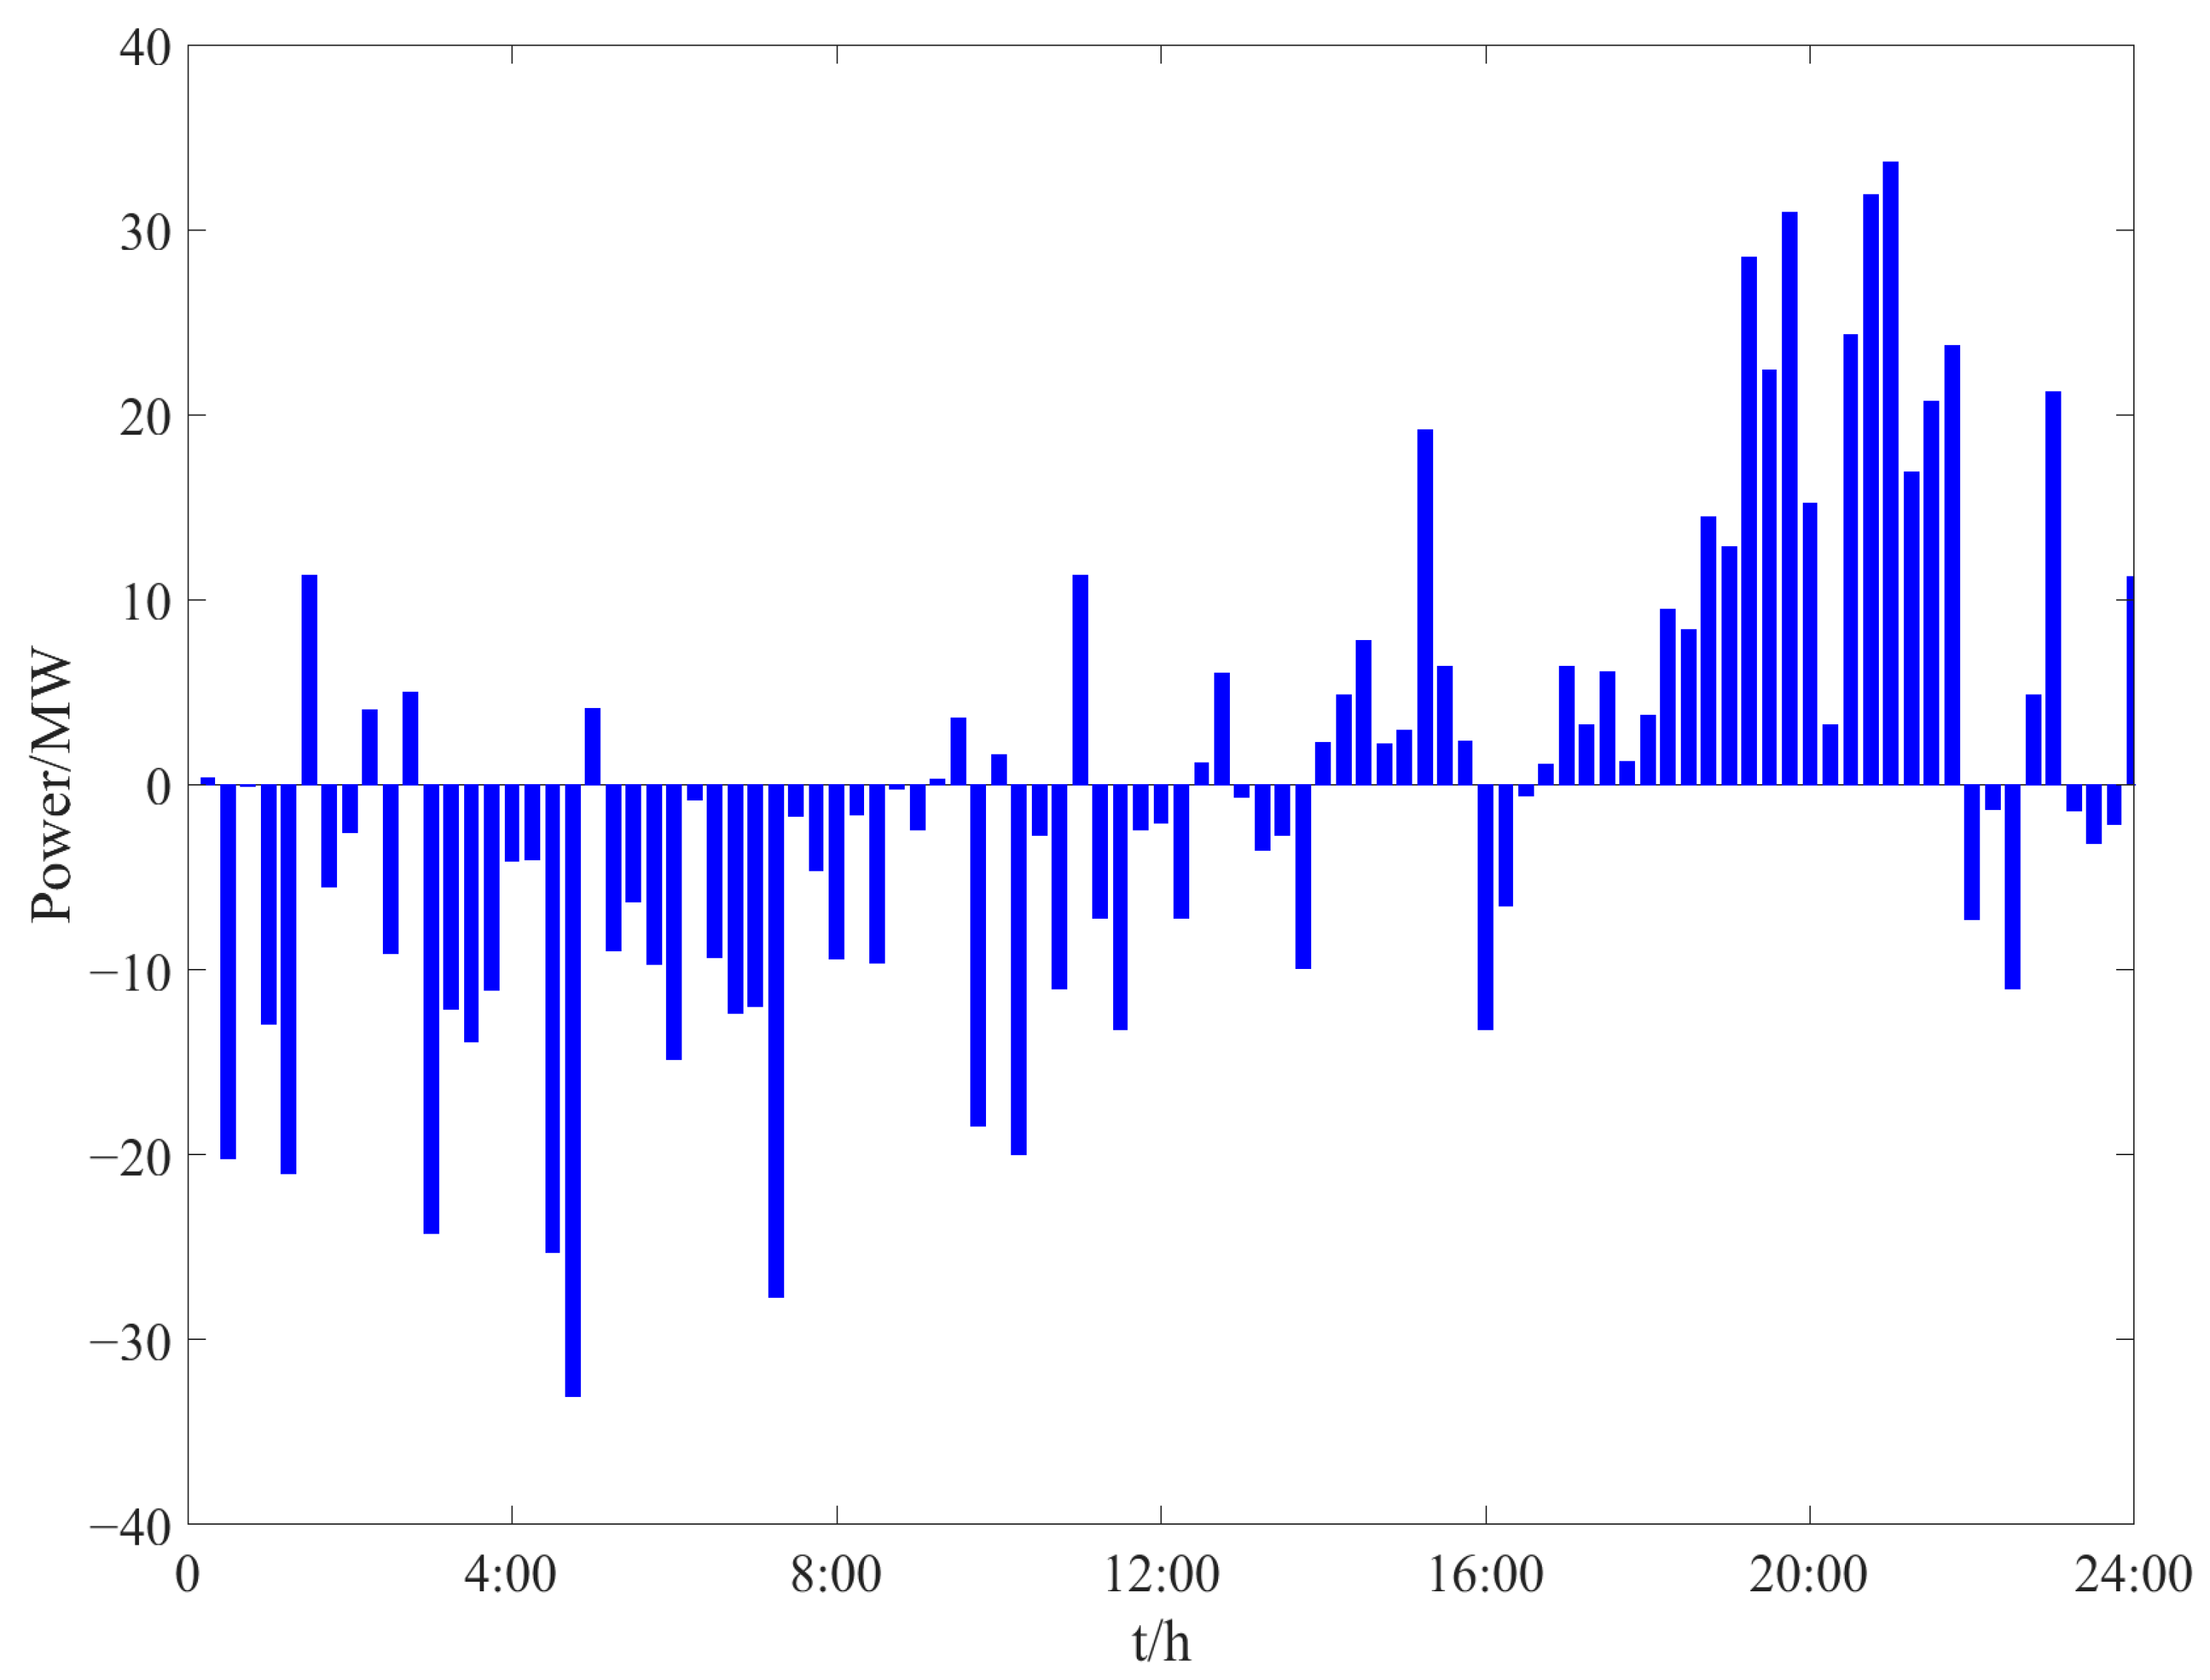
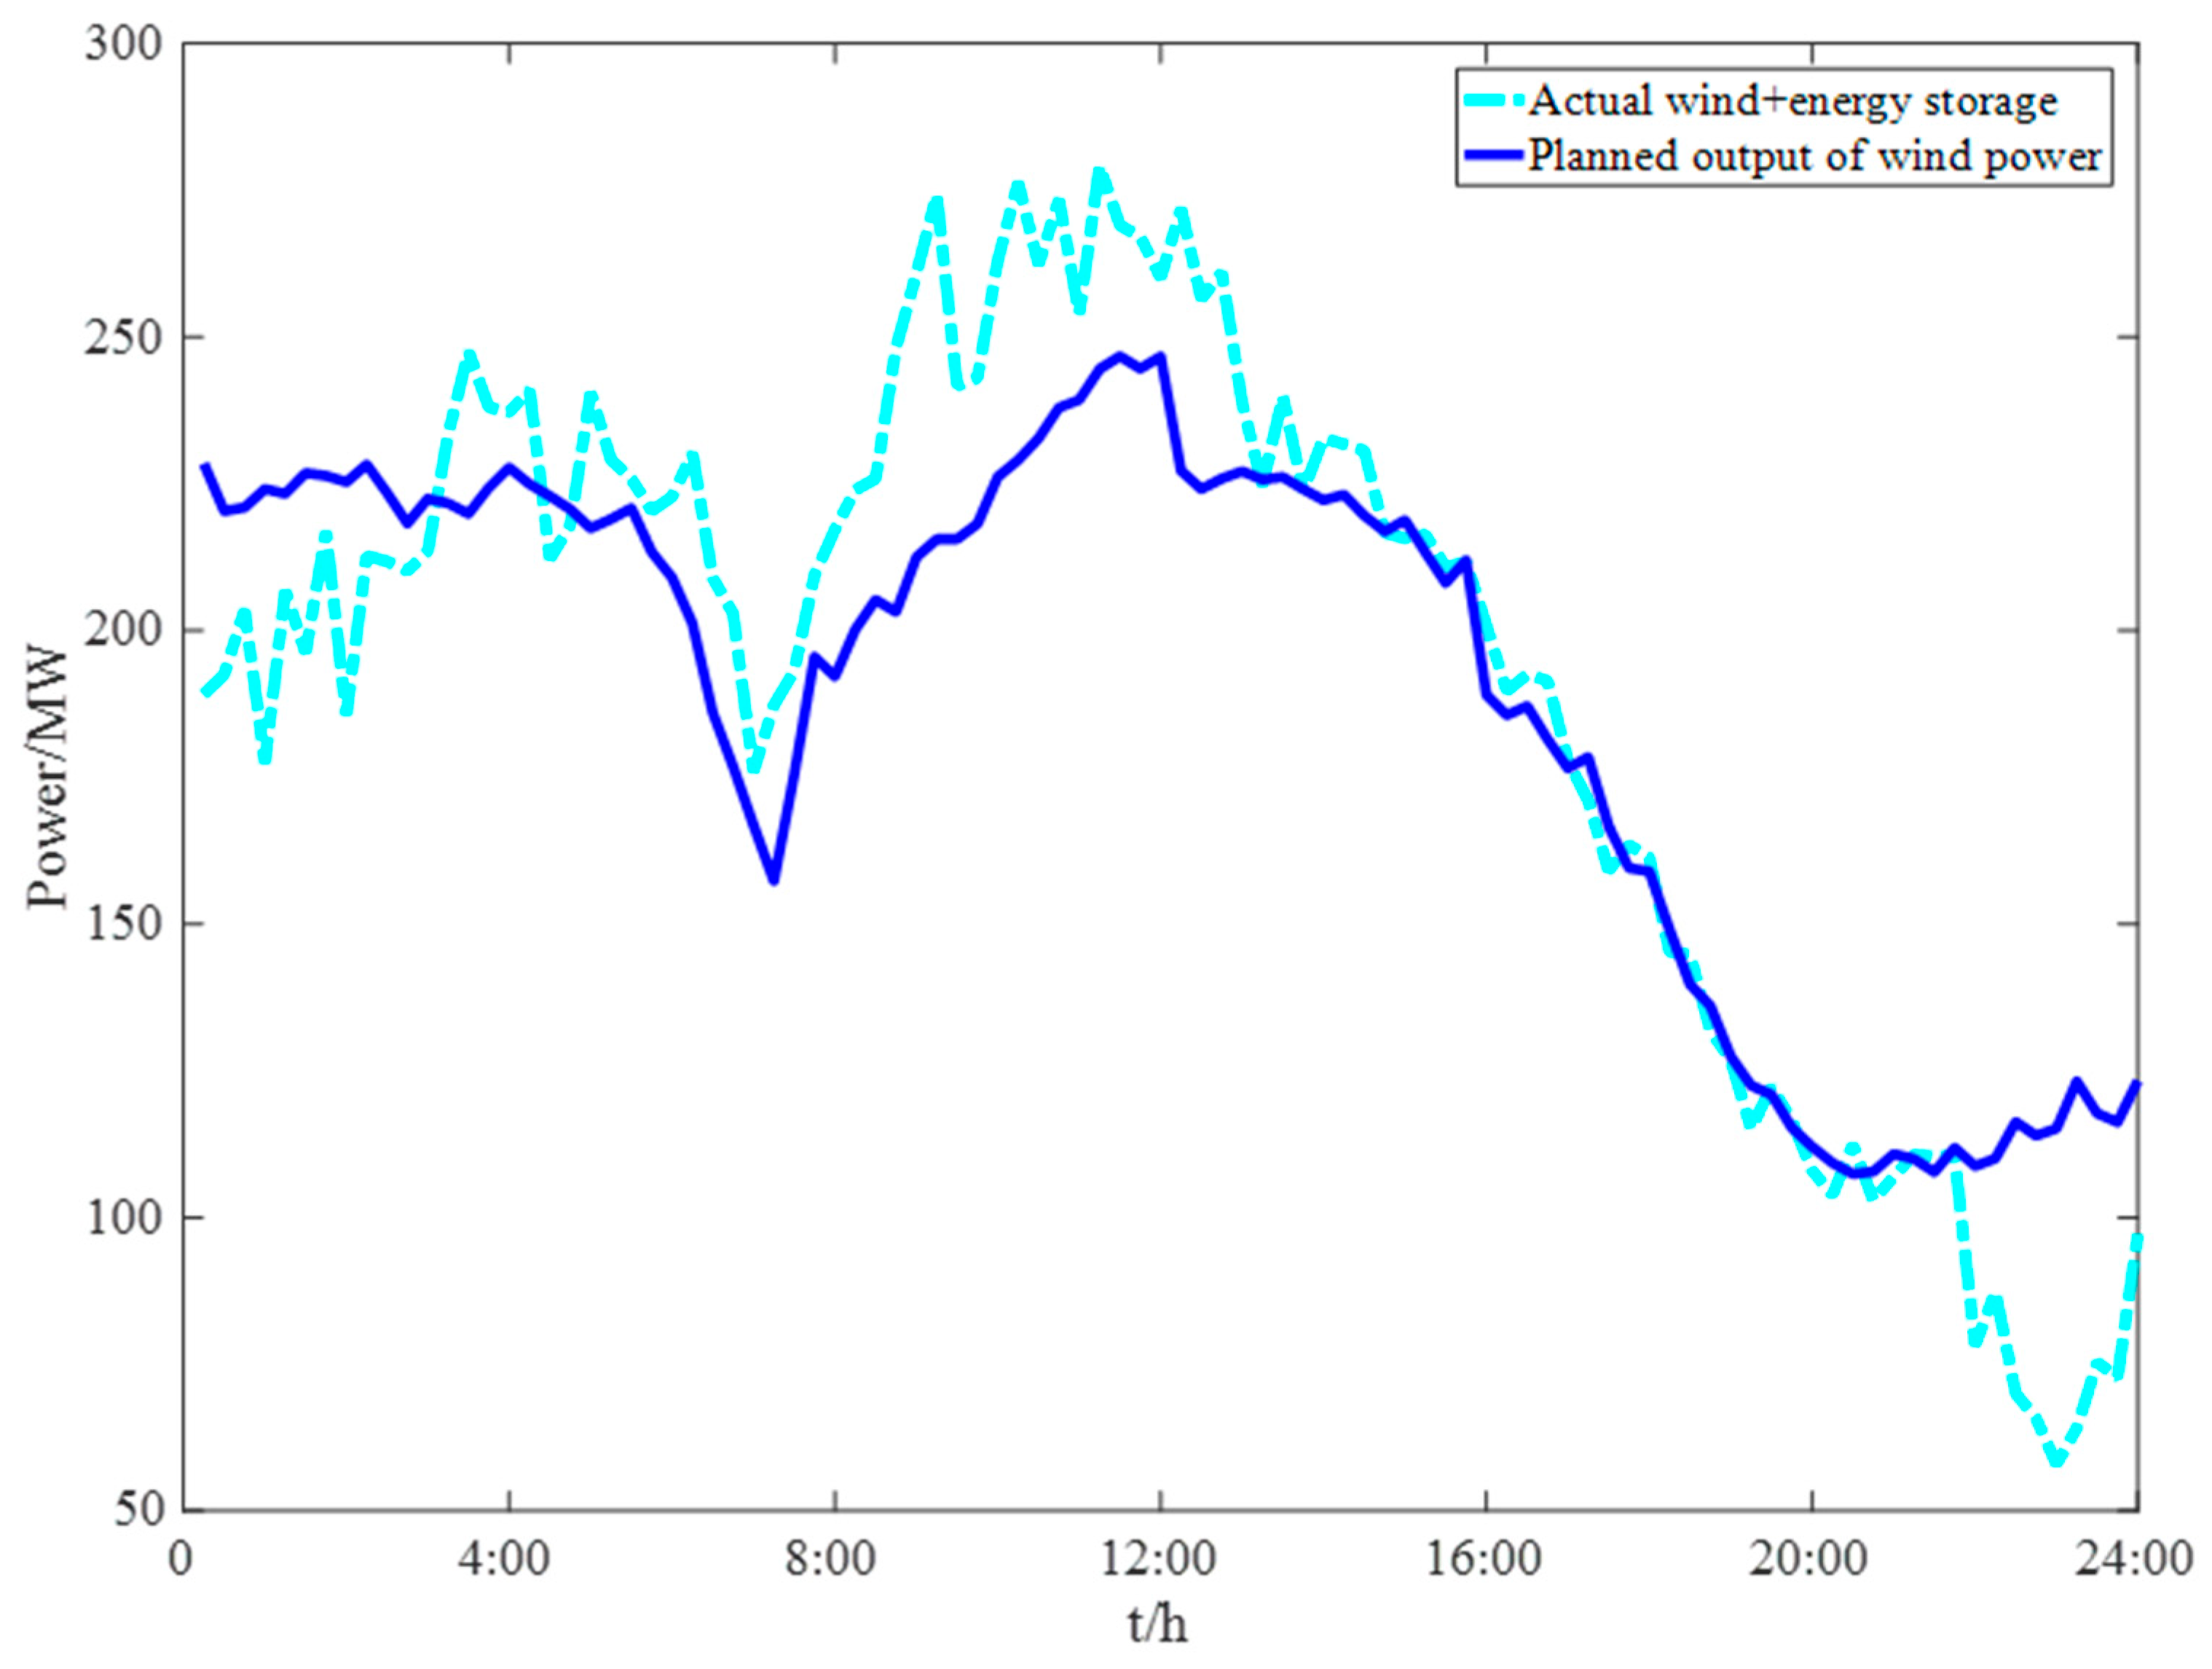
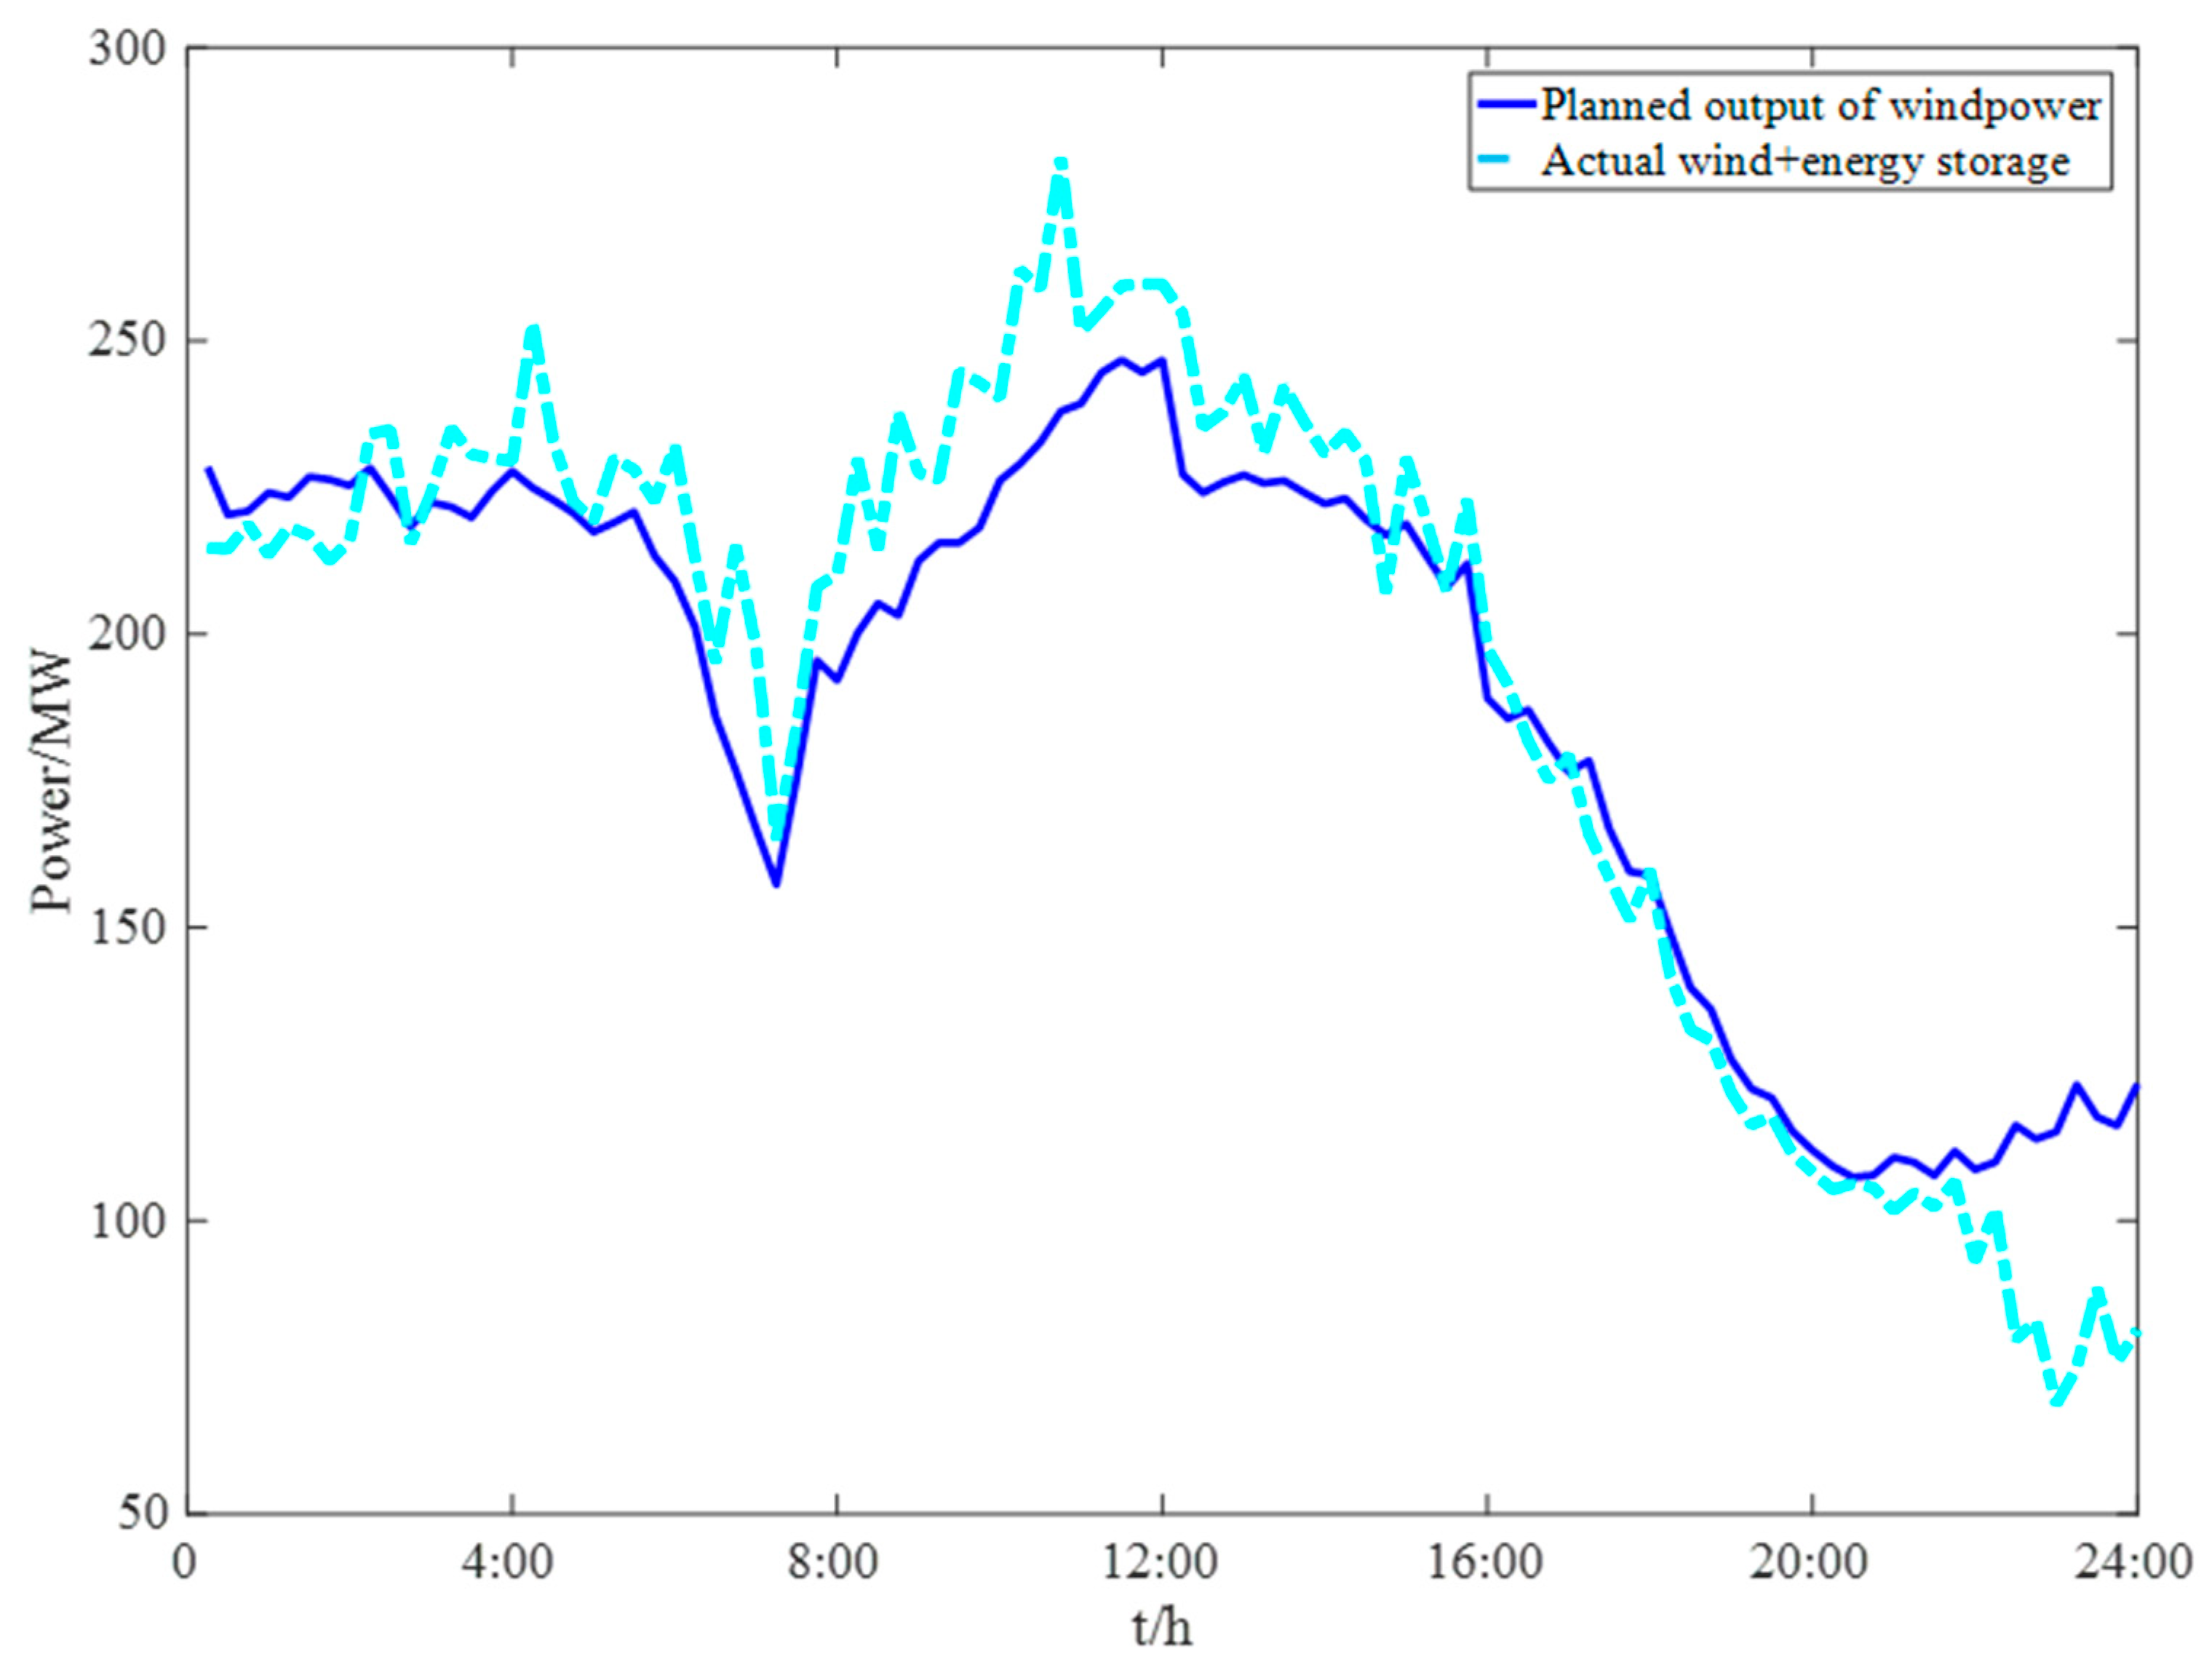
4.2.2. Combined Wind and Energy Storage Output
5. Conclusions
- (1)
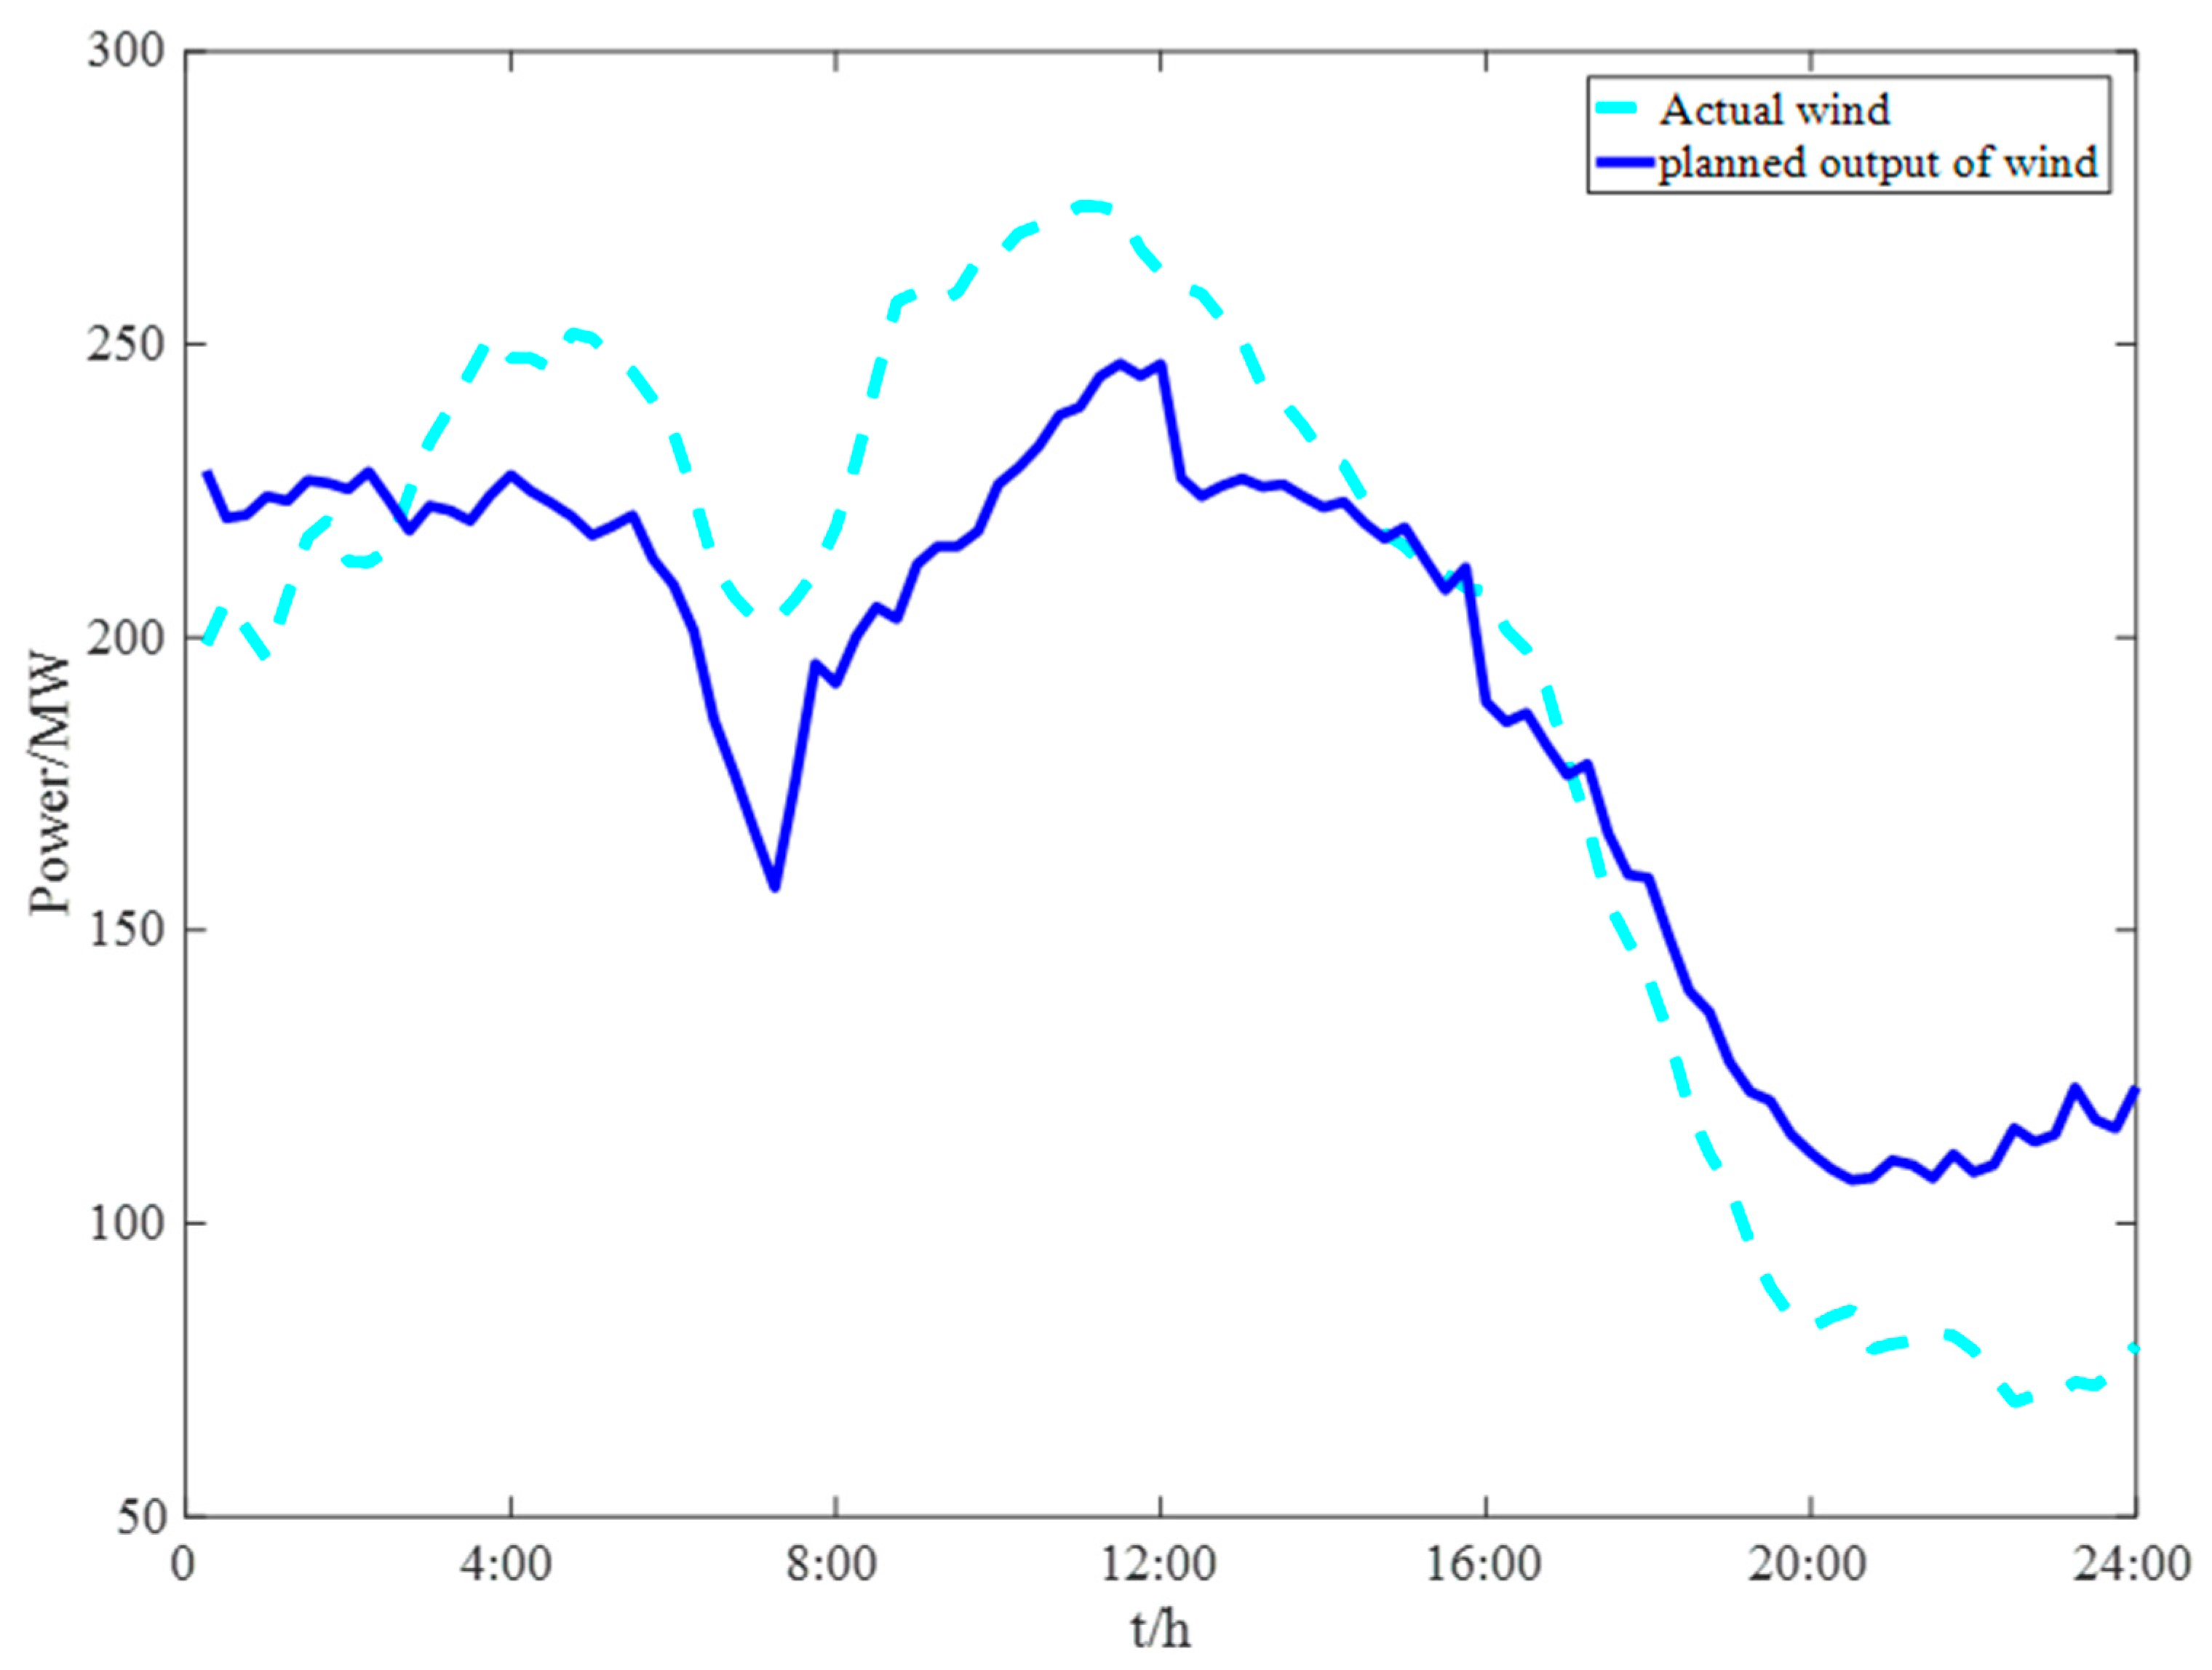
- The energy storage can track the output of new energy well and charge and discharge flexibly according to the market price, which has a good regulatory role. Compared with the independent operation of wind farms, it can greatly reduce the cost of new energy double-rule assessment systems.
- (2)
- After adding the punishment mechanism for the number of green certificates, due to the double detailed rules assessment and the double assessment of green certificate transactions, the prediction accuracy of the new energy and energy storage consortium can be further improved, so that the actual output of the wind storage consortium is closer to the planned output of wind power, reducing the assessment costs and promoting the consumption of new energy.
- (3)
- Changing the maximum deviation coefficient and penalty factor in the grid connection assessment will subsequently affect the electricity sales revenue, penalty cost, and green certificate revenue of the wind storage consortium. The corresponding change trend is: with the increase in the maximum deviation coefficient, the grid connection assessment cost of the wind farm will decrease, the electricity sales revenue will increase, the green certificate revenue will decrease, and the total revenue of the electricity green certificate joint market will increase; with the increase in the penalty factor, the assessment cost of wind farm grid connection increases, the income from power sales decreases, the income from green certificate decreases, and the income from the combined market of electric energy and green certificate decreases, which reflects the good regulation ability of energy storage. Reasonable charging and discharging can better offset the penalty cost, which has good positive suggestions for guiding new energy stations to configure energy storage with a certain capacity.
- (4)
- Through the simulation, the validity of the model proposed in this paper is verified, which can provide reference suggestions for setting up a green certificate trading assessment mechanism in the future.
Author Contributions
Funding
Institutional Review Board Statement
Informed Consent Statement
Data Availability Statement
Conflicts of Interest
Appendix A

| Time | Planned Output (MW) | Actual Output (MW) | Electricity Price (CNY/MWH) |
|---|---|---|---|
| 00:15 | 228.4277 | 198.9056 | 320 |
| 00:30 | 220.3427 | 206.396 | 320 |
| 00:45 | 220.9554 | 201.3524 | 320 |
| 01:00 | 224.0986 | 196.3552 | 320 |
| 01:15 | 223.3039 | 207.0408 | 320 |
| 01:30 | 226.8129 | 217.1396 | 320 |
| 01:45 | 226.3371 | 220.058 | 320 |
| 02:00 | 225.2921 | 212.962 | 320 |
| 02:15 | 228.2825 | 212.8264 | 320 |
| 02:30 | 223.4381 | 215.1696 | 320 |
| 02:45 | 218.2549 | 224.7964 | 320 |
| 03:00 | 222.4387 | 233.422 | 320 |
| 03:15 | 221.6687 | 239.0996 | 320 |
| 03:30 | 219.8911 | 245.2472 | 320 |
| 03:45 | 224.3417 | 251.5792 | 320 |
| 04:00 | 227.7495 | 247.7372 | 320 |
| 04:15 | 224.9264 | 247.6776 | 320 |
| 04:30 | 222.9051 | 245.8344 | 320 |
| 04:45 | 220.6446 | 251.8968 | 320 |
| 05:00 | 217.4194 | 251.098 | 320 |
| 05:15 | 218.9781 | 247.6284 | 320 |
| 05:30 | 220.8404 | 245.3008 | 320 |
| 05:45 | 213.3659 | 240.5332 | 320 |
| 06:00 | 209.0011 | 234.9696 | 610 |
| 06:15 | 201.1796 | 224.3716 | 610 |
| 06:30 | 185.9825 | 212.3868 | 610 |
| 06:45 | 176.781 | 206.956 | 610 |
| 07:00 | 166.8579 | 203.2472 | 610 |
| 07:15 | 157.3479 | 202.808 | 610 |
| 07:30 | 175.428 | 206.5956 | 610 |
| 07:45 | 195.4862 | 211.2804 | 610 |
| 08:00 | 192.1511 | 218.8284 | 610 |
| 08:15 | 200.1604 | 230.1708 | 610 |
| 08:30 | 205.2167 | 244.1052 | 610 |
| 08:45 | 203.1731 | 257.362 | 610 |
| 09:00 | 212.4831 | 258.892 | 800 |
| 09:15 | 215.5433 | 257.1516 | 800 |
| 09:30 | 215.5686 | 258.9824 | 800 |
| 09:45 | 218.1602 | 264.5456 | 800 |
| 10:00 | 226.1636 | 265.1396 | 800 |
| 10:15 | 229.0366 | 269.0064 | 800 |
| 10:30 | 232.6942 | 270.3396 | 800 |
| 10:45 | 237.9592 | 271.5264 | 800 |
| 11:00 | 239.2936 | 273.6268 | 800 |
| 11:15 | 244.5541 | 273.5136 | 800 |
| 11:30 | 246.6997 | 272.6792 | 800 |
| 11:45 | 244.6158 | 266.2048 | 800 |
| 12:00 | 246.6588 | 262.3384 | 800 |
| 12:15 | 227.2308 | 260.0604 | 800 |
| 12:30 | 224.0808 | 258.6684 | 800 |
| 12:45 | 225.8694 | 254.32 | 800 |
| 13:00 | 227.112 | 250.77 | 610 |
| 13:15 | 225.7008 | 242.84 | 610 |
| 13:30 | 226.1394 | 240.2496 | 610 |
| 13:45 | 224.079 | 236.054 | 610 |
| 14:00 | 222.1944 | 231.058 | 610 |
| 14:15 | 223.1334 | 229.4392 | 610 |
| 14:30 | 219.567 | 223.4908 | 610 |
| 14:45 | 216.8694 | 217.7948 | 610 |
| 15:00 | 218.775 | 215.5888 | 610 |
| 15:15 | 213.3282 | 212.0872 | 610 |
| 15:30 | 208.0758 | 210.9152 | 610 |
| 15:45 | 211.9518 | 208.5396 | 610 |
| 16:00 | 189.0559 | 207.7048 | 610 |
| 16:15 | 185.5733 | 201.3716 | 610 |
| 16:30 | 187.1062 | 197.8576 | 610 |
| 16:45 | 181.5017 | 191.1596 | 610 |
| 17:00 | 176.5033 | 178.9228 | 610 |
| 17:15 | 178.4189 | 168.2028 | 610 |
| 17:30 | 166.6979 | 154.954 | 610 |
| 17:45 | 159.5253 | 148.1668 | 610 |
| 18:00 | 158.9588 | 141.9756 | 800 |
| 18:15 | 149.0104 | 132.1036 | 800 |
| 18:30 | 139.7105 | 119.716 | 800 |
| 18:45 | 136.0387 | 111.8276 | 800 |
| 19:00 | 127.4818 | 106.1516 | 800 |
| 19:15 | 122.4773 | 96.55 | 800 |
| 19:30 | 120.928 | 89.166 | 800 |
| 19:45 | 115.2993 | 84.1968 | 800 |
| 20:00 | 112.0218 | 82.2268 | 800 |
| 20:15 | 109.2988 | 84.0856 | 800 |
| 20:30 | 107.4117 | 85.2884 | 800 |
| 20:45 | 107.7929 | 78.564 | 800 |
| 21:00 | 110.8085 | 79.5384 | 800 |
| 21:15 | 109.9885 | 79.9272 | 800 |
| 21:30 | 107.7252 | 81.5 | 800 |
| 21:45 | 111.8722 | 80.928 | 800 |
| 22:00 | 108.7565 | 78.3672 | 320 |
| 22:15 | 110.0391 | 73.9692 | 320 |
| 22:30 | 116.2953 | 69.5136 | 320 |
| 22:45 | 113.9391 | 70.7744 | 320 |
| 23:00 | 115.1695 | 70.7476 | 320 |
| 23:15 | 123.2 | 72.9688 | 320 |
| 23:30 | 117.716 | 72.3944 | 320 |
| 23:45 | 116.2282 | 75.1288 | 320 |
| 00:00 | 123.3194 | 79.2732 | 320 |
References
- Guo, H.X.; Zhang, L. Problems and Suggestions on China’s Wind Power Development. Energy Environ. 2021, 6, 46–48. [Google Scholar]
- Li, X.J.; Ma, H.M.; Jiang, Q. Review of Energy Storage Configuration Technology on Renewable Energy Side. Electr. Power 2022, 55, 13–25. [Google Scholar]
- Xu, F.; Chen, L.; Jin, H.P.; Liu, Z.H. Modeling and Application Analysis of Optimal Joint Operation of Pumped Storage Power Station and Wind Power. Autom. Electr. Power Syst. 2013, 37, 149–154. [Google Scholar]
- Gao, D.; Hu, S.G.; Fan, H.; Jiang, D.F.; Xu, H.; Tang, B.F. Optimal Operation Model for Wind Power-Pumped Storage Power Station and Case Study for Hebei South Power Grid. Mod. Electr. Power 2011, 28, 57–61. [Google Scholar]
- Jiang, S.P.; Qiao, Y.; Xu, F.; Nie, H.Z.; Hu, D. Capacity Optimization and Sensitivity Analysis of Cogeneration System of Wind Power and Energy Storage. Autom. Electr. Power Syst. 2013, 37, 16–21. [Google Scholar]
- Wang, X.L.; Gu, J.; Zhou, J.W. Optimal Capacity Configuration of Cogeneration System of Wind Power and Energy Storage. Zhejiang Electr. Power 2018, 37, 14–17. [Google Scholar]
- Sheng, S.Q.; Sun, X.X. Operational Optimization Model for Combined Operation of Wind Power and Pumped-storage Plant. Proc. CSU-EPSA 2016, 28, 100–103. [Google Scholar]
- Cheng, S.J.; Meng, J.; Wang, X.H.; Shen, R.B. A Joint Daily Operational Optimization Model for Wind Power and Energy Storage Devices. Power Syst. Clean Energy 2014, 30, 68–72+80. [Google Scholar]
- Zeng, M.; Li, N.; Ma, M.J.; Chen, Y.J. Economic Benefit Evaluation Model for Storage-Wind Joint Power Operation System in Electricity Market. East China Electr. Power 2012, 40, 1469–1473. [Google Scholar]
- Sun, B.; Li, S.M.; Fan, Y.N.; Li, Z.H. Research on Deviation Electricity Assessment Model of Wind-Storage Hybrid Power Generators in Electricity Market Environment. Electr. Power Constr. 2019, 40, 107–114. [Google Scholar]
- Jing, Q.M.; Han, Z.F.; Zhang, Y.K.; Zhang, D.X. Combined Scheduling Method of Wind-Thermal Power Based on Improved Particle Swarm Optimization Algorithm. Electr. Eng. 2019, 11, 33–36. [Google Scholar]
- Mao, X.; Huang, S.Y.; Xia, J.L.; Zhang, B.; Peng, X.T. Peak-Load Control Strategy for Wind Power System Based on Particle Swarm Algorithm. Distrib. Energy 2018, 3, 15–21. [Google Scholar]
- Sun, L.H. Prediction of seasonal wind power output scenarios based on improved particle swarm optimization. Electron. Technol. Softw. Eng. 2022, 4, 121–124. [Google Scholar]
- Zhao, L.; Wang, J.; Liang, Z.F.; Li, Y.Q. A study on particle swarm optimization based optimization of joint operation of wind power and pumped-storage hydropower generation. Water Resour. Hydropower Eng. 2014, 45, 124–126. [Google Scholar]
- Ren, L. Joint Economic Dispatch of Wind, Fire and Power Based on Improved Particle Swarm Optimization Algorithm. Master’s Thesis, Qingdao University, Qingdao, China, 2018. [Google Scholar]
- Wang, P.; Song, X.H.; Yang, H.W.; Zhai, X.Y.; Han, J.J.; Ju, L.W. Multi market coupling trading simulation of electricity green certificate and excess consumption under new renewable portfolio standard. J. Syst. Simul. 2022, 34, 2458. [Google Scholar]
- Zhao, W.H.; Wang, S.J.; Hou, J.S.; Wang, H. Design and simulation of an enhanced renewable portfolio standard considering generator differences and incentives or penalties. J. Univ. Shanghai Sci. Technol. 2022, 44, 112–121. [Google Scholar]
- Yuan, G.L.; Liu, P.D.; Tang, F.B.; Tian, W.L. Source-load Coordination Optimal Scheduling Considering Green Power Certificate and Carbon Trading Mechanisms. Acta Energiae Sol. Sin. 2022, 43, 190–195. [Google Scholar]
- Luo, Z.; Qin, J.H.; Liang, J.Y.; Shen, F.; Liu, H.Z.; Zhao, M.; Wang, J.H. Day-ahead optimal scheduling of integrated energy system with carbon-green certificate coordinated trading mechanism. Electr. Power Autom. Equip. 2021, 41, 248–255. [Google Scholar]
- Banerjee, S.; Dasgupta, K.; Chanda, C.K. Short term hydro–wind–thermal scheduling based on particle swarm optimization technique. Int. J. Electr. Power Energy Syst. 2016, 81, 275–288. [Google Scholar] [CrossRef]
- Yuan, X.; Wang, L.; Yuan, Y. Application of enhanced PSO approach to optimal scheduling of hydro system. Energy Convers. Manag. 2008, 49, 2966–2972. [Google Scholar] [CrossRef]
- Mandal, K.K.; Basu, M.; Chakraborty, N. Particle swarm optimization technique based short-term hydrothermal scheduling. Appl. Soft Comput. 2008, 8, 1392–1399. [Google Scholar] [CrossRef]
- Wu, H.W.; Chen, T.F.; Hu, C.K.; Xu, B. Improved constrained optimization particle swarm optimization algorithm. Appl. Res. Comput. 2012, 29, 859–861+864. [Google Scholar]
- Zhan, L.H.; Li, S.G.; Zheng, Y.T. MPPT of PV Arrays Based on New PSO Algorithm. Electr. Energy Manag. Technol. 2020, 11, 17–21. [Google Scholar]
- Yu, X.F.; Guo, Y.H. Research on Dynamic Pricing Model and Trading Strategies of Renewable Energy Certificate. Water Power 2018, 44, 94–97. [Google Scholar]
- Song, N. To achieve the goal of “double carbon”, it is urgent to improve the green certificate trading mechanism. China Power Enterp. Manag. 2022, 19, 60–62. [Google Scholar]
- Cui, Y.; Shen, Z.; Wang, Z.; Wang, M.C.; Zhao, Y.T. Green dispatching of regional integrated energy system considering green certificate-carbon emission equivalent interaction mechanism. Proc. CSEE 2022, 1–12. Available online: http://www.cnki.com.cn/Article/CJFDTotal-ZGDC2022051800R.htm (accessed on 20 October 2022).
- Liu, J.N.; Xiong, N.; Zhu, W.G.; Tang, W.; Yang, D.C. Research on optimal strategy of wind-PV-ES hybrid operation in electricity market. J. Electr. Power Sci. Technol. 2017, 32, 11–15. [Google Scholar] [CrossRef]

| Refs. | On the Power Generation Side | Energy Storage | Environmental Value/Green Power Value | Include Green Power Value or Environmental Value in the Objective Function | Wind Power Prediction | Energy Storage Cost |
|---|---|---|---|---|---|---|
| [3] | ✕ | ✓ | ✓ | ✕ | ✕ | ✕ |
| [4] | ✕ | ✓ | ✕ | ✕ | ✕ | ✕ |
| [5] | ✓ | ✓ | ✕ | ✕ | ✓ | ✕ |
| [6] | ✓ | ✓ | ✕ | ✕ | ✓ | ✓ |
| [7] | ✓ | ✓ | ✕ | ✕ | ✓ | ✕ |
| [8] | ✓ | ✓ | ✕ | ✕ | ✓ | ✕ |
| [9] | ✓ | ✓ | ✕ | ✕ | ✓ | ✓ |
| [10] | ✓ | ✓ | ✕ | ✕ | ✓ | ✓ |
| This work | ✓ | ✓ | ✓ | ✓ | ✓ | ✕ |
| E0/MWh | Emin/MWh | Emax/MWh | P0/MW | ndis | ncha |
|---|---|---|---|---|---|
| 45 | 15 | 135 | 80 | 0.9 | 0.8 |
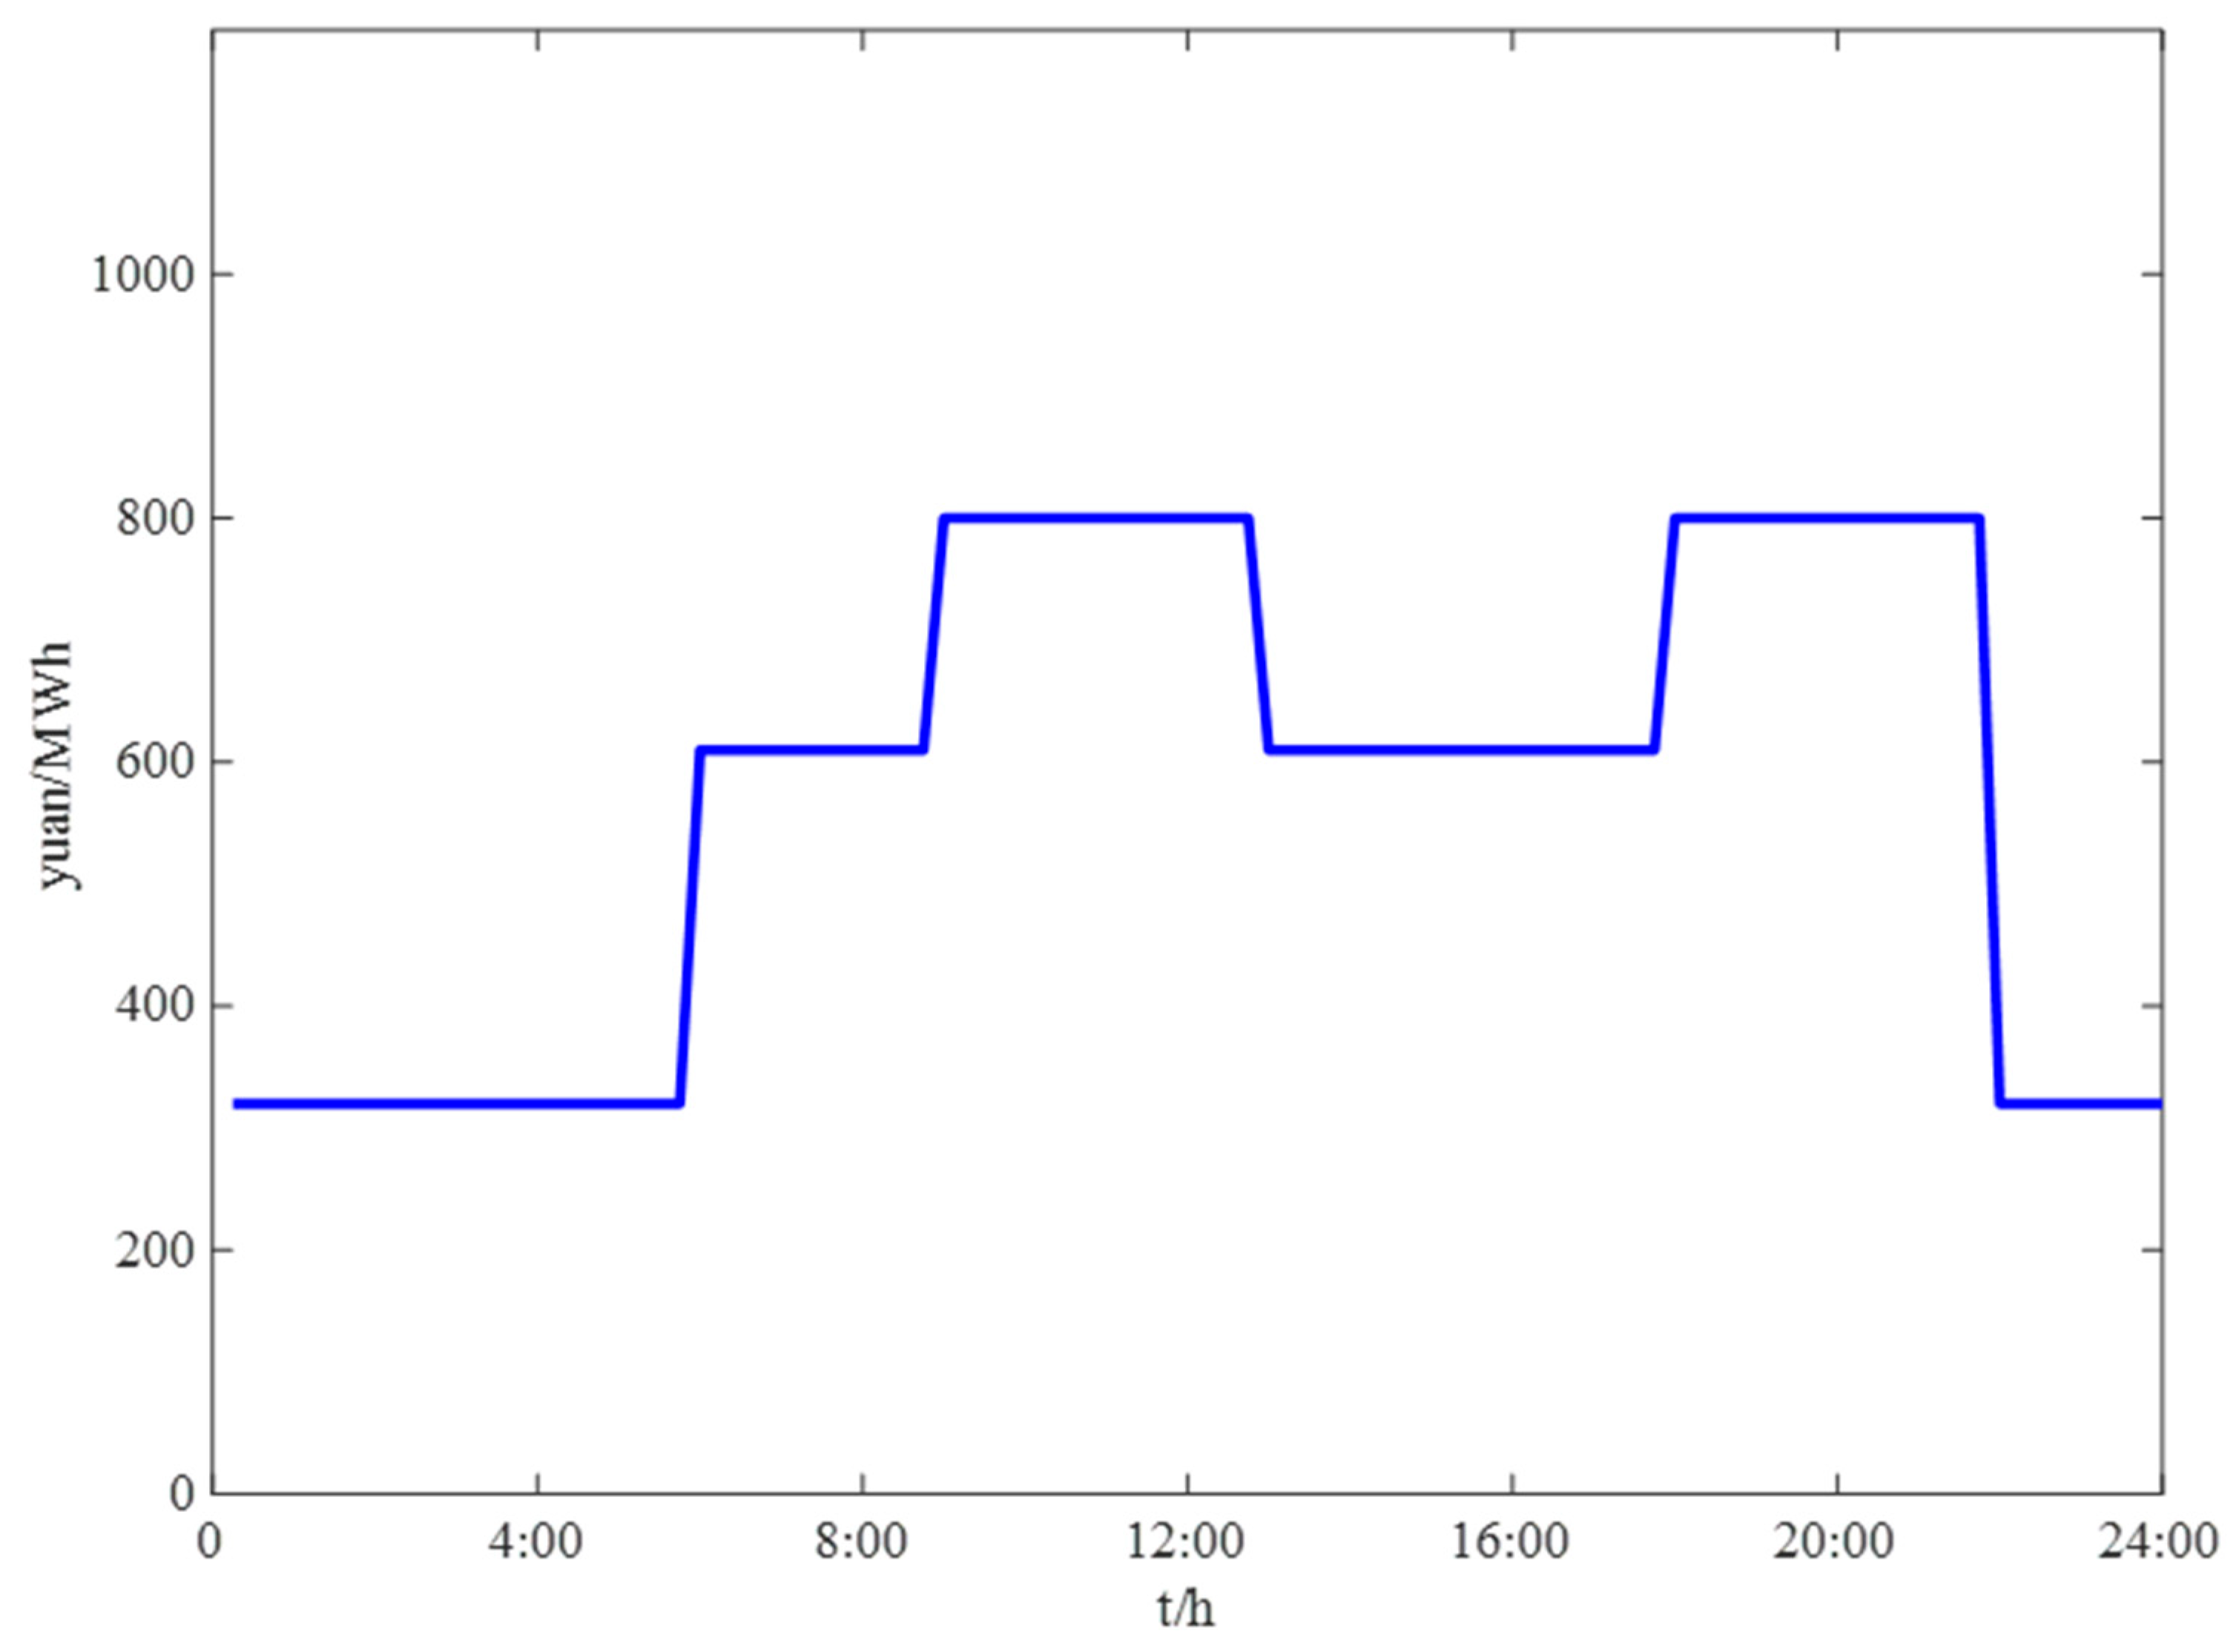
| Time Interval | Electricity Price/(CNY/KWh) | |
|---|---|---|
| Peak time | 9:00–13:00 | 0.80 |
| 18:00–22:00 | ||
| Flat Valley Period | 6:00–9:00 | 0.61 |
| 13:00–18:00 | ||
| Low period | 0:00–06:00 | 0.32 |
| 22:00–24:00 | ||
| Scene | Green Certificate Income/CNY 10,000 | Electricity Sales Income/CNY 10,000 | Punishments for Grid Connection Assessment/CNY 10,000 | Total Income of Electric Energy Green Certificate Market/CNY 10,000 | |
|---|---|---|---|---|---|
| ω = 0.44 | ε = 5% | 23.579 | 269.269 | 5.038 | 287.81 |
| ω = 0.44 | ε = 10% | 22.76 | 271.18 | 3.18 | 290.76 |
| ω = 0.88 | ε = 5% | 22.425 | 268.885 | 7.87 | 283.44 |
| ω = 1.32 | ε = 5% | 21.509 | 268.028 | 9.057 | 280.48 |
Disclaimer/Publisher’s Note: The statements, opinions and data contained in all publications are solely those of the individual author(s) and contributor(s) and not of MDPI and/or the editor(s). MDPI and/or the editor(s) disclaim responsibility for any injury to people or property resulting from any ideas, methods, instructions or products referred to in the content. |
© 2022 by the authors. Licensee MDPI, Basel, Switzerland. This article is an open access article distributed under the terms and conditions of the Creative Commons Attribution (CC BY) license (https://creativecommons.org/licenses/by/4.0/).
Share and Cite
Dong, J.; Lv, S.; Zhu, Y.; Han, H.; Zhang, G. Research on Wind Power Energy Storage Joint Optimization Operation under the Double Detailed Rules Assessment Taking into Account the Benefits of Green Certificate. Sustainability 2023, 15, 431. https://doi.org/10.3390/su15010431
Dong J, Lv S, Zhu Y, Han H, Zhang G. Research on Wind Power Energy Storage Joint Optimization Operation under the Double Detailed Rules Assessment Taking into Account the Benefits of Green Certificate. Sustainability. 2023; 15(1):431. https://doi.org/10.3390/su15010431
Chicago/Turabian StyleDong, Jun, Shiyao Lv, Yuan Zhu, Hui Han, and Guochang Zhang. 2023. "Research on Wind Power Energy Storage Joint Optimization Operation under the Double Detailed Rules Assessment Taking into Account the Benefits of Green Certificate" Sustainability 15, no. 1: 431. https://doi.org/10.3390/su15010431