
Spatio-Temporal Evolution of the Ecological Environment in a Typical Semi-Arid Region of Northeast China
 ,
,
Abstract
:1. Introduction
2. Methodology
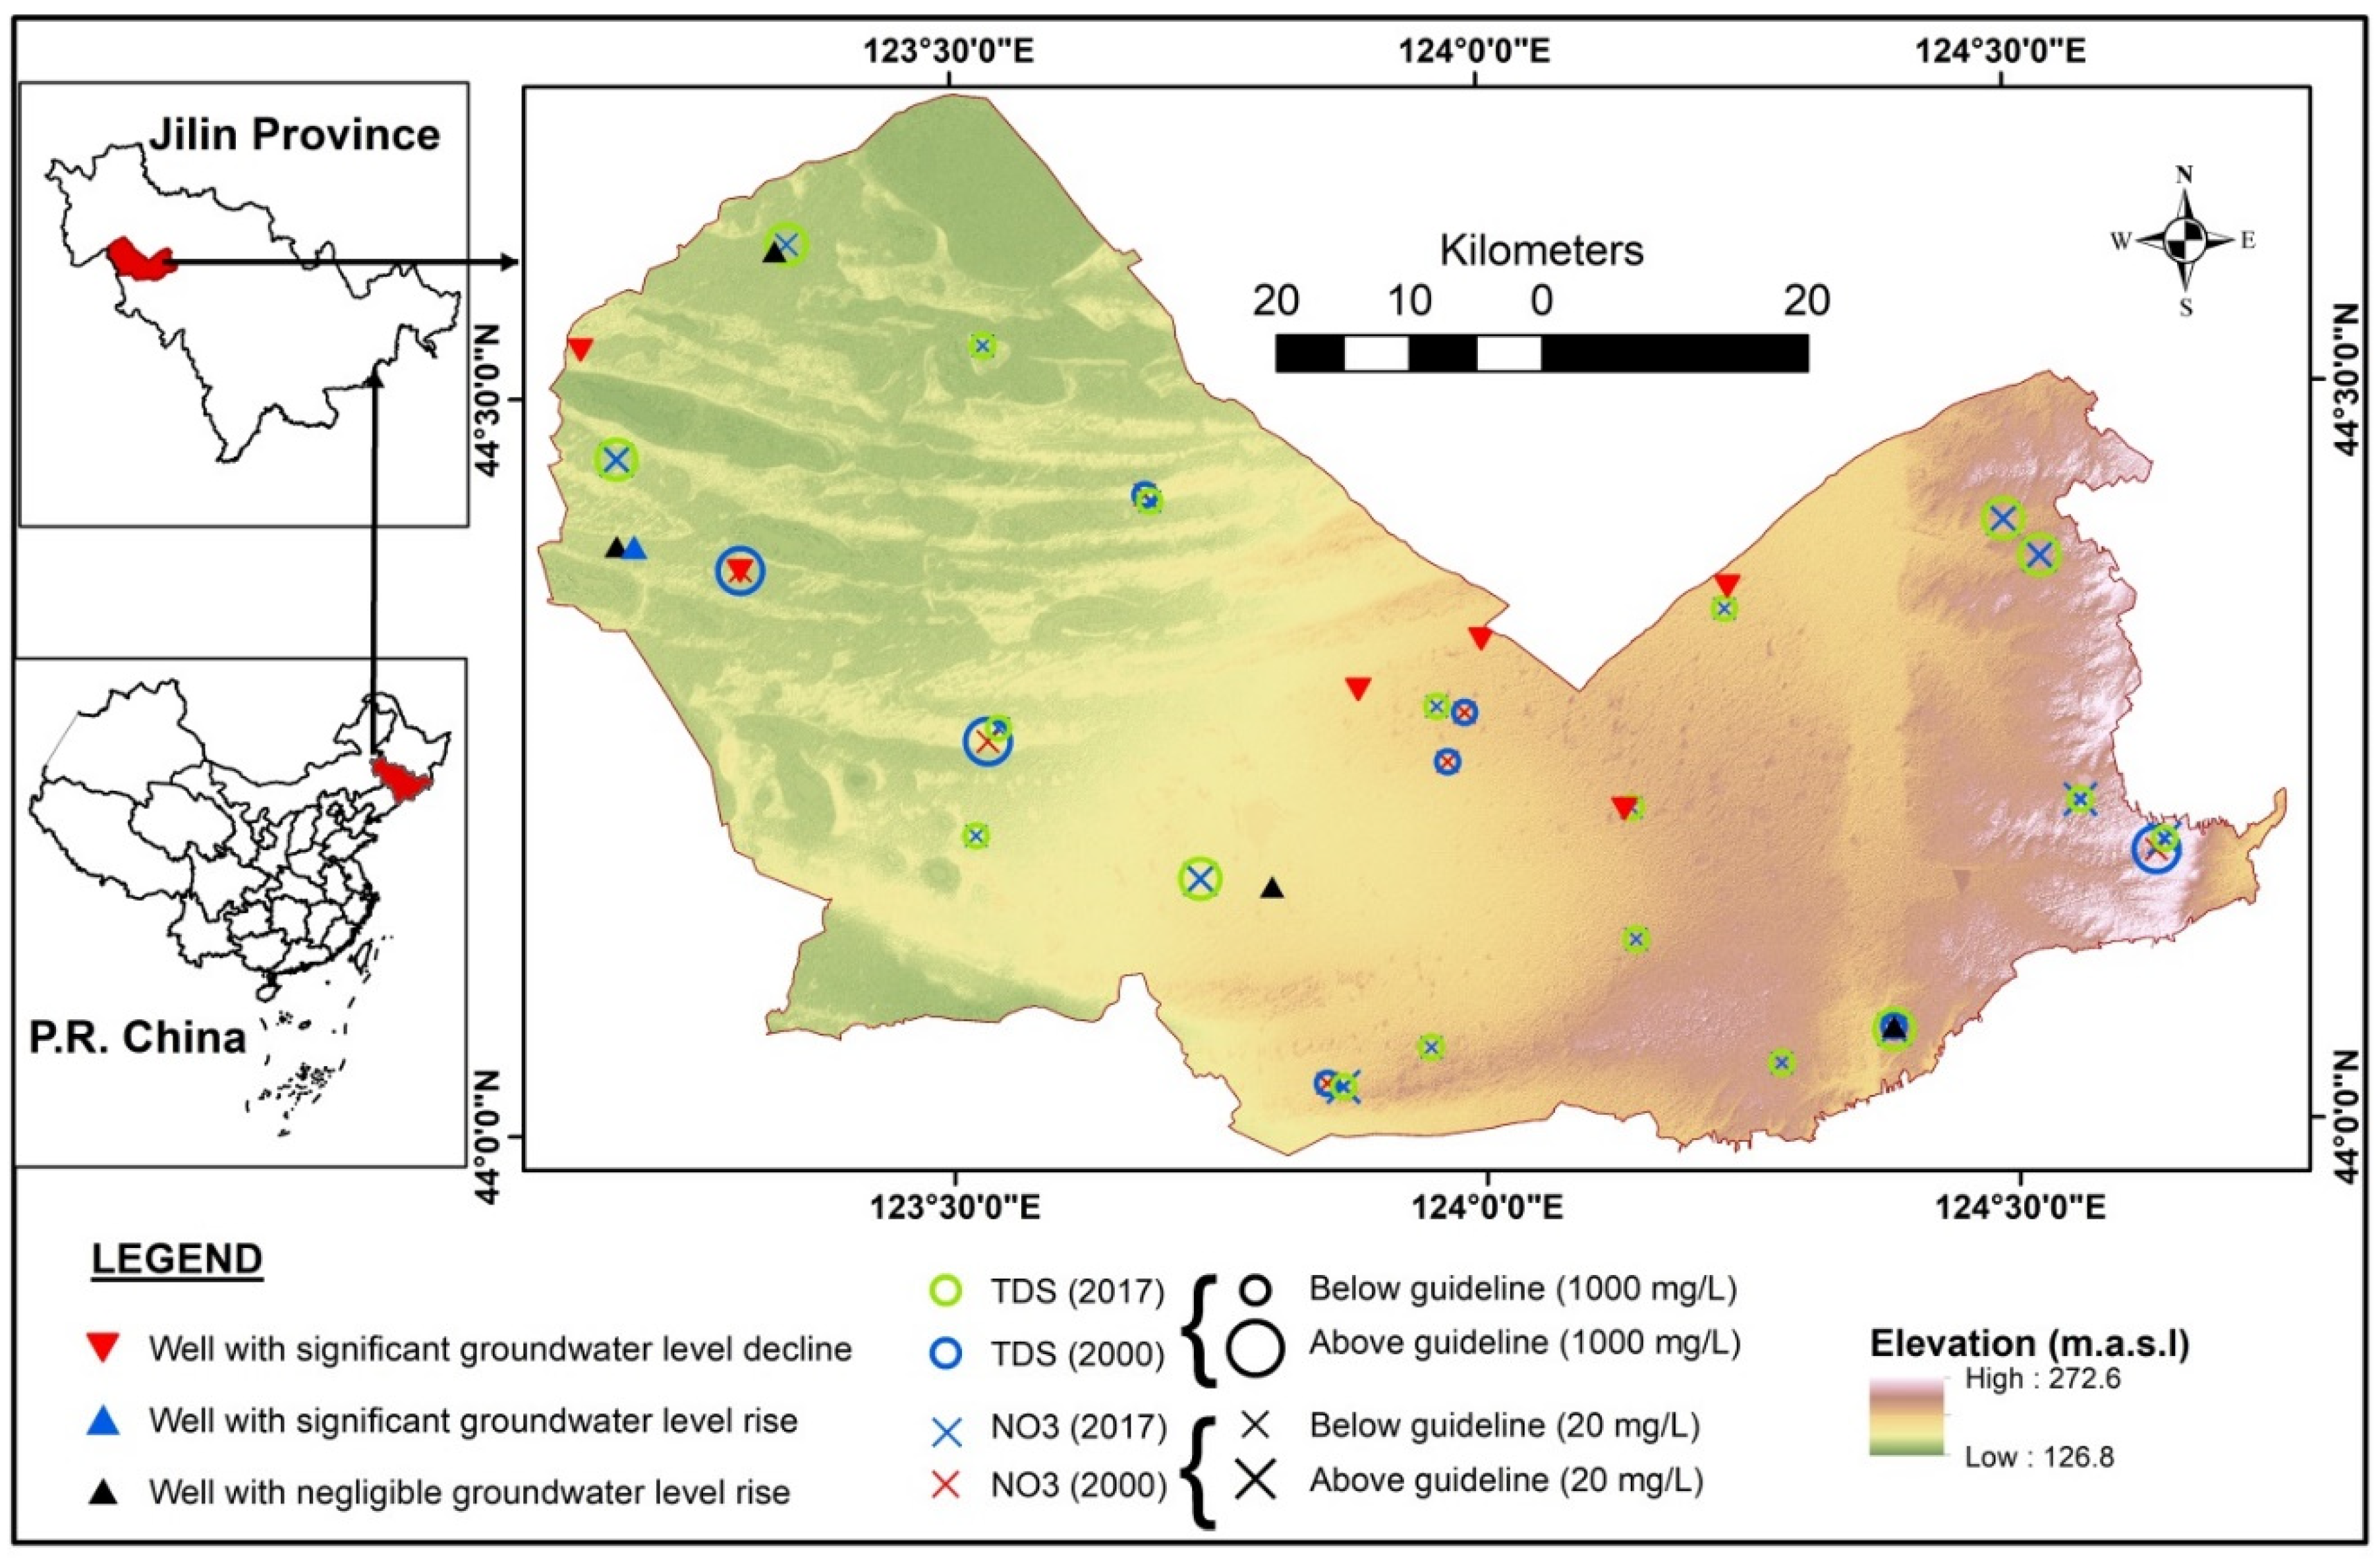
2.1. Study Area
2.2. Groundwater Sample Collection and Analysis
2.3. Data Sources and Processing
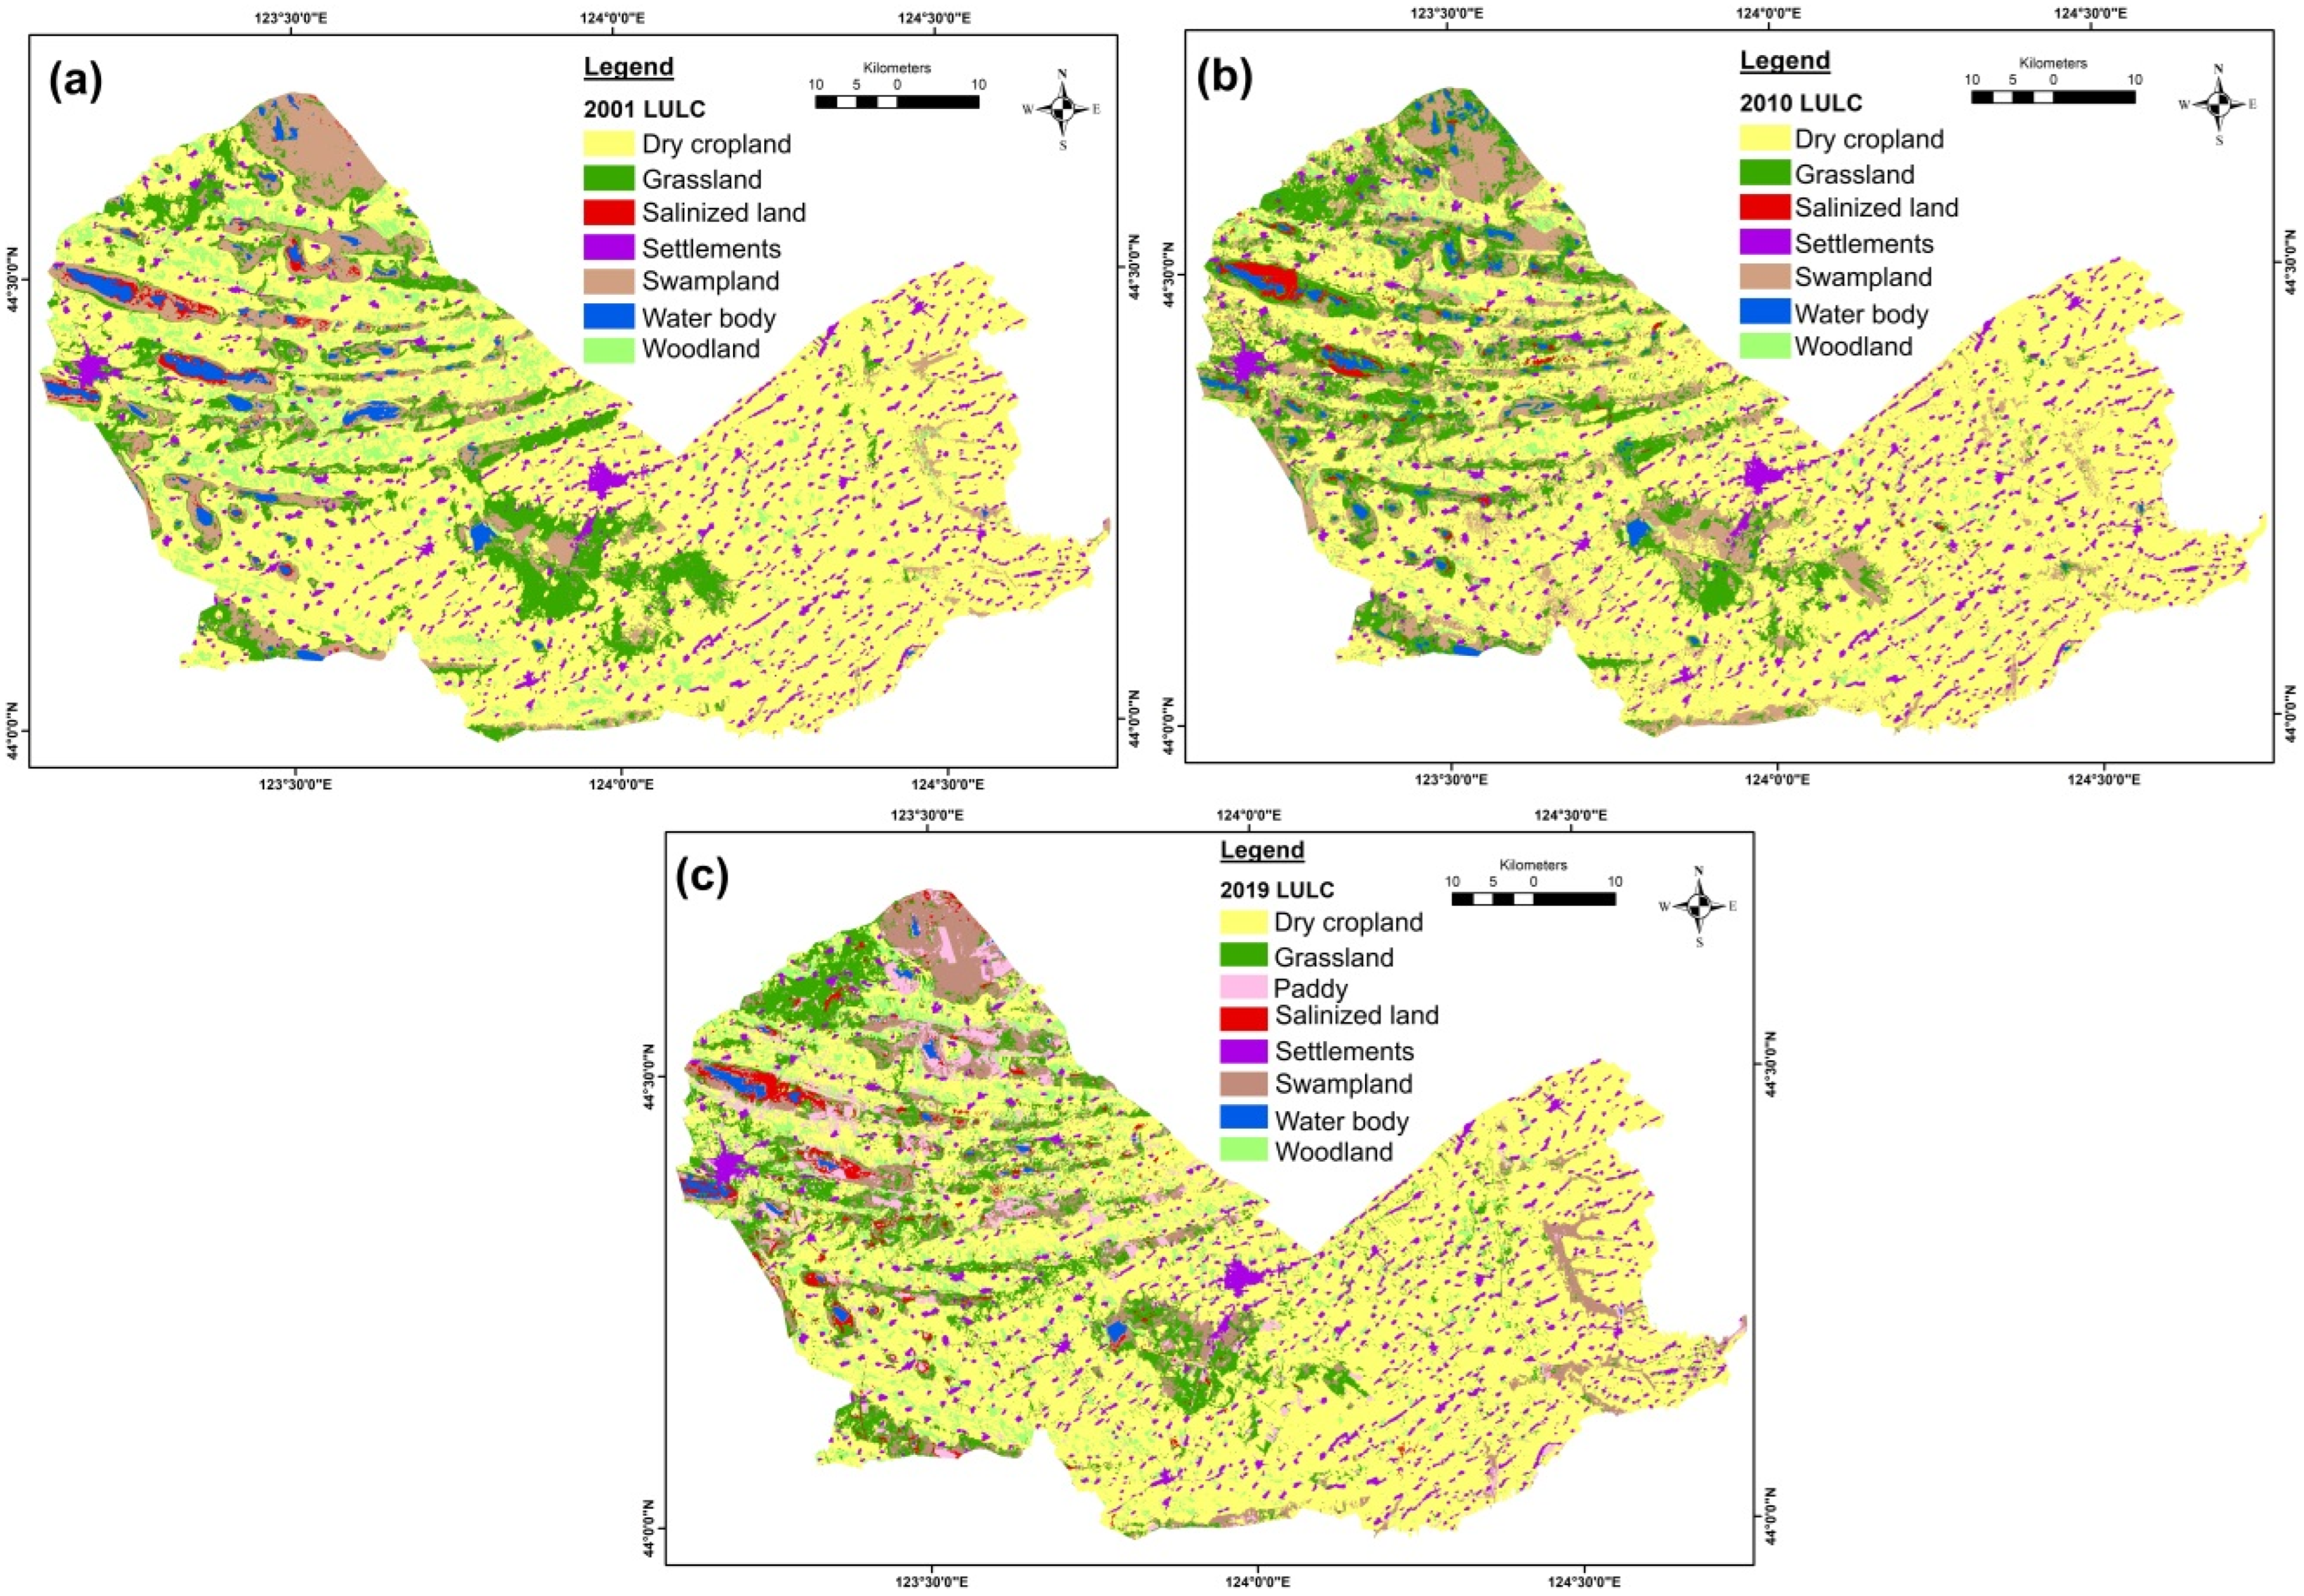
2.4. Land Use/Land Cover (LULC) Analysis
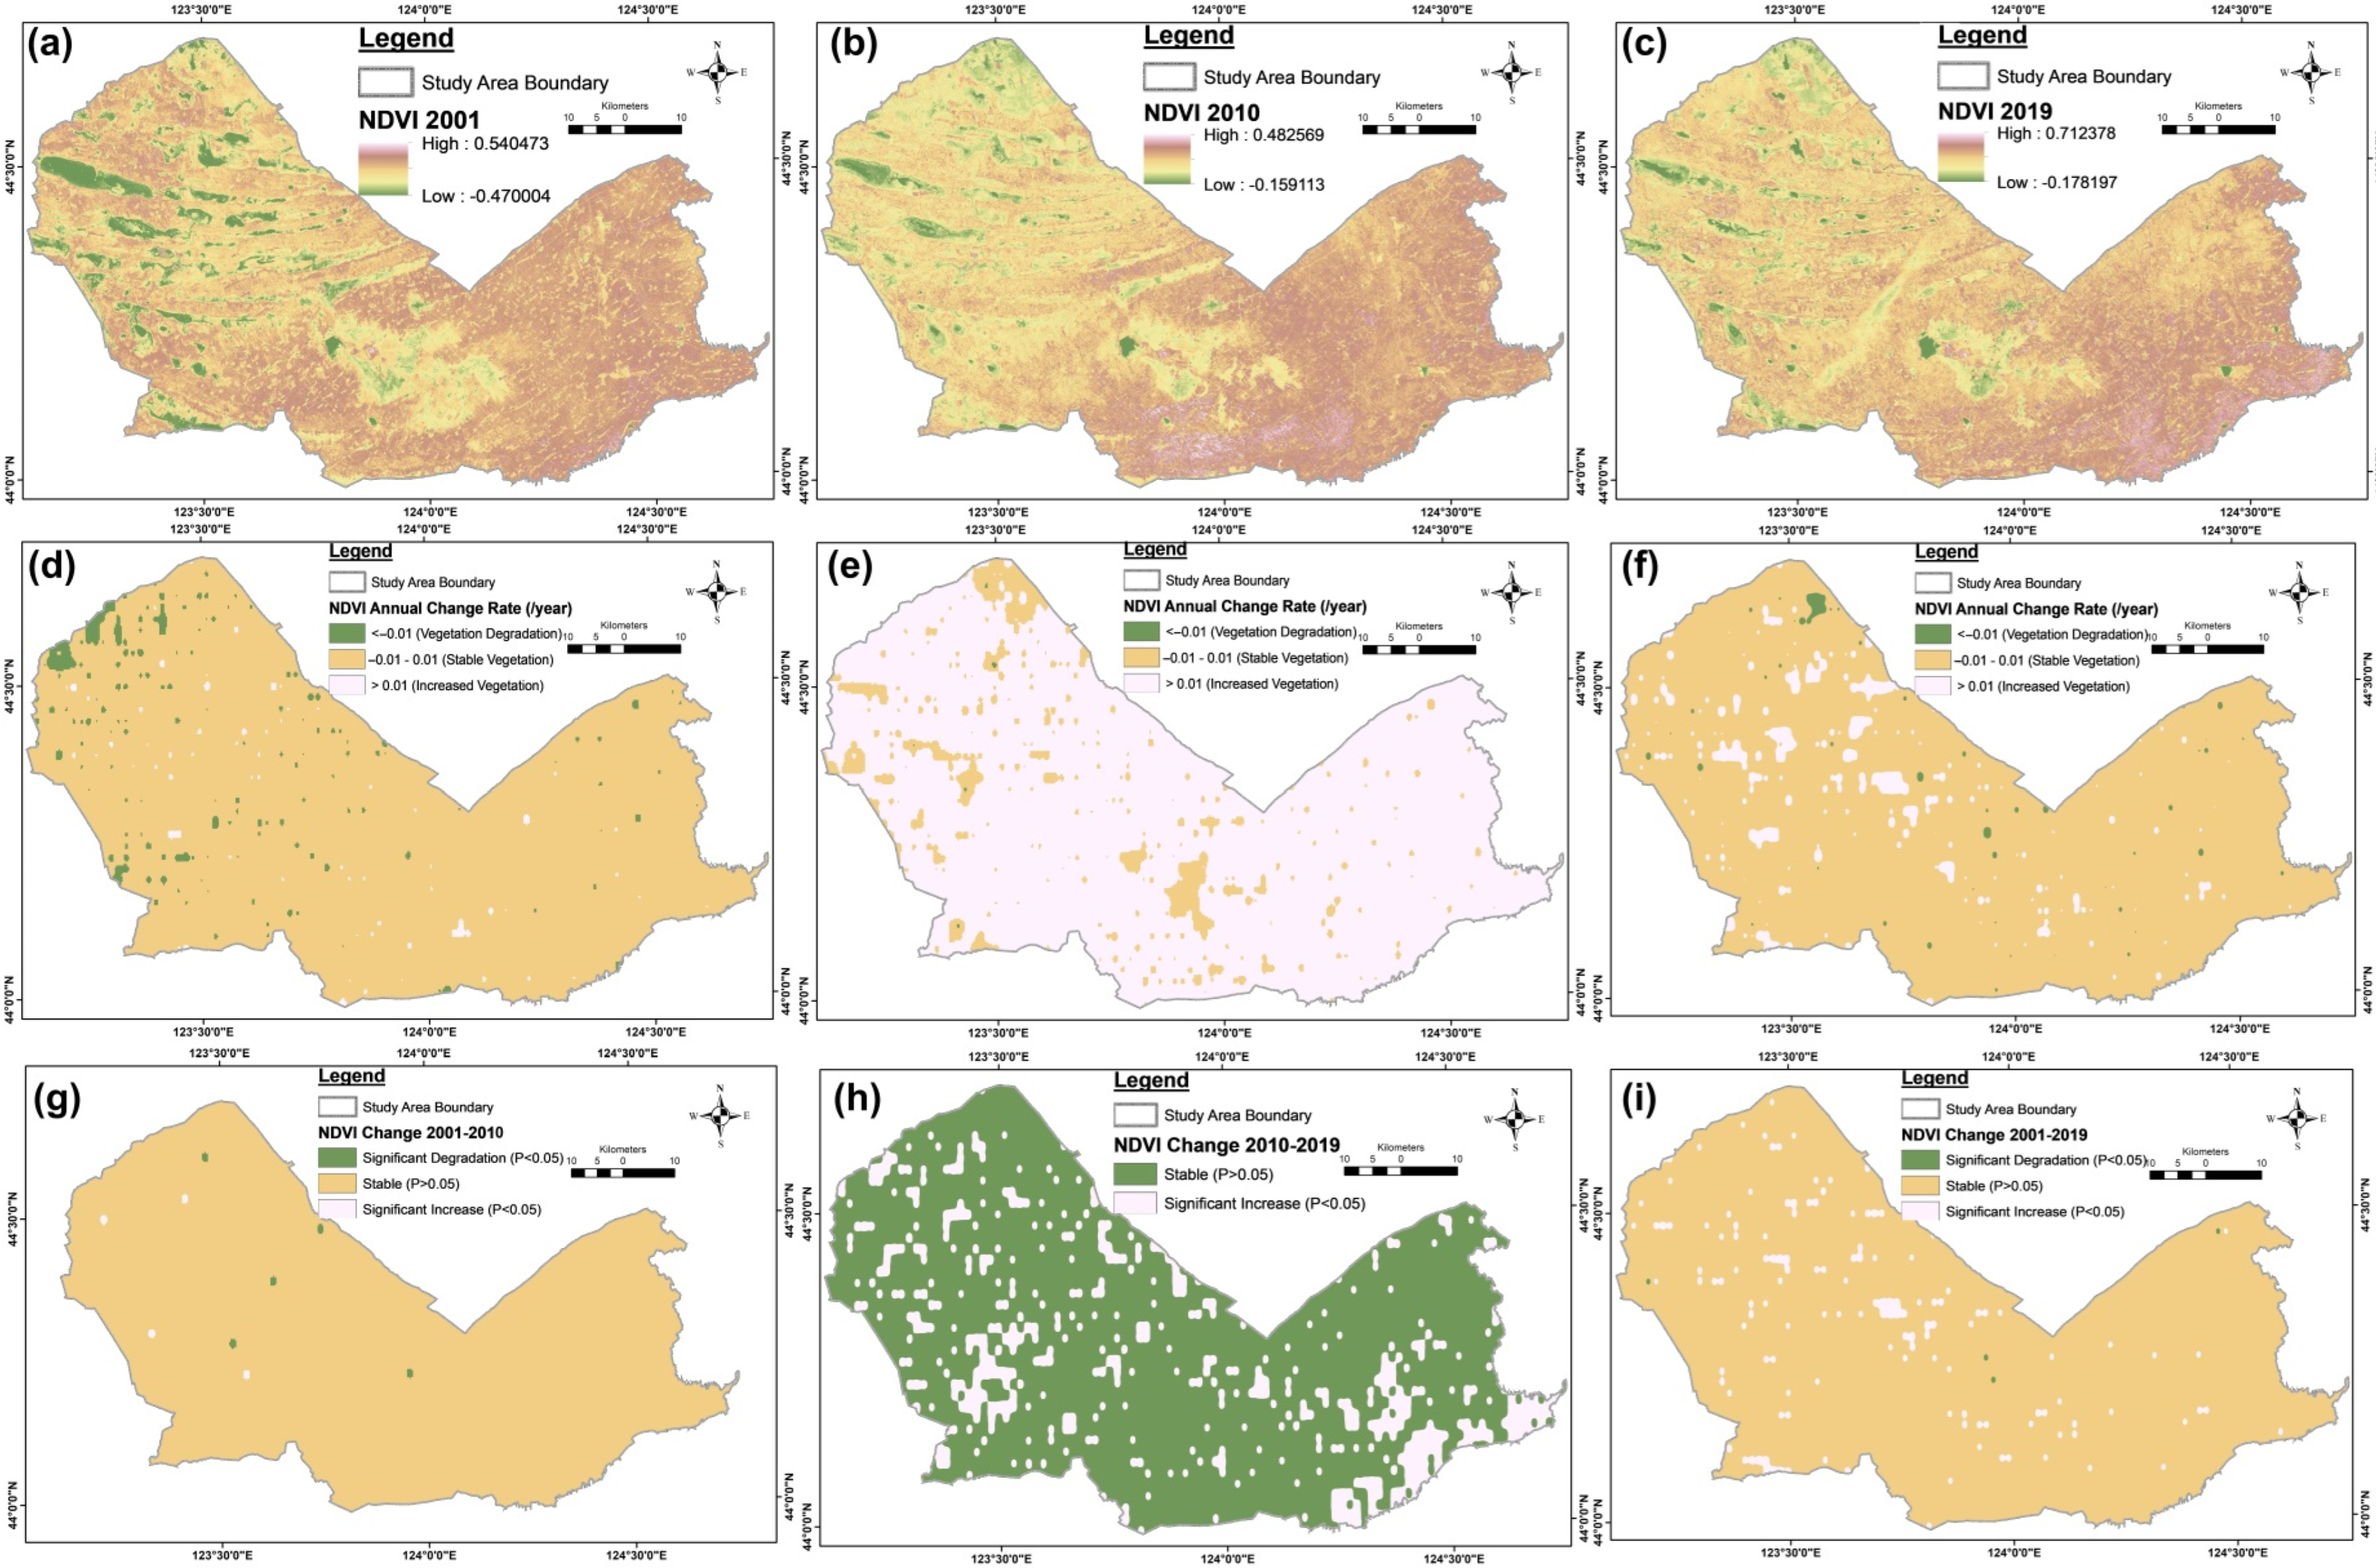
2.5. Normalized Differential Vegetation Index (NDVI) Analysis
3. Results
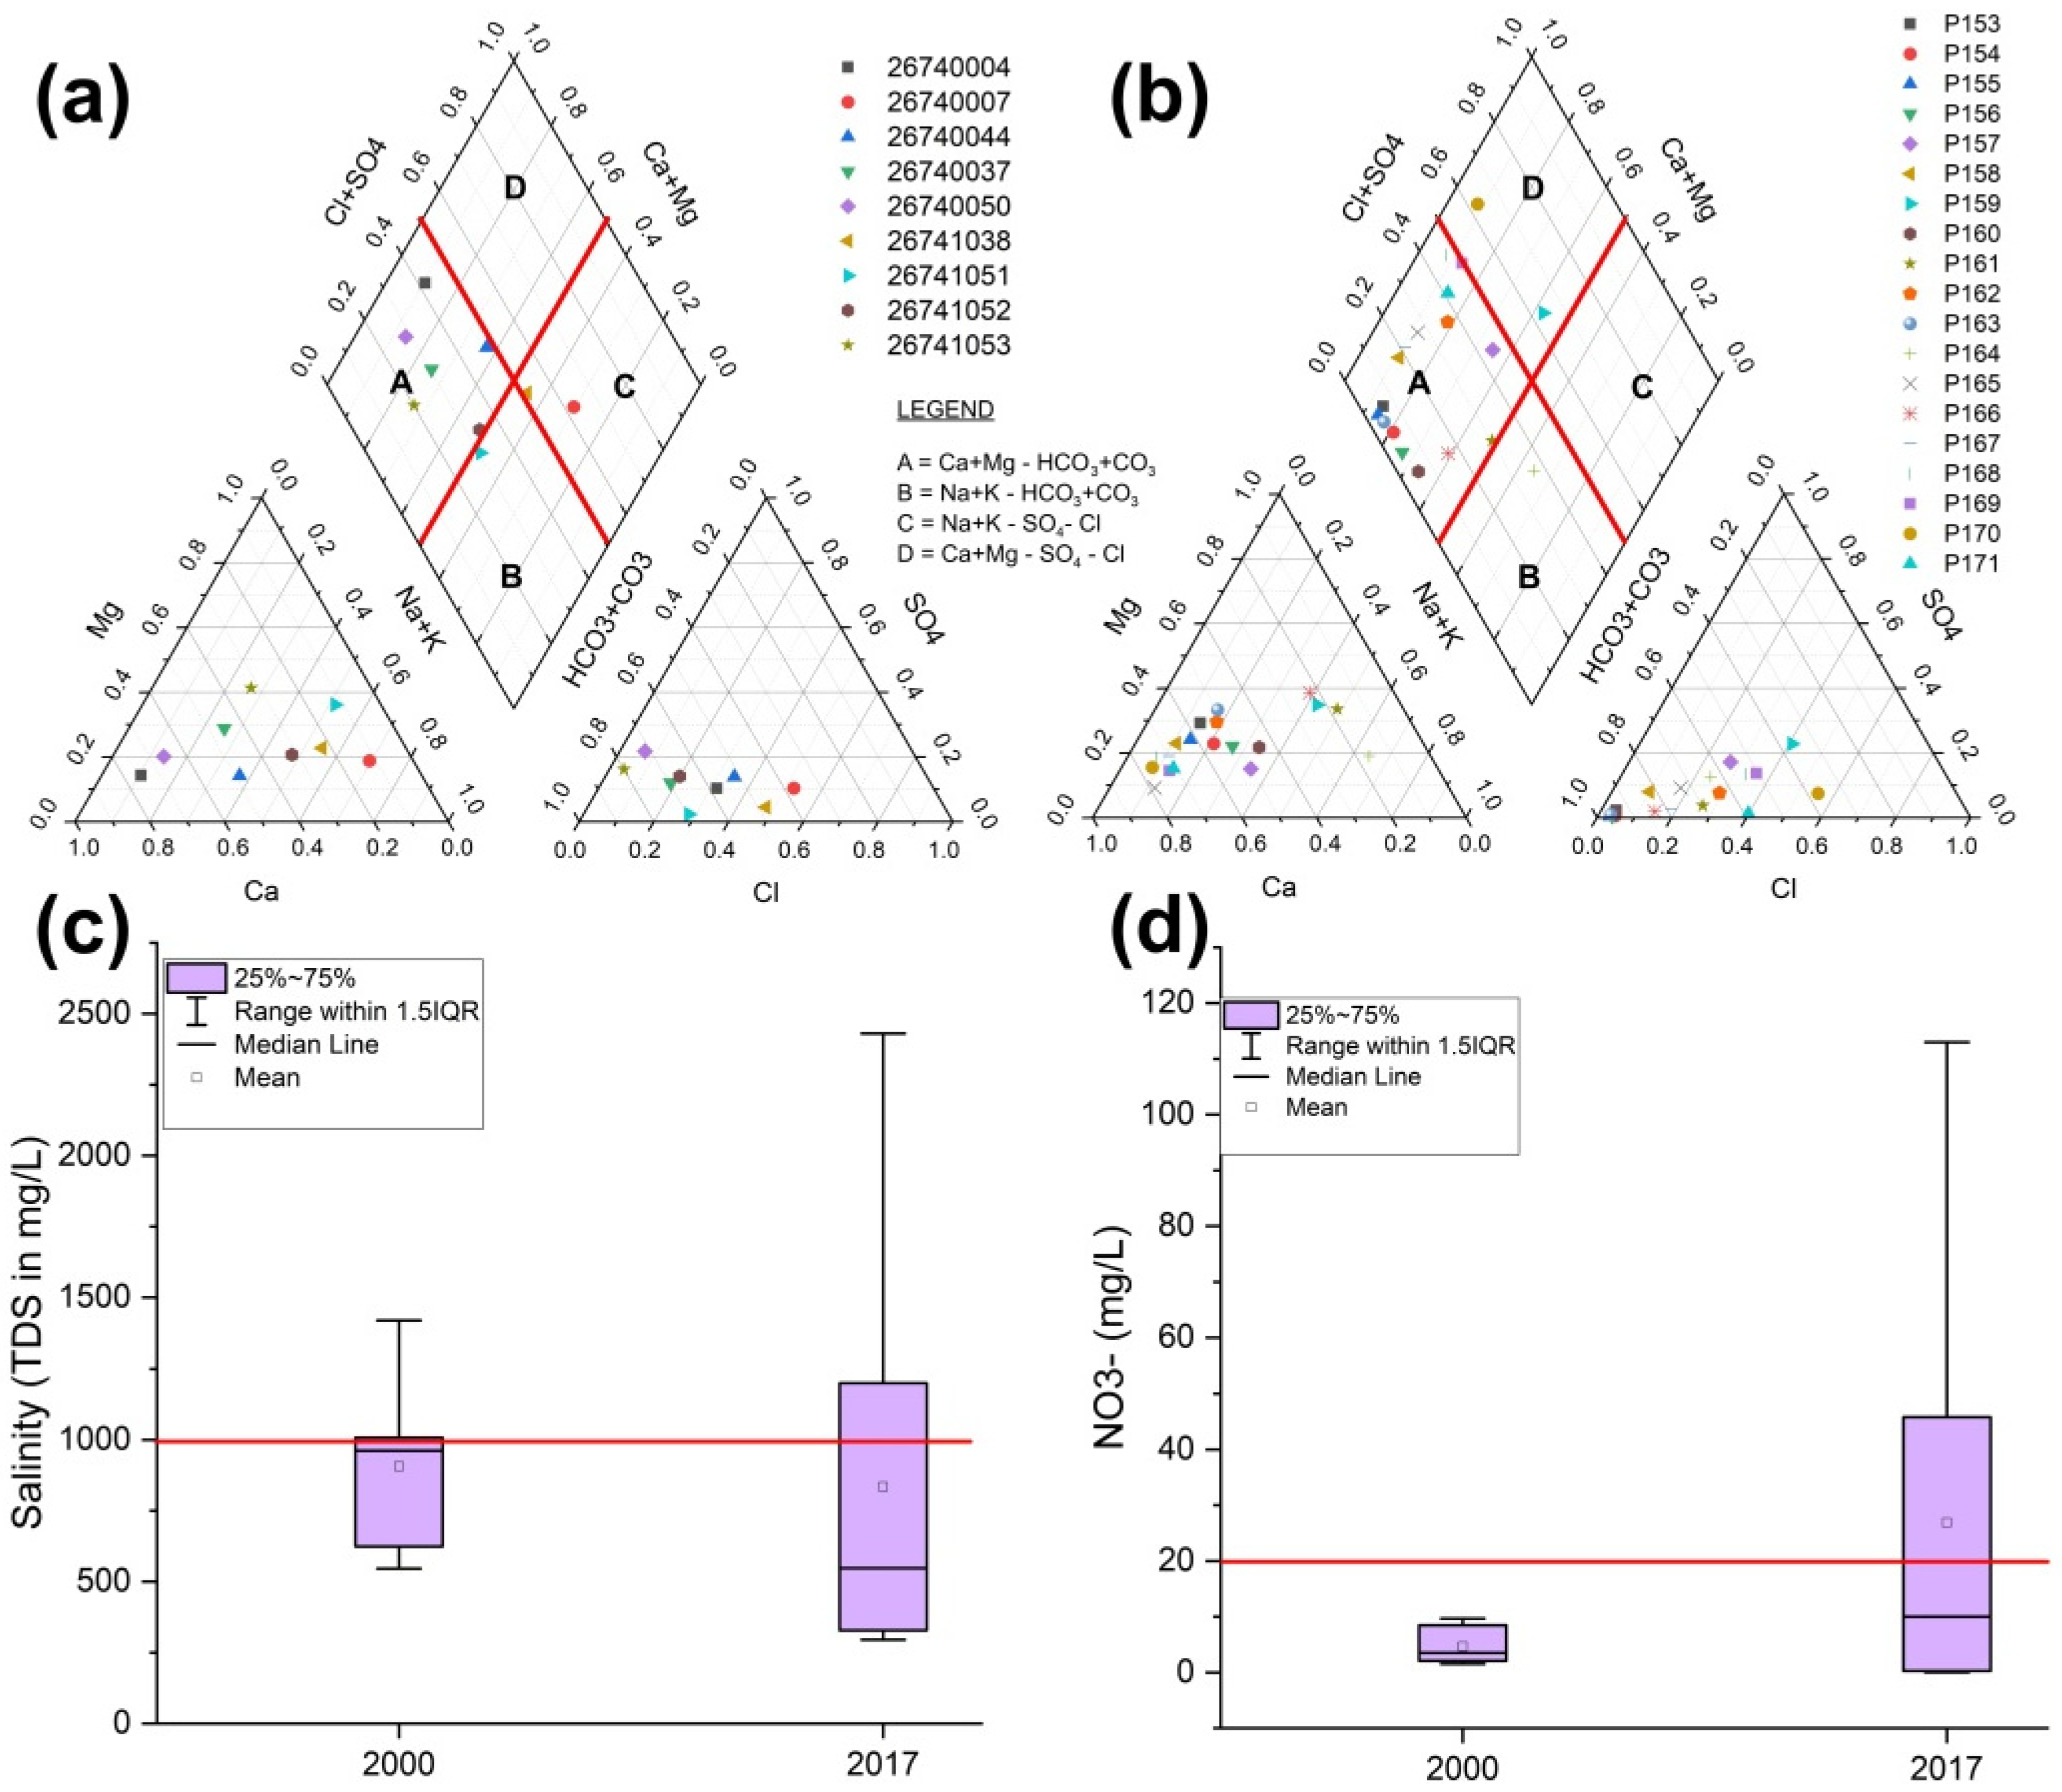
3.1. Groundwater Chemical Evolution
3.2. Soil Salinization Analysis
3.3. Desertification Analysis
4. Discussion
4.1. Factors Influencing Groundwater Chemical Evolution
4.2. Factors Influencing Soil Salinization
4.3. Factors Influencing Desertification
5. Conclusions
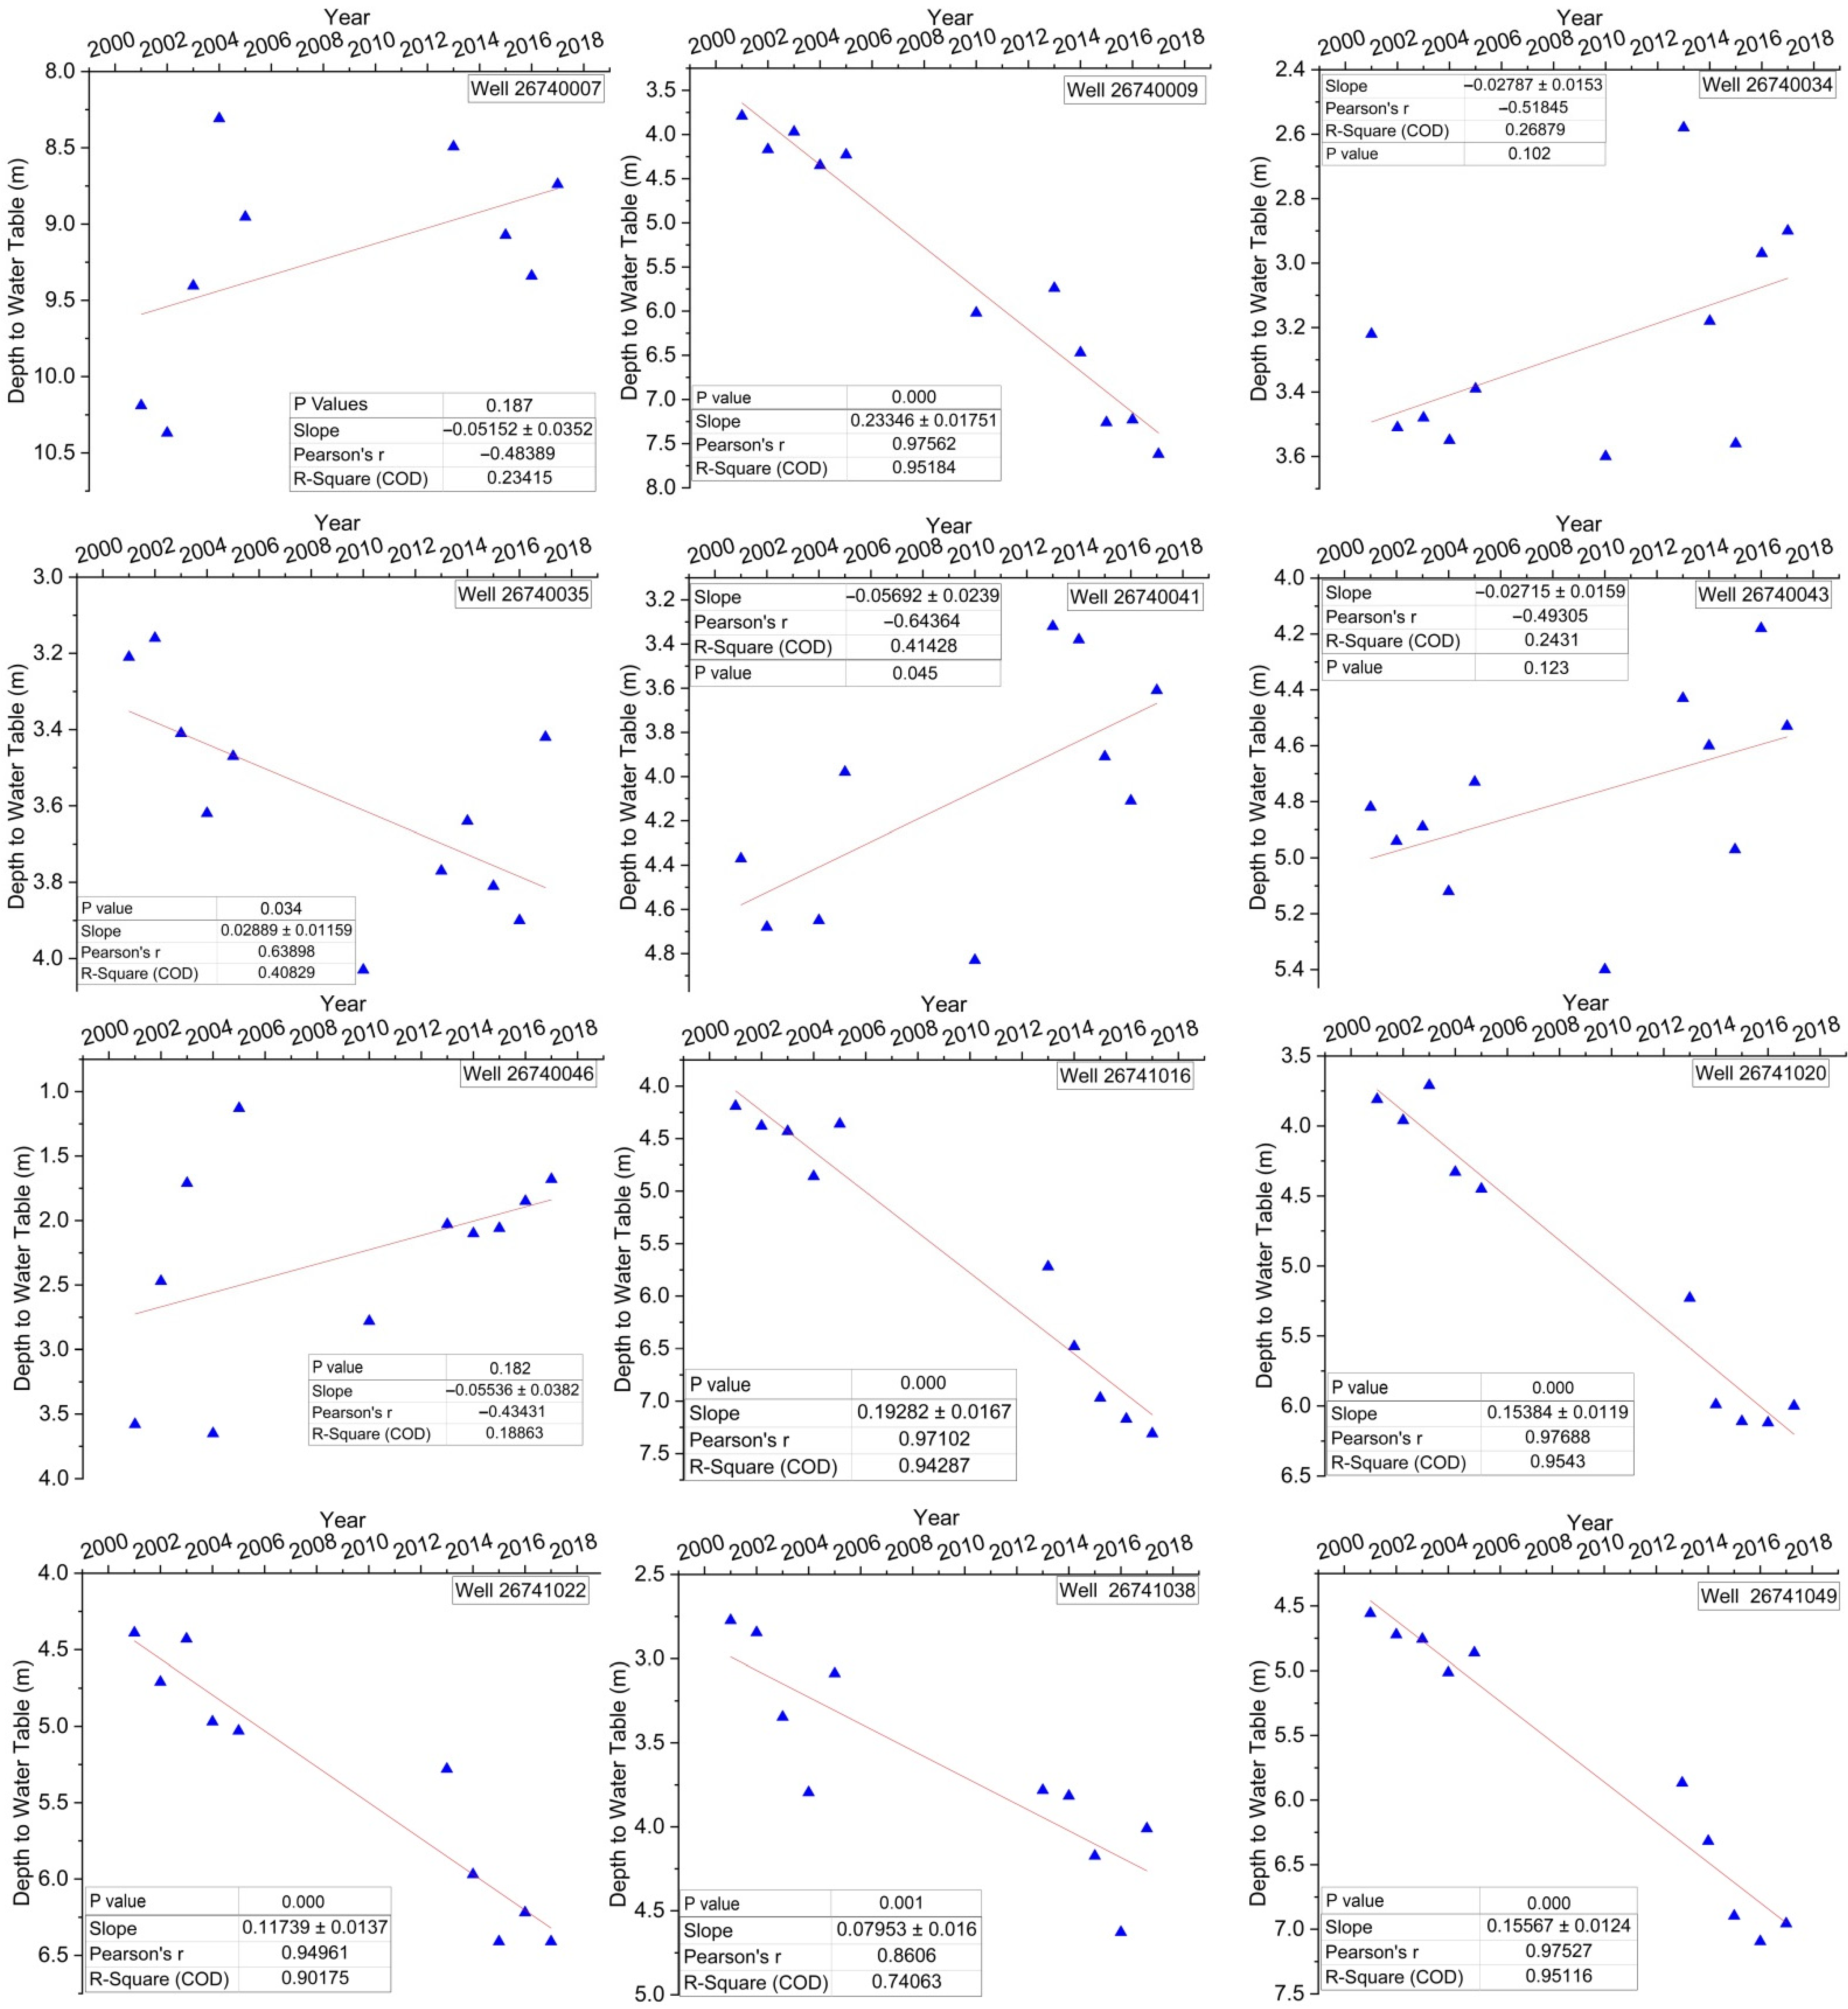
- Stable groundwater salinity within the study period was engendered by groundwater exploitation that led to a decline in groundwater depth which superseded the impact of evaporation concentration of salts in groundwater. However, this was accompanied by increased agricultural production and fertilizer application, which led to increased nitrate concentrations in groundwater and deleterious levels in some places.
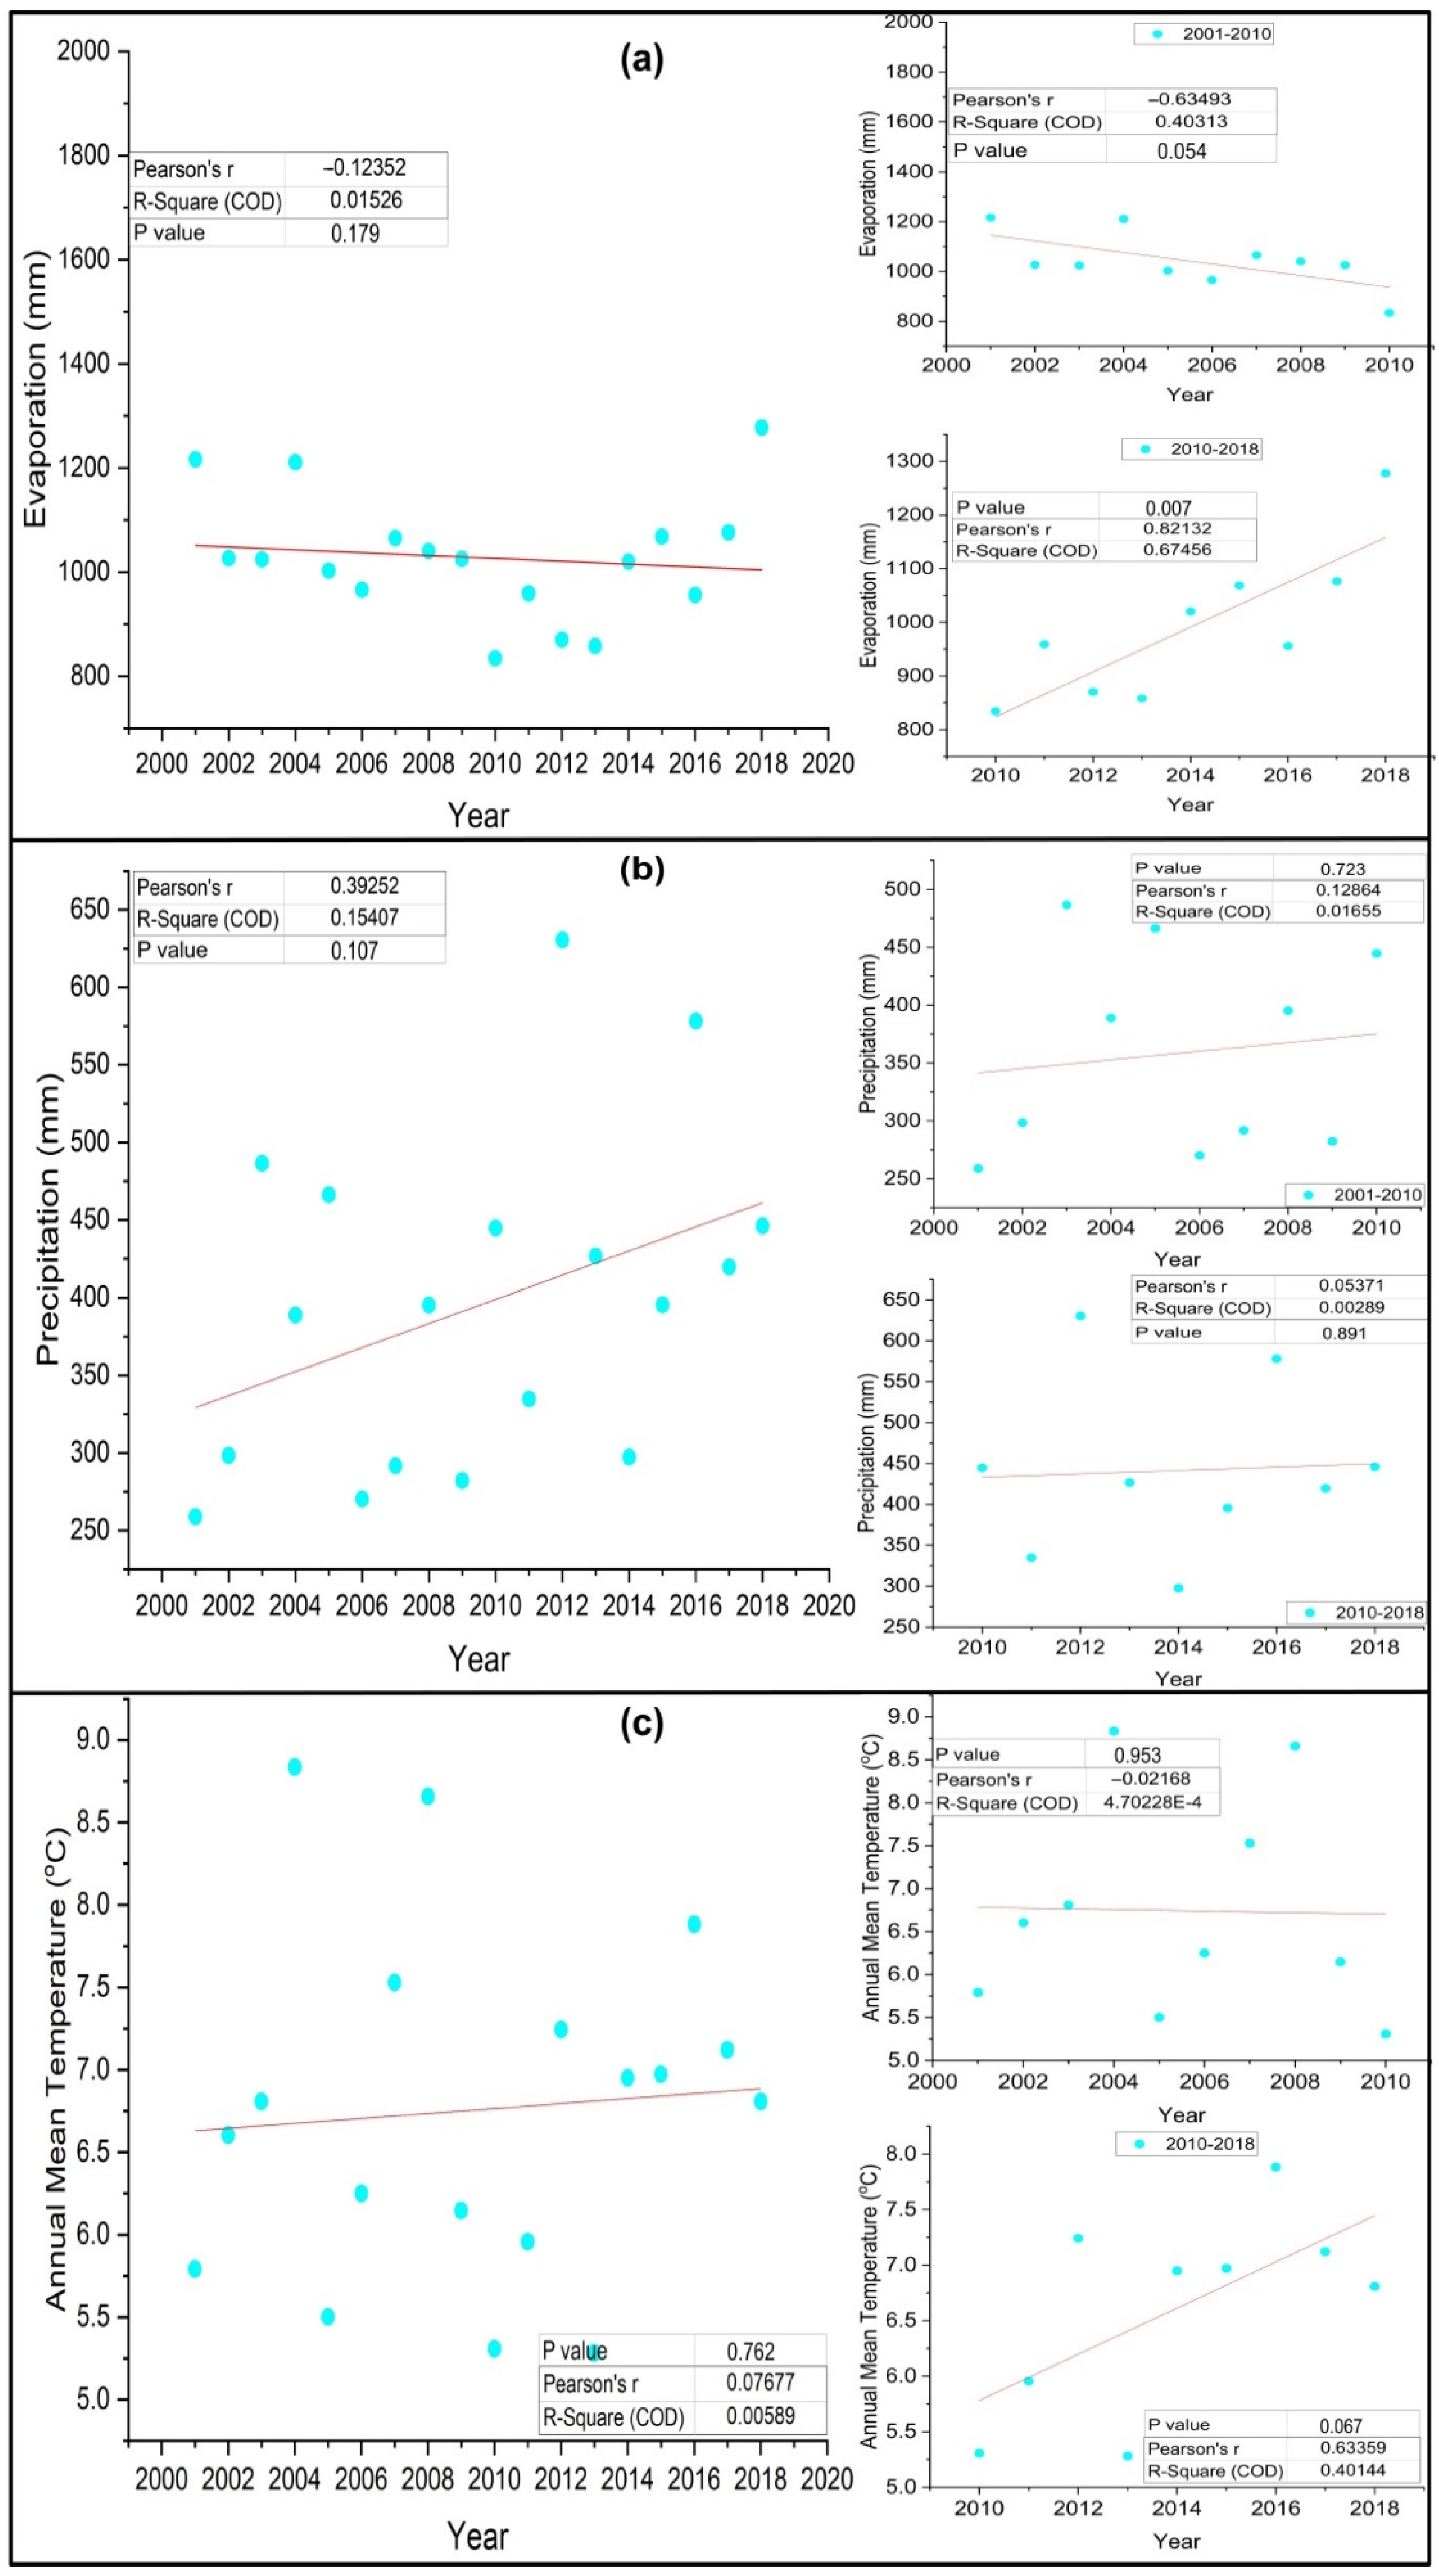
- Salinized land area within the study period increased by about 6706 ha at a rate of 0.06%/year as a result of the size reduction in water bodies and swampland in response to the declining water table that exposed shallow water to more evaporation. Though the ratio of evaporation-precipitation over the study period favoured soil desalinization, it is believed that the conversion of water bodies and swamplands to salinized land under increasing groundwater exploitation overshadowed the climatic influence thus leading to an area increase in salinized land within the period.
- Overall, from 2001 to 2019, most of the study area was stable in terms of desertification as significantly degraded lands covered only 0.03% (148 ha) of the area while stable land and significantly vegetated lands covered 98.32% (563,497 ha) and 1.67% (9556 ha), respectively. The role of precipitation in desertification was insignificant with irrigation believed to be the main driver of significant vegetation improvement.
Author Contributions
Funding
Institutional Review Board Statement
Informed Consent Statement
Data Availability Statement
Conflicts of Interest
References
- Mirzavand, M.; Ghasemieh, H.; Sadatinejad, S.J.; Bagheri, R. An overview on source, mechanism and investigation approaches in groundwater salinization studies. Int. J. Environ. Sci. Technol. 2020, 17, 2463–2476. [Google Scholar] [CrossRef]
- Li, M.; Xiao, C.; Liang, X.; Cao, Y.; Hu, S. Hydrogeochemical evolution under a changing environment: A case study in Jilin, China. Water Supply 2020, 20, 1653–1663. [Google Scholar] [CrossRef]
- Vengosh, A.; Gill, J.; Davisson, M.L.; Hudson, G.B. A Multi-lsotope. (B, Sr, O, H, C) and Age Dating (3H-3He, ~4C) Study of Ground Water from Salinas Valley California: Hydrochemistry, Dynamics, and Contamination Processes. Water Resour. Res. 2002, 38, 1–17. [Google Scholar] [CrossRef]
- Mirzavand, M.; Ghasemieh, H.; Sadatinejad, S.J.; Bagheri, R.; Clark, I.D. Saltwater intrusion vulnerability assessment using AHP-GALDIT model in Kashan plain aquifer as critical aquifer in a semi-arid region Desert. Desert 2018, 23, 255–264. [Google Scholar]
- Van Weert, F.R.J.; van der Gun, J. Global Overview of Saline Groundwater Occurrence and Genesis; International Groundwater Resources Assessment Centre: Utrecht, The Netherlands, 2009. [Google Scholar]
- Zabala, M.E.; Manzano, M.; Vives, L. The origin of groundwater composition in the Pampeano Aquifer underlying the Del Azul Creek basin, Argentina. Sci. Total Environ. 2015, 518, 168–188. [Google Scholar] [CrossRef] [PubMed]
- De Montety, V.; Radakovitch, O.; Vallet-Coulomb, C.; Blavoux, B.; Hermitte, D.; Valles, V. Origin of groundwater salinity and hydrogeochemical processes in a confined coastal aquifer: Case of the Rhône delta (Southern France). Appl. Geochem. 2008, 23, 2337–2349. [Google Scholar] [CrossRef]
- Mahlknecht, J.; Merchán, D.; Rosner, M.; Meixner, A.; Ledesma-Ruiz, R. Assessing seawater intrusion in an arid coastal aquifer under high anthropogenic influence using major constituents, Sr and B isotopes in groundwater. Sci. Total Environ. 2017, 588, 282–295. [Google Scholar] [CrossRef]
- Cartwright, I.; Weaver, T.R.; Fulton, S.; Nichol, C.; Reid, M.; Cheng, X. Hydrogeochemical and isotopic constraints on the origins of dryland salinity, Murray Basin, Victoria, Australia. Appl. Geochem. 2004, 19, 1233–1254. [Google Scholar] [CrossRef]
- Sami, K. Recharge mechanisms and geochemical processes in a semi-arid sedimentary basin, Eastern Cape, South Africa. J. Hydrol. 1992, 139, 27–48. [Google Scholar] [CrossRef]
- Vengosh, A.; Spivack, A.J.; Artzi, Y.; Ayalon, A. Geochemical and boron, strontium, and oxygen isotopic constraints on the origin of the salinity in groundwater from the Mediterranean Coast of Israel. Water Resour. Res. 1999, 35, 1877–1894. [Google Scholar] [CrossRef] [Green Version]
- Jia, Y.; Guo, H.; Xi, B.; Jiang, Y.; Zhang, Z.; Yuan, R.; Yi, W.; Xue, X. Sources of groundwater salinity and potential impact on arsenic mobility in the western Hetao Basin, Inner Mongolia. Sci. Total Environ. 2017, 601, 691–702. [Google Scholar] [CrossRef] [PubMed]
- Liu, Y.; Jin, M.; Wang, J. Insights into groundwater salinization from hydrogeochemical and isotopic evidence in an arid inland basin. Hydrol. Process. 2018, 32, 3108–3127. [Google Scholar] [CrossRef]
- Xiao, C.; Liang, X. Genesis and Harnessing of Saline-Alkali soil in Qian’an county, Jilin Province. In Groundwater and the Environment; Seismological Press: Beijing, China, 1992; pp. 695–699. [Google Scholar]
- Cui, G.; Lu, Y.; Zheng, C.; Liu, Z.; Sai, J. Relationship between soil salinization and groundwater hydration in Yaoba Oasis, Northwest China. Water 2019, 11, 175. [Google Scholar] [CrossRef] [Green Version]
- Li, J.; Pu, L.; Han, M.; Zhu, M.; Zhang, R.; Xiang, Y. Soil salinization research in China: Advances and prospects. J. Geogr. Sci. 2014, 24, 943–960. [Google Scholar] [CrossRef]
- Wang, T.Y.; Huang, J.L.; Zhong, X.J. Review on sustainable utilization of salt-affected land. Acta Geogr. Sin. 2011, 66, 673–684. (In Chinese) [Google Scholar]
- Shi, X.; Chen, Y.; Yue, J.; Li, J.; Peng, C. Simulating and forecasting soil-salinisation evolution: A case study on Changling County, Jilin province, China. N. Z. J. Agric. Res. 2007, 50, 975–981. [Google Scholar] [CrossRef]
- Zhang, X.; Huang, B.; Liu, F. Information extraction and dynamic evaluation of soil salinization with a remote sensing method in a typical county on the Huang-Huai-Hai Plain of China. Pedosphere 2017, 30, 496–507. [Google Scholar] [CrossRef]
- Zhao, Y.; Feng, Q.; Lu, A.; Deo, R.C. Assessment of soil salinisation in the Ejina Oasis located in the lower reaches of Heihe River, Northwestern China. Chem. Ecol. 2019, 35, 330–343. [Google Scholar] [CrossRef]
- Yu, R.; Liu, T.; Xu, Y.; Zhu, C.; Zhang, Q.; Qu, Z.; Liu, X.; Li, C. Analysis of salinization dynamics by remote sensing in Hetao Irrigation District of North China. Agric. Water Manag. 2010, 97, 1952–1960. [Google Scholar] [CrossRef]
- Li, B. Soil Salinization Salts. In Desertification and Its Control in China; Springer: Berlin/Heidelberg, Germany, 2010; pp. 263–298. [Google Scholar] [CrossRef]
- Wang, J.; Liu, Y.; Wang, S.; Liu, H.; Fu, G.; Xiong, Y. Spatial distribution of soil salinity and potential implications for soil management in the Manas River watershed, China. Soil Use Manag. 2019, 36, 93–103. [Google Scholar] [CrossRef]
- Wang, Y.; Deng, C.; Liu, Y.; Niu, Z.; Li, Y. Identifying change in spatial accumulation of soil salinity in an inland river watershed, China. Sci. Total Environ. 2018, 621, 177–185. [Google Scholar] [CrossRef] [PubMed]
- Liu, W.; Xu, X.; Lu, F.; Cao, J.; Li, P.; Fu, T.; Chen, G.; Su, Q. Three-dimensional mapping of soil salinity in the southern coastal area of Laizhou Bay, China. Land Degrad. Dev. 2018, 29, 3772–3782. [Google Scholar] [CrossRef]
- Liu, G.; Li, J.; Zhang, X.; Wang, X.; Lv, Z.; Yang, J.; Shao, H.; Yu, S. GIS-mapping spatial distribution of soil salinity for Eco-restoring the Yellow River Delta in combination with Electromagnetic Induction. Ecol. Eng. 2016, 94, 306–314. [Google Scholar] [CrossRef]
- Ding, J.L.; Wu, M.C.; Tiyip, T. Study on Soil Salinization Information in Arid Region Using Remote Sensing Technique. Agric. Sci. China 2011, 10, 404–411. [Google Scholar] [CrossRef]
- Ma, L.; Ma, F.; Li, J.; Gu, Q.; Yang, S.; Wu, D.; Feng, J.; Ding, J. Characterizing and modeling regional-scale variations in soil salinity in the arid oasis of Tarim Basin, China. Geoderma 2017, 305, 1–11. [Google Scholar] [CrossRef]
- Province, X.; Peng, J.; Biswas, A.; Jiang, Q.; Zhao, R.; Hu, J.; Hu, B.; Shi, Z. Geoderma Estimating soil salinity from remote sensing and terrain data in southern. Geoderma 2019, 337, 1309–1319. [Google Scholar] [CrossRef]
- Rubio, J.L.; Bochet, E. Desertification indicators as diagnosis criteria for desertification risk assessment in Europe. J. Arid Environ. 1998, 39, 113–120. [Google Scholar] [CrossRef]
- Sentis, I.P.L.A. Soil Salinization and Land Desertification. In Soil Degradation and Desertification in Mediterranean Environments; Rubio, A., Calvo, J.L., Eds.; Geoforma: Logrofio, Spain, 1996. [Google Scholar]
- UNCCD. Convention on Combating Desertification; UNCCD: Bonn, Germany, 1994. [Google Scholar]
- Geist, H. (Ed.) The Causes and Progression of Desertification, 1st ed.; Routledge: London, UK, 2005. [Google Scholar] [CrossRef]
- Zha, Y.; Gao, J. Characteristics of desertification and its rehabilitation in China. J. Arid Environ. 1997, 37, 419–432. [Google Scholar] [CrossRef]
- Fang, L.; Bai, Z.; Wei, S.; He, Y.; Wang, Z.; Song, K.; Liu, D.; Liu, Z. Sandy desertification change and its driving forces in western Jilin Province, North China. Environ. Monit. Assess. 2008, 136, 379–390. [Google Scholar] [CrossRef]
- Eckert, S.; Hüsler, F.; Liniger, H.; Hodel, E. Trend analysis of MODIS NDVI time series for detecting land degradation and regeneration in Mongolia. J. Arid Environ. 2015, 113, 16–28. [Google Scholar] [CrossRef]
- Wang, R.; Bian, J.M.; Gao, Y. Research on hydrochemical spatio-temporal characteristics of groundwater quality of different aquifer systems in Songhua River Basin, eastern Songnen Plain, Northeast China. Arab. J. Geosci. 2014, 7, 5081–5092. [Google Scholar] [CrossRef]
- Zhang, G.; Deng, W.; Yang, Y.S.; Salama, R.B. Evolution study of a regional groundwater system using hydrochemistry and stable isotopes in Songnen Plain, northeast China. Hydrol. Process. 2007, 21, 1055–1065. [Google Scholar] [CrossRef]
- Jia, Y.; Xi, B.; Jiang, Y.; Guo, H.; Yang, Y.; Lian, X.; Han, S. Distribution, formation and human-induced evolution of geogenic contaminated groundwater in China: A review. Sci. Total Environ. 2018, 643, 967–993. [Google Scholar] [CrossRef] [PubMed]
- Yang, J.; Zhang, S.; Ying, L.I.; Kun, B.U.; Zhang, Y.; Chang, L.; Zhang, Y. Dynamics of saline-alkali land and its ecological regionalization in western songnen plain, China. Chin. Geogr. Sci. 2010, 20, 159–166. [Google Scholar] [CrossRef] [Green Version]
- Li, Q.; Zhou, D.; Jin, Y.; Wang, M.; Song, Y.; Li, G. Effects of fencing on vegetation and soil restoration in a degraded alkaline grassland in northeast China. J. Arid Land 2014, 6, 478–487. [Google Scholar] [CrossRef] [Green Version]
- Li, H.; Xu, F.; Li, Z.; You, N.; Zhou, H.; Zhou, Y.; Chen, B.; Qin, Y.; Xiao, X.; Dong, J. Forest Changes by Precipitation Zones in Northern China after the Three-North Shelterbelt Forest Program in China. Remote Sens. 2021, 13, 543. [Google Scholar] [CrossRef]
- Li, M.; Liu, A.; Zou, C.; Xu, W.; Shimizu, H.; Wang, K. An overview of the “Three-North” Shelterbelt project in China. For. Stud. China 2012, 14, 70–79. [Google Scholar] [CrossRef]
- Dong, G.; Zhao, F.; Chen, J.; Qu, L.; Jiang, S.; Chen, J.; Xin, X.; Shao, C. Land uses changed the dynamics and controls of carbon-water exchanges in alkali-saline Songnen Plain of Northeast China. Ecol. Indic. 2021, 133, 108353. [Google Scholar] [CrossRef]
- Dianwei, L.; Zongming, W.; Kaishan, S.; Bai, Z.; Liangjun, H.; Ni, H.; Sumei, Z.; Ling, L.; Chunhua, Z.; Guangjia, J. Land use/cover changes and environmental consequences in Songnen Plain, Northeast China. Chin. Geogr. Sci. 2009, 19, 299–305. [Google Scholar] [CrossRef]
- Metternicht, J.A.; Zinck, G.I. Remote Sensing of Soil Salinization: Impact on Land Management, 1st ed.; Shrestha, A., Farshad, D.P., Eds.; Taylor & Francis Group, LLC.: London, UK, 2008; pp. 257–272. [Google Scholar]
- Gorji, T.; Sertel, E.; Tanik, A. Monitoring soil salinity via remote sensing technology under data scarce conditions: A case study from Turkey. Ecol. Indic. 2017, 74, 384–391. [Google Scholar] [CrossRef]
- NEPS-PRC. Technical Requirements for Water Quality Sampling Scheme Design; HJ495; NEPS-PRC: Bamberg, Germany, 2009. [Google Scholar]
- National Standardization Administration. Standard for Groundwater Quality; National Standardization Administration: Geneva, Switzerland, 2007.
- Ding, J.; Yu, D. Monitoring and evaluating spatial variability of soil salinity in dry and wet seasons in the Werigan-Kuqa Oasis, China, using remote sensing and electromagnetic induction instruments. Geoderma 2014, 235, 316–322. [Google Scholar] [CrossRef]
- Khan, N.M.; Rastoskuev, V.V.; Sato, Y.; Shiozawa, S. Assessment of hydrosaline land degradation by using a simple approach of remote sensing indicators. Agric. Water Manag. 2005, 77, 96–109. [Google Scholar] [CrossRef]
- Foody, G.M.; Campbell, N.A.; Trodd, N.M.; Wood, T.F. Derivation and applications of probabilistic measures of class membership from the maximum—Likelihood classification. Photogramm. Eng. Remote Sens. 1992, 58, 1335–1341. [Google Scholar]
- Karra, K.; Kontgis, C.; Statman-Weil, Z.; Mazzariello, J.C.; Mathis, M.; Brumby, S.P. Global land use/land cover with Sentinel 2 and deep learning. In Proceedings of the 2021 IEEE International Geoscience and Remote Sensing Symposium, Brussels, Belgium, 11–16 July 2021; pp. 4704–4707. [Google Scholar] [CrossRef]
- Venter, Z.S.; Barton, D.N.; Chakraborty, T.; Simensen, T.; Singh, G. Global 10 m Land Use Land Cover Datasets: A Comparison of Dynamic World, World Cover and Esri Land Cover. Remote Sens. 2022, 14, 4101. [Google Scholar] [CrossRef]
- Wang, Z.; Song, K.; Ren, C.; Luo, L.; Yang, T. Shrinkage and fragmentation of grasslands in the West Songnen Plain, China. Agric. Ecosyst. Environ. 2009, 129, 315–324. [Google Scholar] [CrossRef]
- Collado, A.; Chuvieco, A.D.; Camarasa, E. Satellite remote sensing analysis to monitor desertification processes in the crop-rangeland boundary of Argentina. J. Arid Environ. 2002, 52, 121–133. [Google Scholar] [CrossRef]
- Al-Khaqani, E.T. Desertification Detection by NDVI and Other Indices: A Case Study in Najaf. J. Xidian Univ. 2020, 14, 1148–1161. [Google Scholar] [CrossRef]
- Mihi, A.; Ghazela, R.; Wissal, D. Mapping potential desertification-prone areas in North-Eastern Algeria using logistic regression model, GIS, and remote sensing techniques. Environ. Earth Sci. 2022, 81, 385. [Google Scholar] [CrossRef]
- Song, G.; Huang, J.T.; Ning, B.H.; Wang, J.W.; Zeng, L. Effects of groundwater level on vegetation in the arid area of western China. China Geol. 2021, 4, 527–535. [Google Scholar] [CrossRef]
- Baniya, B.; Tang, Q.; Huang, Z.; Sun, S.; Techato, K.A. Spatial and temporal variation of NDVI in response to climate change and the implication for carbon dynamics in Nepal. Forests 2018, 9, 329. [Google Scholar] [CrossRef]
- He, P.; Xu, L.; Liu, Z.; Jing, Y.; Zhu, W. Dynamics of NDVI and its influencing factors in the Chinese Loess Plateau during 2002–2018. Reg. Sustain. 2021, 2, 36–46. [Google Scholar] [CrossRef]
- Li, L.; Chen, J.; Han, X.; Zhang, W.; Shao, C. Grassland Ecosystems of China. In Ecosystems of China; Springer: Berlin/Heidelberg, Germany, 2020; p. 2. Available online: http://link.springer.com/10.1007/978-981-15-3421-8 (accessed on 25 January 2022).
- Yang, F.; Zhang, J.; Yanfang, G. Groundwater’s Role in Soil Salinization and Alkalinization in the Songnen Plain, Northeast China; China Geological Survey: Beijing, China, 2012; Available online: http://en.cgs.gov.cn/achievements/201601/t20160112_35549.html (accessed on 13 December 2021).
- Yang, F.; Zhang, G.; Yin, X.; Liu, Z.; Huang, Z. Study on capillary rise from shallow groundwater and critical water table depth of a saline-sodic soil in western Songnen plain of China. Environ. Earth Sci. 2011, 64, 2119–2126. [Google Scholar] [CrossRef]
- Ibrakhimov, M.; Khamzina, A.; Forkutsa, I. Groundwater table and salinity: Spatial and temporal distribution and influence on soil salinization in Khorezm region (Uzbekistan, Aral Sea Basin). Irig. Grain. Syst. 2007, 21, 219–236. [Google Scholar] [CrossRef]
- Li, Z.; Wang, G.; Wang, X.; Wan, L.; Shi, Z.; Wanke, H.; Uugulu, S.; Uahengo, C.I. Groundwater quality and associated hydrogeochemical processes in Northwest Namibia. J. Geochem. Explor. 2018, 186, 202–214. [Google Scholar] [CrossRef]
- Adeyeye, O.A. Study on Risk Assessment and Control of Groundwater Environment in Qianan County, Jilin Province; Jilin University: Changchun, China, 2022. [Google Scholar]
- Bouzourra, H.; Bouhlila, R.; Elango, L.; Slama, F.; Ouslati, N. Characterization of mechanisms and processes of groundwater salinization in irrigated coastal area using statistics, GIS, and hydrogeochemical investigations. Environ. Sci. Pollut. Res. 2015, 22, 2643–2660. [Google Scholar] [CrossRef]
- Hao, S.; Li, F.; Li, Y.; Gu, C.; Zhang, Q.; Qiao, Y.; Jiao, L.; Zhu, N. Stable isotope evidence for identifying the recharge mechanisms of precipitation, surface water, and groundwater in the Ebinur Lake basin. Sci. Total Environ. 2019, 657, 1041–1050. [Google Scholar] [CrossRef]
- Li, M.; Liang, X.; Xiao, C.; Cao, Y.; Hu, S. Hadrochemical evolution of groundwater in a typical semi-arid groundwater storage basin using a zoning model. Water 2019, 11, 1334. [Google Scholar] [CrossRef] [Green Version]
- Meng, F.; Liang, X.; Xiao, C.; Wang, G. Integration of GIS, improved entropy and improved catastrophe methods for evaluating suitable locations for well drilling in arid and semi-arid plains. Ecol. Indic. 2021, 131, 108124. [Google Scholar] [CrossRef]
- Greene, R.; Timms, W.; Rengasamy, P.; Arshad, M.; Cresswell, R. Soil andaquifer salinization: Toward an integrated approach for salinity management of groundwater. In Integrated Groundwater Management: Concepts, Approaches and Challenges; Jakeman, A.J., Barreteau, O., Hunt, R.J., Rinaudo, J.D., Ross, A., Eds.; Springer: Cham, Switzerland, 2016; 762p. [Google Scholar] [CrossRef] [Green Version]
- Zhai, Y.; Lei, Y.; Wu, J.; Teng, Y.; Wang, J.; Zhao, X.; Pan, X. Does the groundwater nitrate pollution in China pose a risk to human health? A critical review of published data. Environ. Sci. Pollut. Res. 2017, 24, 3640–3653. [Google Scholar] [CrossRef]
- Wang, S.; Tang, C.; Song, X.; Yuan, R.; Han, Z.; Pan, Y. Factors contributing to nitrate contamination in a groundwater recharge area of the North China Plain. Hydrol. Process. 2016, 30, 2271–2285. [Google Scholar] [CrossRef]
- Bian, J.; Liu, C.; Zhang, Z.; Wang, R.; Gao, Y. Hydro-geochemical characteristics and health risk evaluation of nitrate in groundwater. Pol. J. Environ. Stud. 2016, 25, 521–527. [Google Scholar] [CrossRef] [PubMed] [Green Version]
- Li, D.; Zhai, Y.; Lei, Y.; Li, J.; Teng, Y.; Lu, H.; Xia, X.; Yue, W.; Yang, J. Spatiotemporal evolution of groundwater nitrate nitrogen levels and potential human health risks in the Songnen Plain, Northeast China. Ecotoxicol. Environ. Saf. 2021, 208, 111524. [Google Scholar] [CrossRef] [PubMed]
- Jie, T.; Dai, Y.; Wang, J.; Qu, Y.; Liu, B.; Duan, Y.; Li, Z. Study on Environmental Factors of Fluorine in Chagan Lake. Water 2021, 13, 629. [Google Scholar] [CrossRef]
- Liu, J.; Zheng, C. Towards Integrated Groundwater Management in China BT. In Integrated Groundwater Management: Concepts, Approaches and Challenges; Jakeman, A.J., Barreteau, O., Hunt, R.J., Rinaudo, J.D., Ross, A., Eds.; Springer: Cham, Switzerland, 2016; pp. 455–475. [Google Scholar] [CrossRef] [Green Version]
- Wang, Y.; Zheng, C.; Ma, R. Review: Safe and sustainable groundwater supply in China. Hydrogeol. J. 2018, 26, 1301–1324. [Google Scholar] [CrossRef]
- Jiang, M.; Xie, S.; Wang, S. Water use conflict and coordination between agricultural and wetlands—A case study of Yanqi basin. Water 2020, 12, 3225. [Google Scholar] [CrossRef]
- Schwinning, S. Ecohydrology Bearing—Invited Commentary Transformation ecosystem change and ecohydrology. Ecohydrology 2010, 3, 238–245. [Google Scholar] [CrossRef]
- Liu, Q.; He, Y.; Deng, W. Study on the soil salinization process in the changeable environment: A case study in the middle and lower reaches of Taoer River. J. Arid Land Resour. Environ. 2005, 19, 113–117. (In Chinese) [Google Scholar]
- Wang, Z.; Li, L. Determination of land salinization causes via land cover and hydrological process change detection in a typical part of Songnen Plain. J. Geogr. Sci. 2018, 28, 1099–1112. [Google Scholar] [CrossRef] [Green Version]
- Zhang, B.; Song, X.; Zhang, Y.; Han, D.; Tang, C.; Yang, L.; Wang, Z.-L. The relationship between and evolution of surface water and groundwater in Songnen Plain, Northeast China. Environ. Earth Sci. 2015, 73, 8333–8343. [Google Scholar] [CrossRef]
- Lv, J.; Wang, X.-S.; Zhou, Y.; Qian, K.; Wan, L.; Eamus, D.; Tao, Z. Groundwater-dependent distribution of vegetation in Hailiutu River catchment, a semi-arid region in China. Ecohydrology 2013, 6, 142–149. [Google Scholar] [CrossRef]
- Aguilar, C.; Zinnert, J.C.; Polo, M.J.; Young, D.R. NDVI as an indicator for changes in water availability to woody vegetation. Ecol. Indic. 2012, 23, 290–300. [Google Scholar] [CrossRef]
- Rohde, M.M.; Stella, J.C.; Roberts, D.A.; Singer, M.B. Groundwater dependence of riparian woodlands and the disrupting effect of anthropogenically altered streamflow. Proc. Natl. Acad. Sci. USA 2021, 118, e2026453118. [Google Scholar] [CrossRef] [PubMed]
- Prihantono, J.; Adi, N.S.; Nakamura, T.; Nadaoka, K. The Impact of Groundwater Variability on Mangrove Greenness in Karimunjawa National Park based on Remote Sensing Study. IOP Conf. Ser. Earth Environ. Sci. 2021, 925, 012064. [Google Scholar] [CrossRef]
- Qi, Z.; Xiao, C.; Wang, G.; Liang, X. Study on Ecological Threshold of Groundwater in Typical Salinization Area of Qian’an County. Water 2021, 13, 856. [Google Scholar] [CrossRef]
- Wang, Y.; Shen, X.; Jiang, M.; Lu, X. Vegetation Change and Its Response to Climate Change between 2000 and 2016 in Marshes of the Songnen Plain, Northeast China. Sustainability 2020, 12, 3569. [Google Scholar] [CrossRef]


| Image Type | Date | Image Type | Date |
|---|---|---|---|
| Landsat-5 * | 13 April 2001 | Landsat-5 | 13 September 2010 |
| Landsat-5 | 30 August 2002 | Landsat-8 | 17 June 2013 |
| Landsat-5 | 25 August 2003 | Landsat-8 | 9 July 2015 |
| Landsat-5 | 26 July 2004 | Landsat-8 | 28 August 2016 |
| Landsat-5 | 17 August 2006 | Landsat-8 | 31 August 2017 |
| Landsat-5 | 19 July 2007 | Landsat-8 | 2 August 2018 |
| Landsat-5 | 6 August 2008 | Landsat-8 * | 1 May 2019 |
| Landsat-5 * | 8 May 2010 | Landsat-8 | 22 September 2019 |
| pH | TDS | Ca2+ | Mg2+ | K+ | Na+ | Cl− | SO42− | CO32− | HCO3− | NO3− | |
|---|---|---|---|---|---|---|---|---|---|---|---|
| 2000 (n = 9) | |||||||||||
| Mean | 7.69 | 906.56 | 96.36 | 42.29 | 2.42 | 155.93 | 119.47 | 57.88 | 1.05 | 391.33 | 4.68 |
| Minimum | 7.40 | 546.00 | 45.30 | 16.60 | 0.80 | 20.90 | 11.10 | 11.60 | 0.00 | 294.00 | 1.51 |
| Maximum | 8.30 | 1419.00 | 168.00 | 81.10 | 6.80 | 400.00 | 291.00 | 97.00 | 9.44 | 582.00 | 9.66 |
| Stdev * | 0.28 | 317.46 | 47.85 | 23.09 | 1.79 | 138.05 | 101.46 | 27.68 | 3.15 | 91.84 | 3.25 |
| 2017 (n = 19) | |||||||||||
| Mean | 7.69 | 835.26 | 128.63 | 40.33 | 1.04 | 96.42 | 109.37 | 52.45 | – | 459.74 | 26.87 |
| Minimum | 7.40 | 295.00 | 44.30 | 11.80 | 0.32 | 14.40 | 6.20 | 1.17 | – | 164.00 | 0.01 |
| Maximum | 8.30 | 2430.00 | 368.00 | 176.00 | 3.56 | 503.00 | 445.00 | 336.00 | – | 1200.00 | 113.00 |
| Stdev * | 0.28 | 622.01 | 88.57 | 39.88 | 0.85 | 137.48 | 123.98 | 83.84 | – | 236.94 | 35.80 |
| LULC Class | Area (%) | Area (ha) | Change 2001–2010 | Change 2010–2019 | Change 2001–2019 | |||||||
|---|---|---|---|---|---|---|---|---|---|---|---|---|
| 2001 | 2010 | 2019 | 2001 | 2010 | 2019 | Ha | Rate (%/Year) | Ha | Rate (%/Year) | Ha | Rate (%/Year) | |
| Dry cropland | 63.00 | 60.01 | 59.32 | 361,099 | 343,969 | 340,008 | −17,129 | −0.30 | −3961 | −0.07 | −21,091 | −0.19 |
| Grassland | 11.86 | 14.13 | 12.66 | 67,998 | 81,004 | 72,555 | 13,006 | 0.23 | −8448 | −0.15 | 4558 | 0.04 |
| Paddy | 0.00 | 0.00 | 5.07 | 0 | 29,077 | 0 | 0.00 | 29,077 | 0.51 | 29,077 | 0.27 | |
| Salinized land | 0.67 | 0.97 | 1.84 | 3829 | 5569 | 10,535 | 1740 | 0.03 | 4966 | 0.09 | 6706 | 0.06 |
| Swampland | 10.18 | 13.69 | 7.81 | 58,343 | 78,473 | 44,757 | 20,129 | 0.35 | −33,716 | −0.59 | −13,587 | −0.12 |
| Waterbody | 1.80 | 1.44 | 0.65 | 10,319 | 8258 | 3737 | −2062 | −0.04 | −4520 | −0.08 | −6582 | −0.06 |
| Woodland | 6.09 | 3.35 | 6.24 | 34,918 | 19,202 | 35,780 | −15,716 | −0.27 | 16,578 | 0.29 | 862 | 0.01 |
| Land Use Type | LULC 2019 | ||||||||
|---|---|---|---|---|---|---|---|---|---|
| Dry Cropland | Grassland | Paddy | Salinized Land | Swampland | Waterbody | Woodland | Grand Total | ||
| LULC 2001 | Dry cropland | 296,494 | 23,443 | 8502 | 1448 | 6412 | 0 | 24,438 | 361,099 |
| Grassland | 17,823 | 29,448 | 6534 | 1899 | 12,011 | 24 | 199 | 67,998 | |
| Salinized land | 73 | 448 | 739 | 1481 | 905 | 183 | 0 | 3829 | |
| Swampland | 6531 | 15,897 | 8513 | 3680 | 23,178 | 298 | 222 | 58,343 | |
| Waterbody | 77 | 924 | 2745 | 1975 | 1355 | 3233 | 10 | 10,319 | |
| Woodland | 18,774 | 2323 | 2013 | 47 | 883 | 0 | 10,853 | 34,918 | |
| Grand Total | 340,008 | 72,555 | 29,077 | 10,535 | 44,757 | 3737 | 35,780 | 536,506 | |
| Net Change | −21,091 | 4558 | 29,077 | 6706 | −13,587 | −6582 | 862 | ||
| Period | Class | NDVI Change | Area % | Area (ha) |
|---|---|---|---|---|
| 2001–2010 | Slope < −0.01 | Degradation | 1.82 | 10,413 |
| −0.01 < Slope < 0.01 | Stable | 97.86 | 560,912 | |
| Slope > 0.01 | Vegetated | 0.33 | 1874 | |
| Sum | 100.00 | 573,199 | ||
| Significance | ||||
| p < 0.05 | Degradation | 0.07 | 398 | |
| p > 0.05 | Stable | 99.86 | 572,379 | |
| p < 0.05 | Vegetated | 0.07 | 422 | |
| 2010–2019 | Slope < −0.01 | Degradation | 0.02 | 93 |
| −0.01 < Slope < 0.01 | Stable | 6.18 | 35,398 | |
| Slope > 0.01 | Vegetated | 93.81 | 537,710 | |
| Significance | ||||
| p > 0.05 | Stable | 85.32 | 489,026 | |
| p < 0.05 | Vegetated | 14.68 | 84,174 | |
| 2010–2019 | Slope < −0.01 | Degradation | 0.32 | 1819 |
| −0.01 < Slope < 0.01 | Stable | 96.65 | 553,987 | |
| Slope > 0.01 | Vegetated | 3.03 | 17,395 | |
| Significance | ||||
| p < 0.05 | Degradation | 0.03 | 148 | |
| p > 0.05 | Stable | 98.31 | 563,497 | |
| p < 0.05 | Vegetated | 1.67 | 9556 |
Disclaimer/Publisher’s Note: The statements, opinions and data contained in all publications are solely those of the individual author(s) and contributor(s) and not of MDPI and/or the editor(s). MDPI and/or the editor(s) disclaim responsibility for any injury to people or property resulting from any ideas, methods, instructions or products referred to in the content. |
© 2022 by the authors. Licensee MDPI, Basel, Switzerland. This article is an open access article distributed under the terms and conditions of the Creative Commons Attribution (CC BY) license (https://creativecommons.org/licenses/by/4.0/).
Share and Cite
Yawe, A.S.; Xiao, C.; Adeyeye, O.A.; Liu, M.; Feng, X.; Liang, X. Spatio-Temporal Evolution of the Ecological Environment in a Typical Semi-Arid Region of Northeast China. Sustainability 2023, 15, 471. https://doi.org/10.3390/su15010471
Yawe AS, Xiao C, Adeyeye OA, Liu M, Feng X, Liang X. Spatio-Temporal Evolution of the Ecological Environment in a Typical Semi-Arid Region of Northeast China. Sustainability. 2023; 15(1):471. https://doi.org/10.3390/su15010471
Chicago/Turabian StyleYawe, Achivir Stella, Changlai Xiao, Oluwafemi Adewole Adeyeye, Mingjun Liu, Xiaoya Feng, and Xiujuan Liang. 2023. "Spatio-Temporal Evolution of the Ecological Environment in a Typical Semi-Arid Region of Northeast China" Sustainability 15, no. 1: 471. https://doi.org/10.3390/su15010471