Abstract
Pumped-storage plants are the most significant electrical storage component in new power systems and show great potential for scaling up. In this paper, economic costs and benefits have been investigated. Both the costs and benefits can be divided into transmission and distribution tariffs; however, various factors need to be considered to reduce costs in transmission and distribution tariffs. The cost characterization methodology for pumped-storage power plants has been developed. A mathematical model for dispersal through the medium and long-term electricity market, the electricity spot market, the ancillary services market, and the leasing of capacity to scenic power stations has been proposed. A case study has been discussed for a regional grid company and a provincial grid company; also, the effectiveness of dispersal has been analyzed based on the case study. The results indicate that when the spot market and the capacity leasing of new energy sites play the largest role in the diversion, the transmission and distribution prices in Province A can be controlled within 1 cent/kWh by applying various diversion methods.
1. Introduction
Driven by the “carbon peaking and carbon neutrality” goal in China, the demand for renewable energy in new power systems continues to increase, and the storage of power resources is maintaining a rapid growth trend. Although the investment recovery and operating cost of pumped storage can be divided into transmission and distribution prices, it also needs to be channeled through various channels to reduce its effect on the transmission and distribution price [1]. Furthermore, in a competitive electricity market, the pumped-storage power station only can obtain the expected income level when the price difference between peak and valley is large enough and the operating hours of power generation reach a certain level [2]. Therefore, to further reduce the operating costs of pump-storage plants, pumped-storage units need to maximize their potential by participating in the operation of the electrical energy and ancillary services markets to maximize revenue [3].
In terms of the operating price mechanism of pumped-storage power stations, the cost price of pumped hydropower is the main operating cost of pumped-storage power stations, and it is very necessary to establish a reasonable price mechanism for pumped-storage power. The main factors of pumped-storage electricity pricing in China include single-volume electricity pricing, single-capacity electricity pricing, and two-part electricity pricing [4]. The single electricity price is based on the on-grid electricity and the pumped electricity; however, due to the relatively high feed-in price of the single electricity system, the pumping price is low. Therefore, most of the single electricity system power stations are in a financial loss. The single-capacity electricity price is based on the investment and operation of the power station. As a result of lacking a lifespan pricing policy, having a strong interest in single-capacity electricity and the utilization hours of pumped storage are far lower than the design level [5]. The two-part electricity price is primarily from capacity price and energy price. The capacity price is the compensational fixed cost of the power station. The energy price is the compensational variable cost of the power station [6]. Moreover, the FIRR (Financial Internal Rate of Return) of the joint operation of new power energy and pumped storage increases, and profitability improves steadily under the short-term power market reform mode, medium-term relatively mature market mode, and long-term mature market mode [7]. It has been proven that in the competitive electricity market under a congested transmission system, when the new power energy systems and pumped-storage system units increased, the market clearing price (MCP) and market clearing volume (MCV) will be optimized and electricity suppliers will be able to satisfy the consumers’ energy demand at a minimum price [8]. In addition, it is found that consumer grid power consumption during peak hours can be minimized by integrating the new power system and pumped-storage system [9]. However, among relevant theses, it is hard to find studies on the market mechanism of the pumped-storage system, and most case studies are focused on a small area. However, some research has focused on massive markets such as China, which has hundreds of millions of kW installed capacity.
According to the cost diversion of pumped-storage power stations, the cost model of pumped-storage power stations can be built through the Monte Carlo algorithm and random probability algorithm [10], but since the production cost evaluation model will affect the target and strategy of participating in market bidding, this method has certain limitations. Meanwhile, it is necessary to consider the flexibility value of pumped-storage power stations and analyze pumped-storage costs and increased power generation income under different power market operation strategies, which can not only determine the corresponding auxiliary service pricing mechanism but also realize pumped storage [11]. Moreover, the failure part is a consideration of ancillary market costs. Therefore, the price mechanism has been considered based on the market environment of pumped-storage power stations using the Conditional Value at Risk (CVaR) to measure the uncertainty of market electricity prices and pumped-storage power stations have been established to participate in electricity bidding and use its flexibility [12]. However, this model did not consider new cost-alleviation methods such as capacity leasing of wind and solar power plants.
In general, although much research has been conducted on the operation mechanism and cost reduction of pumped storage, there is a lack of comprehensive and objective cost-reduction strategies for pumped storage. On 30 April 2021, the National Development and Reform Commission of China issued “The Opinions on Further Improving the Price Formation Mechanism of Pumped Storage (FGJG [2021] No. 633)”, which stipulates that the revenue of pumped-storage power stations comes from both the capacity and electricity. The former is used to recover the fixed investment of the pumped-storage power station, while the latter is used to bear the loss of pumping and power generation of the power station and make proper profits. The capacity electricity charge shall be borne by the transmission and distribution electricity price and channeled through the lease of special power generators such as wind and photovoltaic. The electricity charge is finally determined by the price difference in the spot electricity market, and 80% of its profits together with 80% of the profits of the auxiliary service market are also included in the capacity income to reduce the burden of transmission and distribution electricity prices. Taking a provincial power grid company as an example, this paper established a cost characterization method for pumped-storage power plants and proposed a mathematical model for diversion through the medium- and long-term electricity markets, the spot electricity market, the auxiliary service market, and the capacity leasing of wind power plants according to the above policy. Finally, the effectiveness of diversion is analyzed through an example. The overall cost division strategy is shown in Figure 1. By reducing the cost of pumped storage, it will significantly improve the profitability of pumping and storage, promote the enthusiasm of investors in the construction of pumped storage, help guide the orderly construction of pumped storage, alleviate the peak–valley differences in the power grid, and promote the consumption of new energy.
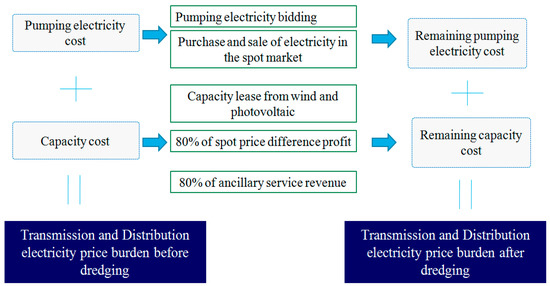
Figure 1.
Diagram of cost division strategy for pumped storage.
2. Electricity Cost Model for Pumped-Storage Plants
For a regional power grid composed of several provincial power grid companies, the cost of the pumped-storage power stations in the region under its jurisdiction can be divided into the transmission and distribution electricity prices without cost guidance, which includes the sum of annual pumping, the power generation loss of each pumped-storage power station, and the capacity electricity charge that meets its fixed investment income, which can be expressed as:
where C is the total pumped-storage cost borne by the regional grid company; N is the total number of pumped-storage power stations under the jurisdiction of the regional grid; Ti is the annual pumping hours of the ith pumped-storage power station; Vi is the installed capacity of the ith pumped-storage power station; ci is the grid-connected tariff of the province where the ith pumped-storage power station is located; pi is the approved capacity tariff of the ith pumped-storage power station under the condition of no price diversion and meets the fixed investment income; and ηi is the pumping power generation efficiency of the ith pumped-storage power station, which is generally taken as 75%.
Considering the inter-provincial sharing mechanism, the sharing of the electricity tariff and the capacity tariff can often be adopted so the high costs are borne by the provincial grid companies under the jurisdiction of the regional grid companies. If a province’s share of the electricity tariff component is k1 and its share of the capacity tariff component is k2, the province’s share of the annual pumped-storage cost without price diversion is:
With the above pumped-storage costs, if the province’s annual commercial and industrial electricity is M, the pumped-storage plant will increase the province’s transmission and distribution prices by
3. Capacity Cost Diversion Model for Pumped-Storage Power Plants
The cost division methods mainly include the power market, spot market, auxiliary service, and special power supply capacity, which will be introduced in detail in the following sections.
3.1. Medium- and Lon—Term Power Market Diversion
According to the opinions of the National Development and Reform Commission on further improving the Price Formation Mechanism of Pumped Storage (2021) No. 633, before the electrical spot market opened, electricity charges can be channeled through bidding in the medium- and long-term electricity markets. In other words, the bidding electricity of the ith pumped-storage power station does not bear the pumping cost of the power grid, which, according to the electricity price (), is converted into the benchmark electricity price and the pumping loss. However, the electricity generated by certain specific power sources (primarily wind, light, and hydropower abandonment) is determined by bidding. If the proportion of the bid electricity of the ith pumped-storage power station is δi, then the cost burden of pumped-storage electricity that can be reduced by the regional power grid company is:
It can be seen that the higher the proportion of electricity tendered by pumped-storage power plants, the greater the cost of diversion. When 100% of the electricity is tendered, the diversion reaches its maximum strength, and only the capacity tariff enters the transmission and distribution price.
3.2. Spot Market Draw Spread Profit Diversion
When the electrical spot market is opened and pumped-storage power plants are included in the main electrical spot market, all the pumped electricity tariffs of pumped-storage power plants will no longer be borne by the power grid companies in accordance with the power generation benchmark tariffs and pumping losses converted tariffs () to cover the pumping costs, but they will purchase and sell electricity in the spot market and gain revenue through the spot market price difference. Furthermore, 20% of this revenue can be enjoyed by the pumped-storage power plant itself, while 80% will be used for capacity tariff relief, and losses will be borne by the pumped-storage power plant itself. Therefore, assuming that the annual average kWh pumped-storage power plant profit after considering losses is ΔCi (ΔCi ≥ 0), the cost of the regional grid company after the spot market power tariff diversion portion is:
The first part is the electricity cost diversion and the second part is the capacity cost diversion.
3.3. Auxiliary Service Revenue Diversion
According to the “Opinions on Further Improving the Price Formation Mechanism of Pumped Storage” issued by the Chinese National Development and Reform Commission (2021) No. 633, pumped-storage power stations are encouraged to participate in the electricity market or the compensation mechanism for auxiliary services, and 20% of the corresponding revenue generated in the previous regulatory cycle, as well as the income generated from the implementation of pumped electricity price and feed-in electricity price, shall be shared by pumped-storage power stations. Auxiliary services include peak shaving, frequency modulation, phase modulation, voltage regulation, climbing, standby, black start, etc., but the capacity electricity charge of pumped storage already includes other service incomes, except peak shaving, so only deep peak shaving can bring additional auxiliary service income to the pumped-storage power station. Considering the diversion of the auxiliary service market, 20% of the income of the pumped-storage power station participating in the auxiliary service can be enjoyed by the pumped-storage power station itself, and 80% will be used for the diversion of capacity electricity charges. If the annual ancillary service revenue of the ith pumped-storage power station is Ai, the cost of ancillary service market diversion within the area of the regional power grid company is:
3.4. Special Power Supply Capacity Diversion
Finally, we consider the allocation of capacity electricity charges among special power sources. If pumped storage leases the capacity for wind farms and photovoltaic power stations and undertakes the system adjustment tasks required by new energy stations after charging annual rent according to the leased capacity, the capacity electricity charges can be diverted. If the leased capacity of the ith pumped-storage power station is Si (Si ≤ Vi) and the average lease price is di, then within the area of the regional power grid company, the cost of special power supply is:
4. Effect of Diversion
According to the above diversion methods, it can be seen that before the pumped-storage power station is included in the main body of the spot market, the cost of the pumped-storage power station borne by the regional power grid company is:
For a provincial power grid company whose electricity charges are apportioned according to the amount of electricity and capacity, the cost of grief after diversion is:
The province’s transmission and distribution price increases are as follows:
After the pumped-storage power station is incorporated into the main body of the spot market, driven by the profitability of pumped power generation in the spot market, the cost of the pumped-storage power station borne by the regional power grid company is:
For a provincial power grid company whose electricity charges are apportioned according to the amount of electricity and capacity, the cost of grief after diversion is:
The province’s transmission and distribution price increases are as follows:
5. The Analysis of Examples
5.1. Development Trend Forecast
Based on the current situation of electricity marketization in the region, the short-term (3–5 years later, 2025 or so), medium-term (8–10 years later, 2030 or so), and long-term (13–15 years later, 2035 or so) scenarios represent different facilitation scenarios. In the near future, the immaturity of the spot market will be the primary consideration, and the role of the spot market in facilitating the cost of pumping and storage will be temporarily ignored. The price advantage of pumped storage is obvious compared with the new type of energy storage. In the medium term, it is primarily considered that the spot market has opened, the price of new energy storage has decreased to a stable value, and the competition between pumped storage and new energy storage has formed. In the long term, it is primarily considered that various mechanisms have matured, and pumped storage, new energy installation, and trading power have entered the stage of slight growth.
In other aspects, when the pumping hours of the pumped-storage power station are set at 1780, the pumping efficiency is 75% and the capacity price of a pumped-storage power station without diversion is 430 yuan/kWh per year. At the same time, the allocation proportion of province A in each stage is unchanged. Table 1 shows the current situation of the grid companies’ and provincial companies’ installed capacity of pumped storage and power generation in the near, medium, and long term. Furthermore, the development forecast of the installed capacity of wind and solar new energy stations is also shown.

Table 1.
Prediction of pumped-storage development environment for a regional power grid company in province A.
5.2. Recent Diversion Strategies and Effectiveness Analysis
By 2025 or so, if there is no diversion, the regional power grid is expected to bear 1.378 billion yuan/year of pumping loss and 3.569 billion yuan of capacity electricity charge, totaling 4.947 billion yuan/year. It can be predicted that approximately half of the pumped electricity in the regional power grid is the bidding electricity through the bidding of pumped electricity and auxiliary service market facilitation, and the pumping loss expenditure of the whole network will be reduced by 690 million yuan/year. Approximately 160 million yuan/year can be gained from the whole network peak-shaving auxiliary services, of which 80% will be used for the deduction of capacity charge in the next cycle, and it is estimated that the capacity charge expenditure can be reduced by 128 million yuan/year. It is estimated that 40% of the newly added solar power sources will lease the pumped-storage capacity at a rental price of 350 yuan/kWh per year, which can reduce the capacity electricity charge by 949 million yuan/year. According to the proportion of 17% of capacity and 22% of electricity, the cost borne by provincial grid A under its jurisdiction is reduced from 910 million yuan/year to 575 million yuan/year. The detailed data are shown in Table 2. It can be seen that capacity leasing is the most important part of the diversion efforts, followed by the bidding of pumped electricity, and auxiliary services have also played a particular role in mitigation. The capacity electricity price after diversion is only 300.24 yuan/kWh per year.
Table 2.
Expected results of comprehensive guidance mechanism (near term).
According to the prediction, in 2025, the industrial and commercial electricity usage of Province A is 83.5 billion kWh/year, the transmission and distribution price will increase by 1.1 cents/kWh before the diversion, but after the bidding for the pumped-power generation and the assistance of the peak-shaving auxiliary service are jointly determined, the estimated increase in the electricity price will be 0.69 cents/kWh. The smoothing contribution of each initiative is shown in Figure 2.
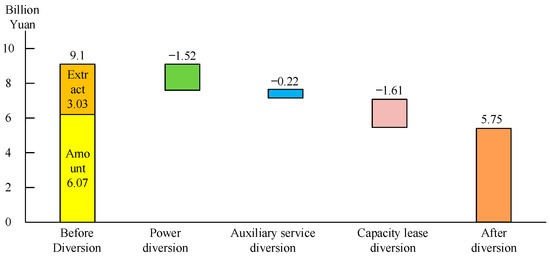
Figure 2.
Contribution forecast of comprehensive diversion measures in Province A (near term).
5.3. Medium-Term Diversion Strategy and Effectiveness Analysis
By 2030 or so, if there is no diversion, the regional power grid will be expected to bear 2.807 billion yuan/year of pumping loss and 7.267 billion yuan of capacity electricity charge, totaling 10.074 billion yuan/year. Through the bidding of pumped electricity and the opening of the spot market, it can be predicted that the power grid in this region can achieve complete power diversion, and the cost borne by the whole network to reduce the pumping loss is 2.807 billion yuan/year. The whole network has gained approximately 190 million yuan/year from peak-shaving auxiliary services, and 80% will be used for the deduction of capacity charge in the next cycle. It is estimated that the capacity charge expenditure can be reduced by 152 million yuan/year. It is estimated that 50% of the newly added solar power sources will lease the pumped-storage capacity at a rental price of 350 yuan/kW per year, which can reduce the capacity electricity charge by 2.014 billion yuan/year. According to the proportion of 17% of the capacity and 22% of the electricity, the cost borne by provincial grid A is reduced from 1.853 billion yuan/year to 867 million yuan/year. The specific data are shown in Table 3. It can be seen that after the operation of the spot market, the role of electricity in the facilitation is dominant, followed by capacity leasing, and the role of auxiliary services continues to decrease. The capacity price after the facilitation is only 301.83 yuan/kW per year.
Table 3.
Expected results of comprehensive guidance mechanism (mid-term).
According to the consideration of 102 and 112.9 billion kWh/year of industrial and commercial electricity in Province A in approximately 2030 and 2035, respectively, the transmission and distribution price will increase by 1.8 and 1.94 cents/kWh before the diversion, but after the bidding for the pumped-power generation and the assistance of the peak-shaving auxiliary service are jointly determined, the estimated increase in the electricity price will be 0.85 cents/kWh. The smoothing contribution of each initiative is shown in Figure 3a, Figure 3b, respectively.
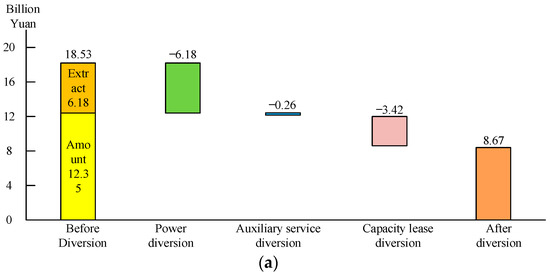
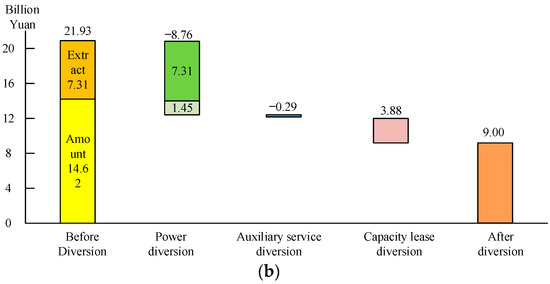
Figure 3.
Contribution forecast of diversion measures in mid-term and long-term. (a) Contribution forecast of diversion measures (mid-term); (b) contribution forecast of diversion measures (long-term).
5.4. Long-Term Diversion Strategy and Effectiveness Analysis
By 2035, if there is no diversion, the regional power grid is expected to bear 3.321 billion yuan/year of pumping loss and 8.6 billion yuan of capacity electricity charge, totaling 11.921 billion yuan/year. Based on the maturity of the spot market, it is predicted that the power grid in this region can realize profits of 3.321 billion yuan/year by reducing the pumping loss expenditure according to the profit of 0.03 yuan (including loss) per kilowatt hour of power pumped, and 80% of the profit of 1.068 billion yuan will be used for capacity electricity charge diversion on the basis of complete power diversion. The whole network gained approximately 210 million yuan/year from peak-shaving auxiliary services, 80% of which is used for the deduction of capacity charge in the next cycle, and it is estimated that the capacity charge expenditure can be reduced by 168 million yuan/year. It is estimated that 45% of the newly added solar power sources will lease the pumped-storage capacity at a rental price of 350 yuan/kW per year, which can reduce the capacity electricity charge by 2.286 billion yuan/year. According to the proportion of 17% of the capacity and 22% of the electricity, the cost borne by provincial grid A is reduced from 2.193 billion yuan/year to 900 million yuan/year. Detailed data are shown in Table 4. It can be seen that when the spot market is mature, if we compare it based on considering the consumption of pumped electricity, the role of electricity is dominant, followed by capacity leasing, and the role of auxiliary services is small. If compared based on zero pumping power loss, the facilitation of capacity leasing is dominant, followed by electricity profitability, and the role of ancillary services is still small. The capacity electricity price after facilitation is only 264.6 yuan/kW per year.
Table 4.
Expected results of comprehensive guidance mechanism (long term).
6. Conclusions
In this paper, the costs of the pumped-storage power station in the process of electricity marketization and the mathematical model under different diversion methods in various stages have been established. Through the example, the diversion effect has been analyzed. The main conclusions are as follows:
- (1)
- Before the start of the electricity spot market, bidding via pumping electricity is an effective way to divide electricity costs. However, when the electricity spot market is opened, the pumping loss of pumped storage will no longer enter the transmission and distribution price, and the profit from the price difference will also feed back the cost of diversion capacity. Therefore, the maturity of the spot market will play a critical role in promoting the diversion of pumping and storage costs.
- (2)
- Pumped-storage power plants provide capacity-leasing services to wind and solar power stations, which can not only reduce the cost of deploying energy storage for wind and solar power plants but also facilitate pumping and storage cost diversion, and it is more conducive to centralized regulation. This is a method of matching that should be encouraged. Because pumped-storage power stations have less space to participate in auxiliary regulation after capacity leasing and electricity diversion, the role of the ancillary service market is relatively small.
- (3)
- Under the combined effect of various diversion modes, the increase in the transmission and distribution prices in Province A can be controlled within 1 cent/kWh, of which the spot power market and the capacity leasing of new energy stations play a significant role.
The model proposed in this paper has certain universality. Multiple regions can apportion the cost of pumping storage through the power market, spot market, auxiliary service, special power supply capacity, etc. Different regions only differ in the spot market value, apportionment ratio, and other parameters. It is suggested that readers combine the local policy of the analyzed region and use the characteristics of energy to select appropriate parameters to calculate the cost of pumping-storage apportionment in a certain region.
Author Contributions
Investigation, project administration and funding acquisition, Y.Z.; methodology, W.Y.; conceptualization and writing—original draft preparation, Y.L. (Yi Lei); data curation, formal analysis, validation and writing—review and editing, K.J. and H.L. (Haibo Li); software, W.H.; visualization and supervision, Y.L. (Yu Lu); investigation and proofreading, H.L. (Han Li). All authors have read and agreed to the published version of the manuscript.
Funding
This project is funded by the 2022 State Grid Jilin Electric Power Co., Ltd. science and technology project “Jilin Pumped Storage Operation Mechanism and Electricity Price Drainage Strategy Research” (Project No.: SGJLJY00GPJS2200020).
Institutional Review Board Statement
Not applicable.
Informed Consent Statement
Not applicable.
Data Availability Statement
Not applicable.
Conflicts of Interest
The authors declare no conflict of interest.
References
- Zhang, Y. Research on the price policy of pumped storage under the “dual carbon” goal—Taking the Yimeng pumped storage power station project as an example. Price Theory Pract. 2021, 12, 35–37, 158. [Google Scholar]
- Zhu, Z.; Chen, K.; Xie, H.; Lin, W. Analysis of the operation strategy of a pumped storage power station under specific electricity market environment. Energy Environ. 2021, 5, 57–58. [Google Scholar]
- Huang, Y.; Liu, G.; Wen, F.; Zhong, Z.; Huang, J. Operational Mode and Benefit Analysis of Pumped Storage Power Station in Electricity Market Environment. Electr. Power Sci. Eng. 2006, 3, 56–62. [Google Scholar]
- Zhai, S. Thinking about the price model of pumped storage. Ind. Innov. 2020, 13, 38–40. [Google Scholar]
- Li, W.; Yang, H. Analysis of several capacity price calculation methods for pumped storage power stations—Taking Longwozi pumped storage power station in Dayi County Sichuan Province as an example. Sichuan Water Resour. 2022, 4, 108–109, 173. [Google Scholar]
- Li, H.; Zhou, H.; Zhou, B.; Li, G.; Yang, B. Research on a two-part electricity price of pumped storage power station in comprehensive smart energy system. Integr. Intell. Energy 2022, 7, 10–18. [Google Scholar]
- Wang, Y.; Fang, G. Joint Operation Modes and Economic Analysis of Nuclear Power and Pumped Storage Plants under Different Power Market Environments. Sustainability 2022, 14, 9128. [Google Scholar] [CrossRef]
- Dawn, S.; Gope, S.; Das, S.S.; Ustun, T.S. Social Welfare Maximization of Competitive Congested Power Market Considering Wind Farm and Pumped Hydroelectric Storage System. Electronics 2021, 10, 2611. [Google Scholar] [CrossRef]
- Kanzumba, K. Optimal operation scheduling of grid-connected PV with ground pumped hydro storage system for cost reduction in small farming activities. J. Energy Storage 2018, 16, 133–138. [Google Scholar]
- Long, J. Production cost evaluation of pumped-storage power station in the power market and optimal utilization strategy of the reservoir. Power Syst. Technol. 2004, 12, 62–65. [Google Scholar]
- Ye, Z.; Huang, S.; Wang, Y. Research on the Electricity Price Mechanism of Pumped Storage Power Stations under the Background of Electricity Market Reform. Price Theory Pract. 2021, 11, 26–29, 40. [Google Scholar]
- Yang, H.; Zhou, M.; Zhang, M.; Wu, Z.; Wu, J. Operation strategy and benefit analysis of pumped-storage power stations under the power market. J. North China Electr. Power Univ. Nat. Sci. Ed. 2021, 6, 71–80. [Google Scholar]
Disclaimer/Publisher’s Note: The statements, opinions and data contained in all publications are solely those of the individual author(s) and contributor(s) and not of MDPI and/or the editor(s). MDPI and/or the editor(s) disclaim responsibility for any injury to people or property resulting from any ideas, methods, instructions or products referred to in the content. |
© 2022 by the authors. Licensee MDPI, Basel, Switzerland. This article is an open access article distributed under the terms and conditions of the Creative Commons Attribution (CC BY) license (https://creativecommons.org/licenses/by/4.0/).