1. Introduction
The concept of sustainable development is generally accepted all over the world; especially with the increasing prevalence of green trade barriers, countries have incorporated more sustainable development demands into their economic development, and it has increasingly become the new development trend of international trade. Import and export trade occupies an important position in sustainable economic development, and good import and export trade is an important driving force for sustainable international economic development, and the best means to ensure regional economic development. The expansion of foreign markets has led to the active participation of many capitals and commodities in the world exchange, which will certainly provide a boost to the international economic development [
1]. Regional economic development affects the degree of development of foreign trade; regional economic development also promotes the development of foreign trade, and the relationship between the two is one of mutual influence. The increase in PRC’s opening up to the outside world has led to the rapid enhancement of the level of economic development of PRC and its neighboring countries and also expanded the development scale of import and export trade, driving industrial development and providing a boost to the sustainable economic development of East and Southeast Asia [
2].
With the deepening of ASEAN regional economic integration, the economic status of ASEAN in the international arena has been improved, prompting countries to cooperate more extensively with the ASEAN region, and a series of regional economic cooperation mechanisms centered on ASEAN have been established one after another—in particular, the formation and development of the cooperation mechanisms between PRC, Japan, Korea and ASEAN (10 + 3) and PRC and ASEAN (10 + 1). In addition, countries and organizations such as the United States, Japan, Australia, New Zealand and the European Union have established economic partnerships with ASEAN. Among them, the most active are the United States and Japan [
3,
4,
5]. With the extensive influence of the “Belt and Road” initiative, PRC’s economic and trade relations with ASEAN countries have become increasingly close, and the import and export trade volume has rapidly climbed; ASEAN became PRC’s largest trading partner in 2020. The Belt and Road initiative has brought new opportunities and challenges for PRC to develop trade cooperation with ASEAN [
6].
In the context of sustainable economic development, this paper will analyze the competitive and symbiotic relationship between PRC’s trade with ten ASEAN countries and the degree of trade friction based on the Lotka–Volterra model; it will also deeply analyze the main factors of changes in the import and export trade volume between PRC and ASEAN and put forward more specific and reasonable policy recommendations for the coordinated regional economic development of PRC and ASEAN in the future to promote the sustainable economic theoretical level. From the theoretical level, although there are many studies on the trade relationship between PRC and ten ASEAN countries, there are fewer explorations based on the basis of the Lotka–Volterra model. This paper is based on the ecological perspective to reveal the relationship between the two, so as to explore the trade relationship between them more comprehensively, which is a supplement to the existing studies and has some reference value for subsequent studies. On a practical level, PRC and ASEAN are important trading partners for each other, and their import and export trade as well as regional cooperation is advancing; that said, both PRC and ASEAN are emerging economies and export-oriented economies, there is consistency in goods trade products, mainly in primary products and processing manufacturing industries, and there is some competition between them, which is an obstacle to the sustainable economic development of PRC and ASEAN. This paper analyzes the relationship between PRC and ASEAN from an ecological perspective. This paper analyzes the competing relationship and degree of trade friction between PRC and the ten ASEAN countries from an ecological perspective, analyzes the relevant factors, and puts forward effective suggestions. This will accelerate the implementation of PRC’s “Belt and Road” and “Community of Destiny” initiatives and bring new development opportunities for the recovery of the global economy in the post-pandemic era.
2. Literature Review
The Lotka–Volterra model of interspecific competition, one of the theories used in ecology to study population development, is a two-dimensional logistic model growth equation developed from the one-dimensional logistic model growth equation. In 1925, Lortka introduced an important model in his study in
Elements of Physical Biology. The predator–prey interaction model quantifies the interactions between organisms [
7]. Volterra’s study in
Variazioni e fluttuazioni del numero d’individui in specie animali conviventi described the change in the number of two populations in biotic-biased relationships [
8], which laid the theoretical foundation of the interspecific competition model and also had a significant impact on the development of modern ecological competition theory. It also had a significant influence on the development of modern ecological competition theory. In the ecological environment, the relationship between biological species is intricate and complex, and for a single species, there are three possible effects on other species: inhibition, promotion, and no effect. Thus, there are multiple interactions between species populations. One of the first scholars to use the theory of population ecology in the context of enterprise clusters was Hannan and Freeman [
9], who used the entire enterprise cluster as the object of study to investigate the adaptive capacity of individuals within the cluster.
In terms of trade relations between PRC and ASEAN, Holst and Weiss (2004) [
10] concluded, through panel data analysis, that in the short term, PRC and ASEAN are in fierce competition for exports in many industries, but in the long term, as both sides continue to restructure their trade and upgrade their industries, it will change their trade situation, and in the future export market, PRC and ASEAN can play their respective parts. Tovar and Patricia (2012) [
11] argue that PRC’s economic development potential with high demand will greatly promote ASEAN’s exports to PRC after the establishment of the FTA and greatly promote the coordinated regional economic development of both sides. Kawai and Naknoi (2016) [
12], echoing T Tambunan (2006) [
13], stated that despite the establishment of the ASEAN–China FTA, countries outside the alliance are still their most important markets and trading partners for individual countries, and the increase in import and export trade volume is mainly an increase in intra-industry trade.
Ecological theory is one of the scientific foundations for humans seeking solutions to major contemporary social problems, and the application of ecological theory to socioeconomic problems began with Schumpeter’s economic evolutionary theory at the beginning of the last century and has been increasingly applied to socioeconomic problems in the last hundred years; for example, Bander and Taylor (1998) [
14] proposed a model related to the Lotka–Volterra interspecific competition model related to the general equilibrium model of renewable resources and population dynamics, which analyzes the development process of social civilization. The field of economic activity of human society also belongs to an ecosystem because of its ecological characteristics such as ecosystem wholeness and competition, so the development of economic society also follows the basic development laws of social systems. Lansiti and Levien (2004) [
15] also elaborate on the concept of a business ecosystem in social economy by analogy with the concept of the ecosystem in ecology, and they argue that the concept of a business ecosystem in the social economy is very similar to the concept of the ecosystem in ecology. However, the literature on the introduction of the Lotka–Volterra interspecies competition model to international intertrade relations is limited.
Based on the research of domestic and foreign scholars, it can be seen that the trade development between countries is more similar to the evolutionary development of populations in “ecosystems”. The evolution of trade development between countries and the evolution of biological populations have the following common features: first, similar to the importance of the natural environment for biological populations, the trade environment is equally important for trade populations. Neoclassical theory suggests that the endowment environment, which includes the level of economic development, trade policies, geography, and resource supply, is crucial to the evolution of trade relationships. Second, trade populations, like biological populations, have the ability to continuously adapt and change their environment. The endogenous growth theory and the new growth theory argue that the improvement of the endowment environment including the development of science and technology and the upgrading of industrial structure on both sides of trade is not only an important driving force for their own economic growth but also an important manifestation of their own economic growth. Third, trade populations, like biological populations, are affected by the laws of reproduction and mortality. Marginal industry expansion theory suggests that the scale of trade between the two sides is influenced by the environmental situation of their own endowments, in addition to the development of related industries in both countries. Fourth, different populations in similar identical environments have heterogeneous relationships such as predator–prey, competition, and mutually beneficial symbiosis. Countries with different trading stocks also have different degrees of competing relationships in the international market, and some countries take the initiative to use such relationships to shape and strengthen the local endowment environment. Fifth, similar to biological populations, the development of trade populations is also influenced by a dual role. The development of a country’s import and export trade is influenced by both internal factor endowments and external international environment.
Although the studies of related scholars at home and abroad have provided a great deal of academic support for this paper, analyzing the trade relationship between PRC and ASEAN from different perspectives and the impact of different trade factors on the trade between the two sides, there is still room for further in-depth research and analysis in this paper. Referring to the previous literature on economic and social issues, the Lotka–Volterra interspecies competition model has rarely been introduced to study issues related to the relationship between countries, so this paper constructs the Lotka–Volterra interspecies competition model from the perspective of population evolution to assess the trade relationship between PRC and ten ASEAN countries, analyzes the impact of different conditions on the trade relationship, and proposes development strategies to further improve the regional economic coordination between PRC and the ten ASEAN countries to promote the sustainable development of both economies.
3. Methodology
3.1. Overview of Bilateral Trade between PRC and Ten ASEAN Countries
- (1)
General situation of trade between PRC and the ten ASEAN countries
Overall, Brunei’s total trade volume is the lowest among the eleven countries. Before 2017, its total trade volume was less than USD 10 billion, and only USD 2.51 billion in 2009. The total trade volume of Brunei, Cambodia, and Vietnam is also at a low level among the ten ASEAN countries, and the total trade volume in ten years is no more than USD 100 billion. Singapore’s total trade volume is at the highest level in ASEAN, exceeding USD 800 billion between 2011 and 2014. The total trade volume of PRC far exceeds that of the ten ASEAN countries, reaching USD 445.481 billion in 2018. It can be found that from 2009 to 2019, the total trade volume of ASEAN nations and PRC showed an overall upward trend, and the rate of rise in trade volume of each country was different. The growth in trade volume of Cambodia, Laos, and Vietnam is relatively high, exceeding 15%, ranking the top three ASEAN countries, up to 17%, 16.4%, and 15.3%, respectively. The high growth rate of the trade rise of the three nations shows that the economic development of the three nations is more and more dependent on foreign markets, and this orientation will also bring benefits to their trading partners. The trade volume of Brunei and Malaysia has been relatively stable in the past decades, both below 3%, and the annual growth rate of trade has been at a low level of 2.6% and 2.8%. China and the Philippines have similar annual growth rates, 8.1% and 8%, respectively, which are at the middle level among the eleven countries. The AARG of Indonesia and Thailand is also similar, with a gap of only 0.2% (
Table 1 and
Table 2):
In terms of nations, calculated by the total import and export volume of goods trade with PRC, the 10 ASEAN countries ranked Malaysia, Vietnam, Singapore, Thailand, Indonesia, the Philippines, Myanmar, Cambodia, Laos, and Brunei in terms of trade volume with PRC in 2015. Among them, Malaysia and Vietnam have the largest trade volume with PRC, USD 972.9 trillion and USD 959.7 trillion, respectively, both exceeding USD 900 trillion. However, the total import and export trade between Cambodia, Laos, and Brunei and China lags far behind the total trade between other ASEAN countries and PRC, which is less than USD 50 trillion. Although the trade volume between Myanmar and China exceeds USD 100 trillion, it is relatively small compared with the trade volume between the Philippines and China. Therefore, although most ASEAN countries have close trade with China and the trade volume is large, there are still a few countries that have a low trade volume of goods with China [
16]. We should further analyze the reasons to promote further trade and development between PRC and these countries (
Table 3).
- (2)
China’s position in the ASEAN international trade country (region) structure
At present, PRC has become a vital trade partner of ASEAN [
17]. On the whole, the main trade objects of the ten ASEAN countries are PRC, the European Union, the United States, Hong Kong, Japan, China, and South Korea, which are concentrated in the United States, Europe, and East Asia [
18]. The exports to these six economies account for 53.10% of ASEAN’s total exports, and their export concentration is significantly lower than China. In addition, ASEAN neighboring countries or regions, such as India, Taiwan, China, and Australia, are also among the top ten export targets. The main import sources of ASEAN are China, Japan, the European Union, the United States, South Korea, and Taiwan, which are also concentrated in the United States, Europe, and East Asia. The imports from these six economies account for 60.17% of ASEAN’s total imports. Other major import sources are distributed in the Middle East and its surrounding areas.
Therefore, China, as an important trade partner of ASEAN, can contribute to the economic development of ASEAN countries through trade, especially for Vietnam, Cambodia, Laos, and other countries with rapid economic development [
19] (
Table 4 and
Table 5).
- (3)
Types of import and export products of China and ASEAN countries
It is clear from the above data that the most important import and export goods of PRC and ASEAN countries are manufactured products, accounting for more than 50% of their respective imports and exports. The proportion of manufactured products in PRC’s exports is the highest, up to 92.87%. The percentage of fuel, minerals, and metals in ASEAN’s exports is much higher than that of China, indicating that ASEAN’s exports are more dependent on natural resources [
20]. From the perspective of specific countries, the types of major import and export products of ASEAN countries are quite different. In terms of exports, Laos has the highest proportion of agricultural raw materials in exports, accounting for 10.8% of its total exports, while Brunei and Singapore have almost no agricultural exports. In the field of food, the export proportion of Indonesia and Myanmar reached 20.3% and 24.22%, respectively, higher than the average level of ASEAN, while Brunei had almost no food exports. The differences among countries in the field of fuel exports are even greater. Brunei’s fuel exports account for 91.09% of its total exports, while the Philippines, Thailand, and other countries’ fuel exports account for less than 5%. In the field of minerals and metals, the export proportion of Laos, Indonesia, the Philippines, and Malaysia is in the forefront of ASEAN, while that of Brunei, Cambodia, Vietnam, and Myanmar is very low. This is obviously related to the distribution of natural resources in different ASEAN countries. In the field of manufactured goods, both PRC and Cambodia account for more than 90% of their exports, indicating that these two countries are most dependent on manufactured goods exports, while Brunei and Laos are the least dependent on manufactured goods exports. In terms of imports, in the field of agricultural raw materials, the proportion of imports by all countries is not high, and they can basically achieve self-sufficiency. The largest imports are China and Indonesia, but they are less than 4%. In the food sector, Myanmar, the Philippines, and Indonesia account for more than 10% of food imports, indicating that these three countries are more dependent on imported food than other countries. In the field of fuel, Brunei and Singapore have the highest dependence on fuel imports, reaching more than 20%, followed by Indonesia, Thailand, and China, with Vietnam having the lowest dependence on fuel imports: only 6.13%. In the field of minerals and metals, China has the highest proportion of imports, while the 10 ASEAN countries have fewer imports of minerals and metals. Except Malaysia, the imports of other ASEAN countries are less than 5%. In the field of manufactured goods, all countries rely more than 50% on manufactured goods, especially Cambodia, which is as high as 77.32%. Relatively speaking, China has the lowest dependence on imports of manufactured goods.
3.2. Index Selection and Data Source
This paper uses the grey estimation method [
21] to analyze the model. The grey estimation method has lower requirements for the number of indicators, and only one indicator is needed for parameter estimation [
22]. In the relevant literature, many scholars regard the total import and export volume of goods trade as a vital factor to study a country’s trade level. Therefore, this paper selects the total import and export volume of goods trade of a country from 2000 to 2019 as the measurement indicator. The data of the total imports and exports of goods trade of a country is derived from the World Bank database.
3.3. Model Building
Firstly, the logistic model, which was first used to study the evolution of biological populations, is introduced into the study of bilateral trade evolution. A single population trade evolution model was established, using the method of (Zhao Xu, Gao Suhong, etc., 2008) for reference:
X (t) is the total volume of goods import and export of country x to the world in year
t;
r is the growth rate of the total trade of goods; N is the maximum import and export volume of goods in country
x determined by the environment;
() is the ratio of the existing import and export scale of goods in country x to the potential maximum import and export scale of goods,
indicates the relative trade gap between imports and exports of goods, which reflects the blocking effect of the current import and export scale of goods in country x on the growth of the future import and export scale of goods. Its general form is:
is the inflection point of the evolution trend of import and export trade,
control the rate of rise in trade. Then, the idea is further expanded to reflect the evolution of two species of bilateral trade relations between PRC and the ten ASEAN nations, and the Lotka–Volterra model is established for the evolution of two species:
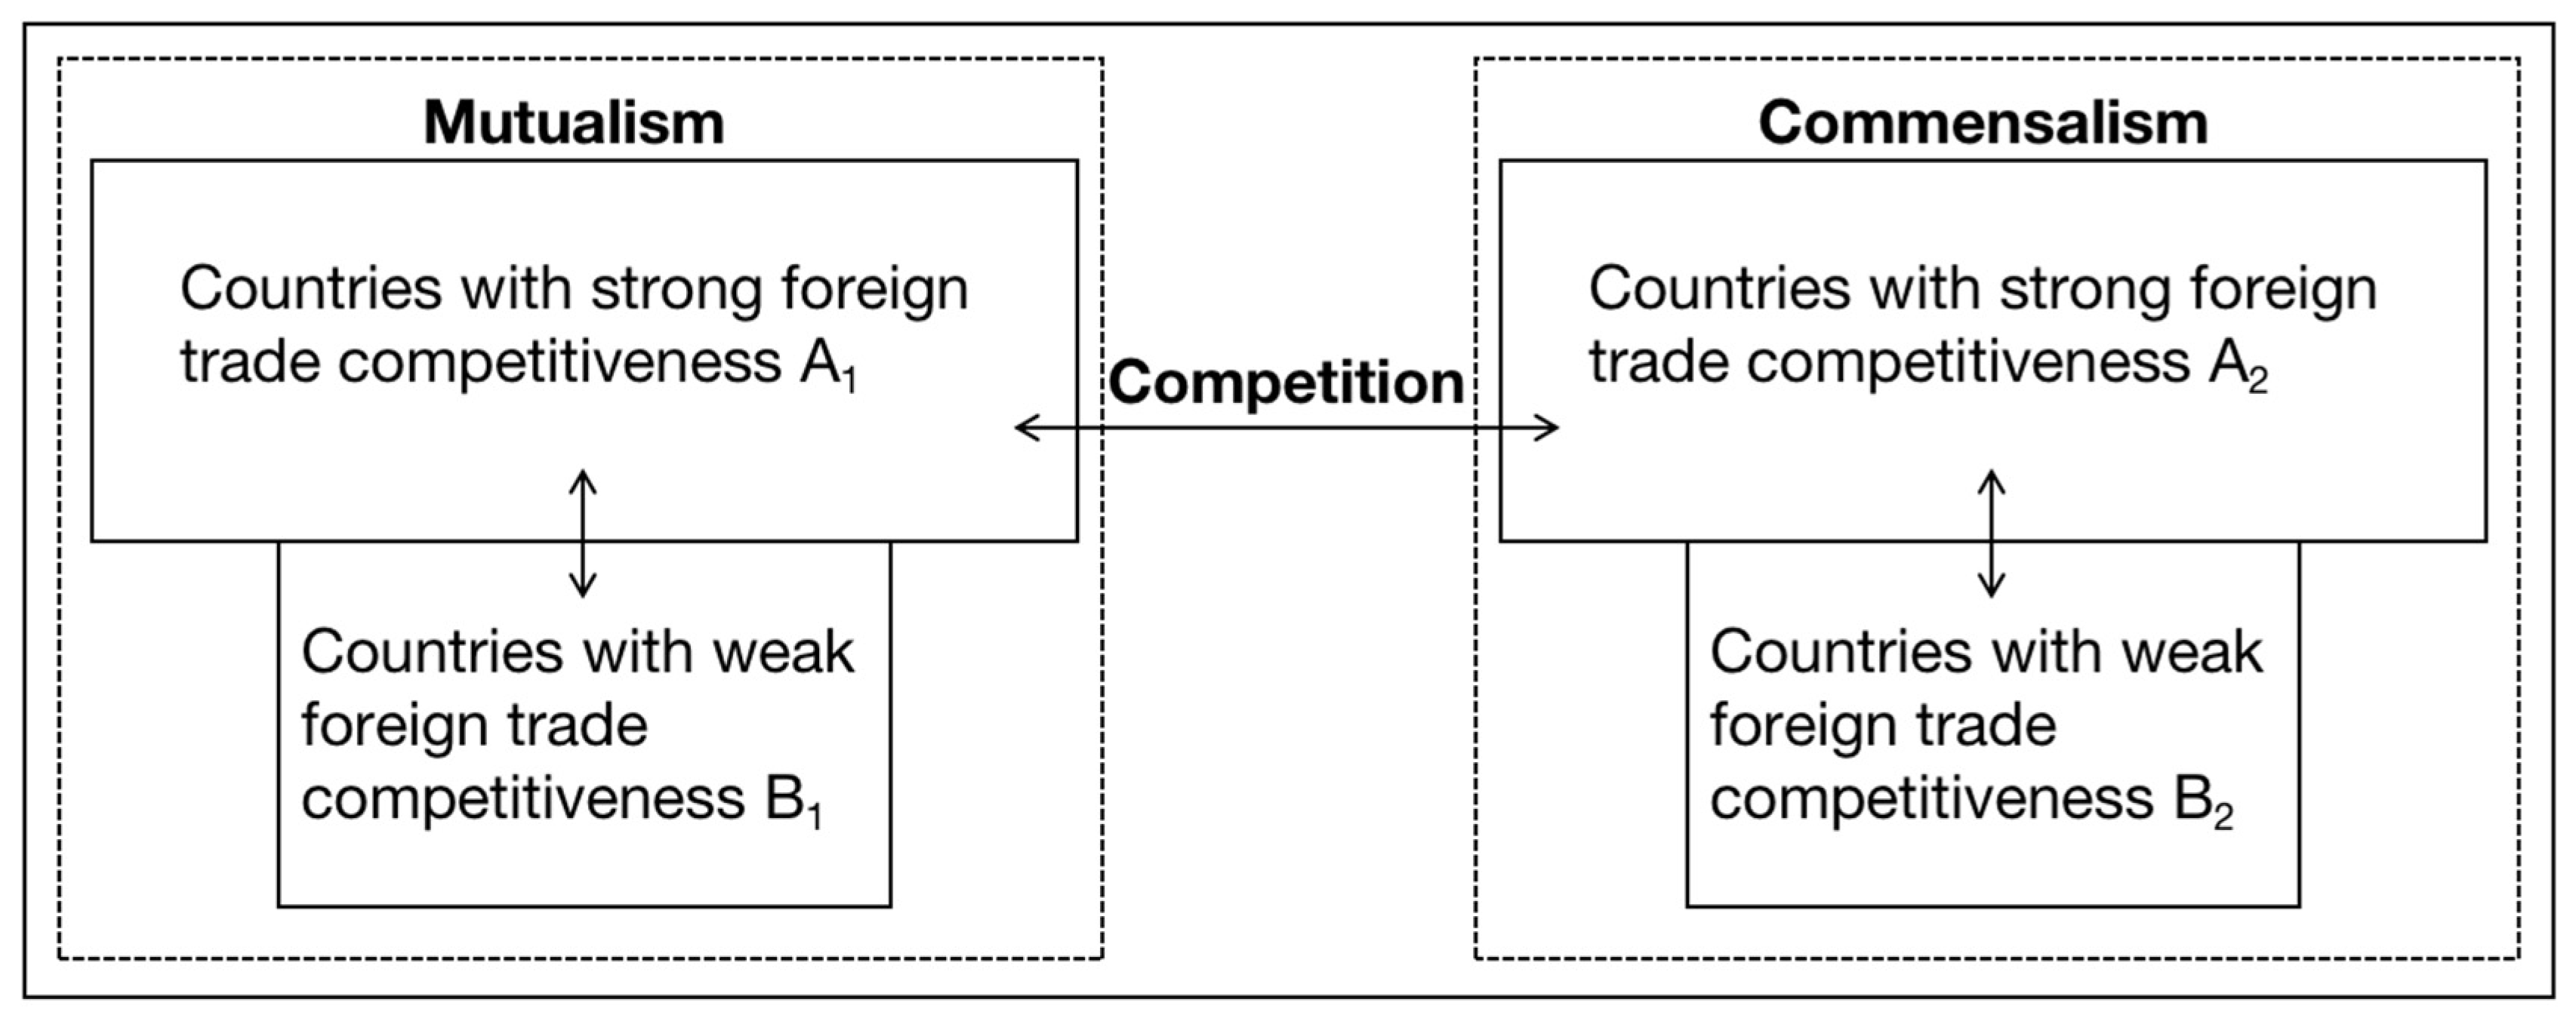
Among them, and are the population evolution impact coefficients of bilateral trade relations, which, respectively, represent the impact of the scale growth saturation of country B’s goods imports and exports on the scale growth of country A’s goods imports and exports, and the impact of the scale growth saturation of country A’s goods imports and exports on the scale growth of country B’s goods imports and exports. If > 0, it means that country B has a role in boosting the increase in country A’s import and export of goods; if < 0, it means that country B has a retarding influence on the growth of country A’s import and export scale. Similarly, > 0 and < 0, respectively, indicate that country B can promote and retard the growth of country A. According to the symbols, we can judge the type of interaction between competing species. The following uses mathematical symbols to define various action relationships.
- ①
Positive influence. There is a positive relationship between the scale of imports and exports of goods. When the scale of imports and exports of goods in country A increases, the scale of country B also increases. When the scale of imports and exports of goods in country A decreases, the scale of country B also decreases, then A(+) → B.
- ②
Negative influence. There is a negative relationship between the scale of import and export of goods. When the scale of import and export of goods in country A increases, the scale of country B decreases. When the scale of import and export of goods in country A decreases, the scale of country A increases, then A(−) → B.
* Competition. When A(−) → B, and B(−) → A, the relationship between country A and country B is competitive.
* Commensalism. When A(−) → B, and B(+) → A, the relationship between country A and country B is biased.
* Mutualism. When A(+) → B, and B(+) → A, the relationship between country A and country B is mutually beneficial (
Figure 1).
What needs to be further indicated is that, since the state of competition and cooperation shown in the bilateral trade relations between PRC and neighboring countries in this paper is based on the empirical results in the above model (3), this relationship is based on the perspective of ecosystem evolution. Although the indicator used in the model is the total import and export trade, the trade relations in this paper do not refer to the impact on the national trade volume. What this trade relationship shows is that in the trade ecosystem formed by China and the ten ASEAN countries, there is a symbiotic or competitive relationship between the two sides from the perspective of biological populations, which represents the possibility of trade frictions between PRC and the ten ASEAN countries. The specific friction degree is shown in the table (
Table 6).
3.4. Equilibrium Point and Stability Analysis
- (1)
Balance point analysis
To study the evolution results of country 1 and country 2, that is, the trend of x (t) and y (t) when t → +∞, it is only necessary to analyze the equilibrium point of Equation (3) and its stability, and the equilibrium point of stability strength can represent the competition results of the two ports.
The four equilibrium points are:.
The balance state of the four balance points were analyzed. E1 means that country 1 has an absolute advantage in the competition, has obtained all market shares, and made country 2 withdraw from the market; E2 means that country 2 has an absolute advantage in the competition, and has sold all the market shares, making country 1 withdraw from the market; E4 means that the two countries are over competitive, and the final import and export scale of goods becomes zero; this indicates that country 1 and country 2 have reached a balanced state in the evolutionary interaction process. The state of E1, E2 and E4 is not conducive to the development of conscience between countries’ bilateral trade, so this paper only studies the evolution process of bilateral trade between countries under the state of E3.
- (2)
Stability analysis of equilibrium point
According to the judgment conditions of equilibrium point stability,
. Among them, A is the coefficient matrix:
According to Equation (5), the stability conditions of E
3 can be obtained as shown in
Table 7:
3.5. Regression Results
Considering the model form of differential equation and the nature of grey estimation, based on the mapping relationship between grey derivative and even logarithm, this paper slightly modifies model (3) and uses grey estimation method to estimate its parameters. The details are as follows:
Based on the mapping relationship between grey derivative and even reciprocal, the following relationship can be obtained:
The matrix equation can be obtained by introducing the data when t = 1, 2..... n:
Using the least squares criterion, we can obtain, Similarly, .
Taking the trade relationship between China and Myanmar as an example, on the basis of the above model derivation and deformation, the model of Equation (6) is established with the total import and export volume of goods between China and Myanmar as the object to conduct an empirical analysis of the competition and cooperation relationship between China and Myanmar [
23,
24]. According to the assumptions set up in the previous model, the sample interval we studied is the total volume of goods import and export between China and Myanmar from 2000 to 2019. First, we will bring the collected data into (8), calculate the values of vectors
and
through Matlab software, and the software processing results are shown in the
Table 8 and
Table 9:
It can be seen from the table that
= [0.41, −0.00, 0.00]
= [0.24, −0.00, 0.00], and then the value in
is brought into the model
to obtain the growth rate
of the target country’s import and export to China and the largest import and export scale N
1 of China’s goods. Similarly, the value of
is brought into the model to obtain the growth rate
of China’s import and export to the target country and the largest import and export scale N
2 of China’s goods. Finally, we can calculate the evolution impact coefficient
of the target country’s import and export trade to China and the evolution impact coefficient
of China’s import and export trade to the target country. The calculation results are shown in
Table 10:
Take the calculation result into Equation (6) to obtain Equation (9)
Similarly, we bring the total import and export volume of goods between China and ASEAN countries from 2000 to 2019 into the model, and the specific empirical results are shown in
Table 11.
The empirical results calculated in
Table 11 are introduced into Equation (6), and the trend fitting and prediction of each country are carried out by using MATLAB software programming. The change trend of the total import and export goods of each country in the 35 years from 2000 to 2034 is predicted. The results are shown in
Figure 2:
Note: From the top left to the bottom right are the Brunei, Indonesia, Indonesia, Cambodia, Laos, Myanmar, Malaysia, Philippines, Singapore, Thailand, Vietnam, ASEAN.
4. Results and Discussion
First of all, it can be seen from
Figure 2 that the total volume of imports and exports of PRC and the ten ASEAN countries is rising, but the rising trend is slightly different. Among them, Cambodia, the Philippines, and Vietnam are still on the rise and will continue to rise in the future. The growth trends of Indonesia, Laos, Myanmar, Malaysia, Singapore, and Thailand are similar. They all grow fast in the early stage but tend to be stable after reaching a stable point. Indonesia and Thailand reached a stable point in 2010 and 2015, and Laos, Myanmar, Malaysia, and Singapore reached a stable point in 2018. Brunei showed a downward trend after reaching a stable point in 2010, and then stabilized. It can be seen from the fitting forecast chart of PRC and ASEAN that the total amount of import and export goods of ASEAN is higher than that of China. Both sides have risen rapidly in the first 15 years, and the trend tends to be stable after reaching a stable point.
From the calculation results in
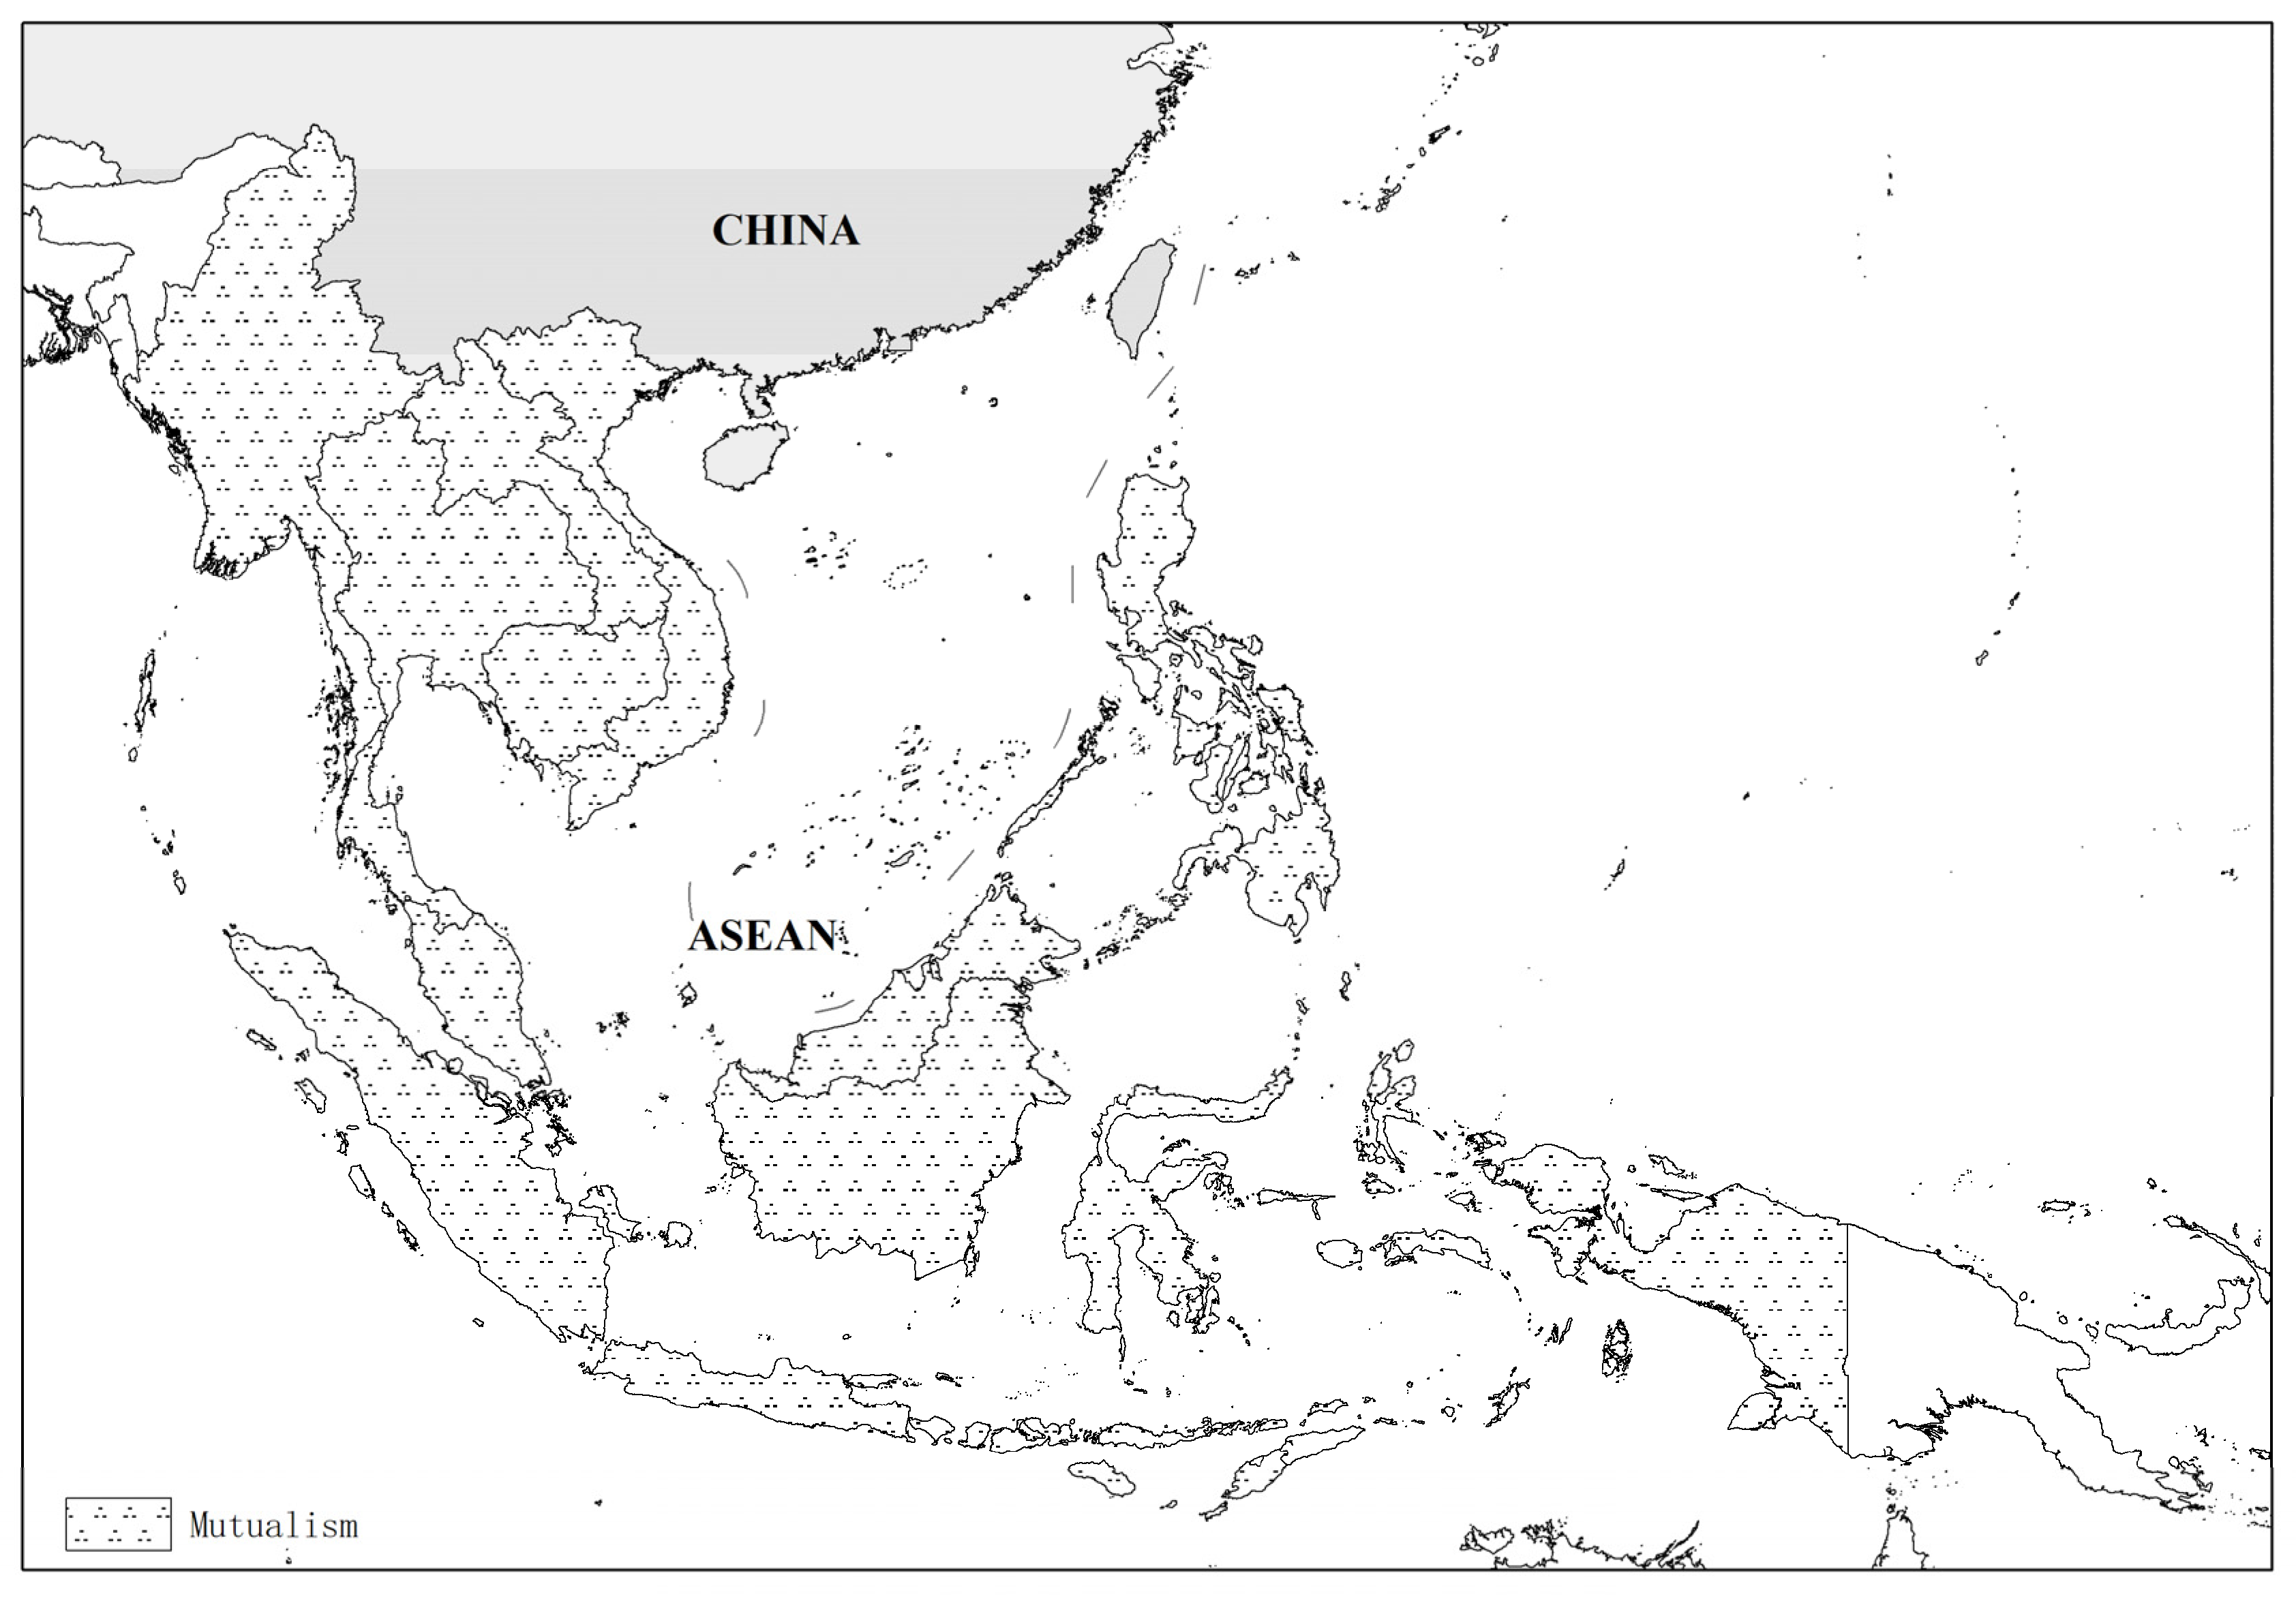
Table 12, it can be concluded that the trade relations between PRC and the ten ASEAN countries all conform to the evolution law of the Lotka–Volterra model. Among them, the trade relations between Brunei and Vietnam and China are competitive; the trade relations between Indonesia, Cambodia, Malaysia, and Singapore and China are biased; the trade relations between Laos, Myanmar, the Philippines, and Thailand and China are mutually beneficial. The trade relationship between ASEAN and PRC is also a mutually beneficial symbiotic relationship, which shows that among the ten ASEAN countries, there are trade frictions with China to some extent, but the degree of trade frictions with China is very low. On the whole, the trade relationship between PRC and most ASEAN countries is positive, which can promote the sustainable economic development of both sides.
Secondly, we will further analyze the different types of trade competition and cooperation between PRC and the ten ASEAN countries:
First, in the trade competition and cooperation relationship between PRC and the ten ASEAN countries, we can see that China’s evolutionary growth coefficient for Brunei is -0.22, which means that China has a negative effect on Brunei and Brunei’s evolutionary growth coefficient for China is −0.26, which means that Brunei has a negative effect on China. That is to say, the trade relationship between China and Brunei is a competitive relationship, and there is a high possibility of trade friction. The evolutionary growth coefficients between China and Vietnam are also negative, indicating that the trade relationship between China and Vietnam is also a competitive relationship, and the possibility of trade friction is high.
Although the Lotka–Volterra model shows that the trade between China and Brunei is competitive, because Brunei is a special country, with an area of 5756 square kilometers, a population of about 350,000, a per capita GDP of USD 37,100, and a small population, Brunei is one of the richest countries in the world. Brunei’s foreign trade product structure is singular, mainly relying on oil and natural gas exports. Oil and gas products have high foreign exchange earning capacity and a high income level [
25]. Since the data used in this paper are the total import and export of goods, which is calculated in current dollars, there will be some deviation in the calculation. Based on the above trade situation between PRC and ASEAN, it can be seen that the competitiveness between China and Brunei is not obvious. China and Vietnam have a competitive trade relationship, mainly because Vietnam’s exports of light industrial products have grown rapidly since 2003. Readymade clothing, footwear, aquatic products, etc., are Vietnam’s main export products, especially textiles and readymade clothing products. The export of consumer markets for major products such as the United States has grown rapidly. Light industrial products have always been China’s bulk export products. The textiles and footwear of China and Vietnam compete with each other in the markets of developed countries. With the deepening of Vietnam’s industrialization, the competition will become more intense, and the possibility of trade friction is high, which is not conducive to their future economic development in the long run [
26].
Second, Cambodia, Malaysia, and Singapore have negative evolutionary growth coefficients for China, while China’s evolutionary growth coefficients for these three countries are positive. That is, China has a favorable relationship with these three countries in terms of trade competition and cooperation. China has relatively benefited from this, and the degree of trade friction is relatively low.
China is in a position of trade surplus with Cambodia and Singapore. For China, the high trade surplus puts it in a favorable position in trade with these two countries [
27]. Compared with China, Cambodia and Singapore enjoy low economic growth effects brought by trade growth. Secondly, Cambodia and Malaysia are both developing countries. Most of the products exported to China belong to natural resources, which are low in value, low in profitability, and have less foreign exchange. Instead, they import a large number of technology intensive products and daily necessities from China, and lose a lot of foreign exchange, which is not conducive to their future economic development in the long run [
28].
Third, Indonesia’s evolutionary growth coefficient for China is positive, while China’s evolutionary growth coefficient for Indonesia is negative. That is, the trade competition and cooperation relationship between PRC and these two countries is beneficial to Indonesia, and Indonesia has relatively benefited from it with a low degree of trade friction.
Although Indonesia is in a deficit position in the trade between China and Indonesia [
29,
30], Indonesia’s domestic low value-added and low manufacturing industry has developed rapidly in recent years with low production costs and the formation of economies of scale. Although the production of these products requires a large amount of raw and auxiliary materials imported from China, resulting in a trade deficit, the export of these products to consumer markets in Europe, the United States, and other products will bring Indonesia a large amount of foreign exchange growth [
31,
32]. In the long run, this is conducive to the economic development of Indonesia.
Fourth, the evolutionary growth coefficient of Laos, Myanmar, the Philippines, and Thailand for China is positive, and the evolutionary growth coefficient of China for these four countries is also positive. That is, the trade competition and cooperation between China and these four countries are mutually beneficial and symbiotic, with the lowest degree of trade friction.
First of all, from the trade between Laos and China, since 2013, China’s primary products exported to Laos are machinery and equipment and some light industrial products [
33]. China also needs large amounts of agricultural products and mineral resources in Laos. As the largest economic and trade partner of Laos, China has been helping Laos’ economic development for many consecutive years. At the same time, Laos has also been an indispensable trade partner of China in the ASEAN region for many consecutive years. The economic and trade exchanges between China and Laos have maintained stable development [
34]. Secondly, the mutually beneficial symbiotic relationship between Myanmar and China is also significant. Myanmar has rich natural resources, such as precious stones, non-metallic mineral resources and wood and other fuel resources. China needs to import these rare resources from Myanmar, making up a significant proportion in the import of primary products. The industrial manufactured products exported to Myanmar are labor intensive and technology and capital intensive, and the two sides are highly complementary [
35]. From the perspective of the trade between Thailand and China, a large number of Chinese goods have flocked to the Thai market, which is welcomed by Thai consumers because of its good quality and low price. In addition, China’s hydropower, toys, machine tools, traditional Chinese medicine, and traditional Chinese medicine have good prospects in Thailand. Thailand’s tropical agricultural products, such as semiconductor auto parts and rubber, also have broad prospects in China. The rapid development of bilateral trade between China and the Philippines proves the complementarity of bilateral trade [
36]. At present, China’s fruit processing enterprises, pharmaceutical enterprises, and power equipment enterprises have broad prospects in the Philippines. The Philippines is rich in copper, aluminum, nickel, gold, silver, and other mineral resources and has advantages in some high-tech fields such as semiconductors [
37]. It can be seen that the continuous trade between China and these four countries is conducive to the sustainable economic development of both sides.
Fifth, the evolutionary growth coefficients of ASEAN as a whole and China are both positive, that is, the trade competition and cooperation between PRC and ASEAN are mutually beneficial and symbiotic, with the lowest degree of trade friction.
PRC and ASEAN are geographically close neighbors. They have many similarities or similarities in economic development trajectory, history, and culture. Both sides have greater advantages in economic cooperation and trade complementarity. Over the past ten years, driven by the negotiation and construction of China ASEAN Free Trade Area, the bilateral trade volume between PRC and ASEAN has grown rapidly [
38]. In 2021, PRC and ASEAN will become the largest trading partner of each other for the first time, which also provides a strong guarantee for the sustainable development of the regional economy. Secondly, since the “Belt and Road” initiative was put forward, the trade scale between PRC and ASEAN has gradually expanded, the structure has been constantly optimized, the bilateral trade balance has become increasingly high, and the trade surplus has further narrowed. In 2021, the growth rate of China’s imports from ASEAN has exceeded the growth rate of China’s exports to ASEAN. It is not difficult to find that the trade cooperation between PRC and ASEAN is very beneficial to both sides and can effectively promote the sustainable economic development of both sides [
39] (
Figure 3 and
Figure 4).


