Abstract
Working condition diagnosis is an important means of evaluating the operating state of rod pumping systems. As the data source of working condition diagnosis, the quality of indicator diagrams will have a significant impact on the diagnosis results. In the actual oil field production process, the number of samples between indicator types is usually unbalanced, so it is an important means to improve the diagnostic accuracy by using data augmentation methods. However, traditional data augmentation methods require manual design, and the experimental results are not satisfactory. We propose an automatic data augmentation method based on teacher knowledge for working condition diagnosis of rod pumping systems. This method adopts an adversarial strategy for data augmentation and optimization and uses the teacher model as prior knowledge to generate information-rich transformation images for the model, thereby improving the generalization of the working condition diagnosis model. Specifically, our method makes the augmented images adversarial to the target model and recognizable to the teacher model. Compared with traditional methods, this method can automatically select the correct data enhancement method according to different indicator diagram sample sets to solve the corresponding problems. Our method has an accuracy of more than 98% in the diagnosis of actual oil field operating conditions. The experiment showed that the accuracy of this method was more than 5% higher than that of the traditional data augmentation methods in the task of condition diagnosis, which shows that this method has research and development value.
1. Introduction
Data augmentation is mainly used to prevent overfitting when the dataset is small. When training a machine learning model, all you really have to do is tune the parameters so that it maps the inputs (such as images) to outputs (such as labels). Our optimization goal is to pursue the sweet spot where the model loss is low, which happens when the parameters are tuned in the right way [1]. Obviously, if there are many parameters, the model needs to be given a sufficient proportion of samples. At present, the main types of indicator diagrams are divided into the following six types: (1) The influence of gas and liquid inability to fill on the indicator diagram; (2) The influence of leakage on the indicator diagram includes leakage in the discharge part and leakage in the suction part; (3) The plunger is stuck; (4) The indicator diagram with a blowout well; (5) The sucker rod breaks off; and (6) Other situations including oil well waxing and sand production. For the working condition diagnosis of the rod pumping system, multi-category faults mean multi-classification tasks, which require a large number of indicator diagrams to support. However, the number of failures of pumping units in the actual oil field is relatively small, resulting in an obvious shortage of samples of failure types, and the model classification effect is not good [2].
In order to prevent the problem of model overfitting, data augmentation technology came into being. Traditional data augmentation methods are designed and implemented manually such as random rotation, random cropping, horizontal and vertical flipping, color dithering, Gaussian noise, etc. [3]. Different data augmentation methods are suitable for different datasets, but the traditional methods of manual design do not take this problem into account, making the augmentation effect of the model unstable. This paper aimed to automatically find an efficient data augmentation strategy for indicator diagram datasets. Therefore, we propose a data augmentation optimization method based on teacher knowledge, which can automatically find a data enhancement method suitable for the task of the diagnosis of the working condition. Through teacher knowledge, the target model can acquire the prior and hyperparameter settings, and the enhanced images will not lose their inherent information, thereby improving the expressiveness and generalization of the model itself. In addition, this paper produced an indicator diagram sample dataset according to the “cifar10” dataset format [4], and used a data-augmented neural network to narrow the search space to ensure convergence.
Aiming at the problem of the insufficient number of indicator diagram samples and an imbalance between classes, common solutions can be divided into two categories: increasing the number of samples and selecting new methods. In terms of new methods, emerging machine learning methods provide novel models for working condition diagnosis. Zhang and Gao [5] adopted the transfer subspace method in transfer learning and used the transformation matrix to realize the transformation of dynamometer knowledge among multiple oil wells. Zhou et al. [6] proposed a Kalman filter radial basis function method based on the adaptive noise factor for the working condition diagnosis of rod pump systems. The model used the UKF algorithm to optimize the parameters of neural network weights, center, and width. Cheng, Yu, Zeng, Osipov, Li, and Vyatkin [2] obtained the features of the indicator map through the extraction extractor of AlexNet, and used SVM for the classification of working conditions. Zhang et al. [7] proposed the use of the meta-transfer learning method to solve the problem of the diagnosis of small sample conditions, and achieve the efficient classification of indicator diagrams through knowledge transfer and hyperparameter optimization.
A novel approach to continuously learn the data augmentation strategies from data is AutoAugment (automatic augmentation) [8]. It initially uses reinforcement learning to select sequences of operations and their application probabilities and magnitudes. Studies [9,10] have shown that automatic augmentation can significantly reduce the search cost, but parameter optimization is more complicated. For working condition diagnosis, in order to alleviate the problem of parameter adjustment, we propose an online data augmentation optimization method using teacher knowledge. AutoAugment searches for the best enhancement strategy directly on the dataset of interest. This method is also based on an adversarial data augmentation strategy, but it searches for augmentation within the range where the teacher model can recognize transformed images.
The contributions of this paper are summarized as follows. We propose an automatic data augmentation method based on teacher knowledge to solve the problem of insufficient samples for the working condition diagnosis of rod pumping systems. With the teacher model, the transformed images can avoid losing their inherent meaning and also make the adversarial enhancement more informative without the need to manually adjust the parameters. In this paper, a standard indicator diagrams dataset was constructed according to the “cifar10” dataset format for the application of the working condition diagnosis model. This dataset construction method can be used for actual oil field database management to provide support for subsequent analysis and processing. A neural network was proposed for the data augmentation of indicator diagrams, which can perform gradient descent to update parameters and simplify the design of the search space.
The rest of this paper is structured as follows. In Section 2, the related algorithms for automatic data augmentation and teacher knowledge are introduced to facilitate the understanding of the entire algorithm model. In Section 3, a teacher-knowledge-based automatic data augmentation model for operating condition diagnosis is proposed, and the parameters and structural details are introduced. Section 4 applies this method to the experiment of the actual indicator diagrams dataset, and explains the experimental design, experimental results, and comparative experimental analysis. In Section 5, the advantages and disadvantages of this method and future prospects are discussed. Section 6 presents our conclusions.
2. Materials and Methods
There are many algorithms related to data augmentation. Some of these machine learning methods use traditional data augmentation, which is continuously improved as the technology develops. Obviously, data augmentation techniques play an important role in the training process of deep vision models. Sato et al. [11] discussed the problem of optimal decision rules for a classifier of a data augmentation method. They employed elastic deformation methods across scales, locations, and orientations on the MNIST dataset. Zagoruyko and Komodakis [12] used an augmentation method of the horizontal flipping of images and random cropping for classification and detection models. The previous method increased the data while keeping the data distributed in the training set, but the opposite operation could also effectively increase the generalization. Some methods improve validation accuracy and model robustness by randomly erasing or adding noise. Mixup is a particularly effective augmentation method for the imagenet dataset, where the network model is trained on images and their corresponding labels [13]. Cropping centered on the object in the image is usually used for object detection tasks. In addition to implementing single operations for data augmentation, researchers have also explored the optimal strategies for combining multiple operations. Devries and Taylor [14] took a domain-agnostic approach to dataset augmentation with the main insight that the transformation was not performed in the input space, but in the learned feature space. Tran et al. [15] provided a new Bayesian formulation for data augmentation, where new annotated training points were treated as missing variables and generated according to the distribution learned from the training set. Ratner et al. [16] proposed a method to learn a generative sequence model on a user-specified transformation function by using a generative adversarial approach for selecting the optimal sequence for data augmentation operations. The analysis results of various methods are shown in Table 1.

Table 1.
Comparison between the traditional data augmentation methods and our method.
In order to facilitate the understanding of automatic data augmentation technology and teacher knowledge, the relevant algorithms are explained from three aspects, which can also deepen the mastery of the combination of working condition diagnosis and data augmentation.
2.1. Automatic Data Augmentation
Data augmentation [17,18,19] is an effective technique to improve the accuracy of modern image classifiers. Previous data augmentation methods corresponding to each dataset were manually designed, but there have been few studies on which data augmentation strategies should be used for each dataset. Automatic data augmentation technology is an automatic search and improved data augmentation strategy, which uses reinforcement learning to find the corresponding strategy for each dataset. This paper introduced an automatic method to find data augmentation policies from data. Our approach was inspired by the latest progress in architecture search, where reinforcement learning and evolutionary algorithms have been used to discover model architectures from data. Here, the enhancement strategy refers to multiple sub-strategies to form a complete strategy. The sub-policy consists of several augmentation operations, where each operation consists of two parameters: probability and magnitude, which are the probability of using the operation and the magnitude of the operation, respectively.
This method consists of two parts: the search algorithm and the search space. The policy in the search space consists of many sub-policies, one of which is randomly selected for each image in each batch. The sub-policy consists of two operations, each of which is an image processing function such as translation, rotation, or shearing, and the probability and magnitude at which these operations are taken. We used a search algorithm to find the best strategy so that the neural network produced the highest validation accuracy on the target dataset. Search space details: In the search space, a policy consists of five sub-policies, each consisting of two image operations to be applied in sequence. Additionally, each operation is also associated with two hyperparameters: (1) The probability of applying the operation; (2) the magnitude of the operation. The main body of the search algorithm is reinforcement learning, which consists of two parts: the controller and the training algorithm. The controller is played by an RNN (recurrent neural network). Next, the generated augmentation policy is applied to the training of the sub-model. After the submodel is trained, it is evaluated on the validation set, and the accuracy of the submodel is fed back to the RNN controller as a “reward signal”. Finally, the controller passes this signal and is updated under the optimization algorithm. The flow chart of the optimization strategy for data augmentation is shown in Figure 1 [8].
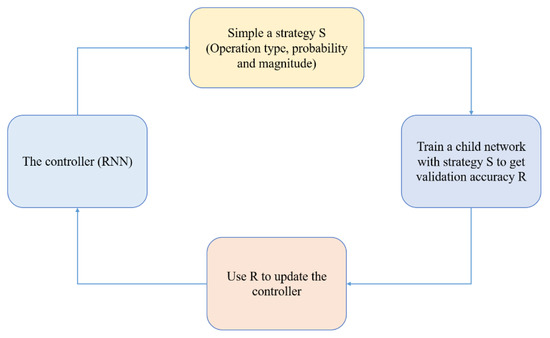
Figure 1.
The framework for searching for better data augmentation strategies using search methods such as reinforcement learning.
Unlike traditional data augmentation methods, automatic data augmentation finds multiple augmentation strategies through algorithms for a single dataset, and then randomly selects a single image from this series of sub-strategies for a single image in the mini-batch during the process of using the dataset to train the network, then extracting a sub-policy to act on the image. That is, not only may the data fed into the network go through a different augmentation operation for each epoch, but even within the same epoch, different images in the same mini-batch may undergo different augmentation operations. However, because of the existence of probability, even if the same sub-strategy is used to enhance the results, the results will be different. In this paper, we focused on methods that update policies in an online manner for two reasons: (1) They can directly search the target network for data augmentation policies using all training data, and (2) They unify the search and training processes, which simplifies the framework.
2.2. Teacher Knowledge
Teacher knowledge belongs to the field of knowledge distillation [20]. The purpose of knowledge distillation is to extract knowledge from the larger teacher model and transfer it to the lightweight student model. Its effectiveness is usually attributed to the unique information about the similarity between categories provided by the teacher model. In this sense, only a strong teacher model can be deployed to enhance the weaker student model. Teacher knowledge is more prevalent in the semi-supervised learning field. Teacher knowledge literally refers to teachers guiding students to learn “knowledge” from data. Typically, teacher knowledge involves teacher models and student models [21]. In supervised learning, we have a large amount of labeled data, and the model learns under the supervision of labels. In semi-supervised learning, we have a small amount of label data and a large amount of unlabeled data. How to learn from a large amount of unlabeled data becomes the key to the problem. One approach is the pseudo label. First, the label data are used to train a model, then the model is used to predict the pseudo label of the unlabeled data, and then the pseudo label is used to further train the model. This process can be iterated repeatedly until convergence. The key to this approach is that we believe in the model’s prediction of unlabeled data, but when there is very little label data, the model is easy to overfit, so the model’s prediction is not reliable, which is a bit contradictory.
For overfitting problems, unlabeled data can be used to regularize the model to make the model more robust. In this regard, our predecessors have conducted a lot of work such as data augmentation, dropout, shake-shake regularization, and so on [22]. Data augmentation processes data, while dropout and shake-shake process models, but cannot solve the problem of unlabeled data. Therefore, consistency regularization came into being. For classification problems (semantic segmentation problems are not discussed for the time being), consistency regularization is as follows: for the same input under different data augmentation and dropout conditions, the output of the model (soft-label after softmax processing) is consistent [23]. This requires two or more input evaluations. The teacher models and student models are one way of implementation because the teacher requires the output of the student to be consistent with it.
The main idea of consistency regularization is as follows: for the input, even with slight disturbances, its predictions should be consistent [24]. In addition to the idea of consistency, there is also the motivation of “the key to the success of the model is the quality of the target”. The idea is to construct a better teacher model than the student model from the current model (student model), and then use the teacher model’s predictions to train the student model. The workflow of teacher knowledge is shown in Figure 2.
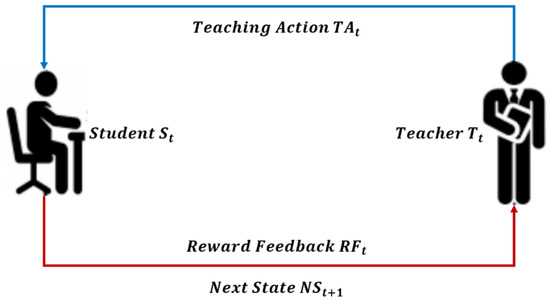
Figure 2.
Schematic diagram of the interaction between the student model and the teacher model at time t.
2.3. Color Regularization
In practice, color augmentation models are mostly set outside the color distribution of the training set of samples when transforming pixel colors. Therefore, the resulting enhanced images are data from an unexpected distribution, which may reduce the identification accuracy of the test set samples within the distribution. To correct the color distribution before and after image augmentation, we chose to regularize the color augmentation model by introducing the sliced Wasserstein distance (SWD) [25] to process the pixel color. The Wasserstein distance is generally used to measure the distance between the probability distributions, and the idea of SWD is to first obtain a one-dimensional representation of a high-dimensional probability distribution through linear mapping, and then calculate the Wasserstein distance of the one-dimensional representation of two probability distributions. The formula for defining the color regularization term here [9] is as follows:
where represents the ith pixel of the images in the batch size B; represents the color-enhanced image, which is defined in Equation (4); in terms of the computational cost, the cost of calculating the SWD per pixel location depends on the image resolution and is linearly related. Then, during stochastic gradient descent, the gradient of at each iteration is expressed as:
where λ represents the hyperparameter that controls the regularization effect, and was set to 10 in this model. This model adopts unsaturated loss. Here, the formula of loss L is:
3. Proposed Method
The automatic data augmentation technology based on teacher knowledge is a new direction to study the problem of working condition diagnosis, which involves parameter optimization and image processing methods. There are many problems in condition diagnosis such as insufficient liquid supply or gas influence. The parameter optimization involved here includes the optimization of network weights and offsets as well as the learning rate. Image processing methods involve convolutional neural networks, mainly including up sampling and down sampling. The parameters are set in advance here. Suppose represents an image sampled from dataset X, and represents an augmentation function with parameter . is a conversion parameter in data augmentation, is the objective function. The search loss is . The objective function of the teacher model is . The color magnification model parameter is , while the geometric magnification model parameter is . The following will be divided into several aspects to explain.
3.1. Preprocessing
In traditional data augmentation methods, represents the magnitude of data augmentation. Assume that is a sample taken from the image dataset such as the image of the gas impact type. represents an enhancement function such as a random flip function. represents the inversion rate, which can be 90 degrees or 180 degrees. In this paper, corresponds to the parameters of the neural network. Usually in the training process using data augmentation, the samples of each minibatch are transformed by and then fed into the target network . Afterward, the parameters of the target network are updated to minimize the task loss L. Additionally, the adversarial data augments the search parameter to maximize the loss. The goal is defined as . This objective is solved by alternately updating and . However, adversarial data augmentation methods cannot improve model generalization well without regularization or restrictions on the size of the search space. Because maximizing tends to ignore the intrinsic information of the image , therefore, instead of regularization based on prior knowledge, we used the teacher model.
3.2. Automatic Augmentation Method Based on Teacher Knowledge
Let be the teacher model, which can take any model as the teacher model, as long as it is different from the target model . The student model is the model that traditional machine methods focus on (i.e., the target model). The teacher model is a separate agent responsible for providing appropriate inputs to the target model to guide its training process. The input of the target model here mainly includes: (1) Training dataset: training set from all datasets; (2) Loss function: Loss function from all possible loss functions; (3) Hypothesis space: Hypothesis space from all possible hypothesis spaces (e.g., linear/polynomial function class/NN structure/hyperparameter). The evaluation criteria for suitable input is to enable the student model to achieve better performance or higher efficiency on the entire task. We used two teacher models, a pre-trained teacher and an EMA teacher (whose weights were updated by exponentially weighting the weights of the target model) [26]. The function objective [26] is set as follows:
The function of our method has the same part as that of the adversarial data augmentation method. However, the goal of this enhancement function is not only to maximize the loss of the objective function, but also to minimize the loss of the teacher model. Using this method can effectively avoid the disappearance of the inherent meaning of the image because when the image becomes unrecognizable, the teacher model will experience a gradient explosion. This shows that the introduced teacher model loss requires an augmentation function to transform the image, so that the augmentation result is adversarial to the target model, but discriminable to the teacher model.
The explanation of our method is shown in Figure 3 [10]. Adversarial data augmentation methods increase the loss value of the target model by transforming the data. Such augmented image data are often difficult to generate value (e.g., the black and noisy parts in Figure 3). Augmented images are difficult to recognize without any constraints. For the problem of working condition diagnosis, it is helpful to provide directional guidance for the model convergence speed of indicator diagram classification. Our proposed method transforms the data so that it is adversarial to the target model but recognizable to the teacher model . Therefore, the augmented images will be more informative than normal adversarial data augmentation.
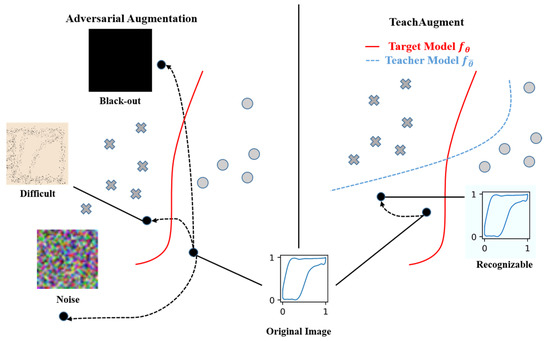
Figure 3.
Conceptual map of our approach versus traditional adversarial data augmentation methods.
The traditional countermeasure strategy maximizes the loss of the objective function without considering the image connotation information, so the generated image lacks a lot of semantic information. Our method will automatically limit the search space due to the guidance of the teacher model to obtain better images.
The automatic augmentation method based on the teacher knowledge alternately updates the parameters of the target model and the enhancement model . The training process of this method is shown in Figure 4 [27].
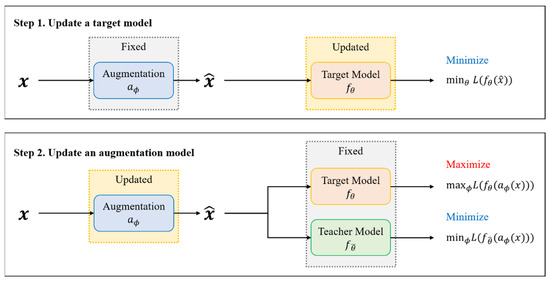
Figure 4.
The model training process diagram of our method.
As shown in Figure 4, this method solves the problem by alternately updating the augmentation function and the target model through stochastic gradient descent [28]. The model first updates the target network for several steps, and then updates the parameters of the augmentation function. The reason why the augmentation function can be updated by the gradient method is that the parameters of our proposed neural network are differentiable with respect to the parameter during iteration. This method neither regularizes the augmentation function based on domain knowledge nor restricts the difficulty of transforming the images to ensure that the transformed images are recognizable. In this method, to prevent exploding gradients, we employed label smoothing techniques. The formula is , where , which is used to replace normal labels. In particular, this tends to happen with simple tasks or strong objective models.
3.3. Data Augmentation with Neural Networks
Aiming at the problem of the fault diagnosis of rod pumping systems, we proposed a data augmentation method using a neural network with the parameter . The method mainly includes two models: the color amplification model and the geometric amplification model . The model can update the parameters through the gradient method, using two functions to update the structure of the search space. The method of image augmentation is shown in Figure 5.
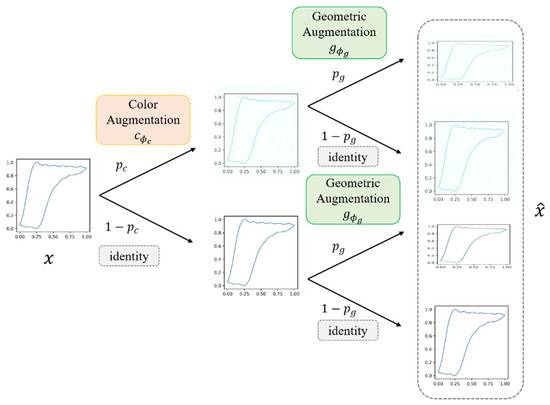
Figure 5.
Schematic diagram of the indicator diagrams’ data augmentation process.
This data augmentation includes color augmentation and geometric augmentation . Both augmentations are applied to the input image with probabilities and . Given an image , M is the number of pixels and the number 3 is the three RGB color channels. The probability of action of color augmentation is , while the probability of geometric enhancement is .
Here, the given color augmentation definition formula is as follows:
Among them, , represent the scale and shift parameters; ⨀ represents the element-wise multiplication between two vectors; represents the trigonometric function, which ensures that ; , where represents an N-dimensional unit Gaussian distribution; and is an optional context vector.
The geometric augmentation definition formula [27] is as follows:
where represents the affine transformation of with parameters ; represents the matrix. If , then , otherwise . This makes the affine transformation a unit map . represents the residual parameter, while and are the same as before. Geometrically augmented models can indeed be defined by transformations other than affine transformations [29]. However, we chose this transformation in this work, considering that the affine transformation can represent all linear transformations and their complex forms in the auto-augmentation search space.
3.4. The Entire Model
We chose wide residual networks (WRN) [12] as the base model for the dynamometer classification task. WRN is a wider ResNet. As a variant of ResNet, it has great improvements in speed and performance. The main parameters of WRN are: the width coefficient K, the number of convolutional layers L contained in a block, the total number of convolutional layers N, and the structure M of the block. The naming method adopted by WRN is WRN-N-K-M. Here, the model of the WRN-28-10-M (3, 3) structure was used for the experiments.
In terms of model details, for geometric augmentation, a three-layer perceptron was chosen here. The dimension of the noise vector was 128, and the number of units in the hidden layer was 512. We used the leaky ReLU [30] function in a nonlinear activation function with a slope of 0.2 for activation. The output is normalized by a sigmoid function [10] with the following formula:
Among them, represents the relevant parameters of the search range of . Here, it was set to 0.5 (i.e., ).
For color augmentation, two three-layer perceptrons were chosen here, receiving two variables, RGB vector and noise vector, as the input and summing their outputs. The number of units in the hidden layer was 128 and 512, respectively. The nonlinear activation function also used leaky ReLU. Here, the model outputs the three-dimensional scale and shift parameters as follows:
The output scalar scaling and shifting parameters are expressed as follows:
The scaling and shifting parameters from the noise vector can control the global brightness of the image. These scaling and shifting parameters are then added together as follows:
where denotes the j-th element of . This experiment adopted AdamW [31] as the optimizer of the automatic data augmentation model. The learning rate and weight decay were set to 1 × 10⁻³ and 1 × 10⁻², respectively, which are the default parameters. We chose to apply the dropout to the model after the linear layer [32], except for the output layer, which had a pressure drop ratio of 0.8.
4. Experiments
4.1. Dataset
We collected the indicator diagram data points from the actual pumping units in an oil field and plotted them as indicator diagrams. The data were preprocessed here. Considering the different numerical ranges of working condition parameters between the different pumping units, in order to ensure that this does not interfere with the identification of working conditions, we adopted the min–max standardization method, and the formula is as follows:
Among them, X represents the sample data points of the indicator diagrams; Max represents the maximum value of the sample data; Min represents the minimum value of the sample data. The drawing flowchart from data points to the indicator diagram is shown in Figure 6.
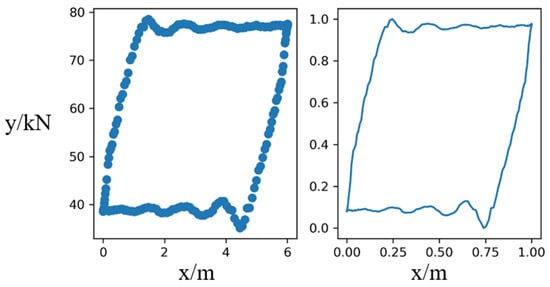
Figure 6.
An example drawing of an indicator diagram.
In this way, six types of working condition samples can be obtained, namely, normal operation, gas effect, insufficient liquid supply, leakage of traveling valve, double valve leakage, and oil well wax deposition. There were a total of 700 samples of each type, and a total of 4200 indicator diagrams. The data augmentation method was used to uniformly increase the number of samples to 1000 per class, so that a total of 6000 samples were obtained. Next, we began to make the indicator diagram dataset. Here, we referred to the format of the standard dataset “cifar10”, changed the size of the pictures to 32 × 32, and made a standardized data file. In terms of dataset division, we divided each type of indicator diagram into the training set and test set according to the ratio of 8:2, that is to say, the number of samples of each type of training set and testing set was 800 and 200, respectively. The six types of indicator diagrams are as previously described. Specific data are shown in Table 2.
Table 2.
Actual oil field sample data.
In order to reflect the role of data augmentation as much as possible, we enhanced 1200 indicator diagrams based on the original 4800 indicator diagrams. This number was based on previous scientific research. The enhanced image data obtained here were different according to different enhancement methods. These data were used for comparative analysis in subsequent experiments.
4.2. Process of Experiment
For the problem of working condition diagnosis, the neural network for data augmentation can improve the efficiency of the model, and the modular processing can realize end-to-end image augmentation learning. The construction of the geometric augmentation model selects the multi-layer perceptron, and here, two multi-layer perceptrons were used to construct the color augmentation model. The two multilayer perceptrons can receive RGB three-dimensional vectors and noise vectors as input, and then add their outputs. The output of each augmented model was followed by a sigmoid function, and the parameter range was chosen to be , and . Here, the model noise vector was . The dimension was set to 128. To guarantee randomness, in addition to the output layer of the network, dropout [32] was also applied after the linear layer. The weight parameters of the output layer were initialized to zero to make the enhancement conform to the mapping in the initial state. The AdamW optimizer was chosen to train our augmented model. Meanwhile, all hyperparameters of AdamW (e.g., weight decay and learning rate, etc.) were set to the default parameter values [27].
Next, the model flow is described in stages. In the training phase, this model uses a single GPU to accelerate the training, and the training batch size was set to 128. The number of training cycles of the network (i.e., epoch) was set to 100. The batches used for training were input out of order in each loop to improve the generalization ability of the model. The label smoothing factor was set to 0.2 and randomization was performed using dropout. For the testing phase, the batch size of this phase was also set to 128, while the input image size remained unchanged. Since the order of the test set samples does not affect the prediction performance of this stage, the indicator diagrams samples can be input in order at this stage.
4.3. Experiment Results and Analysis
The training time of this model was 15 min, which involves two objects, the teacher model and the student model. Regarding the performance on the test set, the loss of adversarial training was ; the value of the color regularization term was ; the loss of the model was 0.00038; the accuracy of the model was 98.72%. Our dataset came from field sampling in oil fields. Due to the influence of noise and measurement errors, the quality of some of the data was not high, which makes the validation accuracy of many machine learning models relatively low. Therefore, the experimental results of our method were quite good. This shows that our algorithm makes full use of the advantages of automatic search method and selects effective data augmentation methods to supplement indicator diagram samples.
4.4. Comparative Experiment Analysis
Two comparative experiments were prepared here, namely, the traditional data augmentation method and the original data without data augmentation, and their basic models are consistent with our method. Next, the details of the comparison methods are described.
For traditional data augmentation methods, a hybrid method was used for the experiments here. At present, there are several common augmentation methods [33]. We chose three methods: random rotation, random cropping, and horizontal flip, and enhanced 100 images for each type of dynamometer according to the ratio of 1:1:1. This is both comprehensive in method selection and rational in resource allocation. Unprocessed raw samples can be used as a baseline method to demonstrate the effect of data augmentation methods and the superiority of our method. The number of iterations for both methods was set to , and parameters such as the learning rate were also the same as before. Here, the error loss map and accuracy change map of the three methods on the test set are given, and a comparative analysis is made.
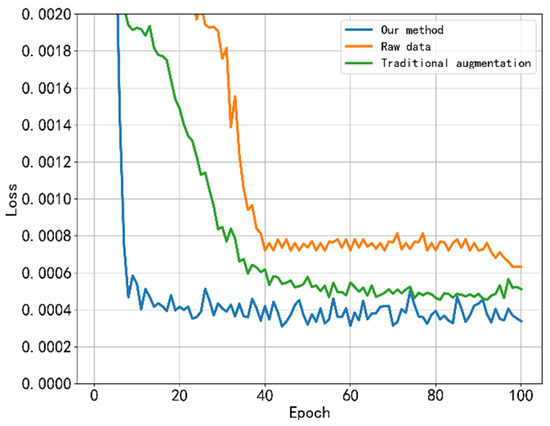
Figure 7.
Plots of the loss curve results for the three methods.
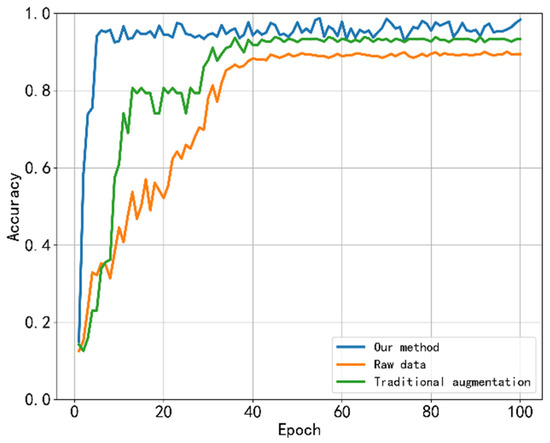
Figure 8.
The accuracy curve results of the three methods.
First, we conducted a trend analysis. Our approach is similar to traditional data enhancement methods. It can be seen from the loss curve that the error loss decreased very quickly at the beginning and slowed down after twenty iteration cycles until it finally remained stable. The accuracy change curve was also fast at the initial stage, and the rising speed slowed down after reaching a certain value until it finally reached stability. The following is a numerical analysis. The final loss of the traditional data augmentation method on the task of working condition diagnosis was 0.000512, and the accuracy rate was 93.32%. The raw data had a final loss of 0.00632 on the test set with an accuracy of 89.46%. Obviously, the experimental performance of the automatic data augmentation method based on teacher knowledge was better than the other two sets of comparative experiments. Next, we compare and analyze the computational efficiency of the three methods and provide a comprehensive evaluation. We chose the training time, test time, mean squared error, and accuracy to evaluate each method. The specific values are shown in Table 3.
Table 3.
The comparison of the three methods on the test set.
Here, we chose three methods to show the advantages of our method. As the baseline, the original data were used to illustrate the effectiveness of the data enhancement itself. The traditional data enhancement method is an old method used in the past to compare with our new method. The comparison of these three approaches can more comprehensively express the results.
From the data in Table 3, it can be seen that our method is more time-consuming than the original data method and less time-consuming than the traditional data augmentation methods. This is because the traditional data augmentation method is composed of multiple augmentation algorithms, which cannot form a continuous modular network, and the original data have not undergone any augmentation operation, which naturally takes the least amount of time. In terms of the experimental performance comparison, the accuracy of our method was about 9% higher than that of the original data method, and 5% higher than that of the traditional augmentation method, which was clearly in the leading position. Due to the presence of the teacher model, the number of parameters will increase, but this brings a large increase in model performance, however, this will increase the time consumption by a part. After the model training was completed, the time required for each method to be tested was not much different, which is in line with the actual needs of oil field operations. To sum up, compared with traditional data augmentation methods, our method has obvious advantages and is suitable for the task of the diagnosis of the working condition of the rod pumping units.
5. Discussion
The advantage of our method is that the teacher model is introduced into adversarial data augmentation, making the augmented images more informative without the need for careful parameter tuning. This paper also proposed an automatic augmentation technique based on a neural network, which simplified the search space design and used the gradient method to update the data augmentation to seek the optimal effect.
The disadvantage of this method is that due to the lack of global information in the input of the network, the proposed color augmentation method cannot represent the transformation using the global information of the target image. This transformation can be achieved indirectly using the color histogram as the context vector, but this comes at the cost of an increased computational cost. Particularly for high-resolution images, because the higher the resolution, the larger the image, this results in a significant increase in the amount of data processed. Furthermore, this paper only focused on the two augmentation types, geometry and color, but many advanced augmentations do not belong to these types such as random clipping and Mixup [13]. Investigating such augmentation methods will be our future work.
At present, our method has achieved some results. However, we found that there are more research directions worth expanding. Although these directions are far from our current research, they are all part of the same system. According to our method, we can solve these potential problems step by step. The latest research progress of automatic data enhancement is regarding augmentation methods and optimization algorithms. More augmentations are being sought to accommodate different datasets. The continuous improvement in the optimization algorithm can speed up the model. This method can also be extended to other types of pumping systems in the field of condition diagnosis. We note that meta learning can be applied to indicator diagram diagnosis [7]. Meta learning is to solve the problem of condition diagnosis from the perspective of model, and our method solves the problem from the perspective of samples. Meta learning aims at the problem of a few shots and is carried out without increasing the amount of data. Generally, the network structure of meta learning is relatively simple, and the number of categories processed is small. Our method uses automatic data augmentation to increase the number of samples for a specific indicator diagrams dataset that can solve complex problems. These two methods can be used together, and a follow-up study will be conducted. We will continue to study this in future studies.
6. Conclusions
In this paper, we proposed an automatic data augmentation method based on teacher knowledge and established a data authentication neural network to solve the problem of indicator diagram classification. The performance of this method on the task of working condition diagnosis surpassed the current traditional data augmentation methods. Through the experiments and analysis, we can draw the following conclusions:
- (1)
- An automatic data augmentation method was proposed, which draws on teacher knowledge and can be guided to find the optimal augmentation strategies for different datasets. It can be used to solve the problem of an insufficient number of samples in the diagnosis of operating conditions.
- (2)
- A neural network was proposed for the data indicator of indicator diagrams, which can update parameters by gradient descent, and the experimental effect was improved by more than 5% compared with the comparison methods.
- (3)
- We proposed a standardized data management method according to the “cifar10” dataset format.
- (4)
- As one of the oil field data expansion and management methods, this method has research value for the construction of intelligent oil fields.
In the future, we will continue to explore other advanced data-augmented parametric automated searches and combine multimodal knowledge to conduct real-time monitoring and the intelligent analysis of rod pumping systems at oil field well sites.
Author Contributions
H.W.: Methodology, Software; Q.W.: Writing—Original Draft, Writing—Review & Editing; T.L.: Validation, Data Curation; J.R.: Validation, Resources; J.L.: Software, Validation; L.S.: Data Curation, Resources; K.Z.: Conceptualization, Supervision, Funding acquisition, Project administration. All authors have read and agreed to the published version of the manuscript.
Funding
This work is supported by the National Natural Science Foundation of China under Grant 52274057, 52074340 and 51874335, the Major Scientific and Technological Projects of CNPC under Grant ZD2019-183-008, the Major Scientific and Technological Projects of CNOOC under Grant CCL2022RCPS0397RSN, the Science and Technology Support Plan for Youth Innovation of University in Shandong Province under Grant 2019KJH002, 111 Project under Grant B08028.
Data Availability Statement
Private data involved.
Acknowledgments
We would like to sincerely thank all of the reviewers for their constructive comments. We are also grateful for the financial support of related research projects. This work is supported by the National Natural Science Foundation of China under Grant 52274057, 52074340 and 51874335, the Major Scientific and Technological Projects of CNPC under Grant ZD2019-183-008, the Major Scientific and Technological Projects of CNOOC under Grant CCL2022RCPS0397RSN, the Science and Technology Support Plan for Youth Innovation of University in Shandong Province under Grant 2019KJH002, 111 Project under Grant B08028.
Conflicts of Interest
The authors declare no conflict of interest.
References
- Krizhevsky, A.; Sutskever, I.; Hinton, G.E. Imagenet Classification with Deep Convolutional Neural Networks. Commun. ACM 2017, 60, 84–90. [Google Scholar] [CrossRef]
- Cheng, H.; Yu, H.; Zeng, P.; Osipov, E.; Li, S.; Vyatkin, V. Automatic Recognition of Sucker-Rod Pumping System Working Conditions Using Dynamometer Cards with Transfer Learning and Svm. Sensors 2020, 20, 5659. [Google Scholar] [CrossRef] [PubMed]
- Ciregan, D.; Meier, U.; Schmidhuber, J. Multi-Column Deep Neural Networks for Image Classification. In Proceedings of the 2012 IEEE Conference on Computer Vision and Pattern Recognition, Providence, RI, USA, 16–21 June 2012. [Google Scholar]
- Szegedy, C.; Liu, W.; Jia, Y.; Sermanet, P.; Reed, S.; Anguelov, D.; Erhan, D.; Vanhoucke, V.; Rabinovich, A. Going Deeper with Convolutions. In Proceedings of the 2015 IEEE Conference on Computer Vision and Pattern Recognition (CVPR), Boston, MA, USA, 7–12 June 2015. [Google Scholar]
- Zhang, A.; Gao, X. Supervised Dictionary-Based Transfer Subspace Learning and Applications for Fault Diagnosis of Sucker Rod Pumping Systems. Neurocomputing 2019, 338, 293–306. [Google Scholar] [CrossRef]
- Zhou, W.; Li, X.; Yi, J.; He, H. A Novel Ukf-Rbf Method Based on Adaptive Noise Factor for Fault Diagnosis in Pumping Unit. IEEE Trans. Ind. Inform. 2019, 15, 1415–1424. [Google Scholar] [CrossRef]
- Zhang, K.; Wang, Q.; Wang, L.; Zhang, H.; Zhang, L.; Yao, J.; Yang, Y. Fault Diagnosis Method for Sucker Rod Well with Few Shots Based on Meta-Transfer Learning. J. Pet. Sci. Eng. 2022, 212, 110295. [Google Scholar] [CrossRef]
- Cubuk, E.D.; Zoph, B.; Mane, D.; Vasudevan, V.; Le, Q.V. Autoaugment: Learning Augmentation Strategies from Data. In Proceedings of the 2019 IEEE/CVF Conference on Computer Vision and Pattern Recognition (CVPR), Long Beach, QC, Canada, 15–20 June 2019; pp. 113–123. [Google Scholar]
- Lim, S.; Kim, I.; Kim, T.; Kim, C.; Kim, S. Fast Autoaugment. In Proceedings of the 2019 Conference on Neural Information Processing Systems, Vancouver, QC, Canada, 10–12 December 2019. [Google Scholar]
- Hataya, R.; Zdenek, J.; Yoshizoe, K.; Nakayama, H. Faster Autoaugment: Learning Augmentation Strategies Using Backpropagation. arXiv 2020, arXiv:1911.06987. [Google Scholar]
- Sato, I.; Nishimura, H.; Yokoi, K. Apac: Augmented Pattern Classification with Neural Networks. arXiv 2015, arXiv:1505.03229. [Google Scholar]
- Zagoruyko, S.; Komodakis, N. Wide Residual Networks. arXiv 2016, arXiv:1605.07146. [Google Scholar]
- Zhang, H.; Cisse, M.; Dauphin, Y.N.; Lopez-Paz, D. Mixup: Beyond Empirical Risk Minimization. arXiv 2018, arXiv:1710.09412. [Google Scholar]
- DeVries, T.; Taylor, G.W. Dataset Augmentation in Feature Space. arXiv 2017, arXiv:1702.05538. [Google Scholar]
- Tran, T.; Pham, T.; Carneiro, G.; Palmer, L.; Reid, I. A Bayesian Data Augmentation Approach for Learning Deep Models. arXiv 2017, arXiv:1710.10564. [Google Scholar]
- Ratner, A.J.; Ehrenberg, H.; Hussain, Z.; Dunnmon, J.; Ré, C. Learning to Compose Domain-Specific Transformations for Data Augmentation. Adv. Neural Inf. Process. Syst. 2017, 30, 3239–3249. [Google Scholar] [PubMed]
- Liao, Y.T.; Lee, C.H.; Chen, K.S.; Chen, C.P.; Pai, T.W. Data Augmentation Based on Generative Adversarial Networks to Improve Stage Classification of Chronic Kidney Disease. Appl. Sci. 2021, 12, 352. [Google Scholar] [CrossRef]
- Chen, C.; Chandra, S.; Han, Y.; Seo, H. Deep Learning-Based Thermal Image Analysis for Pavement Defect Detection and Classification Considering Complex Pavement Conditions. Remote Sens. 2021, 14, 106. [Google Scholar] [CrossRef]
- Stephen, O.; Maduh, U.J.; Sain, M. A Machine Learning Method for Detection of Surface Defects on Ceramic Tiles Using Convolutional Neural Networks. Electronics 2021, 11, 55. [Google Scholar] [CrossRef]
- Yuan, L.; Tay, F.E.; Li, G.; Wang, T.; Feng, J. Revisiting Knowledge Distillation Via Label Smoothing Regularization. In Proceedings of the 2020 IEEE/CVF Conference on Computer Vision and Pattern Recognition (CVPR), Seattle, WA, USA, 14–19 June 2020. [Google Scholar]
- Fan, Y.; Tian, F.; Qin, T.; Li, X.Y.; Liu, T.Y. Learning to Teach. arXiv 2018, arXiv:1805.03643. [Google Scholar]
- Laine, S.; Aila, T. Temporal Ensembling for Semi-Supervised Learning. arXiv 2017, arXiv:1610.02242. [Google Scholar]
- Tarvainen, A.; Valpola, H. Mean Teachers Are Better Role Models: Weight-Averaged Consistency Targets Improve Semi-Supervised Deep Learning Results. In Proceedings of the 2017 Conference on Neural Information Processing Systems, Long Beach, CA, USA, 4–9 December 2017. [Google Scholar]
- Kumar, M.; Packer, B.; Koller, D. Self-Paced Learning for Latent Variable Models. In Proceedings of the 2010 Conference on Neural Information Processing Systems, Vancouver, QC, Canada, 6–11 December 2010. [Google Scholar]
- Bonneel, N.; Rabin, J.; Peyré, G.; Pfister, H. Sliced and Radon Wasserstein Barycenters of Measures. J. Math. Imaging Vis. 2014, 51, 22–45. [Google Scholar] [CrossRef]
- Peng, X.; Tang, Z.; Yang, F.; Feris, R.S.; Metaxas, D. Jointly Optimize Data Augmentation and Network Training: Adversarial Data Augmentation in Human Pose Estimation. In Proceedings of the 2018 IEEE/CVF Conference on Computer Vision and Pattern Recognition, Salt Lake City, UT, USA, 18–23 June 2018; pp. 2226–2234. [Google Scholar]
- Suzuki, T. Teachaugment: Data Augmentation Optimization Using Teacher Knowledge. In Proceedings of the 2022 IEEE/CVF Conference on Computer Vision and Pattern Recognition (CVPR), New Orleans, LA, USA, 19–24 June 2022; pp. 10894–10904. [Google Scholar]
- Goodfellow, I.; Pouget-Abadie, J.; Mirza, M.; Xu, B.; Warde-Farley, D.; Ozair, S.; Courville, A.; Bengio, Y. Generative Adversarial Nets. In Proceedings of the 2014 Conference on Neural Information Processing Systems, Montreal, QC, Canada, 8–11 December 2014. [Google Scholar]
- Jaderberg, M.; Simonyan, K.; Zisserman, A.; Kavukcuoglu, K. Spatial Transformer Networks. In Proceedings of the 2015 Conference on Neural Information Processing Systems, Montreal, QC, Canada, 7–10 December 2015. [Google Scholar]
- Maas, A.L.; Hannun, A.Y.; Ng, A.Y. Rectifier Nonlinearities Improve Neural Network Acoustic Models. In Proceedings of the 30th International Conference on Machine Learning, Atlanta, GA, USA, 16–21 June 2013. [Google Scholar]
- Loshchilov, I.; Hutter, F. Decoupled Weight Decay Regularization. In Proceedings of the 2019 International Conference on Learning Representations, New Orleans, LA, USA, 6–9 May 2019. [Google Scholar]
- Srivastava, N.; Hinton, G.; Krizhevsky, A.; Sutskever, I.; Salakhutdinov, R. Dropout: A Simple Way to Prevent Neural Networks from Overfitting. J. Mach. Learn. Res. 2014, 15, 1929–1958. [Google Scholar]
- Ho, D.; Liang, E.; Chen, X.; Stoica, I.; Abbeel, P. Population Based Augmentation: Efficient Learning of Augmentation Policy Schedules. In Proceedings of the 2019 International Conference on Machine Learning, Long Beach, CA, USA, 10–15 June 2019. [Google Scholar]
Disclaimer/Publisher’s Note: The statements, opinions and data contained in all publications are solely those of the individual author(s) and contributor(s) and not of MDPI and/or the editor(s). MDPI and/or the editor(s) disclaim responsibility for any injury to people or property resulting from any ideas, methods, instructions or products referred to in the content. |
© 2022 by the authors. Licensee MDPI, Basel, Switzerland. This article is an open access article distributed under the terms and conditions of the Creative Commons Attribution (CC BY) license (https://creativecommons.org/licenses/by/4.0/).