
A Synergetic Framework for Green and Lean Manufacturing Practices in SMEs: Saudi Arabia Perspective


Abstract
:1. Introduction
2. Literature Review
3. Research Methodology and Approach
- What are the current trends in lean and green manufacturing and their link with the different aspects of sustainability?
- To what extent are these practices (lean and green) actually implemented in a real manufacturing scenario? Which benefits have been reported? Which barriers have practitioners encountered?
- What are the currently available and implemented lean-green strategies and their link with sustainability?
- What are the best strategies or theories to combine different manufacturing approaches?
4. Synergetic Framework for Green-Lean Practices: An Integrated Approach
4.1. Lean Practices and Sustainability Performance
4.2. Green Practices and Sustainability Performance
4.3. The Joint Effect of Lean and Green Practices on Sustainability Performance
- Waste minimization;
- Environmental management;
- Resource management;
- Elimination of unnecessary processes.
4.4. The Interrelationship among Sustainability Performance
5. Quantitative Analysis and Discussion for the Case of the Manufacturing Sector in Saudi Arabia
5.1. Survey Structure
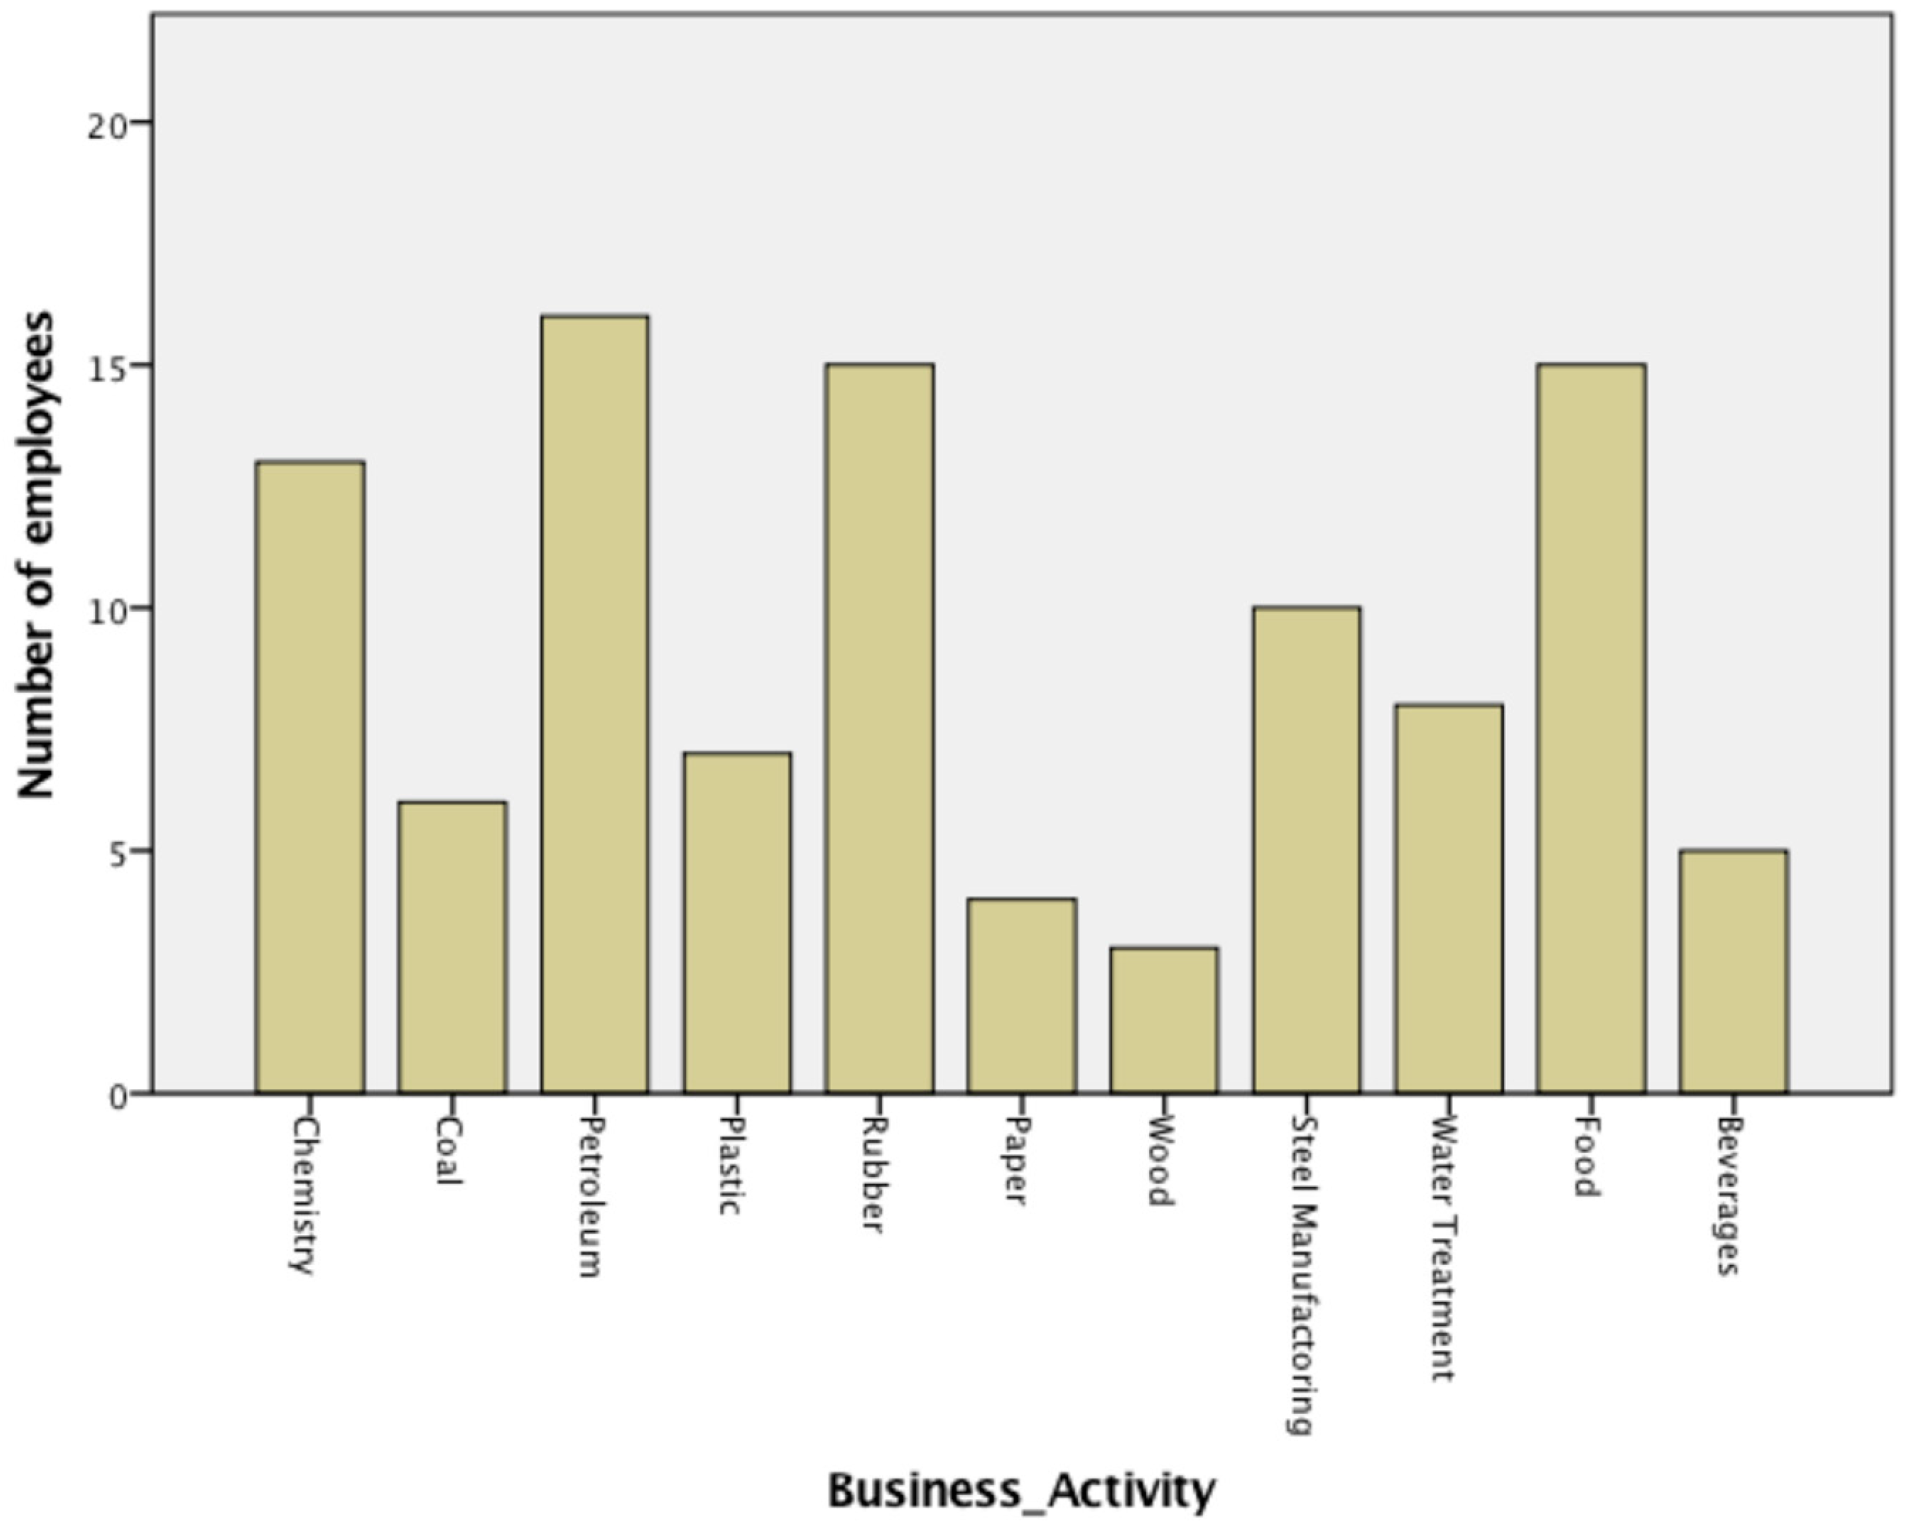
- Personal and business information;
- Impact of lean practices on business outcomes;
- Impact of green practices on business outcomes;
- Knowledge about lean-green practices as well as their impact on business outcomes;
- Impact of operational, environmental and social performances on financial performance.
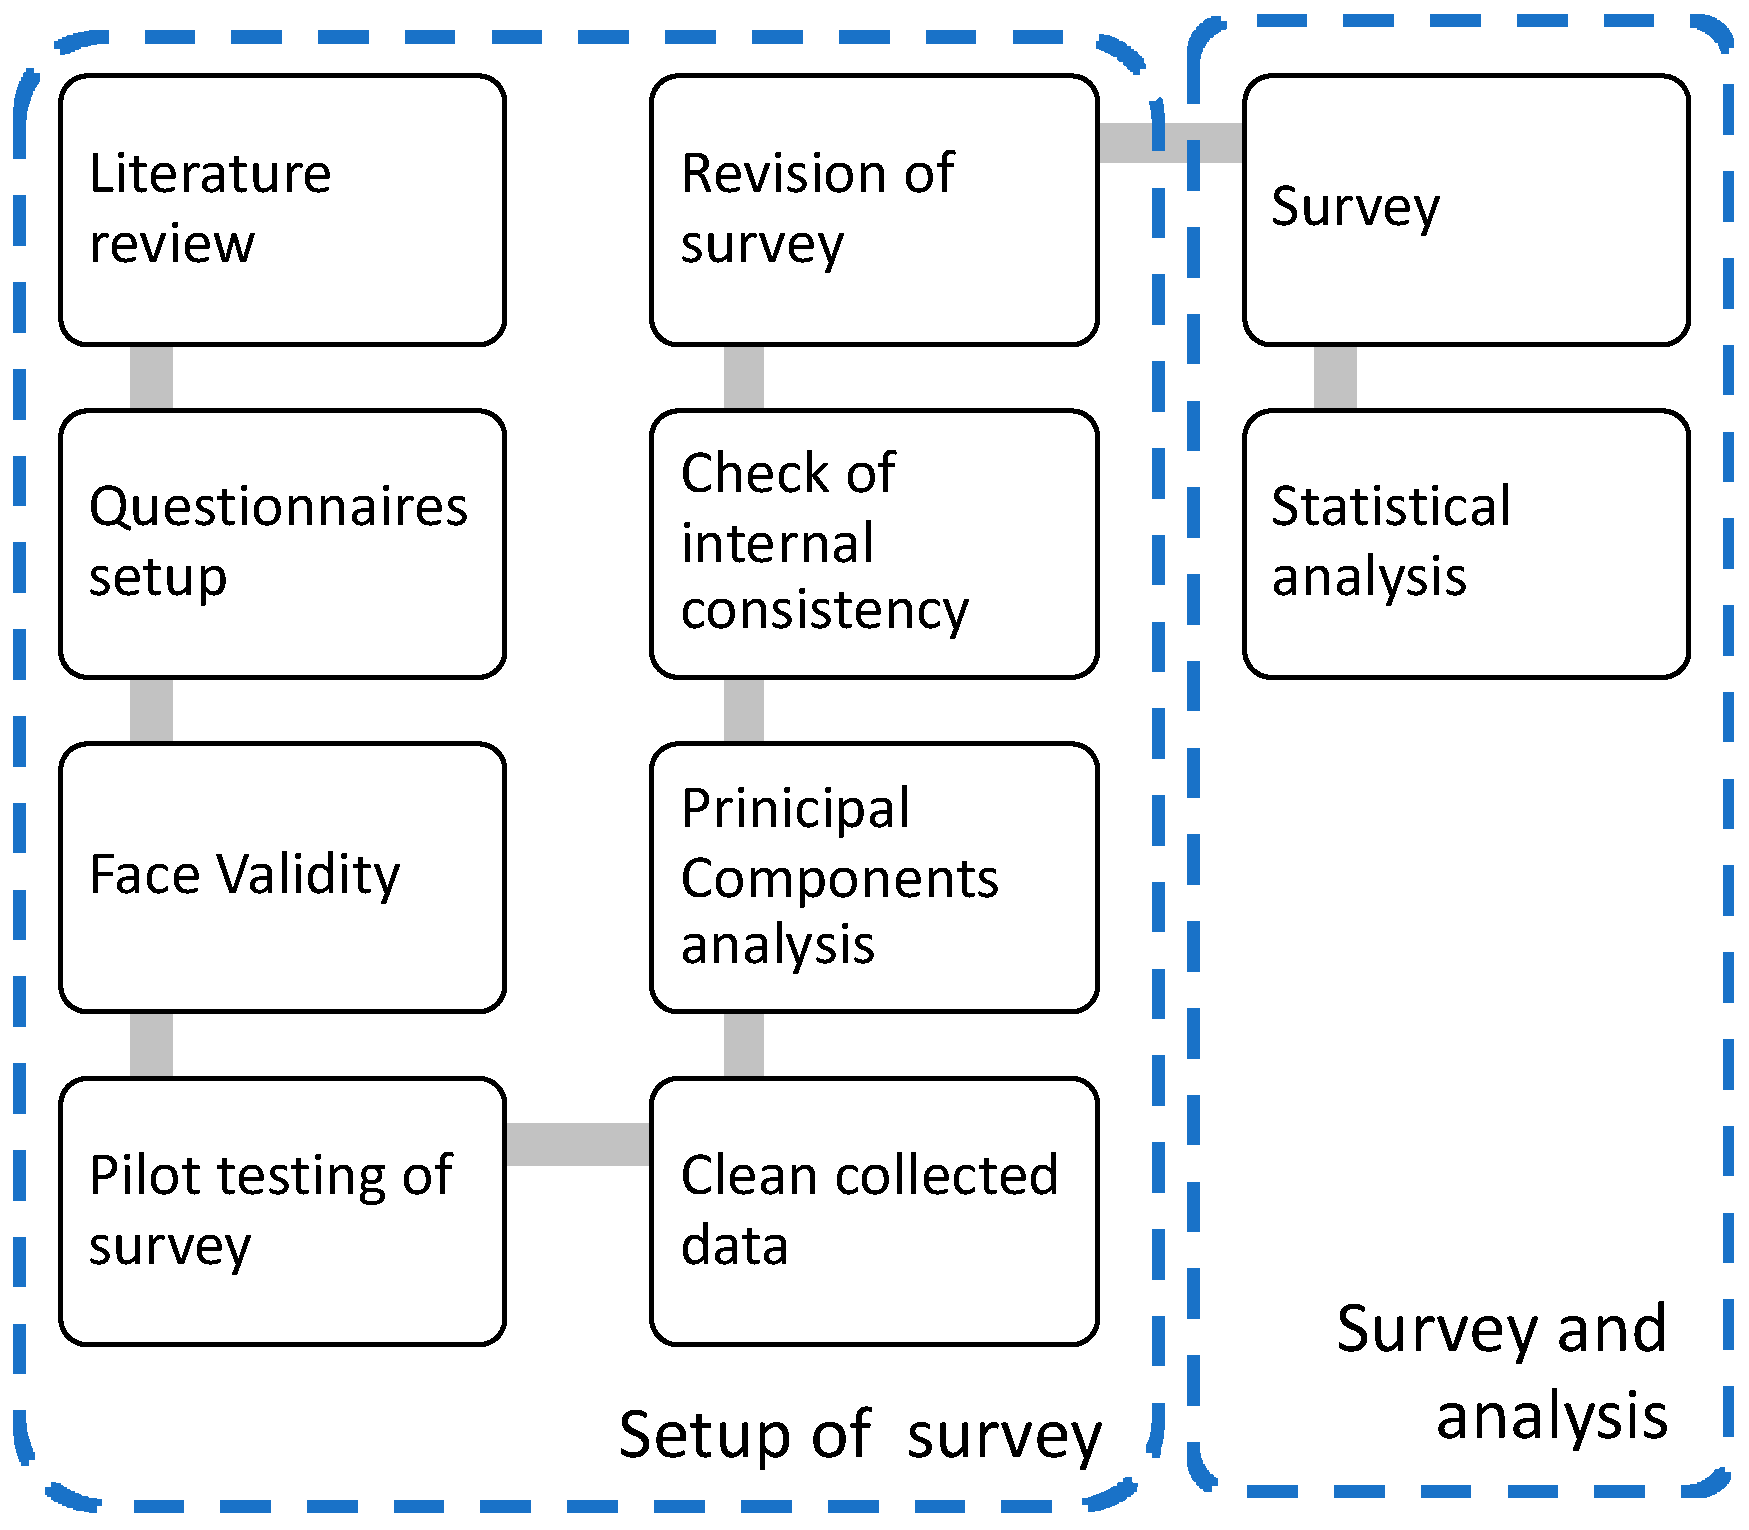
5.2. Survey Description
5.3. Survey Validation
5.3.1. Testing the Assumptions
- Normality Test
- Linearity Test
- Homoscedasticity
5.3.2. Testing Common Method Bias and Non-response Bias
5.3.3. Evaluating the Measurement Model Value
5.4. Hypothesis Testing
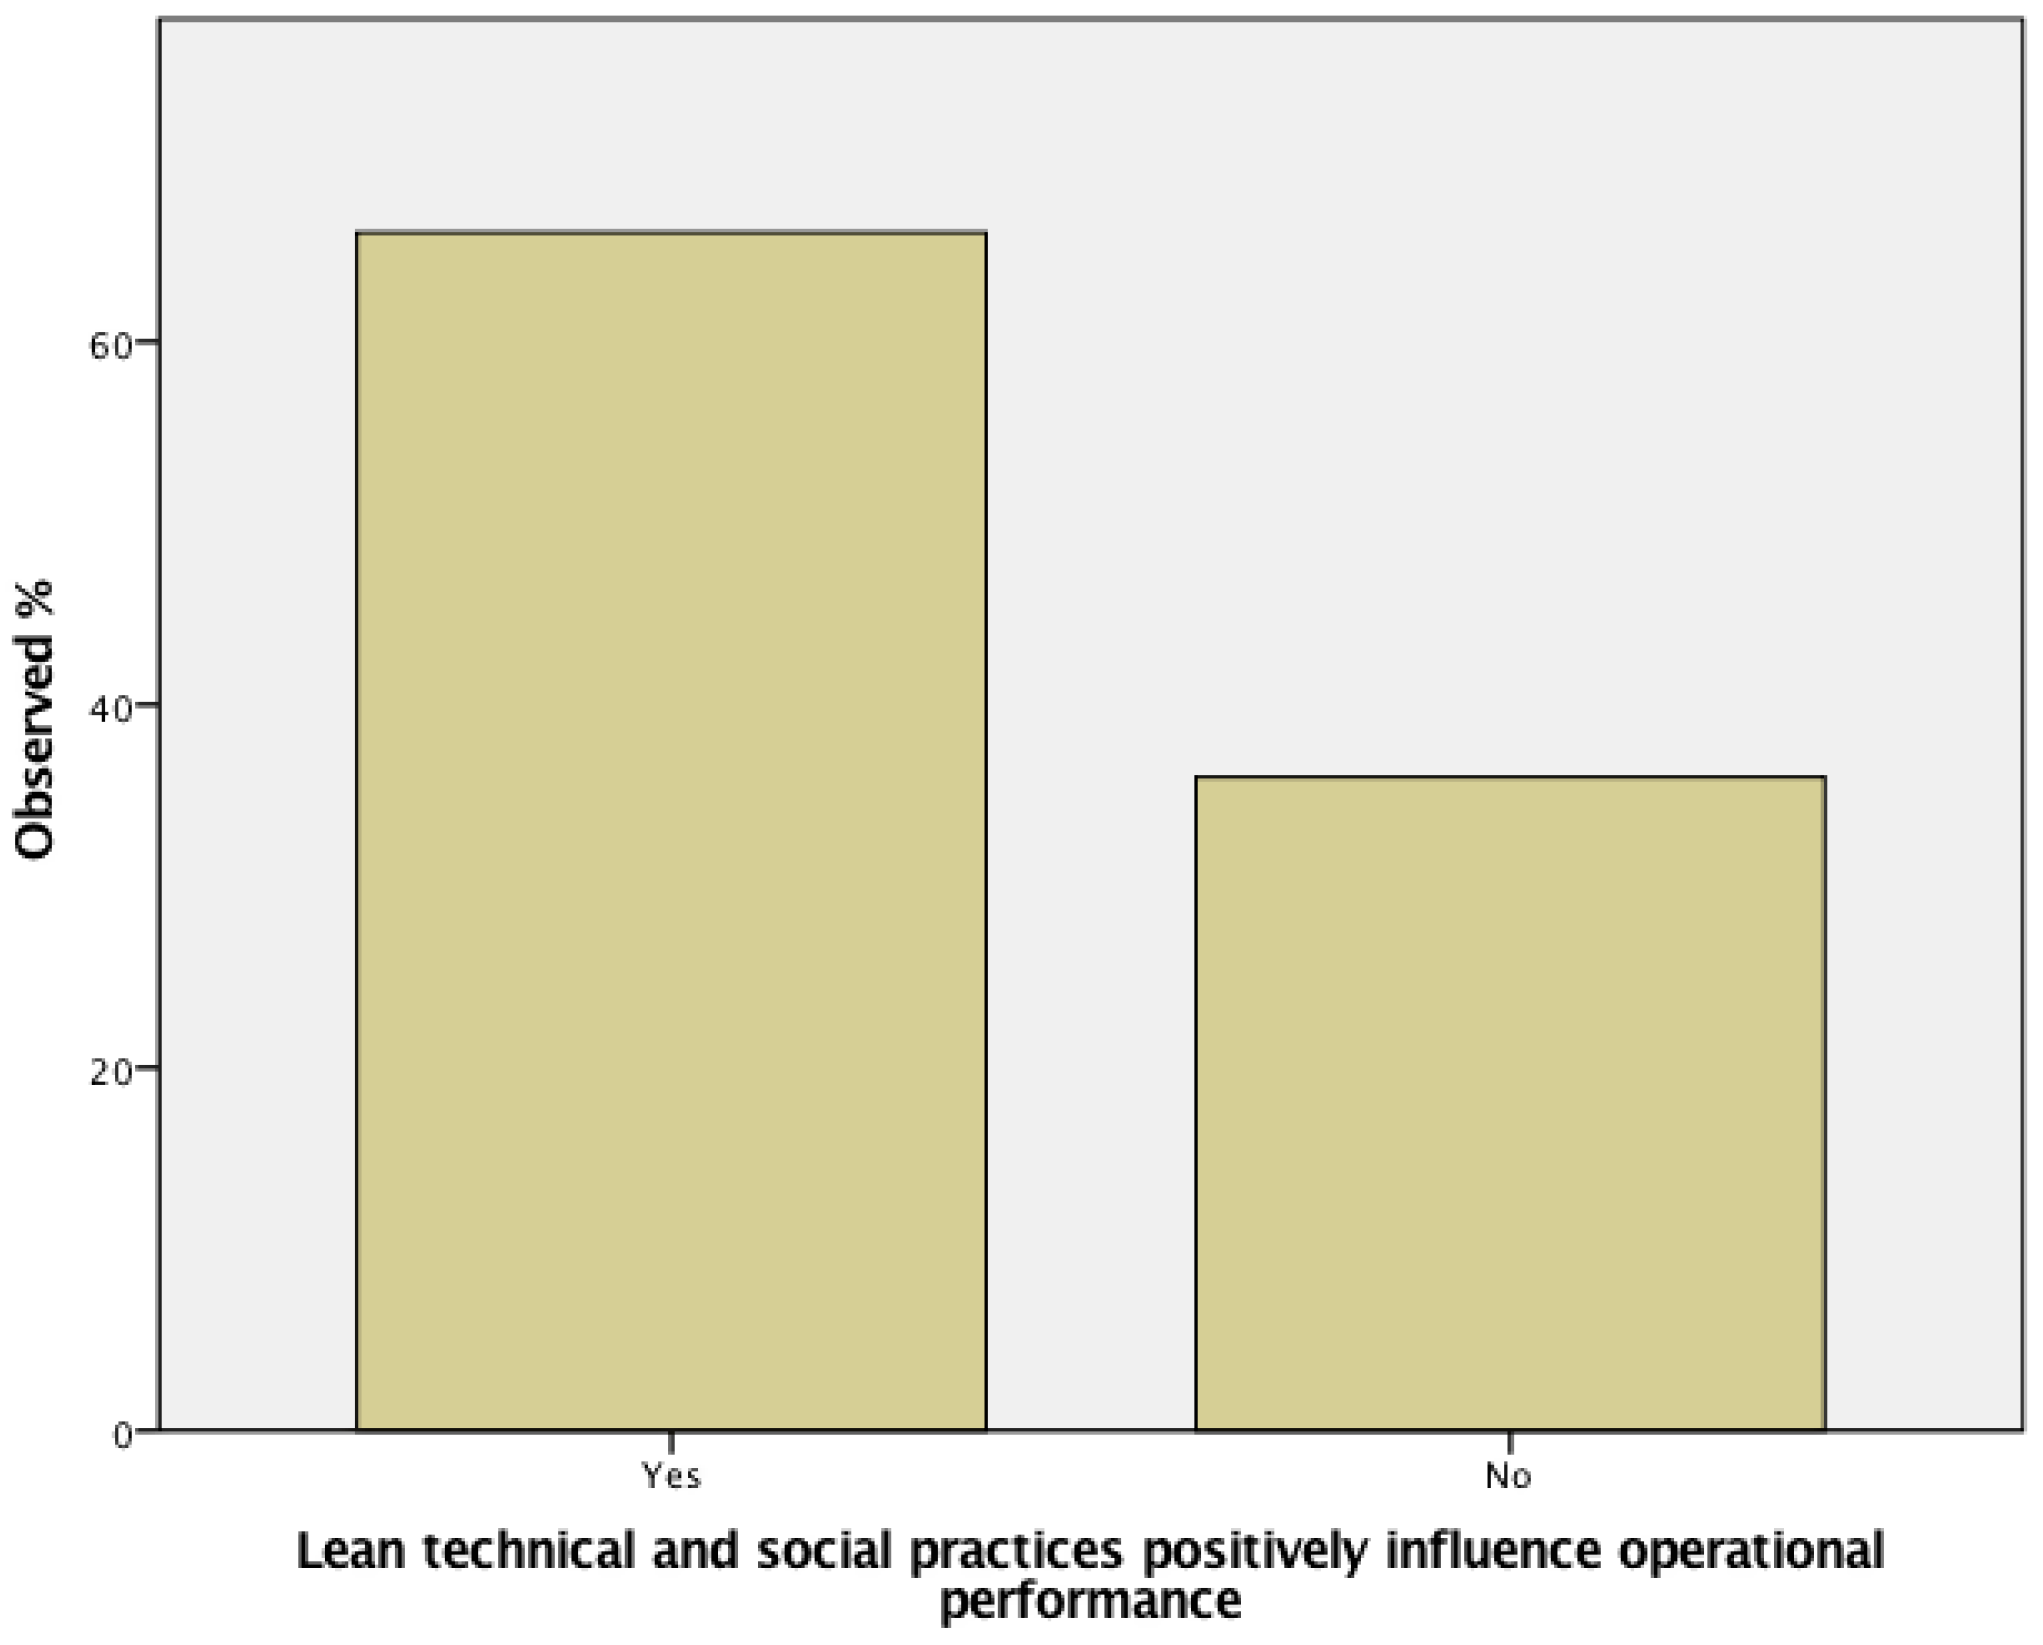
5.4.1. Testing the Impact of Lean Practices
H1a: Lean technical and social practices positively influence operational performance.
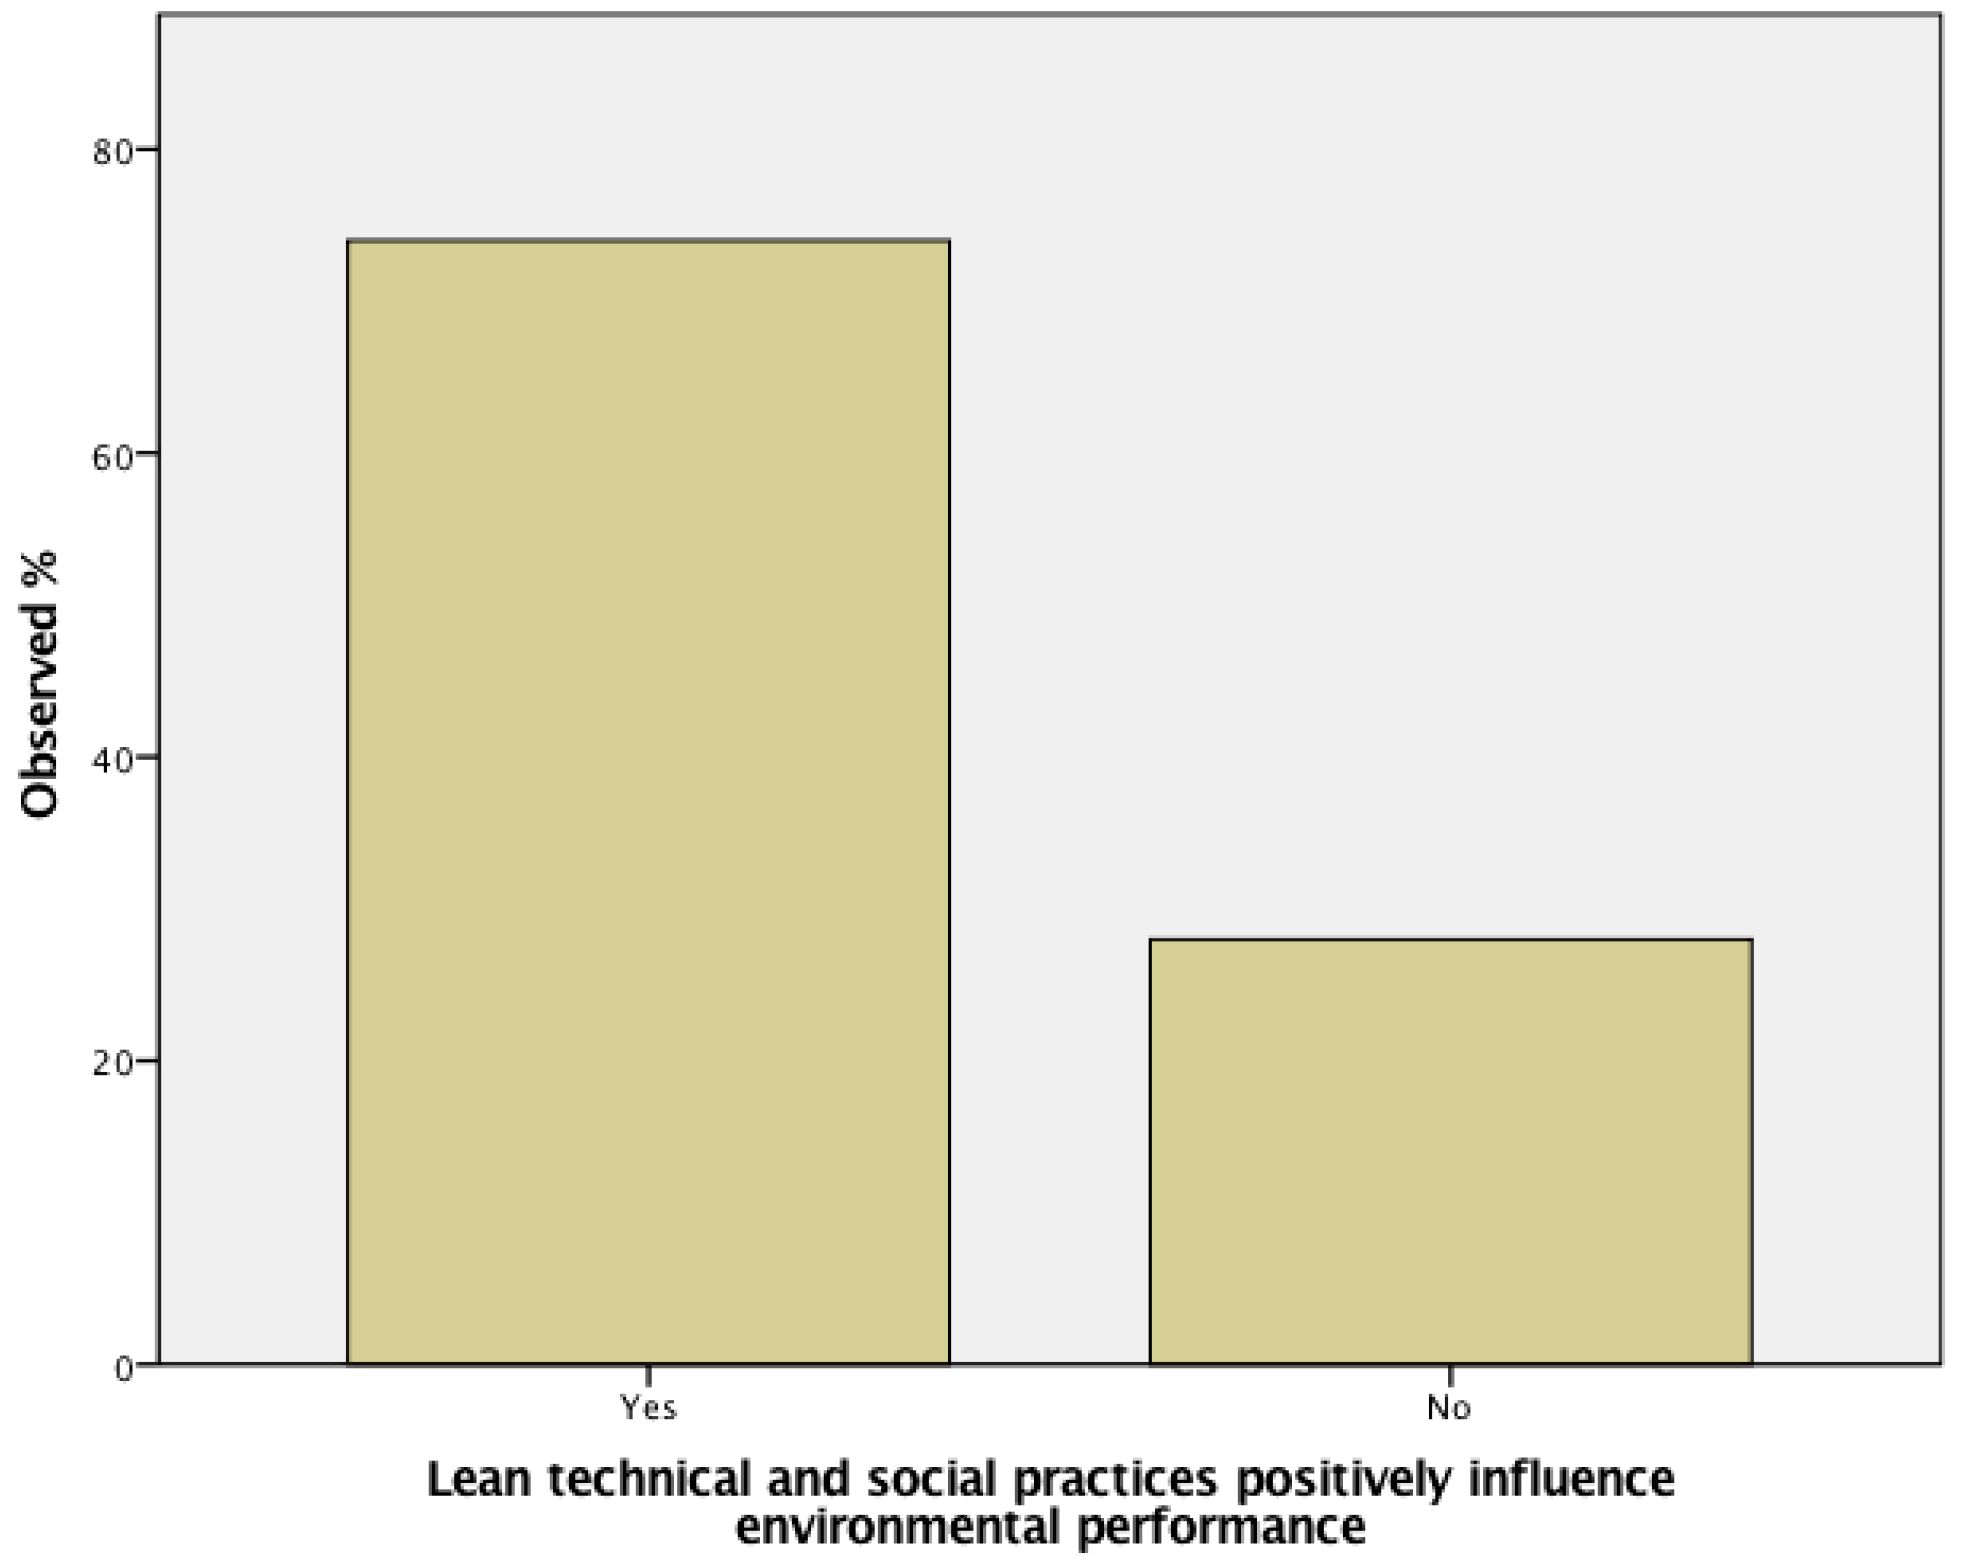
H1b: Lean technical and social practices positively influence environmental performance.
H1c: Lean technical and social practices positively influence social performance.
5.4.2. Testing the Impact of Green Practices
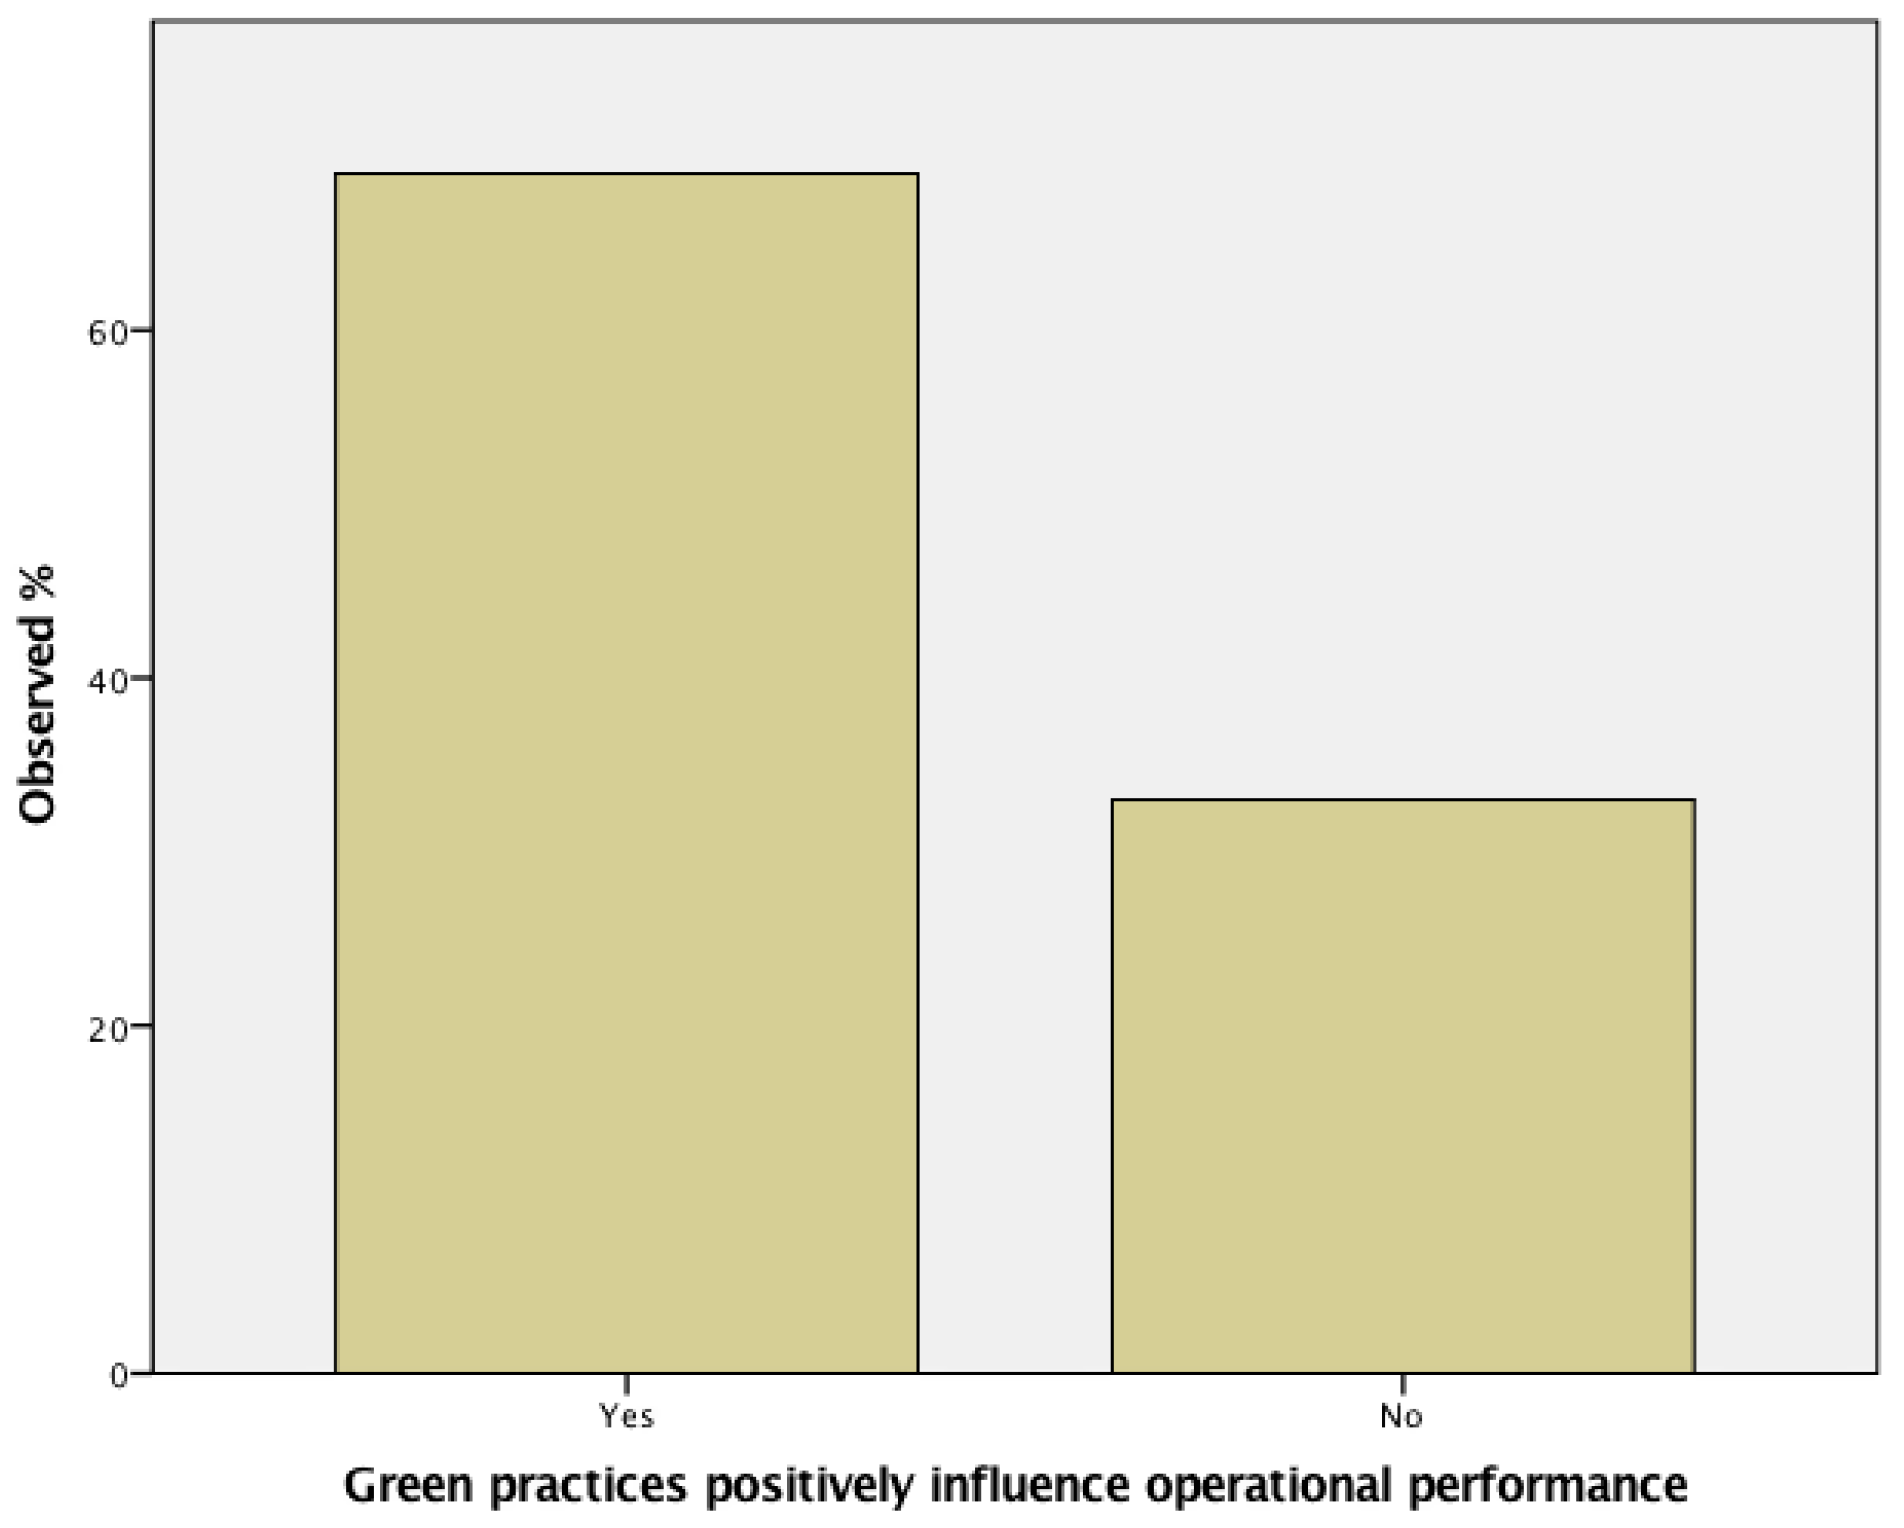
H2a: Green practices positively influence operational performance.
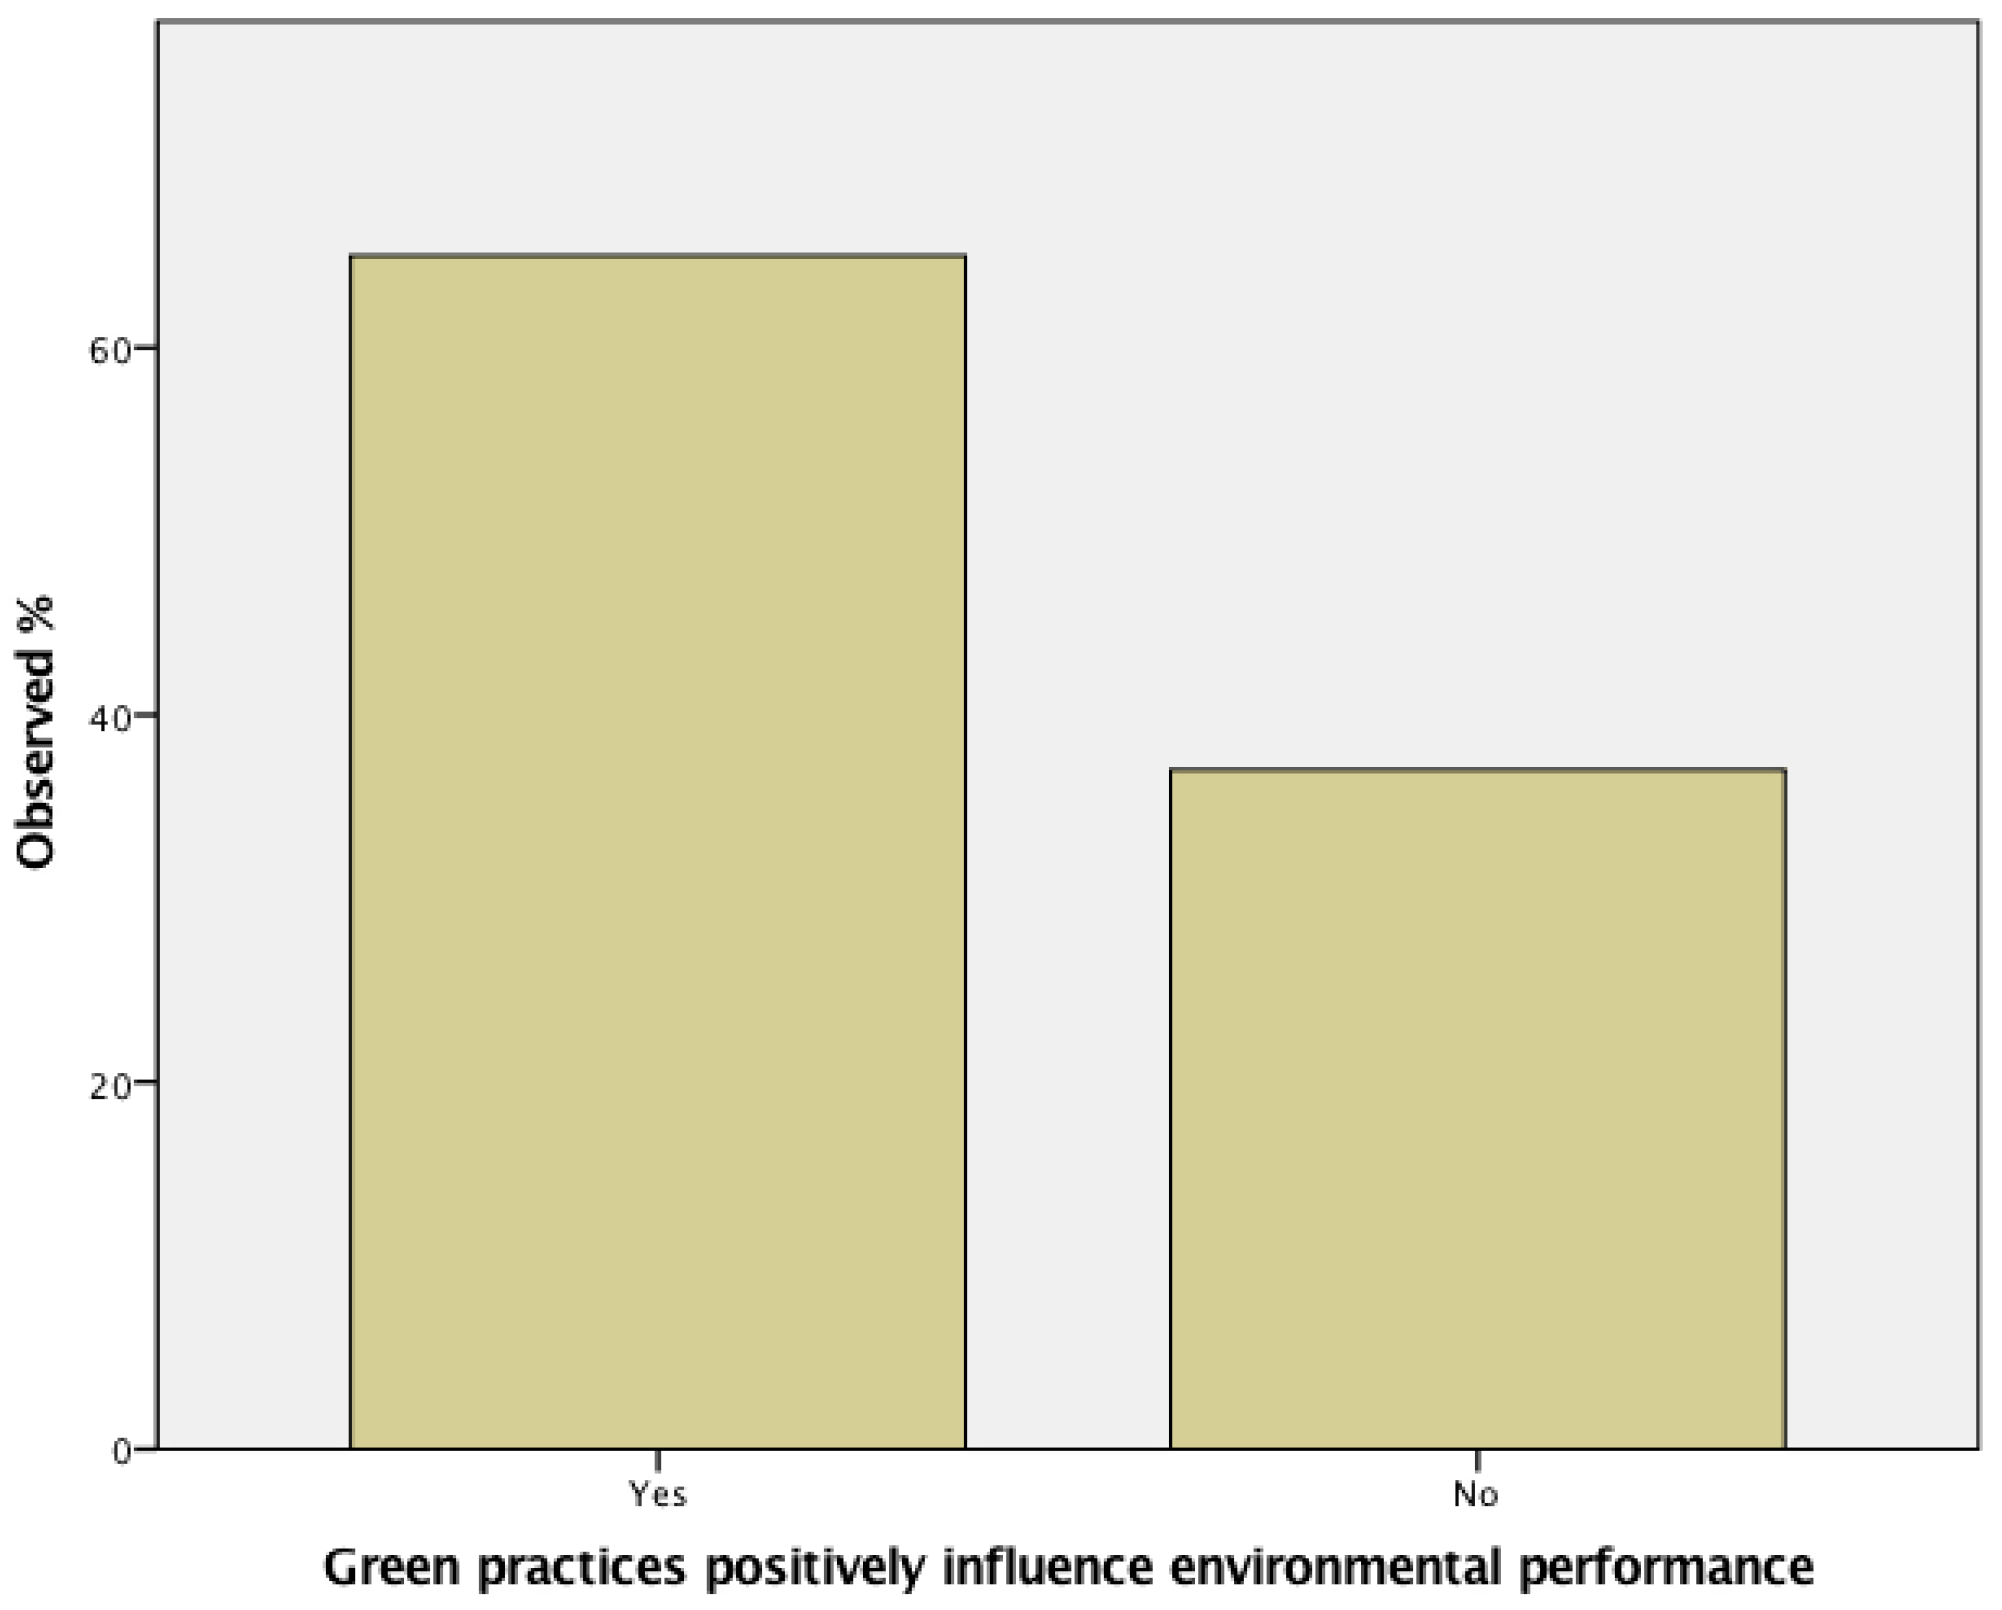
H2b: Green practices positively influence environmental performance.
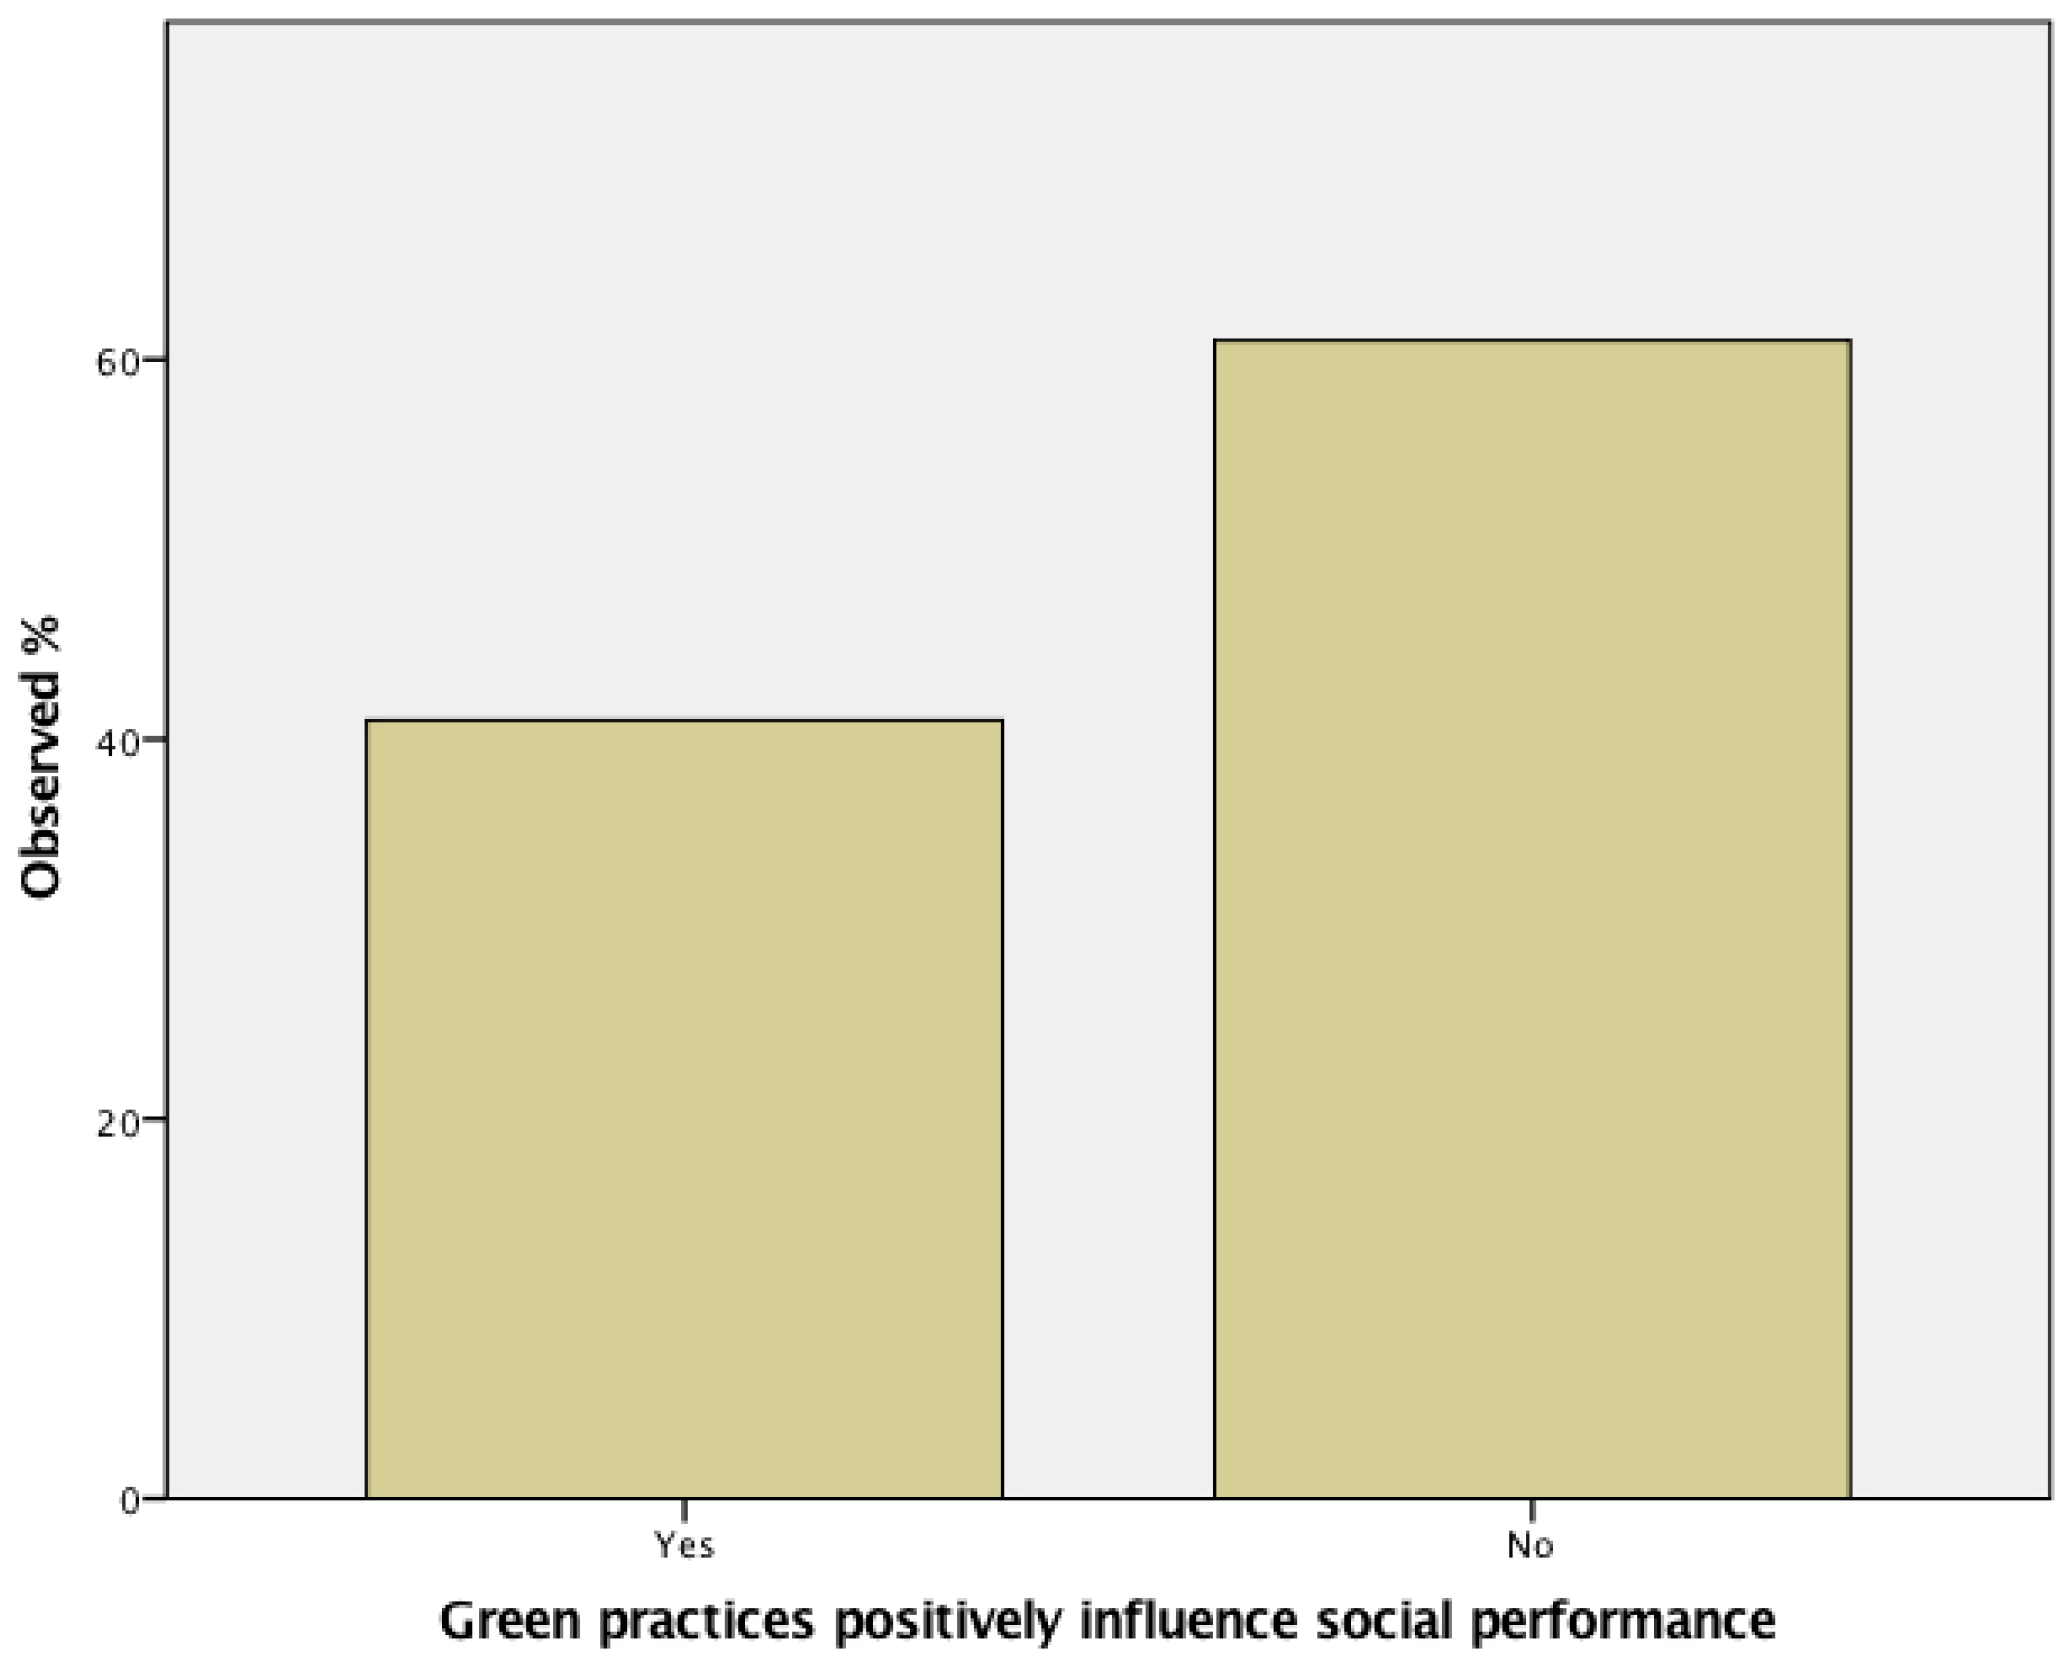
H2c: Green practices positively influence social performance.
5.4.3. Testing the Impact of Implementation of Lean-green Practices
H3a: Lean practices moderate the relationship between green practices and operational performance in such a way that the positive impact of green practices on operational performance is stronger when lean practices are implemented.
H3b: Lean practices moderate the relationship between green practices and environmental performance in such a way that the positive impact of green practices on operational performance is stronger when lean practices are implemented.
H3c: Lean practices moderate the relationship between green practices and social performance in such a way that the positive impact of green practices on operational performance is stronger when lean practices are implemented.
5.4.4. Testing the Impact of Operational Performance, Environmental Performance and Social Performance towards Financial Performance
H4: Operational performance is positively related to financial performance.
H5: Environmental performance is positively related to economic performance.
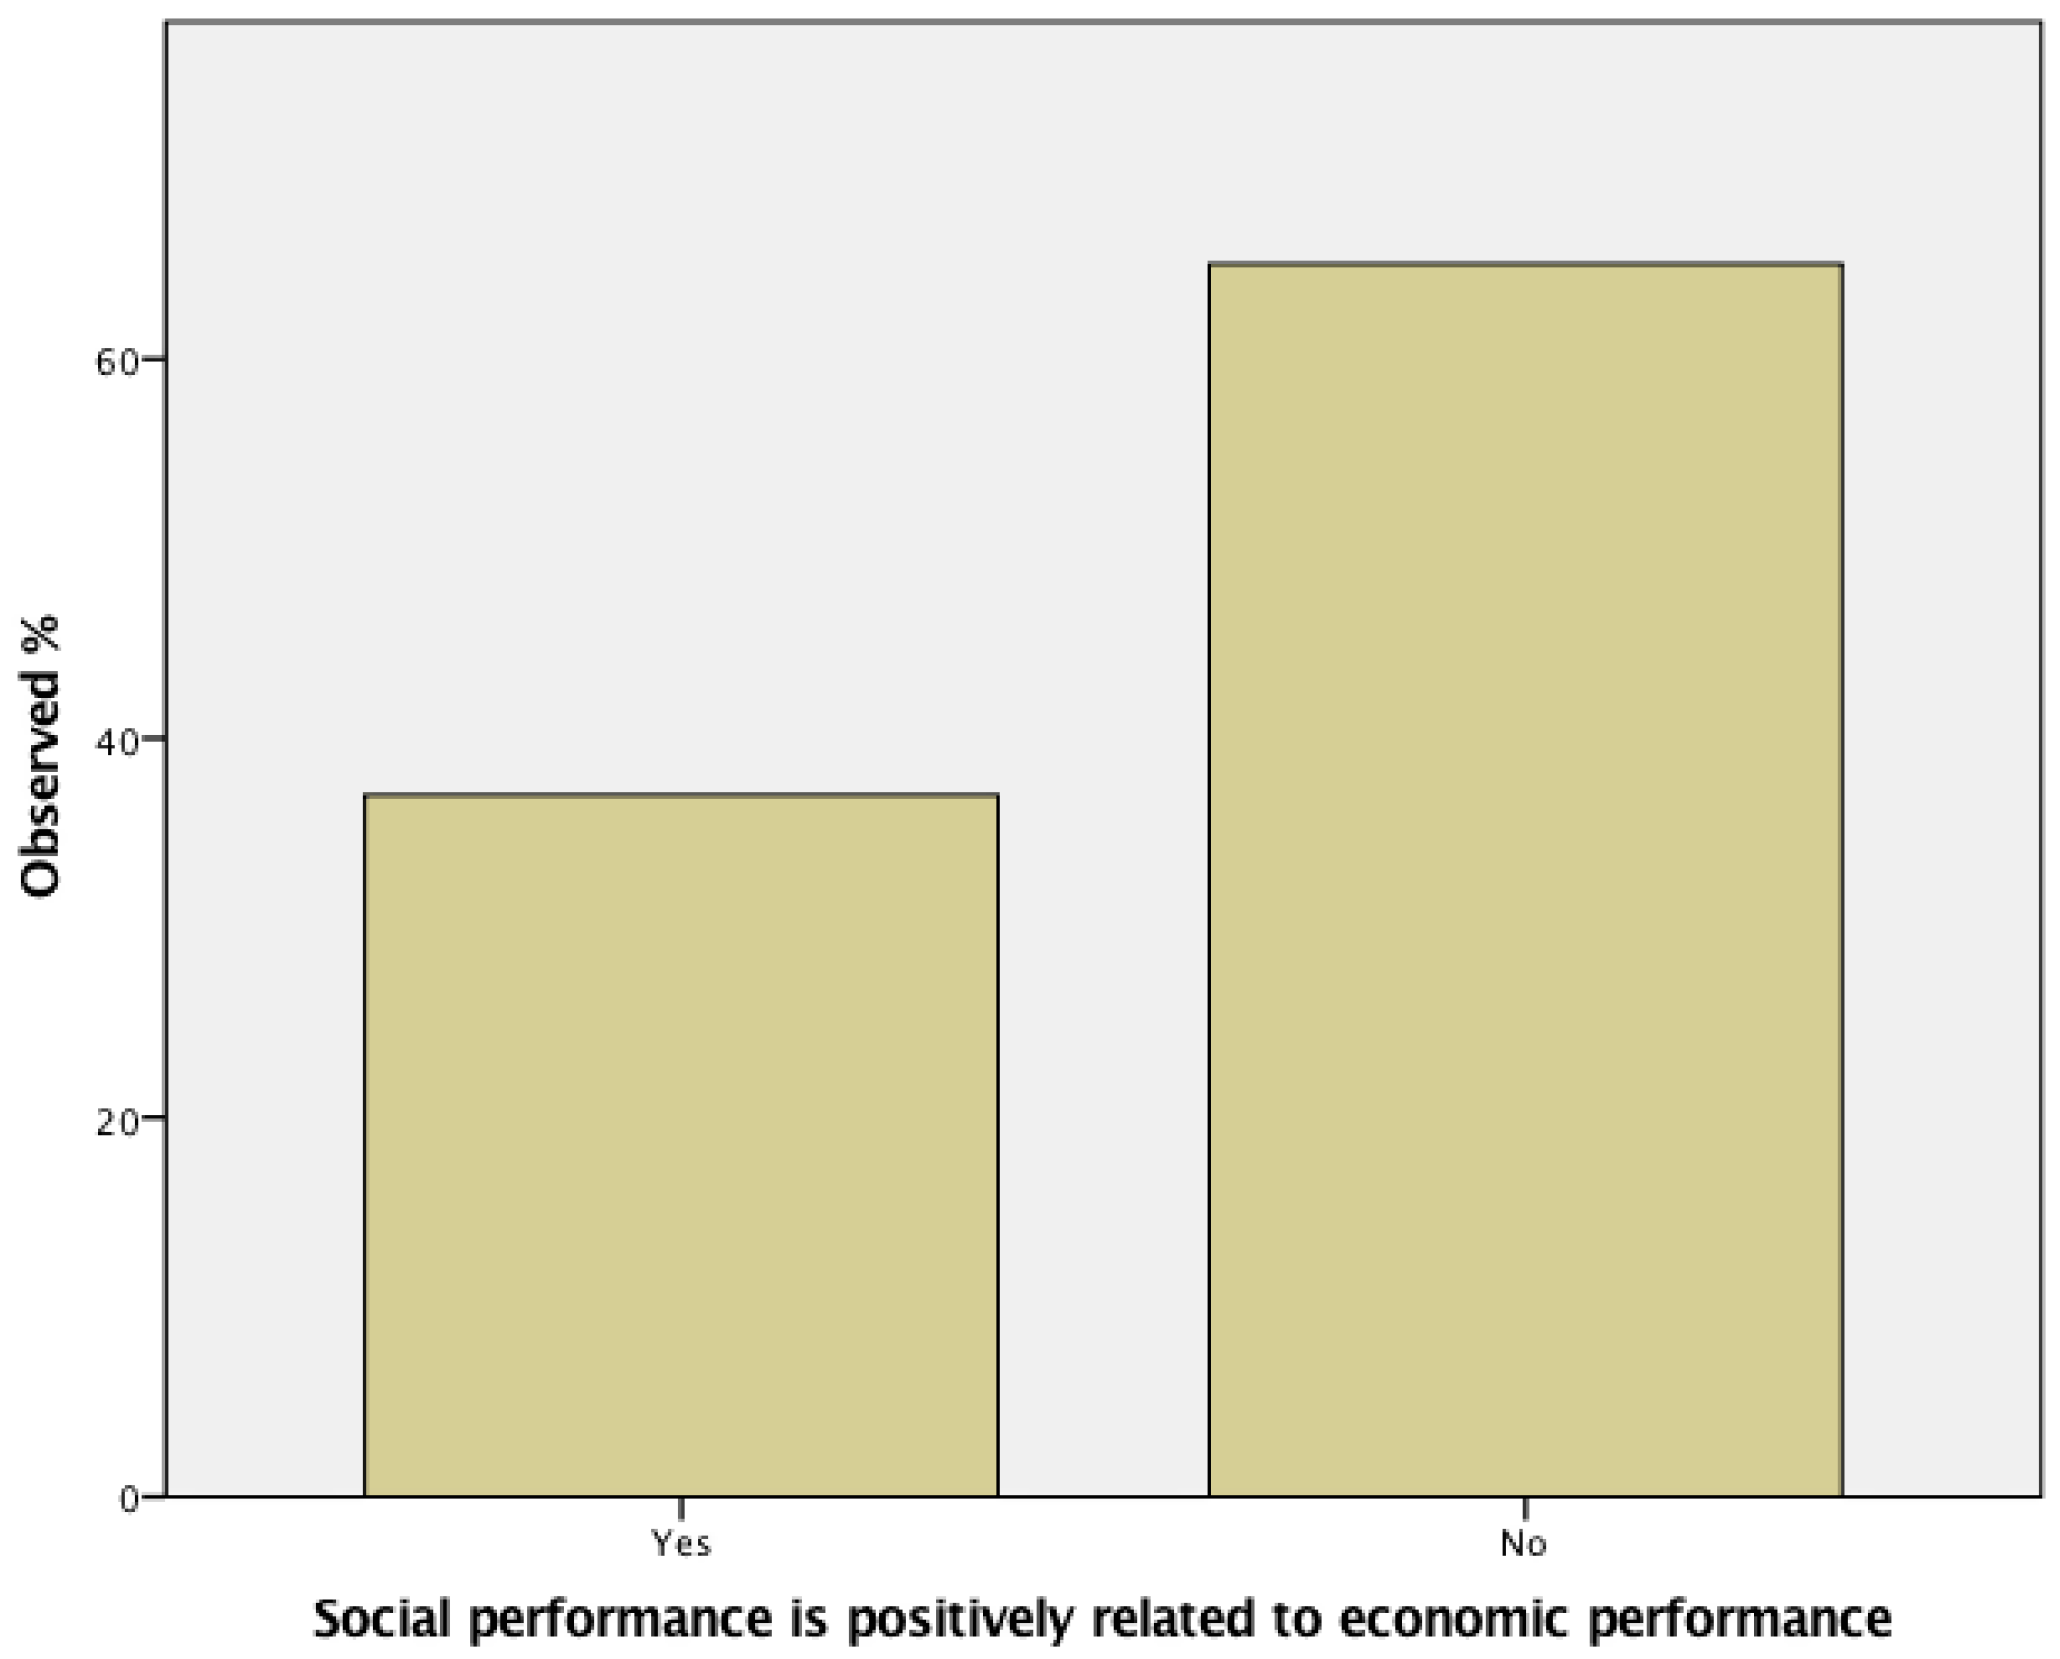
H6: Social performance is positively related to economic performance.
6. Conclusions
Author Contributions
Funding
Institutional Review Board Statement
Data Availability Statement
Conflicts of Interest
References
- Mendler, S.F.; Odell, W.; Lazarus, M.A. The HOK Guidebook to Sustainable Design. 2005. Available online: https://books.google.com/books/about/The_HOK_Guidebook_to_Sustainable_Design.html?id=chxQAAAAMAAJ (accessed on 30 November 2022).
- Digalwar, A.K.; Tagalpallewar, A.R.; Sunnapwar, V.K. Green manufacturing performance measures: An empirical investigation from Indian manufacturing industries. Meas. Bus. Excel. 2013, 17, 59–75. [Google Scholar] [CrossRef]
- Salonitis, K.; Ball, P. Energy Efficient Manufacturing from Machine Tools to Manufacturing Systems. Procedia CIRP 2013, 7, 634–639. [Google Scholar] [CrossRef] [Green Version]
- Deif, A. A system model for green manufacturing. J. Clean. Prod. 2011, 19, 1553–1559. [Google Scholar] [CrossRef] [Green Version]
- Albliwi, S.A.; Antony, J.; Arshed, N.; Ghadge, A. Implementation of Lean Six Sigma in Saudi Arabian organisations. Int. J. Qual. Reliab. Manag. 2017, 34, 508–529. [Google Scholar] [CrossRef]
- Dieste, M.; Panizzolo, R. On the Relationship between Lean Practices and Environmental Performance. IOP Conf. Ser. Earth Environ. Sci. 2018, 151, 012034. [Google Scholar] [CrossRef] [Green Version]
- Fliedner, G.; Majeske, K. Sustainability: The new lean frontier. J. Prod. Invent. Manag. 2010, 46, 6–13. [Google Scholar]
- Fliedner, G. Sustainability: A New Lean Principle. Available online: https://www.researchgate.net/publication/229040858_Sustainability_A_new_lean_principle (accessed on 30 November 2022).
- Pinto, M.J.A.; Mendes, J.V. Operational practices of lean manufacturing: Potentiating environmental improvements. J. Ind. Eng. Manag. 2017, 10, 550–580. [Google Scholar] [CrossRef] [Green Version]
- Hibadullah, S.N.; Fuzi, N.M.; Desa, A.F.N.C.; Zamri, F.I.M. Lean Manufacturing Practices and Environmental Performance in Malaysian Automotive Industry. Asian J. Financ. Account. 2012, 5, 462–471. [Google Scholar] [CrossRef] [Green Version]
- Sezen, B.; Çankaya, S.Y. Effects of Green Manufacturing and Eco-innovation on Sustainability Performance. Procedia Soc. Behav. Sci. 2013, 99, 154–163. [Google Scholar] [CrossRef] [Green Version]
- Xu, S.; Walker, H.; Nairn, A.; Johnsen, T.; Johnsen, T.A. A Network Approach to Understanding ‘Green Buying’: A Literature Review. Available online: https://hal.archives-ouvertes.fr/hal-00858349 (accessed on 30 November 2022).
- Cherrafi, A.; ElFezazi, S.; Govindan, K.; Garza-Reyes, J.A.; Benhida, K.; Mokhlis, A. A framework for the integration of Green and Lean Six Sigma for superior sustainability performance. Int. J. Prod. Res. 2016, 55, 4481–4515. [Google Scholar] [CrossRef]
- Rehman, M.A.; Shrivastava, R. Green manufacturing (GM): Past, present and future (a state of art review). World Rev. Sci. Technol. Sustain. Dev. 2013, 10, 17–55. [Google Scholar] [CrossRef]
- Karp, H.R. Green suppliers network: Strengthening and Greening the manufacturing supply base. Environ. Qual. Manag. 2005, 15, 37–46. [Google Scholar] [CrossRef]
- Marhani, M.A.; Jaapar, A.; Bari, N.A.A.; Zawawi, M. Sustainability Through Lean Construction Approach: A Literature Review. Procedia Soc. Behav. Sci. 2013, 101, 90–99. [Google Scholar] [CrossRef] [Green Version]
- Garza-Reyes, J.A. Lean and green—A systematic review of the state of the art literature. J. Clean. Prod. 2015, 102, 18–29. [Google Scholar] [CrossRef] [Green Version]
- Abualfaraa, W.; Salonitis, K.; Al-Ashaab, A.; Ala’Raj, M. Lean-Green Manufacturing Practices and Their Link with Sustainability: A Critical Review. Sustainability 2020, 12, 981. [Google Scholar] [CrossRef] [Green Version]
- Teixeira, P.; Sá, J.; Silva, F.; Ferreira, L.; Santos, G.; Fontoura, P. Connecting lean and green with sustainability towards a conceptual model. J. Clean. Prod. 2021, 322, 129047. [Google Scholar] [CrossRef]
- Globalization Impacts Small Business|BusinessBlogs Hub. Available online: https://www.businessblogshub.com/2017/05/5-ways-how-globalization-impacts-small-businesses/ (accessed on 30 November 2022).
- Leong, W.D.; Lam, H.L.; Ng, W.P.Q.; Lim, C.H.; Tan, C.P.; Ponnambalam, S.G. Lean and Green Manufacturing—A Review on its Applications and Impacts. Process Integr. Optim. Sustain. 2019, 3, 5–23. [Google Scholar] [CrossRef]
- Arora, A.; Singh, V.K.; Rathi, R. Sustainable Lean and Green Manufacturing: An Empirical Review of Their Strategies. In Advances in Functional and Smart Materials; Springer: Singapore, 2023; pp. 1–11. [Google Scholar] [CrossRef]
- Dickson, E.W.; Singh, S.; Cheung, D.S.; Wyatt, C.C.; Nugent, A. Application of Lean Manufacturing Techniques in the Emergency Department. J. Emerg. Med. 2009, 37, 177–182. [Google Scholar] [CrossRef]
- Ikatrinasari, Z.F.; Hasibuan, S.; Kosasih, K. The Implementation Lean and Green Manufacturing through Sustainable Value Stream Mapping. IOP Conf. Ser. Mater. Sci. Eng. 2018, 453, 012004. [Google Scholar] [CrossRef]
- Pető, O. Lean in the Aspect of Sustainability. Theory Methodol. Pract. Rev. Bus. Manag. 2012, 8, 54–58. Available online: https://ojs.uni-miskolc.hu/index.php/tmp/article/view/1415 (accessed on 30 November 2022).
- Singh, C.; Singh, D.; Khamba, J. Analyzing barriers of Green Lean practices in manufacturing industries by DEMATEL approach. J. Manuf. Technol. Manag. 2020, 32, 176–198. [Google Scholar] [CrossRef]
- Chen, Y.-S. The Driver of Green Innovation and Green Image—Green Core Competence. J. Bus. Ethic. 2008, 81, 531–543. [Google Scholar] [CrossRef]
- Verrier, B.; Rose, B.; Caillaud, E. Lean and Green strategy: The Lean and Green House and maturity deployment model. J. Clean. Prod. 2016, 116, 150–156. [Google Scholar] [CrossRef]
- Inman, R.A.; Green, K.W. Lean and green combine to impact environmental and operational performance. Int. J. Prod. Res. 2018, 56, 4802–4818. [Google Scholar] [CrossRef]
- Gaikwad, L.; Sunnapwar, V. An integrated Lean, Green and Six Sigma strategies. TQM J. 2020, 32, 201–225. [Google Scholar] [CrossRef]
- Maruthi, G.D.; Rashmi, R. Green Manufacturing: It’s Tools and Techniques that can be implemented in Manufacturing Sectors. Mater. Today: Proc. 2015, 2, 3350–3355. [Google Scholar] [CrossRef]
- Garza-Reyes, J.A. Green lean and the need for Six Sigma. Int. J. Lean Six Sigma 2015, 6, 226–248. [Google Scholar] [CrossRef]
- Prasad, S.; Neelakanteswara, R.A.; Lanka, K. Modelling and Analysis of Barriers in Lean Green Manufacturing Implementation: An ISM Approach. In Proceedings of the International Conference on Industrial and Manufacturing Systems (CIMS-2020); Springer: Cham, Switzerland, 2022; pp. 93–116. [Google Scholar] [CrossRef]
- Marco-Ferreira, A.; Stefanelli, N.; Seles, B.; Fidelis, R. Lean and Green: Practices, paradigms and future prospects. Benchmarking 2020, 27, 2077–2107. [Google Scholar] [CrossRef]
- Ahmad, S.; Abdullah, A.; Talib, F. Lean-green performance management in Indian SMEs: A novel perspective using the best-worst method approach. Benchmarking Int. J. 2020, 28, 737–765. [Google Scholar] [CrossRef]
- Teixeira, P.; Coelho, A.; Fontoura, P.; Sá, J.C.; Silva, F.J.G.; Santos, G.; Ferreira, L.P. Combining lean and green practices to achieve a superior performance: The contribution for a sustainable development and competitiveness—An empirical study on the Portuguese context. Corp. Soc. Responsib. Environ. Manag. 2022, 29, 887–903. [Google Scholar] [CrossRef]
- Kushwaha, D.; Talib, F. Ranking of Barriers to Green Manufacturing Implementation in SMEs Using Best-Worst Method. IOP Conf. Ser. Mater. Sci. Eng. 2020, 748, 012017. [Google Scholar] [CrossRef]
- Mackenzie, N.M.; Knipe, S. Research dilemmas: Paradigms, methods and methodology. Issues Educ. Res. 2006, 16, 193–205. [Google Scholar]
- Saunders, M.; Lewil, P.; Thornhill, A. Research Methods for Business Students. 2017, pp. 1–624. Available online: https://books.google.com/books/about/Research_Methods_for_Business_Students.html?id=43wDBmAKzA4C (accessed on 30 November 2022).
- Validating a Questionnaire—Methodspace. Available online: https://www.methodspace.com/blog/validating-a-questionnaire (accessed on 30 November 2022).
- Bortolini, M.; Ferrari, E.; Galizia, F.; Mora, C. A Reference Framework Integrating Lean and Green Principles within Supply Chain Management. Int. J. Econ. Manag. Eng. 2016, 10, 895–900. [Google Scholar]
- Khanchanapong, T.; Prajogo, D.; Sohal, A.S.; Cooper, B.K.; Yeung, A.C.; Cheng, T. The unique and complementary effects of manufacturing technologies and lean practices on manufacturing operational performance. Int. J. Prod. Econ. 2014, 153, 191–203. [Google Scholar] [CrossRef]
- Doraa, M.; Kumar, M.; Van Goubergena, D.; Molnara, A.; Gellyncka, X. Operational performance and critical success fac-tors of lean manufacturing in European food processing SMEs. Trends Food Sci. Technol. 2013, 31, 156–164. [Google Scholar] [CrossRef]
- Chavez, R.; Yu, W.; Jacobs, M.; Fynes, B.; Wiengarten, F.; Lecuna, A. Internal lean practices and performance: The role of technological turbulence. Int. J. Prod. Econ. 2015, 160, 157–171. [Google Scholar] [CrossRef] [Green Version]
- Kurdve, M.; Hanarp, P.; Chen, X.; Qiu, X.; Zhang, Y.; Stahre, J.; Laring, J. Use of environmental value stream mapping and environmental loss analysis in lean manufacturing work at Volvo. In Proceedings of the 4th Swedish Production Symposium, Lund, Sweden, 3–5 May 2011. [Google Scholar]
- Prajogo, D.I.; McDermott, C.M. The relationship between total quality management practices and organizational culture. Int. J. Oper. Prod. Manag. 2005, 25, 1101–1122. [Google Scholar] [CrossRef]
- Bortolotti, T.; Boscari, S.S.; Danese, P. Successful lean implementation: Organizational culture and soft lean practices. Int. J. Prod. Econ. 2015, 160, 182–201. [Google Scholar] [CrossRef] [Green Version]
- Forza, C. Work organization in lean production and traditional plants: What are the differences? Int. J. Oper. Prod. Manag. 1996, 16, 42–62. [Google Scholar] [CrossRef]
- Shah, R.; Ward, P. Lean manufacturing: Context, practice bundles, and performance. J. Oper. Manag. 2003, 21, 129–149. [Google Scholar] [CrossRef] [Green Version]
- Rahman, N.A.; Sariwati, M.; Mashitah, M. Lean Manufacturing Case Study with Kanban System Implementation. Procedia Econom. Financ. 2013, 7, 174–180. [Google Scholar] [CrossRef] [Green Version]
- Fotopoulos, B.; Psomas, E. The impact of “soft” and “hard” TQM elements on quality management results. Int. J. Qual. Reliab. Manag. 2009, 26, 150–163. [Google Scholar] [CrossRef]
- Cali, J. TQM for Purchasing Management; McGraw-Hill: New York, NY, USA, 1993. [Google Scholar]
- Blackburn, R.; Rosen, B. Total quality and human resources management: Lessons learned from Baldrige Award-winning companies. Acad. Manag. Perspect. 1993, 7, 49–66. [Google Scholar] [CrossRef]
- Syrek, I.; Gul, M. Factors Affecting Green Purchasing Behavior: A Study of Turkish Consumers. Int. J. Acad. Res. Bus. Soc. Sci. 2017, 7, 306–319. [Google Scholar] [CrossRef]
- Trist, E.L. The Evolution of Socio-Technical Systems: A Conceptual Framework and an Action Research Program; Ontario Quality of Working Life Center: Toronto, ON, Canada, 1981. [Google Scholar]
- He, Y.; Liu, F.; Shi, J. A framework of scheduling models in machining workshop for Green manufacturing. J. Adv. Manuf. Syst. 2008, 7, 319–322. [Google Scholar] [CrossRef]
- Roman, F.; Bras, B. Towards an effective approach to reduce manufacturing environmental burdens via process planning. In Proceedings of the International Mechanical Engineering Congress and Exposition, Orlando, FL, USA, 5–11 November 2005. [Google Scholar]
- Hernández, R.G.; Garcia, P.; Robles, J.L.; Beruvides, M.; Hernandez, D.G. An Economic Framework for total productive maintenance (TPM). In Proceedings of the Industrial and Systems Engineering Research Conference (ISERC), Orlando, FL, USA, 19–23 May 2012. [Google Scholar]
- John, W.C. Research Design: Qualitative, Quantitative and Mixed Methods Approaches (4th ed.). Available online: https://fe.unj.ac.id/wp-content/uploads/2019/08/Research-Design_Qualitative-Quantitative-and-Mixed-Methods-Approaches.pdf (accessed on 30 November 2022).
- Kim, H.-Y. Statistical notes for clinical researchers: Assessing normal distribution (2) using skewness and kurtosis. Restor. Dent. Endod. 2013, 38, 52–54. [Google Scholar] [CrossRef]
- Razali, N.; Wah, Y.B. Power Comparisons of Shapiro-Wilk, Kolmogorov-Smirnov, Lilliefors and Ander-son-Darling Tests. J. Stat. Model. Anal. 2011, 2, 21–33. Available online: https://www.scirp.org/reference/ReferencesPapers.aspx?ReferenceID=1671187 (accessed on 30 November 2022).
- Ghasemi, A.; Zahediasl, S. Normality Tests for Statistical Analysis: A Guide for Non-Statisticians. Int. J. Endocrinol. Metab. 2012, 10, 486–489. [Google Scholar] [CrossRef] [PubMed] [Green Version]
- Tehseen, S.; Ramayah, T.; Sajilan, S. Testing and Controlling for Common Method Variance: A Review of Available Methods. J. Manag. Sci. 2017, 4, 142–168. [Google Scholar] [CrossRef] [Green Version]
- Carlson, K.D.; Herdman, A.O. Understanding the Impact of Convergent Validity on Research Results. Organ. Res. Methods 2010, 15, 17–32. [Google Scholar] [CrossRef]
- Karim, M.A.; Aljuhani, M.; Duplock, R.; Yarlagadda, P. Implementation of Lean Manufacturing in Saudi Manufacturing Organisations: An Empirical Study. Adv. Mater. Res. 2011, 339, 250–253. [Google Scholar] [CrossRef] [Green Version]
- Banawi, A.-A.; Bilec, M. Applying Lean, Green, and Six-Sigma Framework to Improve Exterior Construction Process in Saudi Arabia. J. Constr. Eng. Proj. Manag. 2014, 4, 12–22. [Google Scholar] [CrossRef] [Green Version]
- Mandurah, S.; Khatib, J.; Al-Sabaan, S. Corporate Social Responsibility Among Saudi Arabian Firms: An Empirical Investigation. J. Appl. Bus. Res. (JABR) 2012, 28, 1049–1058. [Google Scholar] [CrossRef]
- Wu, L.; Subramanian, N.; Abdulrahman, M.D.; Liu, C.; Lai, K.-H.; Pawar, K.S. The Impact of Integrated Practices of Lean, Green, and Social Management Systems on Firm Sustainability Performance—Evidence from Chinese Fashion Auto-Parts Suppliers. Sustainability 2015, 7, 3838–3858. [Google Scholar] [CrossRef] [Green Version]
- Duarte, S.; Cruz-Machado, V. Modelling lean and green: A review from business models. Int. J. Lean Six Sigma 2013, 4, 228–250. [Google Scholar] [CrossRef]
- Khan, S.; Al-Maimani, K.; Al-Yafi, W.A. Exploring Corporate Social Responsibility in Saudi Arabia: The Challenges Ahead. J. Leadersh. Account. Ethics 2013, 10, 65–78. [Google Scholar]
- Protopappa-Sieke, M.; Seifert, R.W. Interrelating operational and financial performance measurements in inventory control. Eur. J. Oper. Res. 2010, 204, 439–448. [Google Scholar] [CrossRef]
- Jabbour, C.J.C.; Jabbour, A.B.L.D.S.; Govindan, K.; Teixeira, A.A.; Freitas, W.R.D.S. Environmental management and operational performance in automotive companies in Brazil: The role of human resource management and lean manufacturing. J. Clean. Prod. 2013, 47, 129–140. [Google Scholar] [CrossRef]
- Mcwilliams, A.; Siegel, D. Research notes and communications corporate social responsibility and financial performance: Correlation or misspecification? Strateg. Manag. J. Strat. Mgmt. J. 2000, 21, 603–609. [Google Scholar] [CrossRef]


| No | Hypothesis | Type of Hypothesised Relationship |
|---|---|---|
| H1a | Lean technical and social practices positively influence operational performance. | Direct (+) |
| H1b | Lean technical and social practices positively influence environmental performance. | Direct (+) |
| H1c | Lean technical and social practices positively influence social performance. | Direct (+) |
| H2a | Green practices positively influence operational performance. | Direct (+) |
| H2b | Green practices positively influence environmental performance. | Direct (+) |
| H2c | Green practices positively influence social performance. | Direct (+) |
| H3a | Lean practices moderate the relationship between green practices and operational performance in such a way that the positive impact of green practices on operational performance is stronger when lean practices are implemented. | Interaction (+) |
| H3b | Lean practices moderate the relationship between green practices and environmental performance in such a way that the positive impact of green practices on operational performance is stronger when lean practices are implemented. | Interaction (+) |
| H3c | Lean practices moderate the relationship between green practices and social performance in such a way that the positive impact of green practices on operational performance is stronger when lean practices are implemented. | Interaction (+) |
| H4 | Operational performance is positively related to economic performance. | Direct (+) |
| H5 | Environmental performance is positively related to economic performance. | Direct (+) |
| H6 | Social performance is positively related to economic performance. | Direct (+) |
| Hypothesis |
|---|
| Lean practices towards Operational Performance → 27 questions |
| Lean practices towards Environmental Performance → 17 questions |
| Lean Practices towards Social Performance → 27 questions |
| Green Practices towards Operational Performance → 26 questions |
| Green practices towards Environmental Performance → 29 questions |
| Green Practices towards Social Performance → 15 questions |
| Lean-green Approach: Understanding → 49 questions |
| Lean-green Approach towards Operational Performance → 12 questions |
| Lean-green Approach towards Environmental Performance → 6 questions |
| Lean-green Approach towards Social Performance → 10 questions |
| Operational Performance towards Financial Performance → 9 questions |
| Environmental Performance towards Financial Performance → 4 questions |
| Social Performance towards Financial Performance → 8 questions |
| Job Position | Count | N % |
|---|---|---|
| Tech Engineer | 25 | 24.5% |
| Chemical Analyst | 3 | 2.9% |
| Department Chief | 3 | 2.9% |
| Production | 21 | 20.6% |
| Engineer | 14 | 13.7% |
| Manager | 7 | 6.9% |
| Operations | 17 | 16.7% |
| Department Manager | 2 | 2.0% |
| Account | 2 | 2.0% |
| Assistant | 2 | 2.0% |
| Driver | 2 | 2.0% |
| Technician | 4 | 3.9% |
| Dependent Variable (DV) Description | DV Number |
|---|---|
| Lean practices towards Operational Performance | DV1 |
| Lean practices towards Environmental Performance | DV2 |
| Lean Practices towards Social Performance | DV3 |
| Green Practices towards Operational Performance | DV4 |
| Green practices towards Environmental Performance | DV5 |
| Green Practices towards Social Performance | DV6 |
| Lean-green Approach: Understanding | DV7 |
| Lean-green Approach towards Operational Performance | DV8 |
| Lean-green Approach towards Environmental Performance | DV9 |
| Lean-green Approach towards Social Performance | DV10 |
| Operational Performance towards Financial Performance | DV11 |
| Environmental Performance towards Financial Performance | DV12 |
| Social Performance towards Financial Performance | DV13 |
| Skewness | Kurtosis | Kolmogorov–Smirnov | Shapiro–Wilk | |||||
|---|---|---|---|---|---|---|---|---|
| Statistic | Std. Error | Z-Score | Statistic | Std. Error | Z-Score | Sig. (p Value) | Sig. (p Value) | |
| DV1 | −0.578 | 0.239 | −2.410 | 1.171 | 0.474 | 2.470 | <0.001 | <0.001 |
| DV2 | −0.790 | 0.239 | −3.305 | 0.149 | 0.474 | 0.314 * | <0.001 | <0.001 |
| DV3 | −0.221 | 0.239 | −0.925 * | 1.596 | 0.474 | 3.367 | <0.001 | <0.001 |
| DV4 | −1.047 | 0.239 | −4.381 | 0.844 | 0.474 | 1.781 * | <0.001 | <0.001 |
| DV5 | −0.843 | 0.239 | −3.527 | 1.070 | 0.474 | 2.258 | <0.001 | <0.001 |
| DV6 | 0.015 | 0.239 | 0.063 * | 0.008 | 0.474 | 0.017 * | <0.001 | 0.015 |
| DV7 | −0.446 | 0.239 | −1.866 * | 1.445 | 0.474 | 3.049 | <0.001 | <0.001 |
| DV8 | 2.019 | 0.239 | 8.448 | 12.142 | 0.474 | 25.616 | <0.001 | <0.001 |
| DV9 | −0.003 | 0.239 | −0.013 * | 0.543 | 0.474 | 1.146 * | <0.001 | 0.01 |
| DV10 | −0.735 | 0.239 | −3.075 | 0.826 | 0.474 | 1.743 * | <0.001 | <0.001 |
| DV11 | −0.481 | 0.239 | −2.013 | 1.346 | 0.474 | 2.840 | <0.001 | <0.001 |
| DV12 | 0.141 | 0.239 | 0.590 * | 1.746 | 0.474 | 3.684 | <0.001 | <0.001 |
| DV13 | −0.337 | 0.239 | −1.410 * | 0.669 | 0.474 | 1.411 | <0.001 | <0.001 |
| Kendall’s Tau | DV2 | DV3 | DV4 | DV5 | DV6 | DV7 | DV8 | DV9 | DV10 | DV11 | DV12 | DV13 |
|---|---|---|---|---|---|---|---|---|---|---|---|---|
| DV1 | 0.317 | 0.646 | 0.334 | 0.374 | 0.445 | 0.232 | 0.425 | 0.270 | 0.652 | 0.313 | 0.345 | 0.312 |
| DV2 | 0.433 | 0.524 | 0.479 | 0.372 | 0.421 | 0.500 | 0.557 | 0.393 | 0.442 | 0.209 | 0.472 | |
| DV3 | 0.363 | 0.434 | 0.422 | 0.301 | 0.562 | 0.338 | 0.676 | 0.458 | 0.442 | 0.246 | ||
| DV4 | 0.584 | 0.262 | 0.474 | 0.296 | 0.350 | 0.401 | 0.237 | 0.437 | 0.387 | |||
| DV5 | 0.133 | 0.436 | 0.450 | 0.416 | 0.279 | 0.335 | 0.312 | 0.287 | ||||
| DV6 | 0.424 | 0.297 | 0.438 | 0.577 | 0.585 | 0.250 | 0.558 | |||||
| DV7 | 0.096 | 0.496 | 0.214 | 0.415 | 0.240 | 0.323 | ||||||
| DV8 | 0.478 | 0.461 | 0.418 | 0.283 | 0.446 | |||||||
| DV9 | 0.306 | 0.394 | −0.051 | 0.441 | ||||||||
| DV10 | 0.452 | 0.529 | 0.357 | |||||||||
| DV11 | 0.363 | 0.570 | ||||||||||
| DV12 | 0.228 | |||||||||||
| DV13 |
| Skewness | Kurtosis | Kolmogorov–Smirnov | Shapiro–Wilk | |||||
|---|---|---|---|---|---|---|---|---|
| Statistic | Std. Error | Z-Score | Statistic | Std. Error | Z-Score | Sig. (p Value) | Sig. (p Value) | |
| DV1 | −0.578 | 0.239 | −2.410 | 1.171 | 0.474 | 2.470 | <0.001 | <0.001 |
| DV2 | −0.790 | 0.239 | −3.305 | 0.149 | 0.474 | 0.314 * | <0.001 | <0.001 |
| DV3 | −0.221 | 0.239 | −0.925 * | 1.596 | 0.474 | 3.367 | <0.001 | <0.001 |
| DV4 | −1.047 | 0.239 | −4.381 | 0.844 | 0.474 | 1.781 * | <0.001 | <0.001 |
| DV5 | −0.843 | 0.239 | −3.527 | 1.070 | 0.474 | 2.258 | <0.001 | <0.001 |
| DV6 | 0.015 | 0.239 | 0.063* | 0.008 | 0.474 | 0.017 * | <0.001 | 0.015 |
| DV7 | −0.446 | 0.239 | −1.866 * | 1.445 | 0.474 | 3.049 | <0.001 | <0.001 |
| DV8 | 2.019 | 0.239 | 8.448 | 12.142 | 0.474 | 25.616 | <0.001 | <0.001 |
| DV9 | −0.003 | 0.239 | −0.013 * | 0.543 | 0.474 | 1.146 * | <0.001 | 0.01 |
| DV10 | −0.735 | 0.239 | −3.075 | 0.826 | 0.474 | 1.743 * | <0.001 | <0.001 |
| DV11 | −0.481 | 0.239 | −2.013 | 1.346 | 0.474 | 2.840 | <0.001 | <0.001 |
| DV12 | 0.141 | 0.239 | 0.590 * | 1.746 | 0.474 | 3.684 | <0.001 | <0.001 |
| DV13 | −0.337 | 0.239 | −1.410 * | 0.669 | 0.474 | 1.411 | <0.001 | <0.001 |
| Factor | Initial Eigenvalues | Extraction Sums of Squared Loadings | ||||
|---|---|---|---|---|---|---|
| Total | % of Variance | Cumulative % | Total | % of Variance | Cumulative % | |
| 1 | 9.832 | 75.628 | 75.628 | 9.602 | 73.865 | 73.865 |
| 2 | 0.851 | 6.549 | 82.178 | |||
| 3 | 0.633 | 4.873 | 87.050 | |||
| 4 | 0.469 | 3.606 | 90.656 | |||
| 5 | 0.348 | 2.680 | 93.336 | |||
| 6 | 0.220 | 1.689 | 95.025 | |||
| 7 | 0.192 | 1.476 | 96.501 | |||
| 8 | 0.133 | 1.024 | 97.526 | |||
| 9 | 0.127 | 0.981 | 98.506 | |||
| 10 | 0.092 | 0.711 | 99.217 | |||
| 11 | 0.045 | 0.346 | 99.562 | |||
| 12 | 0.033 | 0.256 | 99.818 | |||
| 13 | 0.024 | 0.182 | 100.000 | |||
| Cronbach’s Alpha | Cronbach’s Alpha Based on Standardized Items | No. of Items |
|---|---|---|
| 0.962 | 0.972 | 13 |
| Scale Mean if Item Deleted | Scale Variance if Item Deleted | Corrected Item-Total Correlation | Cronbach’s Alpha if Item Deleted | |
|---|---|---|---|---|
| Lean practices towards Operational Performance | 35.1870 | 57.730 | 0.897 | 0.958 |
| Lean practices towards Environmental Performance | 35.1123 | 56.950 | 0.853 | 0.958 |
| Lean Practices towards Social Performance | 35.3104 | 57.473 | 0.923 | 0.957 |
| Green Practices towards Operational Performance | 35.0186 | 56.807 | 0.866 | 0.958 |
| Green practices towards Environmental Performance | 35.1188 | 57.099 | 0.888 | 0.958 |
| Green Practices towards Social Performance | 35.3410 | 57.393 | 0.804 | 0.959 |
| Lean-green Approach: Understanding | 35.1664 | 56.580 | 0.906 | 0.957 |
| Lean-green Approach towards Operational Performance | 35.1428 | 53.086 | 0.664 | 0.969 |
| Lean-green Approach towards Environmental Performance | 35.2081 | 56.653 | 0.796 | 0.959 |
| Lean-green Approach towards Social Performance | 35.0409 | 55.578 | 0.924 | 0.956 |
| Operational Performance towards Financial Performance | 35.1302 | 55.837 | 0.916 | 0.957 |
| Environmental Performance towards Financial Performance | 34.7318 | 56.724 | 0.574 | 0.967 |
| Social Performance towards Financial Performance | 35.2441 | 56.580 | 0.861 | 0.958 |
| Business Activity | Lean Technical and Social Practices Positively Influence Operational Performance | |
|---|---|---|
| Yes % | No % | |
| Chemistry | 69.2% | 30.8% |
| Coal | 66.7% | 33.3% |
| Petroleum | 68.8% | 31.2% |
| Plastic | 85.7% | 14.3% |
| Rubber | 66.7% | 33.3% |
| Paper | 50.0% | 50.0% |
| Wood | 66.7% | 33.3% |
| Steel Manufacturing | 30.0% | 70.0% |
| Water Treatment | 66.5% | 37.5% |
| Food | 66.7% | 33.3% |
| Beverages | 80.0% | 20.0% |
| Business Activity | Green Technical and Social Practices Positively Influence Operational Performance | |
|---|---|---|
| Yes % | No % | |
| Chemistry | 76.9% | 23.1% |
| Coal | 33.3% | 66.7% |
| Petroleum | 81.3% | 18.8% |
| Plastic | 85.7% | 14.3% |
| Rubber | 86.7% | 13.3% |
| Paper | 100.0% | 0.0% |
| Wood | 66.7% | 33.3% |
| Steel Manufacturing | 10.0% | 90.0% |
| Water Treatment | 100.0% | 0.0% |
| Food | 60.0% | 40.0% |
| Beverages | 20.0% | 80.0% |
| Business Activity | Green Practices towards Environmental Performance | |
|---|---|---|
| Yes | No | |
| Row N % | ||
| Chemistry | 38.5% | 31.5% |
| Coal | 100.0% | 0.0% |
| Petroleum | 43.8% | 56.3% |
| Plastic | 57.1% | 42.9% |
| Rubber | 100.0% | 0.0% |
| Paper | 100.0% | 0.0% |
| Wood | 100.0% | 0.0% |
| Steel Manufacturing | 90.0% | 10.0% |
| Water Treatment | 100.0% | 0.0% |
| Food | 53.3.0% | 46.7% |
| Beverages | 0.0% | 100.0% |
| Lean-Green Approach towards Operational Performance | Total | |||
|---|---|---|---|---|
| Yes | No | |||
| Green approach towards Operational Performance | Yes | 63 | 5 | 68 |
| No | 22 | 12 | 34 | |
| Total | 85 | 16 | 102 | |
| Lean-Green Approach towards Environmental Performance | Total | |||
|---|---|---|---|---|
| Yes | No | |||
| Lean–greenapproach towards Environmental Performance | Yes | 55 | 10 | 65 |
| No | 27 | 10 | 37 | |
| Total | 85 | 20 | 102 | |
| Lean-Green Approach towards Social Performance | Total | |||
|---|---|---|---|---|
| Yes | No | |||
| Lean-green approach towards Social Performance | Yes | 7 | 34 | 41 |
| No | 8 | 53 | 61 | |
| Total | 15 | 87 | 102 | |
Disclaimer/Publisher’s Note: The statements, opinions and data contained in all publications are solely those of the individual author(s) and contributor(s) and not of MDPI and/or the editor(s). MDPI and/or the editor(s) disclaim responsibility for any injury to people or property resulting from any ideas, methods, instructions or products referred to in the content. |
© 2022 by the authors. Licensee MDPI, Basel, Switzerland. This article is an open access article distributed under the terms and conditions of the Creative Commons Attribution (CC BY) license (https://creativecommons.org/licenses/by/4.0/).
Share and Cite
Abualfaraa, W.; AlManei, M.; Kaur, R.; Al-Ashaab, A.; McLaughlin, P.; Salonitis, K. A Synergetic Framework for Green and Lean Manufacturing Practices in SMEs: Saudi Arabia Perspective. Sustainability 2023, 15, 596. https://doi.org/10.3390/su15010596
Abualfaraa W, AlManei M, Kaur R, Al-Ashaab A, McLaughlin P, Salonitis K. A Synergetic Framework for Green and Lean Manufacturing Practices in SMEs: Saudi Arabia Perspective. Sustainability. 2023; 15(1):596. https://doi.org/10.3390/su15010596
Chicago/Turabian StyleAbualfaraa, Wadhah, Mohammed AlManei, Rashmeet Kaur, Ahmed Al-Ashaab, Patrick McLaughlin, and Konstantinos Salonitis. 2023. "A Synergetic Framework for Green and Lean Manufacturing Practices in SMEs: Saudi Arabia Perspective" Sustainability 15, no. 1: 596. https://doi.org/10.3390/su15010596