Abstract
To explore the influence of shield construction on the stress of tunnels surrounding rock and linings in deep, high groundwater and low-permeability soft rock strata, a 3D coupled hydro-mechanical model of a low permeability mudstone tunnel was established with ABAQUS, based on the effective stress principle and the Mohr–Coulomb elastoplastic constitutive model, taking the Bailuyuan Tunnel of the Hanjiang to Weihe River Valley Water Diversion Project Phase II in China as an example. The tunnel shield construction was simulated, and the spatial-temporal variation in the pore water pressure and the internal forces of the lining were studied. The results show that the central pore water pressure of the low-permeability mudstone face presents a V-shaped variation with the tunnel excavation. When the face was approximately 15 m from the representative section, the pore pressure on the linings basically varied between 192.7 and 182.5 m. The bending moment and axial force of the lining increased by 7.4% and 12.8%, respectively, with shield tunnelling. When the tunnel diameter was constant, the axial force and bending moment of the lining decreased quadratically as the lining thickness increased. The influence of shield construction decreased as the lining thickness increased. The research results provide a reference for the safe and optimal construction of the Hanjiang to Weihe River Valley Water Diversion Project.
1. Introduction
In the context of the accelerating global transition towards renewable energies, the progression of urbanization and the expansion of economically emerging regions, mechanized tunnelling is increasingly being used for underground infrastructure modernization and expansion [1]. In recent years, with the development of underground engineering construction, the shield method has become one of the main tunnel building methods due to its fast tunnelling speed [2,3,4,5,6,7,8,9,10,11,12]. This method has also been successfully applied under complex geological conditions, such as in sandy gravel strata with large-size grains [13,14], loess strata [15], dry cohesionless soil [16] and double-layer soil [17]. These undesirable geological conditions are likely to result in shield tunnelling difficulties, such as collapses, water inrush, and stuck drills.
When applying numerical analysis methods, scholars generally use 2D models to investigate the mechanism of independent segment structures [18,19,20], while 3D models are often used to evaluate the macroscopic evolution of strata and tunnel structures during tunnel excavation [21,22,23,24,25]. Numerous studies have demonstrated that both the temporal and spatial variations in the water pressure distribution and stress distribution and the seepage–stress coupling effect of the surrounding rock are significant [26,27,28]. Soft rock with a low permeability is a typical geotechnical material with an obvious time-varying effect. Under high groundwater level and high-ground stress conditions, the seepage and stress of soft rock with a low permeability change more intensely. Thus, the interactions between physical fields are closer. Scholars have studied the construction scheme and supporting measures of soft rock tunnels, but few have conducted soft rock-related research on shield construction [29,30,31,32,33,34,35,36]. Soft rock with a low permeability is a typical geotechnical material with an obvious time-varying effect. After the disturbance of excavation in areas with high groundwater levels and complex strata, the dynamic changes in the control variables of the seepage field and stress field of soft rock with a low permeability are more intense, and the interaction between the physical fields is closer, which leads to nonlinearities in the stress and deformation of the surrounding rock with the excavation process, and the coupling problem is more complex. However, most studies have focused on shallowly buried tunnels [37,38,39,40] and deeply buried tunnels in hard rock [41,42]. No comprehensive research has been conducted on deep-buried tunnels under high groundwater levels in soft rock strata.
The Bailuyuan Tunnel of the Hanjiang to Weihe River Valley Water Diversion Project (H-W RVWDP) Phase II has a buried depth of 283.0 m and a water level of 221.0 m. It is a soft-rock shield tunnel with the highest external water pressure in the loess plateau in China, and no similar projects are available for reference. To explore the structural response of the surrounding rock and lining during tunnel excavation, a 3D finite element model of a low-permeability mudstone tunnel with seepage–stress coupling was established. Then, the excavation process of the tunnel with the shield method was simulated using ABAQUS finite element software. The temporal and spatial variations in the surrounding rock stress, plastic zone and pore water pressure, as well as the internal forces of the lining were comprehensively studied. Parametric studies of the lining thickness were also carried out. The research results provide a reference for the safe and optimal construction of shield tunnels in areas with high groundwater levels and complex strata similar to the Hanji-Wei project, and provide theoretical support for improving the design level and construction level of shield tunnels in China.
2. Project Overview
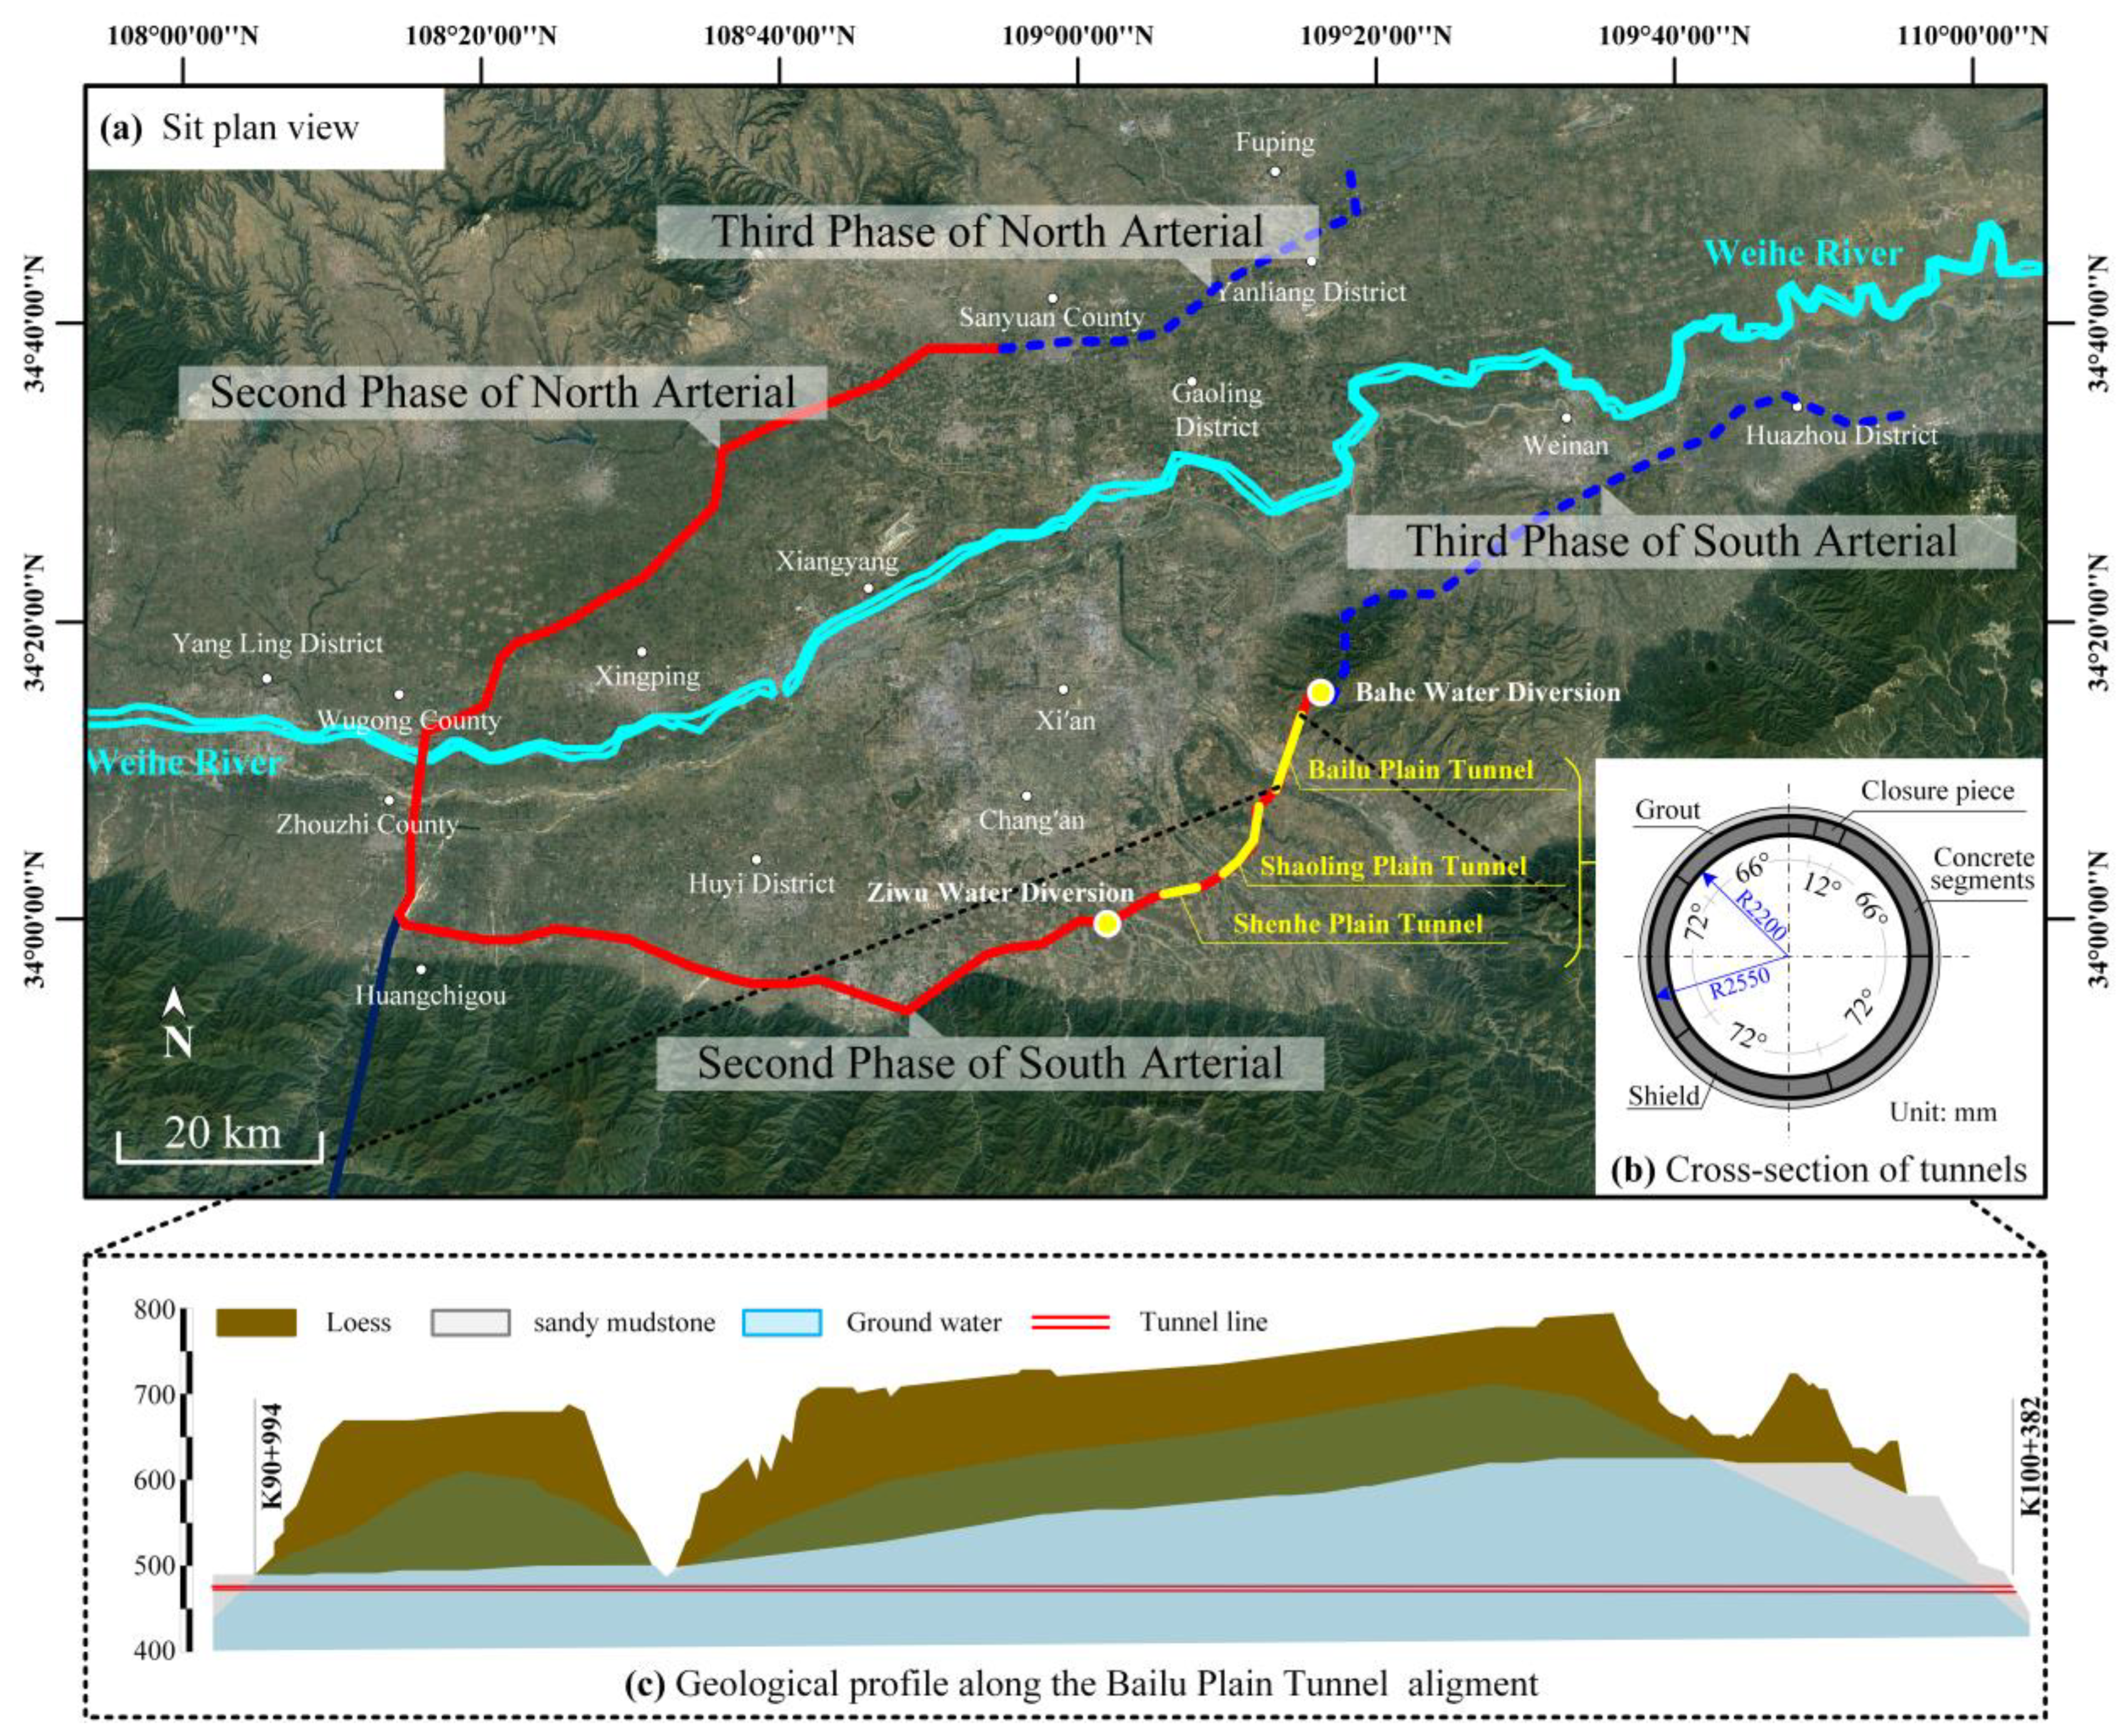
The H-W RVWDP is the main project of the Transvalley Water Diversion Projects in Shaanxi Province, China. Its south main line mainly consists of the Huangwu Tunnel, Shenheyuan Tunnel, Shaolingyuan Tunnel and Bailuyuan Tunnel. Among them, the Bailuyuan Tunnel has the largest buried depth and pressure head in the H-WRVWDP Phase II. The maximum buried depth and the maximum head at the crown of the tunnel are 283.0 m and 221.0 m, respectively. The surrounding rock is mainly composed of neoproterozoic mudstone and sand conglomerate, with rock gradings IV and V, respectively. The project adopts a single-layer lining support with a width of 1.5 m and a thickness of 35 cm. The project layout, geological profile and tunnel section dimensions are shown in Figure 1.

Figure 1.
Detailed satellite map of the Hanjiang-Weihe River Valley Diversion Project Phase II (Google map; annotations made by author).
3. Numerical Model
The section of the Bailuyuan Tunnel with the maximum buried depth was taken as the calculated section. The evolution of the pore pressure and displacement of the surrounding rock, as well as the internal forces of the lining during excavation, were investigated.
3.1. Soil Model
The Mohr–Coulomb elastoplastic constitutive model, which is a commonly used geotechnical constitutive model, was used to analyze the upper limit of the structural response during tunnel excavation and support. Many scholars have successfully applied the Mohr–Coulomb constitutive model to simulate the shield tunnelling [43], tunnel excavation and lining processes and discussed the influence of tunnel construction on surface settlement for specific projects [44].
In this study, the Mohr–Coulomb (M-C) elastoplastic constitutive model was used to describe the nonlinear behavior of the surrounding rock. The soils’ parameters were set based on experimental data and listed in Table 1.

Table 1.
Constant parameters for simulation case.
3.2. Tunnel Works Model
The redistribution law of pore water pressure and the surrounding rock–lining interaction during shield tunnel construction have an obvious three-dimensional spatial effect [36], which is the result of soil seepage–stress coupling. Finite element models are widely used in underground engineering. ABAQUS, a commercial finite element software, has a mature and reliable module in the coupled calculation of rock and soil seepage and stress, and its calculation accuracy has been widely recognized internationally [45]. Therefore, ABAQUS analysis software was used to establish a 3D simulation model of the entire process of tunnel boring in the Bailuyuan of Hanjiang to Weihe River Valley Water Diversion Project Phase II. Transient analyses were conducted to simulate the behaviors of the surrounding rocks and linings. In the model, C3D8RP and C3D8R were used to establish the soil and the lining structure, respectively. The implicit analysis method (Newton–Raphson algorithm) was used to solve the equilibrium equation, and the temporal and spatial seepage–stress evolution process of each step was obtained by transient analysis.
The distance from the buried depth to the crown of the calculated section is 283.0 m, and the distance from the pressure head to the crown is 221.0 m. The tunnel has a circular section, and the excavation radius is 2.70 m. The lining inner diameter is 4.4 m, the thickness is 0.35 m, and the width is 1.5 m. The backfill grouting layer behind the wall is 0.15 m thick. The shield length is 7.8 m, and the driving speed is 60~65 m per month advance. The actual time required for each excavation in this project was determined to be 30 d × 24 h/d × 3600 s/h/60 m = 43,200 s/m.
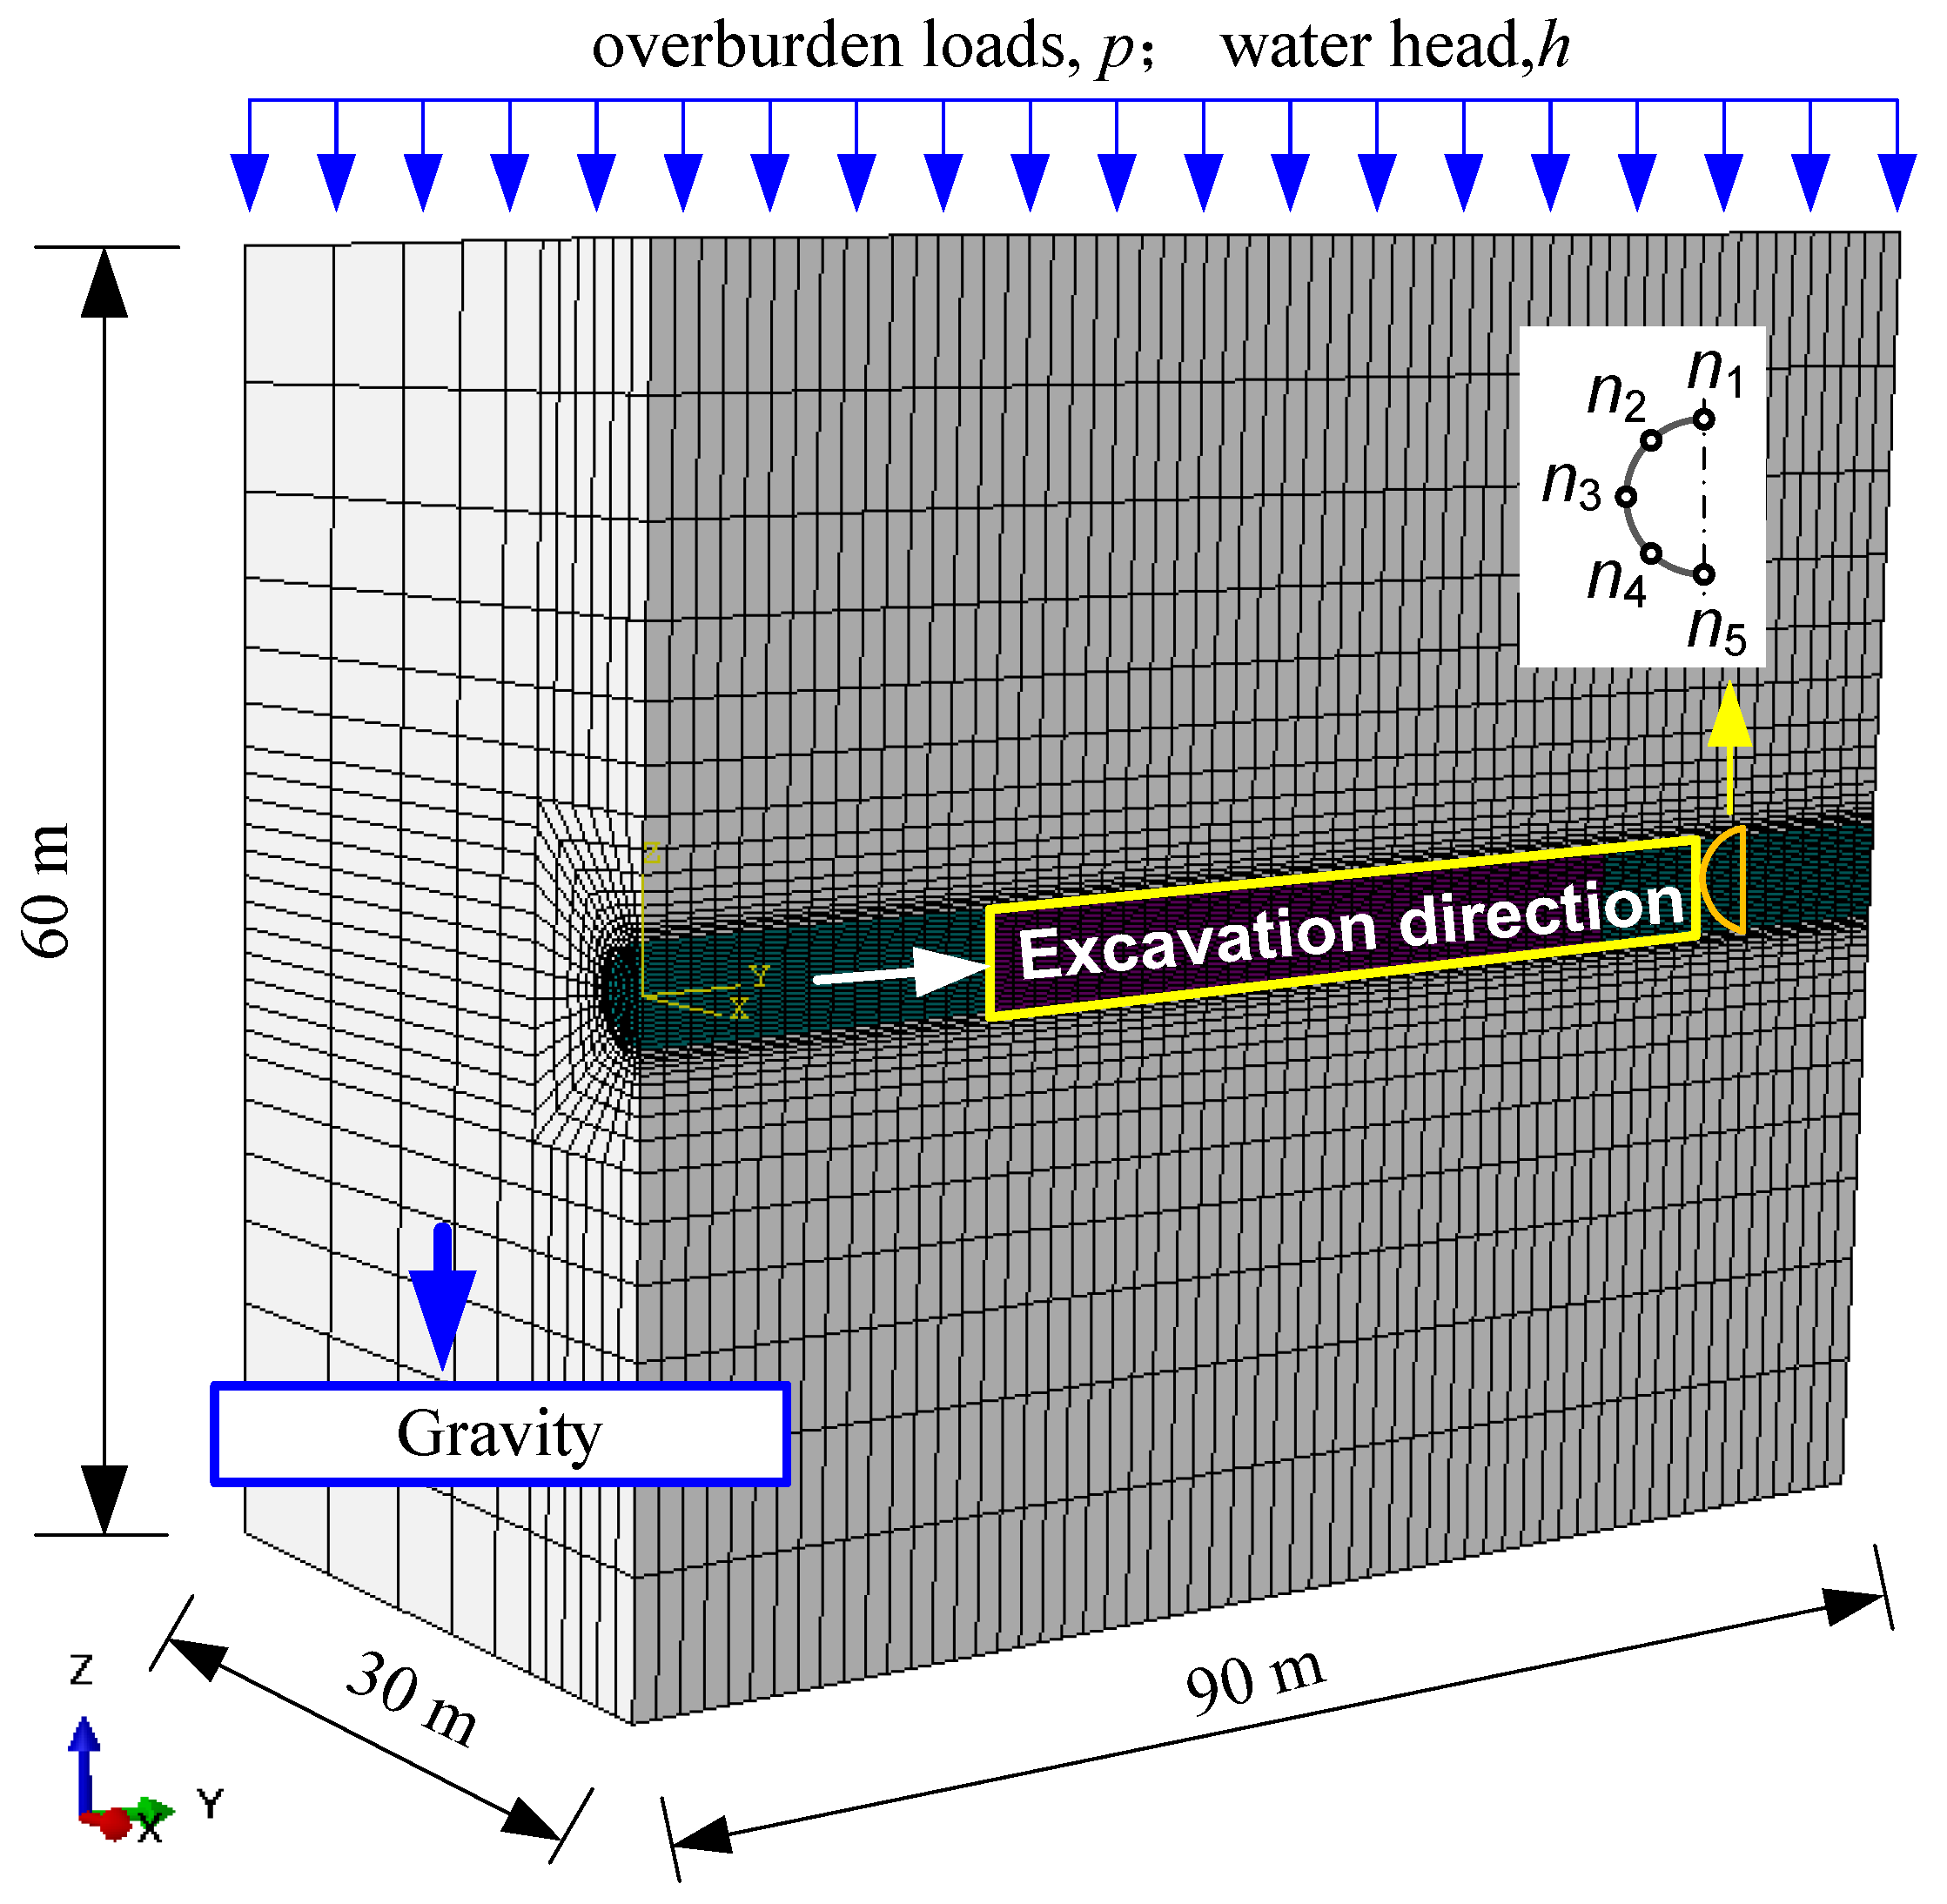
According to Saint-Venant’s principle, to reduce the influence of the boundary on the calculation, the vertical and horizontal directions of the tunnel surrounding rock were taken as 30 m. To improve the modelling and solving efficiency, the simulation length of each excavation step was set as one segment length. Moreover, the length of the shield model was set to 4.5 m, which is equivalent to the total length of 3-ring segments, so that the shield and soil shared grid nodes [46].
Considering the symmetry of the tunnel structure, a semistructure was used for calculation. In the finite element model, the origin of the global Cartesian coordinate system of the model is aligned with the tunnel section center, which is on a vertical plane of the FEM model. The positive y-axis direction is the shield tunnelling direction, and the negative z-axis direction is the depth direction.
The longitudinal section of the tunnel (x = 0) was set as a symmetric constraint, and the rest of the vertical plane and the bottom boundary were set as directional hinged constraints. The earth pressure and pore pressure on the top plane of the model were 3.63 MPa and 1.94 MPa, respectively, which were calculated according to the overlaying soil and the groundwater level, and the hydraulic gradient was set as 10 kPa/m. Because the permeability coefficient of the surrounding rock is 1 × 10⁻⁸ m/s and the monthly progress is 60~65 m, the drainage effect of the excavation face was not considered in the numerical simulation of the excavation process, i.e., the excavation face was set as the undrained boundary.
3.3. Mesh and Parameters
Considering the geometric characteristics, convergence and accuracy of the model, mesh encryption was adopted around the tunnel, while a gradient mesh was adopted within a radius of 2.5 times that of the radial tunnel. To simulate the interactions between the surrounding rock and the linings more accurately, the linings and the grouting layer were meshed by solid elements [47]; two layers and one layer of elements were set along the thickness direction, respectively. The longitudinal mesh spacing was set as 0.5 times the segment width, i.e., 0.75 m.
Furthermore, to reduce the error due to the boundary conditions and the initial condition of the model, 30 advancing steps were set as the stepwise excavated section. Each advancing step length was equal to one segment ring width. Fifteen segment ring widths were set before and after the stepwise excavation section, defined as the completed excavated section and the nonexcavated section, respectively [48]. That is, y = 0~22.5 m is the completed excavated section, y = 22.5~67.5 m is the stepwise excavated section, and y = 67.5~90.0 m is the nonexcavated section.
The model consists of 36,542 nodes and 32,160 seepage–stress coupling elements (C3D8P) for the surrounding rock and 60,480 3D stress elements (C3D8R) for the grouting, lining and shield. The model meshing is shown in Figure 2.
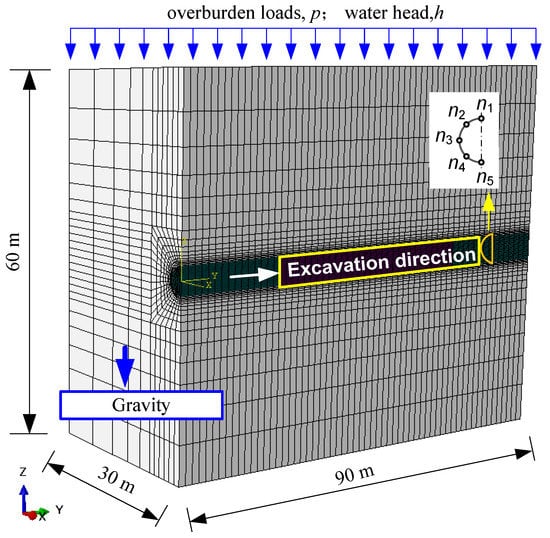
Figure 2.
3D finite element model mesh and geometry.
The mechanical parameters for the tunnel boring machine (TBM) include Poisson’s ratio. The elasticity modulus of the shield was calculated by the equivalent stiffness method according to the mortar thickness, shield shell elasticity modulus and the corresponding thickness. The Poisson’s ratio of the shield was used. The lining mechanical behavior was assumed to be linear elastic. The material parameters are shown in Table 1.
3.4. Model Procedure
The specific simulation steps of the excavation procedures in the FE analysis are described as follows:
Step 1: The initial stress field of the surrounding rock under gravity stress is calculated.
Step 2: After obtaining the initial stress field of the soil, the ground stress balance is carried out, and the soil displacement value is approximately zero after the balance.
Step 3: The complete excavated section part, which consists of the shield machine, the linings and back-filling grout, is activated in the FE model, and the corresponding soil elements are removed by the ‘element death’ technique.
Step 4: The shield advancement is simulated by deactivating the rear elements of the shield part in Step 3 while activating the new elements in front of the shield, and the corresponding soil to be excavated is removed. Simultaneously, the segment and the grout layer are activated.
Step 5: The excavation and shield advancement procedure are repeated using the step-by-step method [46,49], i.e., cycling Step 4 until the excavation of the stepwise excavated section is complete.
4. Results
4.1. Pore Water Pressure Redistribution during Tunnel Excavation
(a) Pore water pressure variation on the heading face;
The middle cross-section of the model was taken as the representative cross-section (CSrep for short, y = 45 m) to investigate the stratum and structural response during the tunnelling construction stage. The relative distance between the heading face and the CSrep is expressed by ΔL. ΔL is defined as negative when the heading face is facing towards CSrep; in contrast, it is defined as positive when the heading face is facing away from CSrep.
Figure 3 illustrates the water head h variation of CSrep when the heading face is near arrival and facing away from CSrep. Figure 3a,b show that h decreased significantly within the range of 2 times the diameter of the heading face, due to tunnel excavation. The drop in the pore water pressure on the cross-section is U-shaped, and the drop in the pore water pressure on the vertical section is elliptic. h is negative on the heading face. Concentric circles were centered on the axis of the hole before excavation. After excavation, the equipotential line showed an obvious ellipse, indicating that the drop of the upper and lower parts of the tunnel was more obvious than that of the waist. Figure 3c shows the h distribution in CSrep when ΔL = −1.5~3 m. When ΔL= −1.5 m, h significantly decreased within the range of 2 times the tunnel diameter. The drop in the pore water pressure is approximately 2 times the diameter around the tunnel. The minimal h is −107.5 m at the tunnel axes. When the heading face arrives at CSrep (ΔL = 0 m), h decreased further and reached the minimum pore pressure (−130.2 m) of the entire excavation section. The drop in the pore water pressure was concentrated around the tunnel at approximately 1.5 times the tunnel diameter. After that, the shield machine passed through CSrep, and due to the restraint of the shield machine, the water head around the tunnel began to recover. Compared with the water head near the spring line, the pore water head at the crown and invert increased relatively slowly.
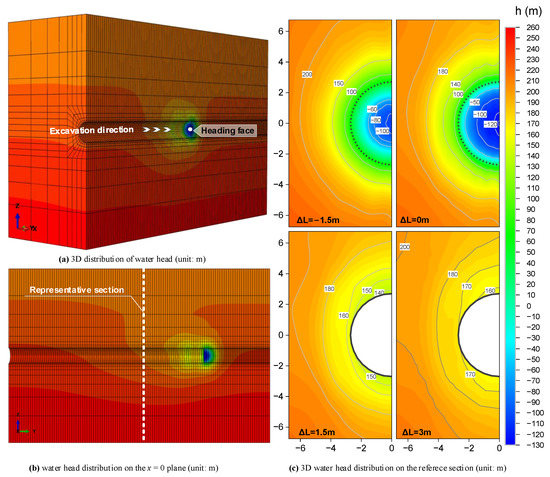
Figure 3.
Pore water pressure distribution in the surrounding rock.
(b) Pore pressure change process at the characteristic point around the tunnel;
In Figure 4, the variations in the water head at the crown, spring line, invert and center of the upper and lower arcs with the advancement of the heading face are plotted. The water head on the linings was positive. The circumferential external water head of the linings changed in a V-shape with the excavation process. The curves of different positions are basically coincident, indicating that the difference in the external water head along the tunnel circumference was much smaller than the variation in the external water pressure induced by tunnel excavation. The water head underwent three stages during shield tunnelling: (i) the decline stage, (ii) the rapid rising stage and (iii) the slow recovering stage. ΔL = −7.5~0 m corresponds to the decline stage, wherein the water head gradually decreased as the heading face approached CSrep. When the heading face arrived at CSrep, the water head at the edge of the heading face decreased to the minimum value of 53.2~64.9 m. ΔL = 0~3 m corresponds to the rapid rise stage. The water head increased linearly with an absolute increment of approximately 104 m. ΔL > 3 m corresponds to the slow recovering stage. In this stage, the water head slight decreased when the shield tail left CSrep, and then the water head slowly increased. After ΔL > 15 m, the water head tended to be stable at 192.7~182.5 m.
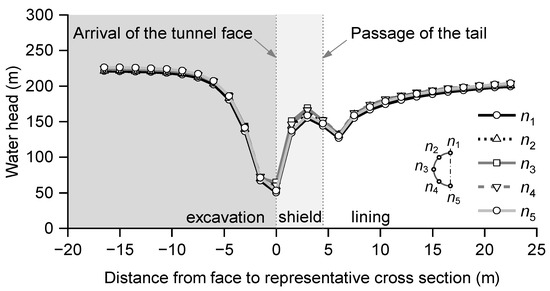
Figure 4.
Variation in the water head at characteristic points on the linings.
4.2. Lining Internal Force Analysis
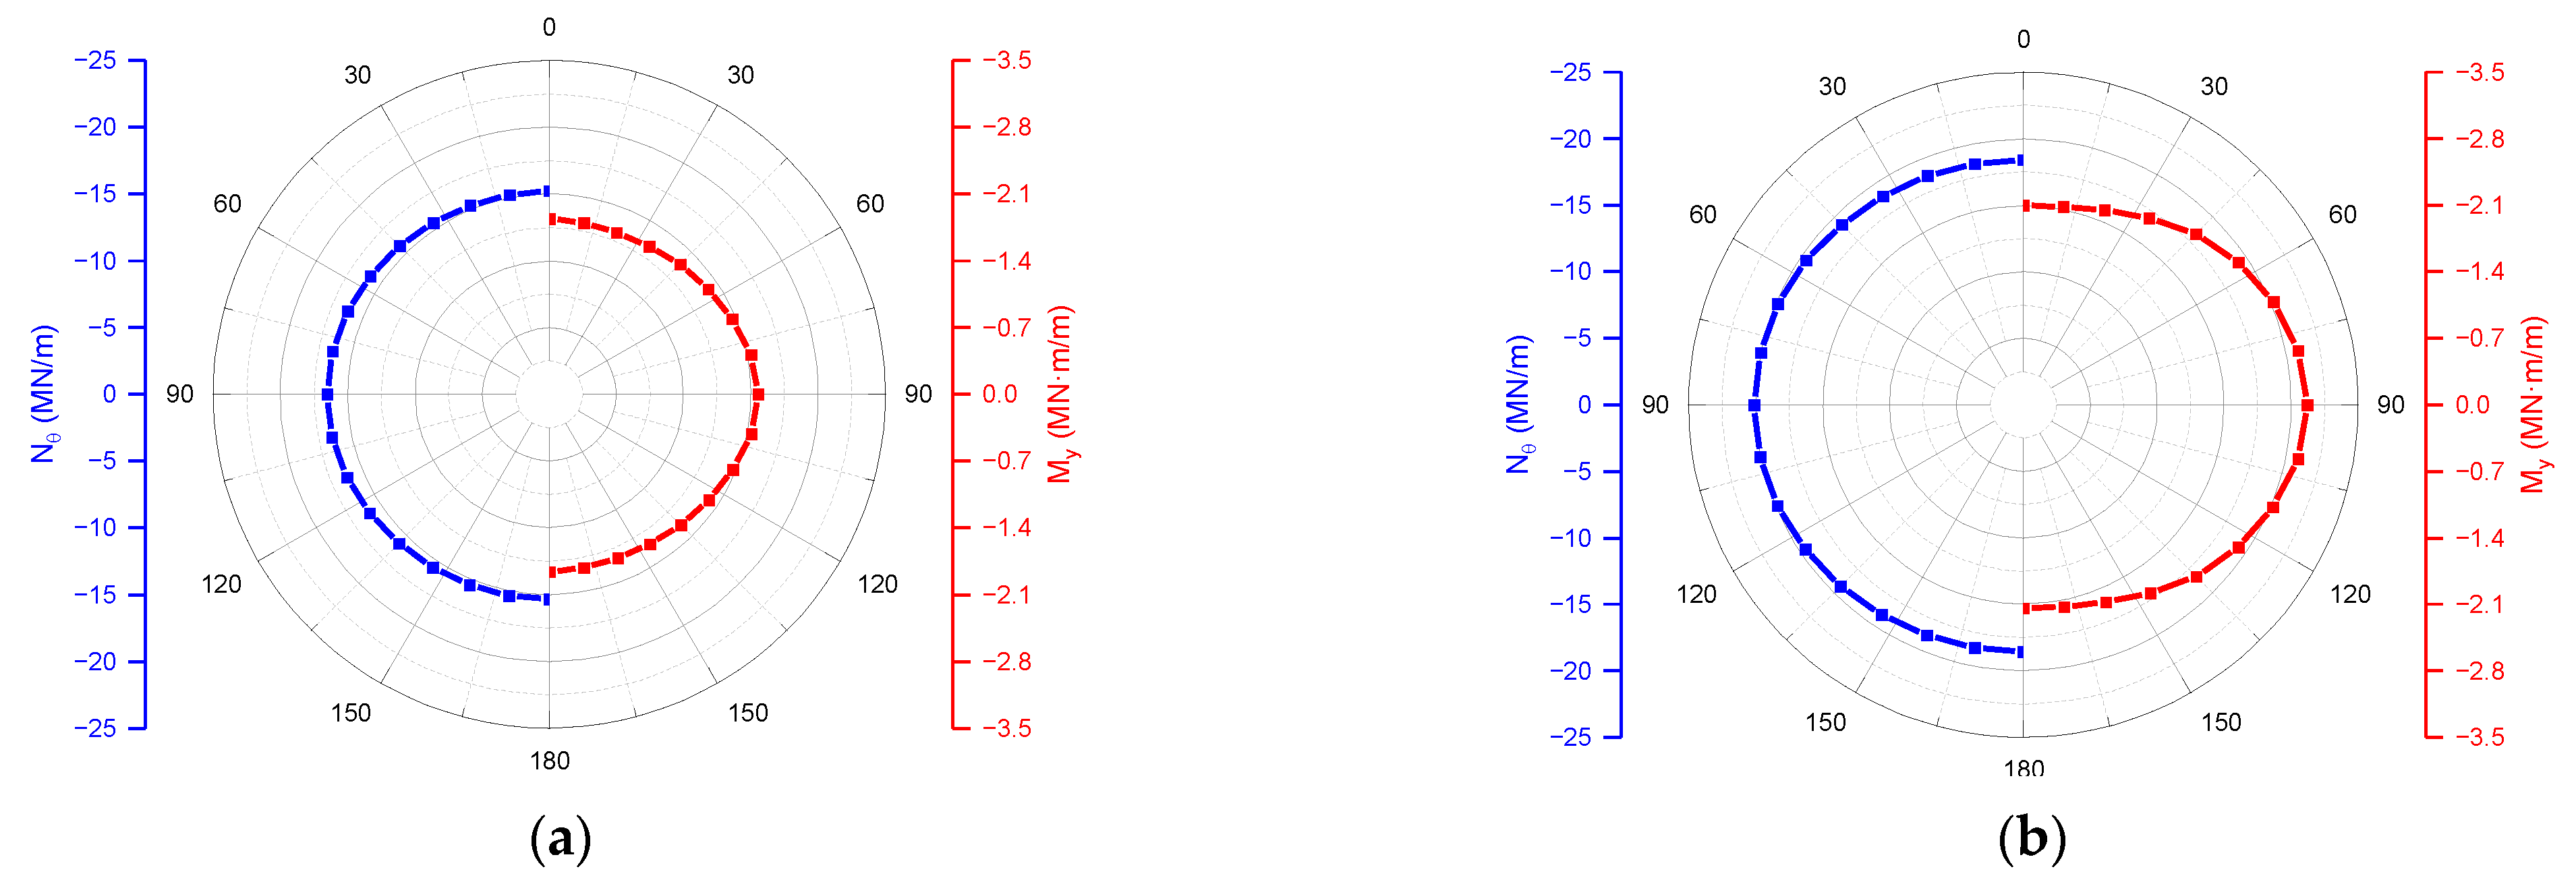
Figure 5 shows the lining internal force distribution at CSrep at the moment of support (ΔL = 1.5 m) and at the moment after the excavation and lining of the stepwise excavation section (ΔL = 22.5 m). Blue lines represent the hoop force (Nθ) of linings along the circumference of the tunnel. Positive (+) indicates tension, and negative (−) indicates compression. Red lines indicate the bending moment (My) along the circumference of the tunnel. Positive (+) indicates that the tension side of the lining is at the outside diameter, and negative (−) indicates that the tension side of the lining is at the inside diameter.
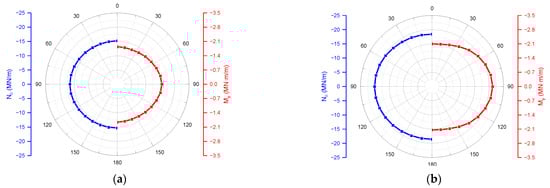
Figure 5.
Hoop force and bending moment distribution around the linings in different stages of the representative cross-section. (a) ΔL = 1.5 m; (b) ΔL = 22.5 m.
Both Nθ and My of the linings increased as the shield advanced. Nθ is approximately circular, while My is approximately elliptical. When ΔL = 22.5 m (long-term state), the maximum difference in Nθ was 1.7 MN/m, and its corresponding variance was 0.365, while the maximum difference in My was 0.87 MN·m/m, and its corresponding variance was 0.099. These results indicate that the nonuniformity of My along the tunnel circumference was greater than that of Nθ. Compared with that when ΔL = 1.5 m at the moment of support, the increase in the hoop force at each characteristic point was approximately 3.18~3.56 MPa, with a relative increment of 20.90~21.55%. Likewise, the bending moments at the crown and invert of the tunnel increased by approximately 0.26~0.28 MN·m/m, with relative increments of 14.13~15.05%. The My increment at the waist was larger, with absolute and relative values of 0.795 MPa and 36.64%, respectively.
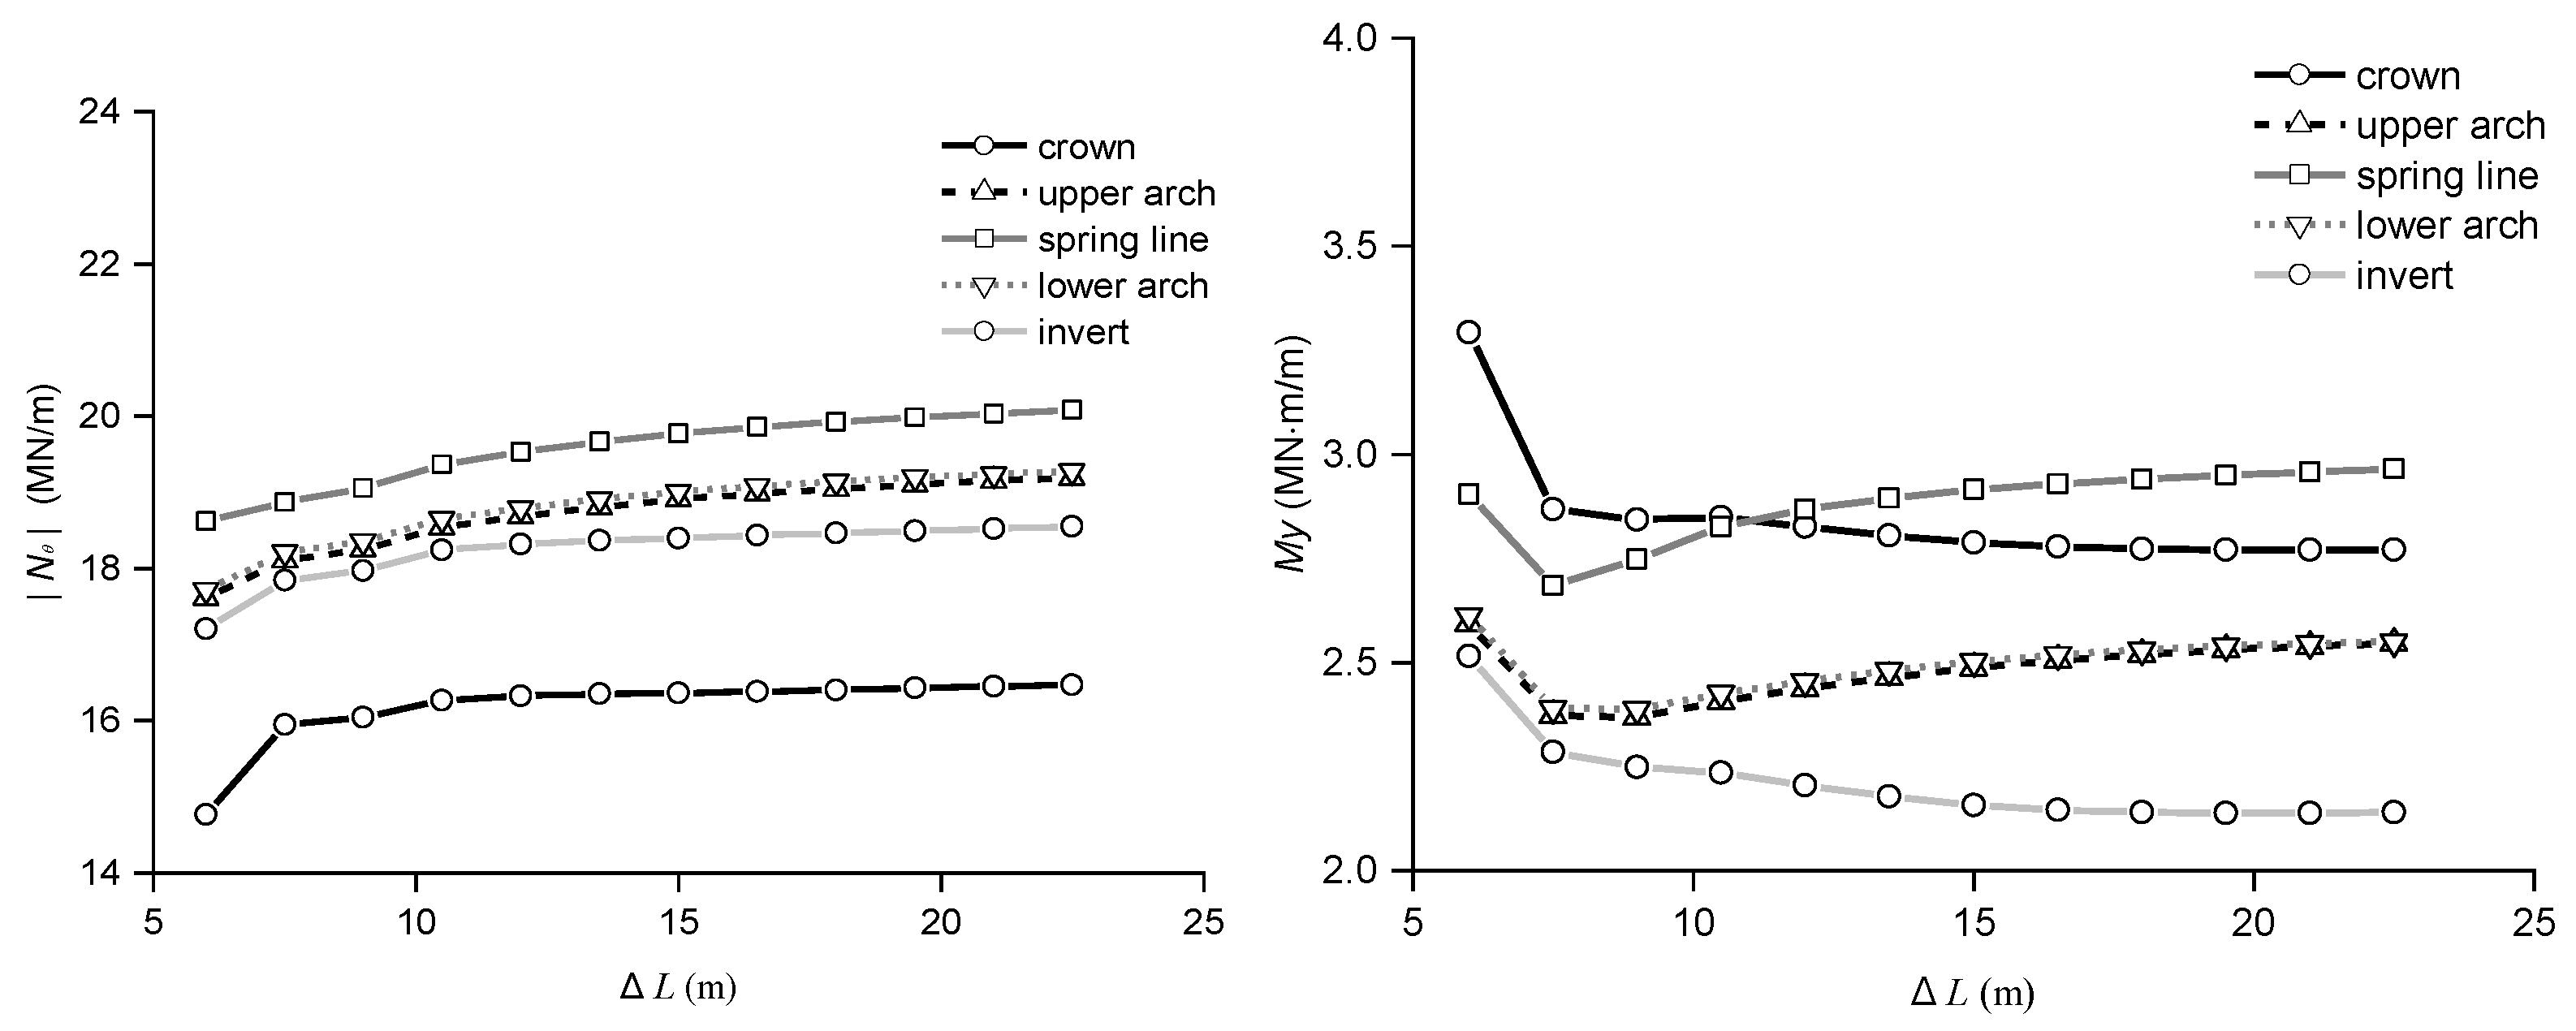
In Figure 6, the variations in Nθ and My of the five specified positions of the lining (i.e., crown, upper arch, spring line, lower arch and invert) are plotted. As the heading face advanced, Nθ increased gradually, while My decreased at the moment that the shield tail passed through and then increased gradually. The main reason is that the stiffness of the lining was less than that of the shield machine. When the reference plane lining was rigid, the shield tunnelling machine restrained the deformation of the surrounding rock in front of the reference plane lining. When the shield reached the next length, the lining replaced the shield support, which increased Nθ on the reference plane. In this internal force adjustment process, the largest affected lining part is the crown. The |Nθ| of the crown increased from 14.8 MN/m when it was first supported, to 15.9 MN/m, with an absolute increase of 1.1 MN/m and a relative increase of 7.4%. However, My decreased by 0.42 MN·m/m and 12.8%. The numerical value is less than the design value of 23.1 MPa for the axial compressive strength of C50 concrete, which meets the strength requirements.

Figure 6.
Hoop force and bending moment distribution along the linings in the construction stage.
5. Discussion
5.1. Hydraulic Boundary Type of the Excavation Face of a Low-Permeability Soft-Rock Tunnel
It is well known that the water flow behavior on the tunnel excavation face is the result of the composite effect of the tunnel construction footage and the permeability coefficient. According to Mohkam and Bouyat (1985), the volume of water that can be discharged from a permeable slurry is approximately equal to the total pore volume of the excavated soil [50]. Therefore, the flow rate per unit area of the tunnel can be determined by
where n is the porosity of the surrounding rock, and vTBM is the advancing speed of the TBM, m/s.
By substituting an excavation radius of 2.7 m, a TBM advancing speed of 60 m/month, and a porosity of 0.40 into Equation (1), the critical permeability coefficient of the surrounding rock was calculated to be 4.0 × 10⁻⁷ m/s. In our case, the permeability coefficient of the surrounding rock was 1.0 × 10⁻⁸ m/s, which is less than the critical surrounding rock permeability coefficient. Therefore, assuming that the excavation face is an undrained boundary is reasonable. The calculation results of the pore water pressure redistribution show that even when the surrounding rock was initially saturated, the surrounding rock produced a negative pore water pressure when the soil permeability was very low, and the water replenishment capacity could not meet the pore volume change rate caused by the soil unloading expansion deformation. In the tunnel of the Bailu Tableland studied in this paper, the permeability coefficient of the surrounding rock is only 1 × 10⁻⁸ m/s, and the maximum negative pore pressure of the surrounding rock on the palm surface is −120 m. It can be hypothesized that for surrounding rock with a very low permeability coefficient and a relatively low advancing speed, the free drainage boundary (pore pressure equal to 0 [51,52,53]) is equivalent to artificially imposing additional water supply conditions, which is obviously unreasonable. In addition, according to the effective stress principle, the effective stress of the surrounding rock is likely underestimated as a result of the water content or pore pressure artificially increasing. In other words, the stability of the excavation face is underestimated.
Similarly, adopting the soil density in mechanical analyses as the saturated density or the effective density without considering the effect of the seepage of the surrounding rock will result in unpredictable errors. It is thus recommended to adopt the seepage–stress coupled analysis method for surrounding soft rock with a low permeability. In the calculation, the seepage boundary of the excavation face can be determined only if the pore pressure of the excavation face is positive or through the trial calculation of the undrained boundary. Moreover, for tunnel simulations with a small permeability coefficient of the surrounding rock, the seepage–stress coupling analysis method is suggested.
5.2. Effect of the Excavation Outer Radius on the Water Head
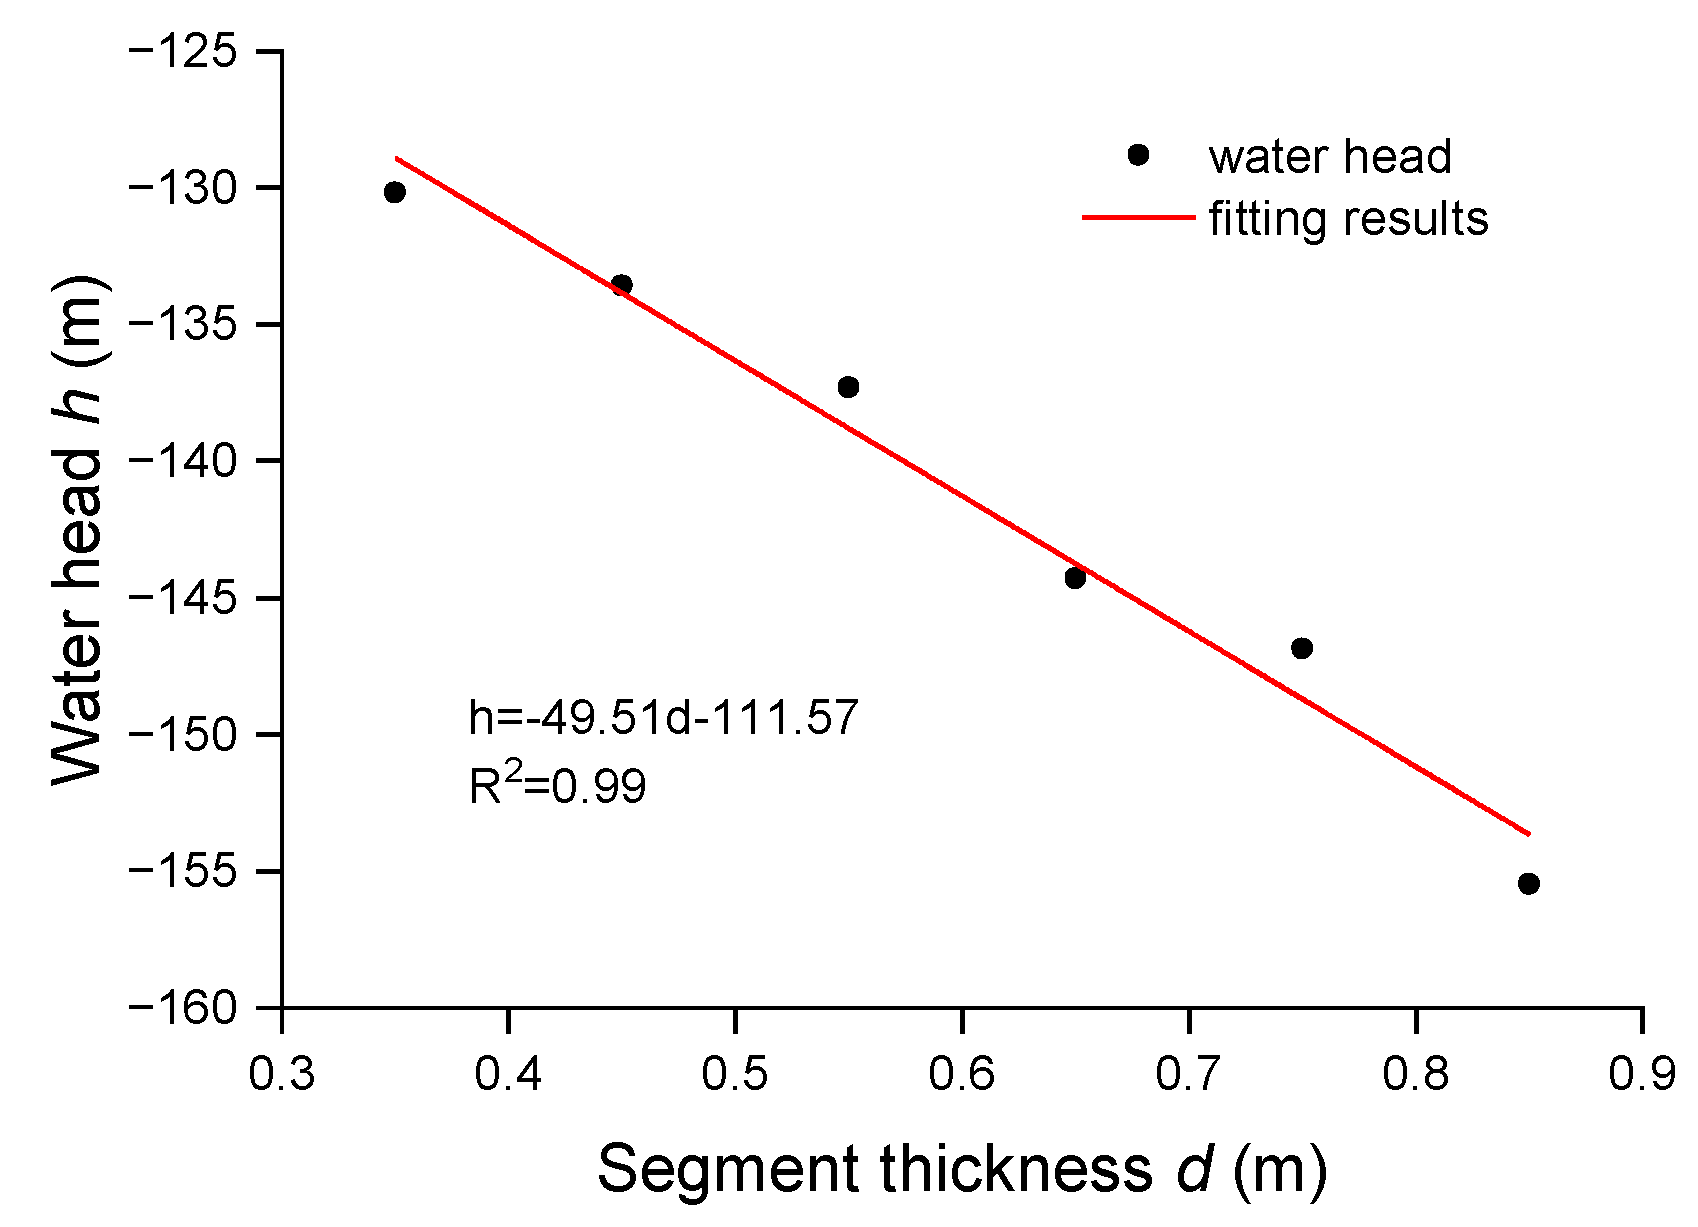
In Figure 7, the relationship between the water head and the outer excavation radius (0.35~0.85 m) is plotted. The water head at the heading face decreased approximately linearly as the lining thickness increased. The linear fitting equation is
where h is the pressure head of the surrounding rock, m, and d is the thickness of the lining, m.

Figure 7.
Variation in water head at the heading face center for different lining thicknesses.
According to the geometric relation, Equation (2) can be rewritten as
where R is the excavation radius, m, and r is the inner diameter of the lining, m.
Because the inner diameter of the tunnel was assumed to be constant, the fitting result shows that the water head at the heading face center decreased by 49.51 m when the excavation radius increased by 1 m. Therefore, except for the permeability coefficient and advancing rate, the extreme negative pressure of the heading face can also be affected by the excavation radius.
5.3. Variation in Lining Internal Force with Thickness
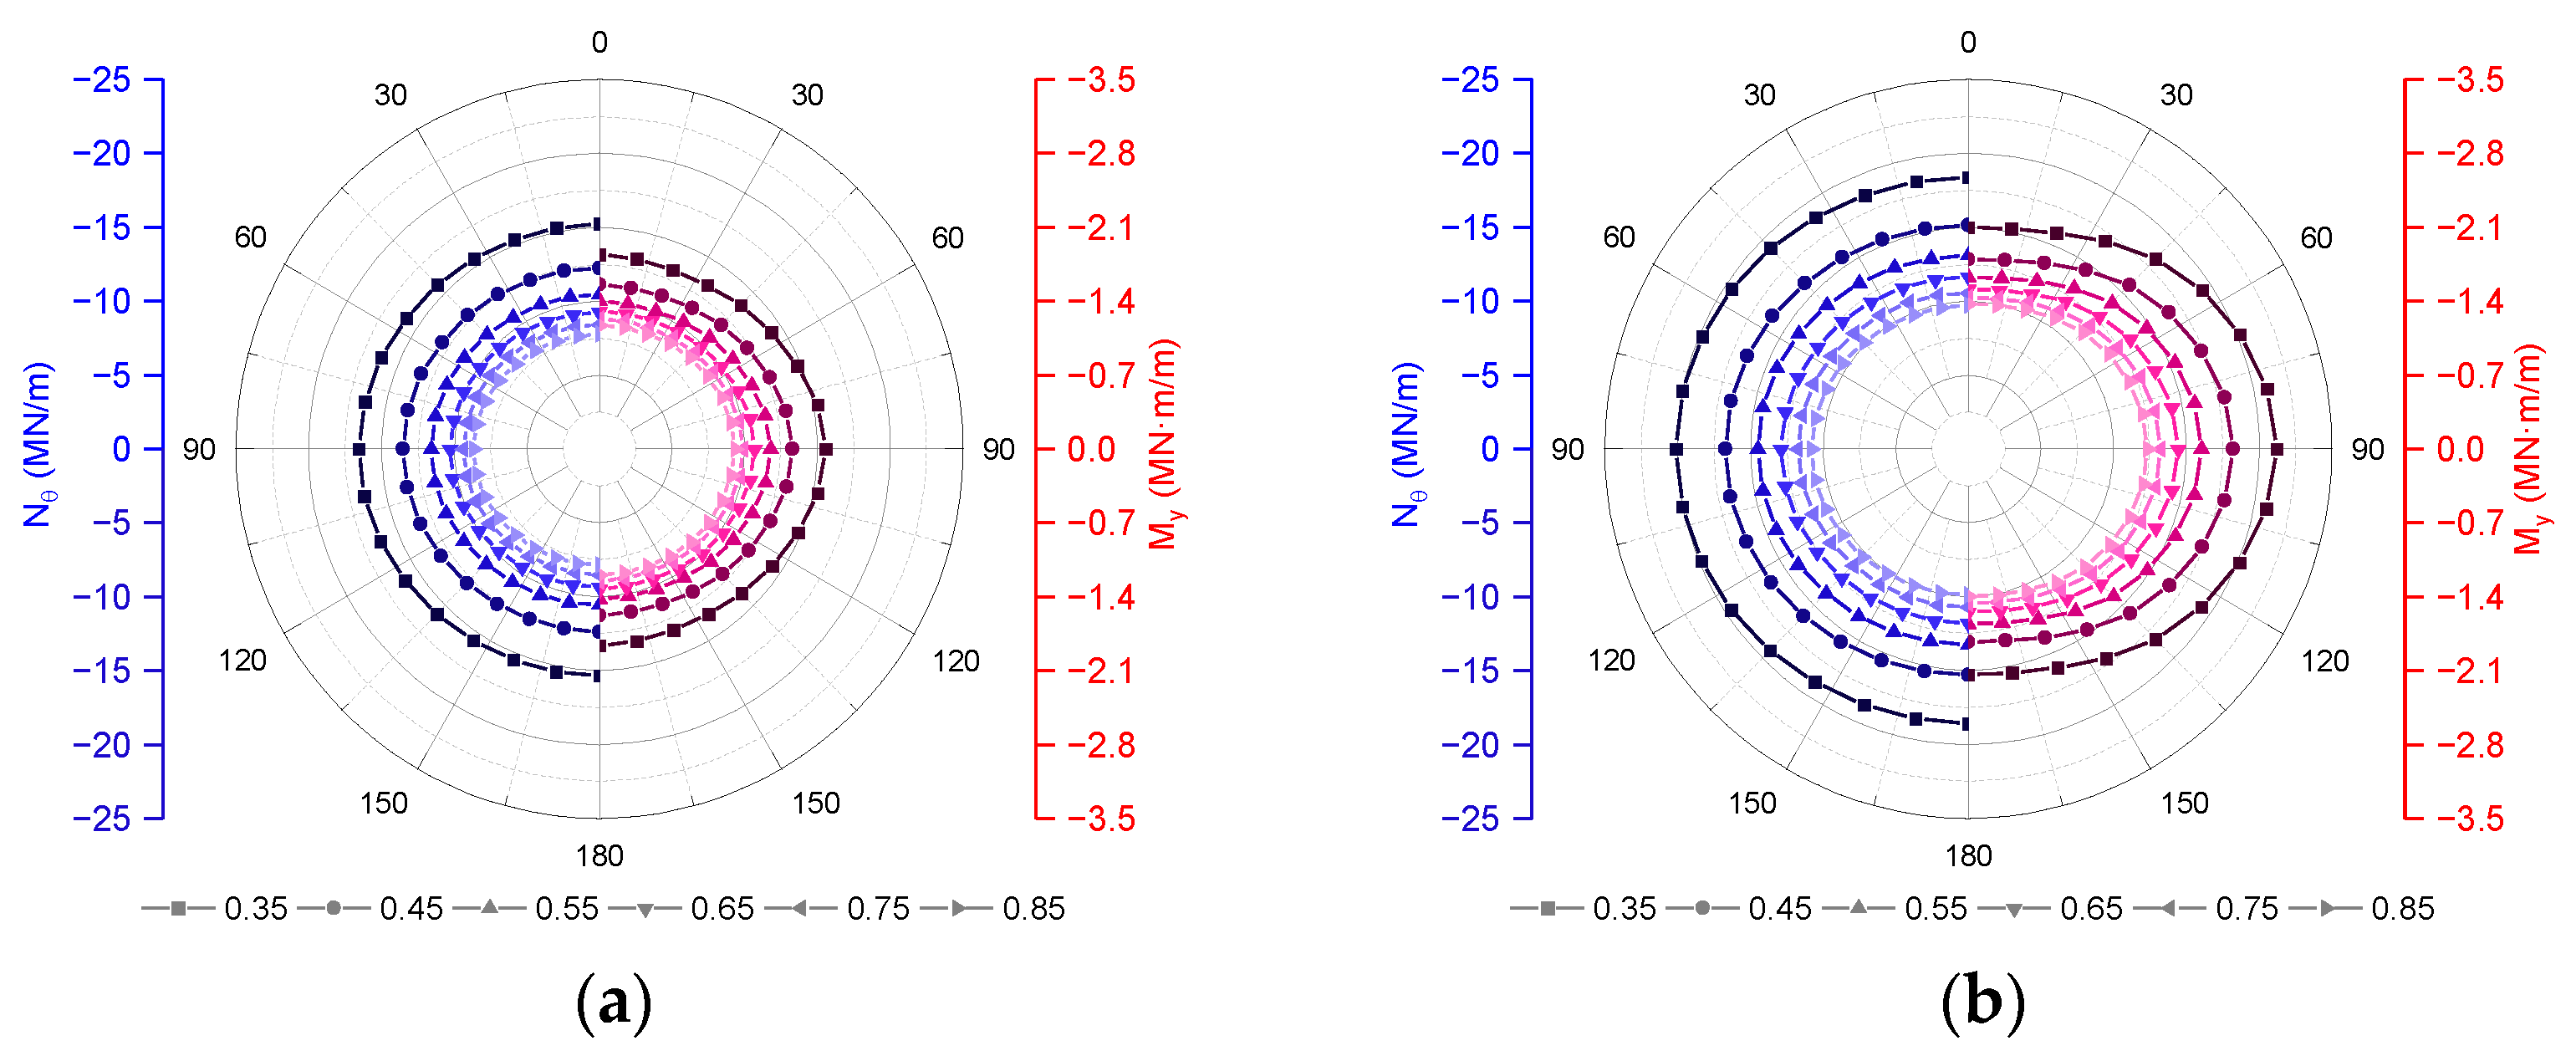
In Figure 8, the variation in the lining internal force with an increasing lining thickness (35, 45, 55, 65, 75 and 85 cm) is plotted. When the thickness of the lining varied from 0.35 to 0.45 cm, the axial force and bending moment of each point around the lining decreased greatly. With the gradual increase in the thickness of the lining, the decreasing amplitude of the axial force and bending moment of each point of the lining gradually decreased, that is, the effect of a thin outside and a dense inside appears in the figure. Near the centre of the circle in the figure, the thickness of the lining reaches its maximum. The figure shows that the axial force approximately shrinks inwards in concentric circles as the thickness of the lining increased and the shrinking rate decreased. The reduction rate of the bending moment at the waist line was significantly greater than that at the crown and invert. For both the state of instant support (ΔL = 6 m) and the final state after completing the excavation and lining simulation (ΔL = 22.5 m), the Nθ and My of the linings decreased as the segment thickness increased. The curve space became increasingly dense, indicating that the role of the increasing lining thickness in reducing the lining internal force was less important. As the lining thickness increased, Nθ along the lining circumference decreased uniformly, while My at the waist was significantly greater than that at other positions.
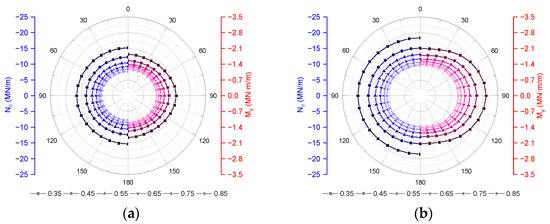
Figure 8.
Lining hoop force and bending moment at ΔL = 6 m and 22.5 m. (a) ΔL = 6 m; (b) ΔL = 22.5 m.
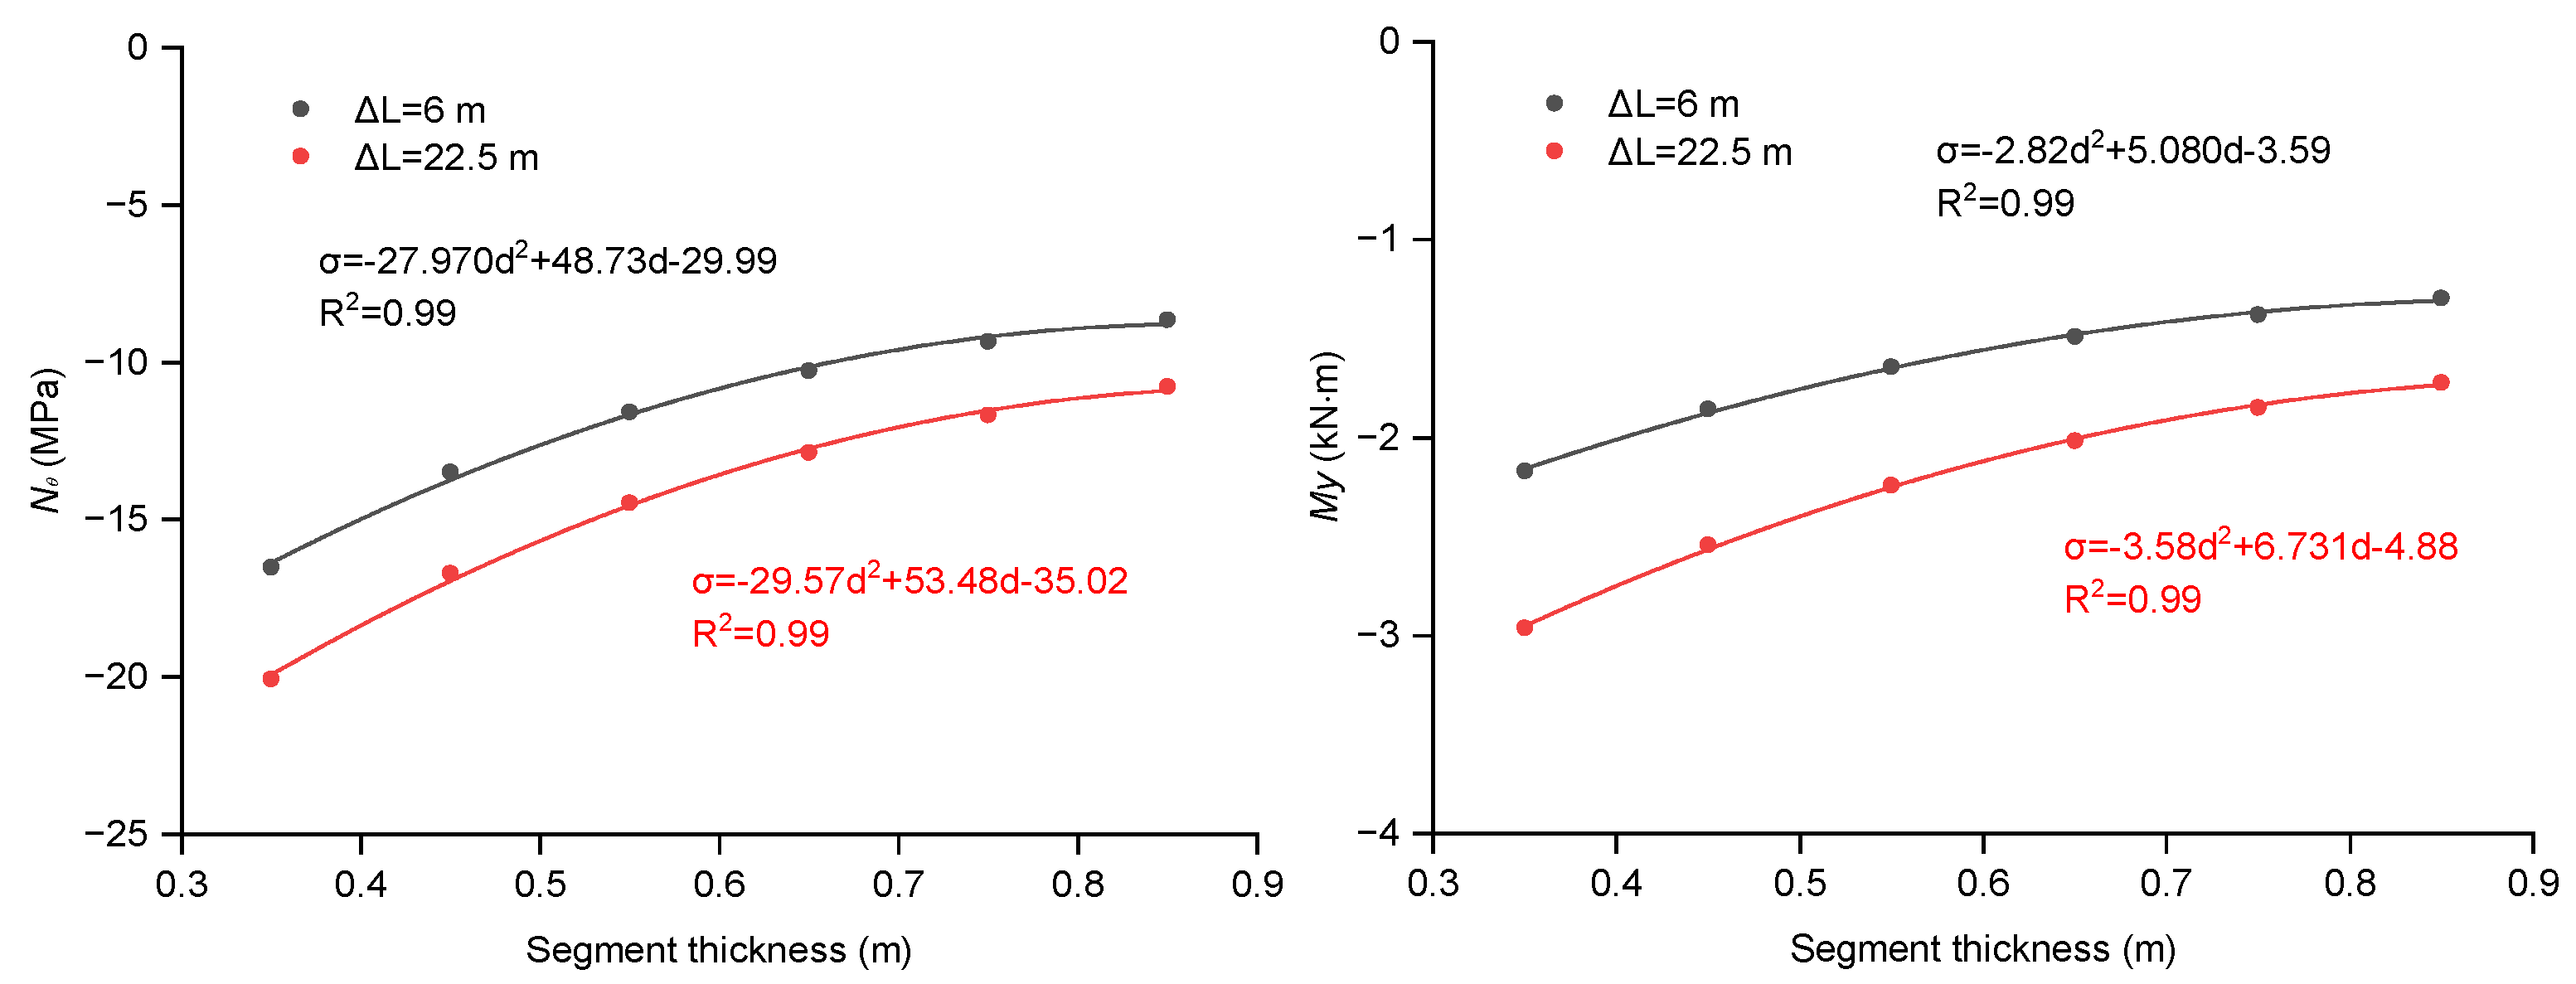
The relationships between the minimum values of Nθ and My of different linings and the lining thickness are plotted in Figure 9. The absolute maximum values of Nθ and My with the lining thickness satisfy a quadratic polynomial based on regression analysis. The fitting results are as follows:
where d is the lining thickness, m; Nθ,min is the minimum hoop force of the lining, MN/m; and My,min is the minimum bending moment of the lining, MN·m/m.

Figure 9.
Regression analysis results of the maximum hoop force and bending moment for linings with different lining thicknesses.
According to the fitting results, when d = 0.85 m, the change rates of Nθ,min with d are 0.01 MN/m/cm (ΔL = 6 m) and 0.03 MN/m/cm (ΔL = 22.5 m). The change rates of My,min with d are 0.003 MN·m/m/cm (ΔL = 6 m) and 0.006 MN·m/m/cm (ΔL = 22.5 m). Therefore, it can be concluded that when the lining thickness is greater than 0.85 m, increasing the lining thickness will have no obvious effect on reducing the lining internal force.
The difference values of Nθ and My between the two excavated stages, i.e., ΔL = 6 m and ΔL = 22.5 m, at the crown, waist and invert with different thicknesses are listed in Table 2 and Table 3. The mathematical symbols Δ and δ denote the absolute difference and the relative difference, respectively, based on the state of instant support (ΔL = 6 m). The differences in Nθ and My, including both the absolute difference Δ and the relative difference δ, decreased as the lining thickness increased. Numerically, the increase in the lining thickness mainly affected the differences in Nθ and My at the waist, but had less of an effect on the crown and invert. ΔN and δN at the crown of the tunnel ranged from 9.52~2.11 MN/m, 19.60~47.43%, respectively. It is noted that the differences in Nθ have a little change except the thickness was 0.35 m. There are no significant differences in δN which are about 20%. It indicates that it has little effect on the difference between long-term and short-term loads with increasing the lining thickness.
Table 2.
Variation in the hoop force Nθ with increasing lining thickness.
Table 3.
Variation in the bending moment My with increasing lining thickness.
While ΔM and δM at the crown are larger than that at the crown and at the invert. ΔM and δM at the crown ranged from 0.42~0.79 MN·m/m and 32.74~36.55%, respectively. Additionally, the ΔM and δM at the crown and at the invert are approximately 0.2~0.3 MN·m/m and 14~17%. The results show that an increase in the lining thickness is beneficial for reducing the increases in My at the waist during excavation, thus improving the stability at the spring line.
5.4. Variation in the Hoop Stress Ratio of Hoop Force to Bending Moment with Thickness
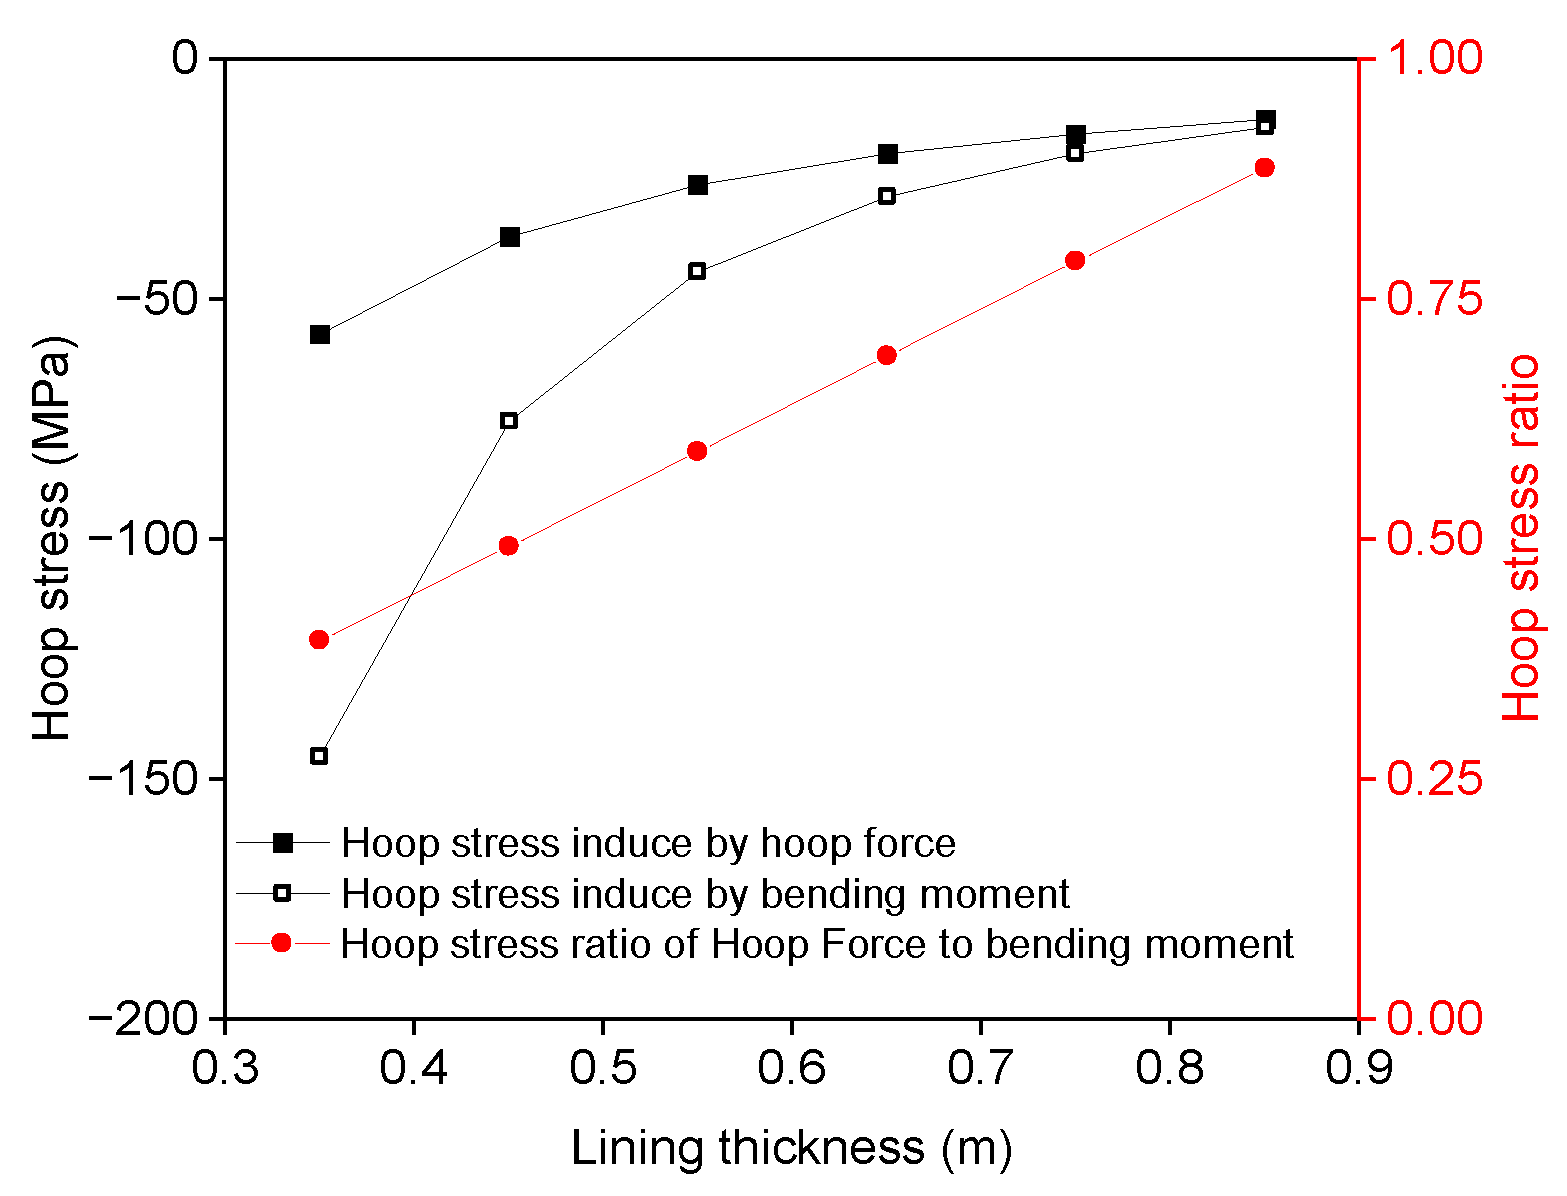
The hoop stress at the tunnel waist induced by Nθ and My and their ratio are plotted for an increasing lining thickness (seen in Figure 10). The hoop stress of the lining was induced by My when the lining thickness was relatively small. The hoop stress induced by My increased significantly as the lining thickness increased compared with that induced by Nθ. The ratio of the hoop stress induced by the hoop force to that induced by the bending moment has a linear relationship. The results indicate that the increase in lining thickness will cause stress adjustment and is beneficial to reducing the hoop stress induced by the bending moment.
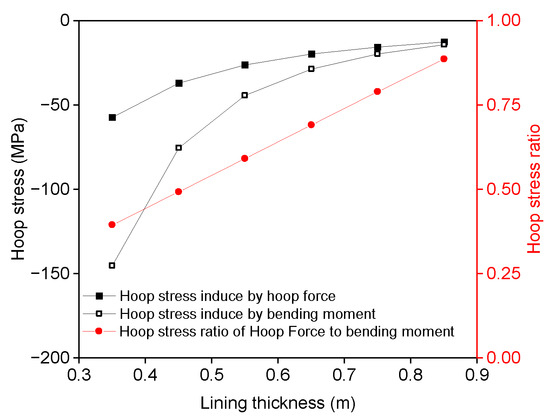
Figure 10.
Relation of hoop stress induced by hoop force and bending moment.
6. Conclusions
In this study, taking the Bailuyuan tunnel of the Hanjiang to Weihe River Valley Water Diversion Project Phase II in Shaanxi Province, China, as an example, a 3D numerical analysis of shield excavation in low-permeability mudstone surrounding rock was established by applying ABAQUS software. The seepage variations in the surrounding rock were investigated. A parametric study was carried out by varying the lining thickness in the range of 0.35~0.85 m to obtain the hydraulic and structural responses of tunnels as the lining thickness increases. The conclusions are as follows.
(1) The seepage stress coupling analysis results show that the mudstone surrounding rock of the tunnel has a good anti-seepage effect. In the excavation process, the pore pressure is negative in the center of the face due to unloading deformation.
(2) With the timely support of the lining, the deformation of the surrounding rock is smaller than that of the face, its external water pressure is slightly larger than that of the face, and it presents a V-shaped change process with the excavation process.
(3) The circumferential lining mainly bears the compressive stress, which is mainly caused by the bending moment.
(4) Increasing the lining thickness is beneficial to reducing the hoop stress induced by the bending moment, but has little effect on reducing the stress induced by the hoop force. The research results provide a reference for the safe and optimal construction of the Hanjiang to Weihe River Valley Water Diversion Project.
Author Contributions
Conceptualization, C.L. and Z.W.; methodology, C.L. and Z.W.; software, C.L. and Q.L.; validation, C.L., Z.W. and Q.L.; formal analysis, C.L.; resources, C.L., Z.W. and Q.L.; data curation, C.L. and Z.W.; writing—original draft preparation, C.L.; writing—review and editing, C.L.; visualization, C.L. and Q.L.; supervision, Z.W.; project administration, Z.W. All authors have read and agreed to the published version of the manuscript.
Funding
This work was supported by the National Natural Science Foundation of China (Grant number 51279168), the Water Conservancy Science and Technology Program Projects in Shaanxi Province (Grant number 2021-slkj-1), Special Fund for University Scientific Research of Shaanxi Province Institute of Water Resources and Electric Power Investigation and Design (Grant number SXY-KYJJ-002), and the Central Public-Interest Scientific Institution Basal Research Fund (Grant number Y322008).
Institutional Review Board Statement
Not applicable.
Informed Consent Statement
Not applicable.
Data Availability Statement
Not applicable.
Acknowledgments
The authors thank the Hanjiang River to Wei River Basin Water Diversion Project Construction Co., LTD.
Conflicts of Interest
The authors declare that they have no known competing financial interests or personal relationships that could have appeared to influence the work reported in this study.
References
- Gabriel, L.; Heiko, K.; Alexandre, C.; Steffen, P.; Kurosch, T. Performance analysis of utility tunneling data: A case study of pipe jacking in hard rock in Brittany, France. Tunn. Undergr. Space Technol. 2022, 127, 104574. [Google Scholar]
- Guo, J.; Xu, L.; Xu, C.; Chen, R.; Lin, J. Dynamic response analysis on stress and displacement of the shield tunnel structure and soil layer under train-induced vibration in Xiamen Metro Line 6. Sustainability 2022, 14, 11962. [Google Scholar] [CrossRef]
- Shi, X.; Cao, Y.; Rong, C.; An, G.; Wang, H.; Cui, L. Influence of pipeline leakage on the ground settlement around the tunnel during shield tunneling. Sustainability 2022, 14, 16802. [Google Scholar] [CrossRef]
- Chen, S.; Guo, P.; Ma, J.; Li, X.; Lin, H.; Zhao, Y.; Wang, Y. Soil heterogeneity effects on bridge piles deformation under shield tunneling disturbance. Sustainability 2022, 14, 16854. [Google Scholar] [CrossRef]
- Zhou, Z.; Ling, T.; Huang, F.; Zhang, M. The face stability analysis of shield tunnels subjected to seepage based on the variational principle. Sustainability 2022, 14, 16538. [Google Scholar] [CrossRef]
- Gao, Y.; Liu, Y.; Tang, P.; Mi, C. Modification of Peck formula to predict surface settlement of tunnel construction in water-rich sandy cobble strata and its program implementation. Sustainability 2022, 14, 14545. [Google Scholar] [CrossRef]
- Shen, Y.; Zhang, T.; Liu, H.; Zhu, J.; Yang, P.; Wang, Y. Research on leakage mechanism of underwater shield tunnels with different soil layers during operation period. Sustainability 2022, 14, 14276. [Google Scholar] [CrossRef]
- Zhou, L.; Zhu, H.; Yan, Z.; Shen, Y.; Sun, W.; Li, Y. Full-scale loading test on mechanical properties of deep-buried shield segmental linings bearing high inner water pressure. China Civ. Eng. J. 2022, 55, 94–105+17. [Google Scholar]
- Wang, F.; Shao, J.; Li, W.; Wang, Y.; Liu, H. Numerical simulation study on lining damage of shield tunnel under train load. Sustainability 2022, 14, 14018. [Google Scholar] [CrossRef]
- Liang, Y.; Jiang, K.; Gao, S.; Yin, Y. Prediction of tunnelling parameters for underwater shield tunnels, based on the GA-BPNN method. Sustainability 2022, 14, 13420. [Google Scholar] [CrossRef]
- Feng, X.; Hou, D.; Huang, Z. The influence of shield tunneling characteristics on the safety of buildings above-Case study for Shanghai zone. Sustainability 2022, 14, 13391. [Google Scholar] [CrossRef]
- Zhao, Y.; Wei, Y.; Jiang, J.; Jin, H. Effects of influence parameters on freezing wall temperature field in subway tunnel. Sustainability 2022, 14, 12245. [Google Scholar] [CrossRef]
- Zhang, J.; Huang, L.; Peng, T. Stability analysis of shield excavation face based on particle flow in different depths of sandy gravel stratum. Adv. Civ. Eng. 2019, 2019, 7249724. [Google Scholar]
- Li, C.; He, S.; Liu, X. Study on main parameters control of tunneling through the yellow river by a slurry balance shield in sandy gravel stratum with some large-size grains. China Civ. Eng. J. 2017, 50, 147–152. [Google Scholar]
- Zhu, C. Surface settlement analysis induced by shield tunneling construction in the loess region. Adv. Mater. Sci. Eng. 2021, 2021, 5573372. [Google Scholar] [CrossRef]
- Zhang, M.; Dai, Z.; Zhang, X.; Javadi, A.A. Active failure characteristics and earth pressure distribution around deep buried shield tunnel in dry sand stratum. Tunn. Undergr. Space Technol. 2022, 124, 104479. [Google Scholar] [CrossRef]
- Cao, L.; Zhang, D.; Fang, Q.; Hou, Y. Ground vertical displacements due to shield tunnelling in double-layer soil. Chin. J. Rock Mech. Eng. 2019, 38, 634–648. [Google Scholar]
- Do, N.; Dias, D.; Oreste, P.; Djeran-Maigre, I. 2D numerical investigation of segmental tunnel lining behavior. Tunn. Undergr. Space Technol. 2013, 37, 115–127. [Google Scholar] [CrossRef]
- Qin, X.; Zhang, G.; Ge, R. Effect of erosion void on segmental tunnel lining: 2D numerical investigation. Transp. Geotech. 2022, 35, 100792. [Google Scholar] [CrossRef]
- Liu, X.; Feng, K.; He, C.; Zhang, H. Quantitative evaluation index for analysis of assembly effect on shield tunnel segment structures. KSCE J. Civ. Eng. 2022, 26, 4117–4127. [Google Scholar] [CrossRef]
- Shivaei, S.; Hataf, N.; Pirastehfar, K. 3D numerical investigation of the coupled interaction behavior between mechanized twin tunnels and groundwater – A case study: Shiraz metro line 2. Tunn. Undergr. Space Technol. 2020, 103, 103458. [Google Scholar] [CrossRef]
- Vitali, O.P.M.; Celestino, T.B.; Bobet, A. 3D finite element modelling optimization for deep tunnels with material nonlinearity. Undergr. Space 2018, 3, 125–139. [Google Scholar] [CrossRef]
- Zheng, G.; Fan, Q.; Zhang, T.; Zhang, Q. Numerical study of the Soil-Tunnel and Tunnel-Tunnel interactions of EPBM overlapping tunnels constructed in soft ground. Tunn. Undergr. Space Technol. 2022, 124, 104490. [Google Scholar] [CrossRef]
- Jallow, A.; Ou, C.; Lim, A. Three-dimensional numerical study of long-term settlement induced in shield tunneling. Tunn. Undergr. Space Technol. 2019, 88, 221–236. [Google Scholar] [CrossRef]
- Jiang, H.; Sun, X.; Cao, P.; Yu, T. Study on stress characteristics and stability of lining structure of water-conveyance tunnel under high geo-temperature. Water Resour. Hydropower Eng. 2018, 49, 94–102. [Google Scholar]
- Li, Z.; Luo, Z.; Xu, C.; Tan, J. 3D fluid-solid full coupling numerical simulation of soil deformation induced by shield tunnelling. Tunn. Undergr. Space Technol. 2019, 90, 174–182. [Google Scholar] [CrossRef]
- Chaipanna, P.; Jongpradist, P. 3D response analysis of a shield tunnel segmental lining during construction and a parametric study using the ground-spring model. Tunn. Undergr. Space Technol. 2019, 90, 369–382. [Google Scholar] [CrossRef]
- Soomro, M.A. 3D finite element analysis of effects of twin stacked tunnels at different depths and with different construction sequence on a piled raft. Tunn. Undergr. Space Technol. 2021, 109, 103759. [Google Scholar] [CrossRef]
- Yuan, Q.; Chen, S.; Xiao, J.; Xiong, Q.; Zhang, Z. Research on Large Deformation Mechanism and Countermeasures of Shallow Buried Soft Rock Tunnel with Abundant Water. In Proceedings of the 2nd International Conference on Geology, Mapping and Remote Sensing, Zhangjiajie, China, 23–25 April 2021. [Google Scholar]
- Huang, Z.; Zhang, H.; Fu, H.; Ma, S.; Liu, Y. Deformation response induced by surcharge loading above shallow shield tunnels in soft soil. KSCE J. Civ. Eng. 2020, 24, 2533–2545. [Google Scholar] [CrossRef]
- Yuan, D.; Zhan, W. Comparison of construction methods for shallow burial tunnel with soft rock and large span. IOP Conf. Ser. Earth Environ. Sci. 2019, 300, 022047. [Google Scholar] [CrossRef]
- Wang, Z.; Yao, W.; Cai, Y.; Xu, B.; Fu, Y.; Wei, G. Analysis of ground surface settlement induced by the construction of a large-diameter shallow-buried twin-tunnel in soft ground. Tunn. Undergr. Space Technol. 2019, 83, 520–532. [Google Scholar] [CrossRef]
- Li, Y.; Zhang, C.; Zheng, C.; Jin, Y. Analysis of numerical simulation methods for excavation damage zone of deep tunnels in hard rocks. Chin. J. Taiyuan Univ. Technol. 2017, 48, 753–757. [Google Scholar]
- Huang, Z.; Zhu, W.; Zhang, P.; Tang, C.; Tang, L. Numerical simulation of surrounding rock stability of deep hard rock tunnel. Chin. J. Undergr. Space Eng. 2017, 13, 605–612. [Google Scholar]
- Goodarzi, S.; Hassanpour, J.; Yagiz, S.; Rostami, J. Predicting TBM performance in soft sedimentary rocks, case study of Zagros mountains water tunnel projects. Tunn. Undergr. Space Technol. 2021, 109, 103705. [Google Scholar] [CrossRef]
- Wang, S.; Li, C.; Liu, Z.; Fang, J. Optimization of construction scheme and supporting technology for HJS soft rock tunnel. Int. J. Min. Sci. Technol. 2014, 24, 847–852. [Google Scholar] [CrossRef]
- Zhang, J.; He, Z.; Yu, X. Three-dimensional finite element modeling of soft rock tunnel with large section: A case study. Front. Phys. 2020, 8, 577787. [Google Scholar] [CrossRef]
- Guo, X.; Zhu, Y.; Tan, Z.; Li, L.; Li, A.; Yan, Y. Research on support method in soft rock tunnel considering the rheological characteristics of rock. Arab. J. Geosci. 2021, 14, 2703. [Google Scholar] [CrossRef]
- Lin, W.; Cheng, J.; Li, D.; Dang, H. Deformation characteristics and control technology of roadway in water-rich soft rock. Geofluids 2022, 2022, 2234334. [Google Scholar] [CrossRef]
- Wang, X.; Zhang, Y.; Zhang, Q.; Wei, Y.; Liu, W.; Jiang, T. Space-time evolution characteristics of deformation and failure of surrounding rock in deep soft rock roadway. Sustainability 2022, 14, 12587. [Google Scholar] [CrossRef]
- Yu, L.; Zheng, X.; Liu, Z.; Zhou, C.; Zhang, L. Multiscale modelling of the seepage-induced failure of a soft rock slope. Acta Geotech. 2022, 17, 4717–4738. [Google Scholar] [CrossRef]
- Zhu, Z.; Fang, Z.; Xu, F.; Han, Z.; Guo, X.; Ma, C. Model test study on the rock mass deformation law of a soft rock tunnel under different ground stresses. Front. Earth Sci. 2022, 10, 962445. [Google Scholar] [CrossRef]
- Kim, K.; Oh, J.; Lee, H.; Kim, D.; Choi, H. Critical face pressure and backfill pressure in shield TBM tunneling on soft ground. Geomech. Eng. 2018, 15, 823–831. [Google Scholar]
- Chortis, F.; Tzivakos, K.; Kavvadas, M. Investigation of the influence of face pressure on surface settlements in EPB mechanized tunnelling. In Proceedings of the 2nd Eastern European Tunnelling Conference “Tunnelling in a Challenging Environment” Making tunnelling business in difficult times, Athens, Greece, 28 September–1 October 2014. [Google Scholar]
- Li, W.; Gang, Z. Numerical evaluation of the upheave and soil arching associated with compaction grouting in shield tunneling and loading process. Tunn. Undergr. Space Technol. 2022, 128, 104664. [Google Scholar]
- Chen, W.; Wu, G.; Jia, S. Application of ABAQUS in Tunnel and Underground Engineering (Water and Hydropower version). Rock Soil Mech. 2010, 31, 552. [Google Scholar]
- Yu, N.; Zhu, H. Analysis of earth deformation caused by shield tunnel construction and 3D-FEM simulation. Chin. J. Rock Soil Mech. 2004, 25, 1330–1334. [Google Scholar]
- Franzius, J.N.; Potts, D.M. Influence of mesh geometry on three-dimensional finite-element analysis of tunnel excavation. Int. J. Geomech. 2005, 5, 256–266. [Google Scholar] [CrossRef]
- Kasper, T.; Meschke, G. A 3D finite element simulation model for TBM tunnelling in soft ground. Int. J. Numer. Anal. Methods Geomech. 2004, 28, 1441–1460. [Google Scholar] [CrossRef]
- Xu, T.; Bezuijen, A. Analytical methods in predicting excess pore water pressure in front of slurry shield in saturated sandy ground. Tunn. Undergr. Space Technol. 2018, 73, 203–211. [Google Scholar] [CrossRef]
- Tan, Y.; Chen, J.; Wang, J. Practical investigation into two types of analyses in predicting ground displacements due to dewatering and excavation. J. Aerosp. Eng. 2015, 28, A4014001. [Google Scholar] [CrossRef]
- Gharti, H.N.; Oye, V.; Komatitsch, D.; Tromp, J. Simulation of multistage excavation based on a 3D spectral-element method. Comput. Struct. 2012, 100, 54–69. [Google Scholar] [CrossRef]
- Hsi, J.P.; Small, J.C. Simulation of excavation in a poro-elastic material. Int. J. Numer. Anal. Methods Geomech. 1992, 16, 25–43. [Google Scholar] [CrossRef]


Disclaimer/Publisher’s Note: The statements, opinions and data contained in all publications are solely those of the individual author(s) and contributor(s) and not of MDPI and/or the editor(s). MDPI and/or the editor(s) disclaim responsibility for any injury to people or property resulting from any ideas, methods, instructions or products referred to in the content. |
© 2022 by the authors. Licensee MDPI, Basel, Switzerland. This article is an open access article distributed under the terms and conditions of the Creative Commons Attribution (CC BY) license (https://creativecommons.org/licenses/by/4.0/).