Abstract
In the last decades, several multidimensional models for measuring and evaluating the innovation capacity and performance of organisations have been designed by researchers and consulting firms and adopted by established innovative organisations worldwide. However, the topic of measurement and evaluation models that are designed for sustainability-oriented innovation management has remained underexplored by researchers and practitioners. From this perspective, this work proposes a conceptual model for measuring and evaluating the sustainability-oriented innovation capacity (SOIC) and performance (SOIP) of established organisations, guided by the following principles: a multidimensional structure, stakeholder goal orientation, interdependence and feedback loop analyses, innovation process orientation and ease of implementation and use. In line with these principles, the proposed model combines the balanced scorecard (BSC) framework with a hybrid multicriteria methodological approach. Furthermore, it considers the interdependencies between the key innovation indicators (KIIs), which are classified according to four perspectives of an adapted BSC framework. The proposed conceptual model, and the empirical results that demonstrate its applicability in an organisational context, may contribute to improving the current practices for measuring and evaluating the SOIC and SOIP, which could help organisations to adjust their strategies to create sustainable value for the new era of business.
1. Introduction
Since the Brundtland Report, the concept of sustainable development (SD) has evolved beyond the initial intergenerational framework to a focus on socially inclusive and environmentally sustainable economic growth [1]. Nowadays, SD refers to achieving a balance between individual systems that require interdisciplinary initiatives over time for local, national, regional or organisational decision-making issues. Remarkably, within the UN 2030 Agenda framework, the United Nations established 17 Sustainable Development Goals (SDGs) in 2015 as a global call to action to end poverty, protect the environment and ensure that by 2030, people enjoy peace and prosperity [2]. Furthermore, considering the central role of Science, Technology and Innovation (STI) for SDGs implementation, the Agenda calls for a global Technology Facilitation Mechanism (TFM) to enable international cooperation regarding access to STI, and to enhance knowledge sharing to achieve the SDGs [3,4]. In addition, there is a call to enhance the STI capacity of developing countries, and to promote the development and use of emerging technologies to achieve the SDGs in these countries [4,5].
At the organisational level, sustainability-oriented innovations (SOIs) are addressed to create and realise social and environmental value, in addition to economic returns, by making intentional changes to an organisation’s philosophy and values, as well as to its products, processes or practices [6,7,8,9,10].
Innovative organisations enhance their general competence bases and stimulate learning processes, which may benefit themselves and other organisations. Thus, the innovation capability refers to the ability to understand changes in business environments, grasp market opportunities and create new knowledge and solutions internally or in collaboration with strategic partners [11].
According to Lawson and Samson, organisations with this innovation capability have “the ability to integrate key capabilities and resources to stimulate innovation successfully” [12] (p. 380). Based on [6,7,8,9,10,13], we can define the SOI capability as the dynamic ability to adapt, integrate and reconfigure organisational skills, resources and functional competencies to respond to contemporary sustainability challenges.
The methodological approaches for measuring innovation capabilities that are relevant for research on strategic innovation management have focused on the following: (i) the resources controlled by the organisation; (ii) the organisation’s general management capabilities, including the capabilities related to managing innovation activities; (iii) the human capital and how the organisation manages it; (iv) the ability to develop and use technological tools and data resources, with the latter providing an increasingly important source of information for innovation [14].
In this regard, some researchers have defined new indicators and investigated the factors behind the innovation performance throughout the RD&I processes (e.g., [15]). Several multidimensional innovation performance measurement models have been designed in the last decades to address this need. Most of these models combine financial and nonfinancial indicators to measure the organisation’s tangible and intangible assets and value. Some outstanding examples are the balanced scorecard (BSC) [16,17,18] and the performance prism frameworks [19,20].
The BSC framework has been used by organisations for the strategic monitoring and evaluation of their business performance. It is a methodological approach that employs lead and lag indicators that are aligned to the organisation’s vision, mission and value statements. This approach assumes that the business performance can be evaluated considering financial and nonfinancial indicators [16,17,18]. It is considered a helpful tool to measure the innovation capacity and performance at the organisational level, but only if a reasonable attempt to adapt the original framework for this purpose has been made.
Two streams can be distinguished among the previous works that have adapted the BSC framework to measure and evaluate the innovation capacity and performance [21,22,23,24,25,26,27,28,29,30,31,32,33,34,35,36,37,38,39,40,41,42]. The first stream emphasises the measurement and evaluation of the R&D outcomes and processes [21,22,23,24,25,26,27], while the second focuses on the innovation capacity performance [28,29,30,31,32,33,34,35,36,37,38,39,40,41,42].
We summarise 22 empirical studies in Appendix B (Table A3) to show that considerable research has been dedicated to developing and applying models for measuring and evaluating the innovation capacity and performance based on adaptations of the original BSC framework. However, despite these efforts, two research gaps could be identified.
The first gap refers to the use of an MCDM approach to analyse the interdependencies and feedback loops among the strategic innovation goals and key innovation indicators associated with the BSC perspectives. Although some multicriteria decision-making (MCDM) methods have been used to model BSC frameworks for various purposes [43,44], no previous studies have adapted the original Kaplan and Norton model to measure and evaluate the R&D or innovation performance at the organisational level [21,22,23,24,25,26,27,28,29,30,31,32,33,34,35,36,37,38,39,40,41,42] using MCDM approaches.
Notwithstanding the importance of the results achieved so far, a second research gap was found: none of the previous models for measuring and evaluating the innovation capacity and performance adhere to the principles of multidimensional structure, interdependence and feedback loop analyses, innovation process orientation and easy implementation, as suggested by Dewangan and Godse [34], for the design of holistic innovation performance measurement systems.
Considering the following:
- Nowadays, the BSC approach is a methodological reference that guides organisations to determine their corporate performance by means of leading and lagging indicators that are aligned with their visions and business strategies;
- The concepts of innovative capacity and performance are second-order constructs of innovation management, and they are operationalised in the form of interdependencies and feedback loops;
- The literature review on the measurement and evaluation of RD&I management revealed that various previous works essentially focused on the adaptation of the original BSC model and the identification of the RD&I indicators associated with the BSC perspectives;
- The feedback and interdependencies among the networked elements of the SOIC and SOIP constructs have been neglected in previous works;
- The integration of a multicriteria decision-making approach into an adapted BSC framework for sustainability-oriented innovation management has remained unknown to researchers and managers;
- A methodological approach that combines an adapted BSC framework with a multicriteria approach can significantly contribute to improving the current practices for measuring and evaluating the innovation capacity and performance of established organisations from a sustainability-oriented strategic vision.
This paper addresses the research gaps by investigating the following research questions:
- RQ1: How do we measure and evaluate the sustainability-oriented innovation capacity (SOIC) and performance (SOIP) of established organisations while adhering to the principles of multidimensional structure, interdependency and feedback analyses, innovation process orientation and easy implementation?
- RQ2: What innovation indicators should be considered in an adapted BSC framework for modelling the sustainability-oriented innovation capacity (SOIC) and performance (SOIP) measurement and evaluation of established organisations, considering the lack of a sustainability focus in the presented literature?
- RQ3: What measurement scales should be integrated into this model to evaluate the the SOIC and SOIP of established organisations?
- RQ4: To what extent can the analytic network process (ANP) and hybrid analytic hierarchy process (AHP)/technique for order of preference by similarity to ideal solution (TOPSIS) method contribute to improving the focused process in innovative organisations, considering that complexity, multidimensionality and uncertainty are inherent to this type of process?
From a systemic and sustainability-oriented perspective, this paper proposes a model for measuring and evaluating the SOIC and SOIP of established organisations based on an adapted BSC framework combined with a multicriteria decision-making approach. In comparison with the previous studies reviewed in this work, we highlight the fundamental methodological differences as follows:
- The adaptation of the original BSC framework to incorporate social and environmental dimensions into the organisation’s strategy, considering that the process associated with sustainability-oriented innovation is a nonlinear construct that should be integrated into the business strategies of organisations;
- The alignment of the conceptual model with the guiding principles defined by Dewangan and Godse [34] for designing a model for measuring and evaluating the innovation capacity and performance of established organisations;
- The use of the Analytic Hierarchy Process (AHP) and the Technique for Order Preference by Similarity to Ideal Solution (TOPSIS) methods to select the key innovation indicators (KIIs) associated with each BSC perspective, which provides managers with flexibility when choosing the best ones according to the organisation’s business environment;
- With the support of the Analytic Network Process (ANP) method, a network can be formed of the strategic innovation goals (SIGs) and KIIs (network clusters), incorporating the feedback and interdependent relationships within and between these networked elements;
- The SOIC indicators and metrics are associated with the lower BSC perspectives, (i.e., ‘Internal Process’ and ‘Learning and Growth’), while the SOIP indicators and metrics refer to the upper BSC perspectives (i.e., ‘Sustainability’ and ‘Market’);
- The SOIC and SOIP indexes can be graphically represented in dashboard format. It is a methodological option to align the assessment results with the best-known monitoring practices (e.g., dashboards in multidimensional frameworks). Therefore, this option aligns with one of the guiding principles adopted for the modelling phase: easy implementation and use.
The article is structured in six sections. Following the introduction, Section 2 briefly presents the research design and adopted methodology. Section 3 introduces the conceptual model for measuring and evaluating the SOIC and SOIP of organisations, aligned with the principles of multidimensional structure, interdependence and feedback loop analyses, innovation process orientation and easy implementation. Section 4 presents and discusses the results of an empirical study conducted on an innovative company in the Brazilian electricity sector, with the aim of demonstrating the applicability of the proposed model in a corporate environment. The SOIC and SOIP indexes could be calculated from the assessment of the current situation of the SOIC and SOPI associated with the 23 key innovation indicators that integrate the company’s corporate sustainability strategy. In Section 5, we discuss the contributions of the proposed model compared with those of previous works, as well as the managerial implications for innovative organisations that aim to incorporate the social and environmental dimensions, in addition to economic ones, into their innovation and business strategies. Lastly, Section 6 synthesises the concluding remarks and future developments of this research for those interested in advancing the knowledge on the “Innovation Management and Organizational Performance for Sustainable Future”.
2. Research Design and Methodology
The research design encompassed three phases and six stages, following a procedural model based on Martins et al. [45], to provide an underlying structure and approved course of action for this research. This section describes the research methods for addressing the questions posed in Table 1. Accordingly, the research phases are as follows: (i) motivation; (ii) conceptualisation and development; (iii) validation.

Table 1.
Research design.
Associated with these three phases, the stages described in Table 1 are as follows: Stage 1: the problem definition and rationale for the research; Stage 2: the state of the research in terms of the central themes, and the identification of the research gaps and unsolved problems in the focused field; Stage 3: the definition of the research methodology; Stage 4: the development of the conceptual model for measuring and evaluating the SOIC and SOIP of organisations; Stage 5: the application of the conceptual model in the context of an innovative company in the electricity sector in Brazil; Stage 6: a discussion of the research results and implications of the adoption of the proposed model by other sustainability-oriented organisations.
The first two stages covered a literature review of scientific articles and reference documents published between 1992 and 2022 to obtain the conceptual and empirical works related to the central themes of this research. For this, systematic searches were carried out in the leading scientific production databases (e.g., Scopus, Web of Science), as detailed in Appendix A (Table A1 and Table A2). These searches were complemented with subsequent searches on Google Scholar, and afterwards, the bibliographic review was deepened, with an analysis of the references cited in the most relevant articles (backward search). As a result, we identified and selected 22 previous studies that adapted the original Kaplan and Norton model to measure and evaluate the R&D or innovation performance at the organisational level [21,22,23,24,25,26,27,28,29,30,31,32,33,34,35,36,37,38,39,40,41,42], as summarised in Appendix B (Table A3).
The third stage refers to the definition of the research methodology, which comprises the following: (i) a literature review of the scientific articles and documents published between 1992 and 2022 on the central research themes, selecting the most relevant works, as mentioned before; (ii) the development of a conceptual model for measuring and evaluating the SOIC and SOIP of organisations, aligned with the following guiding principles: multidimensional structure, interdependence and feedback loop analyses, innovation process orientation and easy implementation and use; (iii) the development of an empirical study on an innovative company in the Brazilian electricity sector to demonstrate the conceptual model’s applicability in an organisational context.
A conceptual model was developed in the fourth stage, guided by the four principles. This model comprises six stages, as follows: (i) the determination of the analytical network structure based on the BSC framework [16,17,18], with the support of the ANP and TOPSIS methods; (ii) the design and pretesting of a questionnaire for pairwise comparisons of the elements that integrate the analytical structure defined in Stage 1; (iii) pairwise comparisons for determining the importance weights of the network elements and clusters; (iv) the calculation of the limit supermatrix and resulting weights of the network elements; (v) the determination of five-point scales for measuring the SOIC and SOIP of a given organisation; (vi) the application of the self-assessment instrument and the calculation of the SOIC and SOIP indexes.
Finally, in the validation phase, an empirical study was developed on an innovative company in the Brazilian electric sector to demonstrate the applicability of the conceptual model proposed in the previous phase. From the empirical findings presented in Section 4, we discuss the implications of adopting the proposed model in other sustainability-oriented organisations.
3. Conceptual Model for Measuring Organisation Innovation Performance
This section introduces the conceptual model for measuring and evaluating the SOIC and SOIP of established organisations, which is schematically represented in Figure 1.
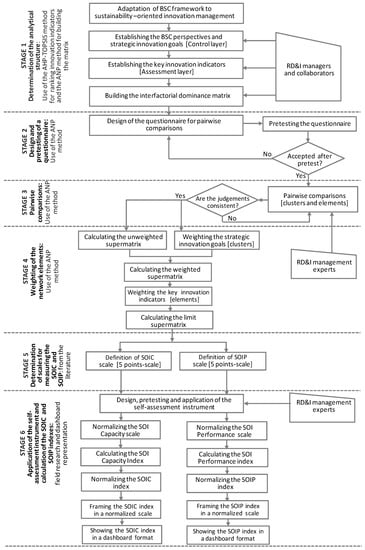
Figure 1.
General view of conceptual model for measuring and evaluating SOIC and SOIP of established organisations.
Aligned with the guiding principles proposed in [34], and based on the BSC framework combined with the ANP and TOPSIS methods, the conceptual model comprises six stages, as follows:
- The determination of the analytic network structure based on the BSC framework, with the support of the ANP and hybrid AHP/TOPSIS methods;
- The design and pretesting of a questionnaire for pairwise comparisons of the network elements and clusters that integrate the analytical structure defined in Stage 1;
- Pairwise comparisons for determining the importance weights of the network elements and clusters;
- The calculation of the limit supermatrix and resulting weights of the network elements;
- The determination of two five-point scales for measuring the SOIC and SOIP levels;
- The application of the self-assessment instrument and calculation of the SOIC and SOIP indexes.
3.1. Stage 1: Determination of an Analytic Network Structure Based on BSC Framework
Based on the BSC framework [16,17,18] and principle of operability, the SOIC and SOIP levels of organisations can be measured and evaluated considering four assessment perspectives: (1) ‘Sustainability’ (B1); (2) ‘Market’ (B2); (3) ‘Internal Process’ (B3); (4) ‘Learning and Growth’ (B4). These perspectives were adapted from the original Kaplan and Norton perspectives for application in the strategic innovation management processes of established organisations with strategies that are oriented towards sustainability.
Figge et al. [46] argued that the BSC framework can encompass all the relevant aspects for achieving sustainability in a balanced manner. The sustainable BSC, as they proposed, is a framework for measuring, managing and reporting the results of sustainable corporate strategies. Butler et al. [47] suggested three alternative scenarios for creating a sustainable BSC: (i) the integration of the environmental and social aspects into the existing four original dimensions; (ii) the creation of a fifth perspective to include social and environmental aspects in the strategy map; (iii) the formulation of a specific environmental or social scorecard.
Based on [46,48], we then considered the first scenario by proposing a “Sustainability” (B1) perspective that is aligned to the triple-bottom-line sustainability approach [47]. In other words, this perspective integrates economic (corresponding to Kaplan and Norton’s original “Financial” perspective), environmental and social sustainability.
In addition, similar to the BSC model proposed by Spanò et al. [38], the strategic innovation goals were associated with the four BSC perspectives after the mentioned adaptation. Therefore, the top managers within organisations should establish their strategic innovation goals as part of their sustainability-oriented strategic planning, the results of which can be schematically represented in a ‘strategy map’, as conceived by Kaplan and Norton [18].
After establishing the strategic innovation goals associated with the four adapted BSC perspectives, RD&I managers and collaborators should define the key innovation indicators that integrate the analytical network structure for the SOIC and SOIP measurement and evaluation.
It is important to mention that the key innovation indicators and metrics must be chosen by each organisation, and they depend on the organisation’s business strategy. Accordingly, these indicators should be selected among the various innovation indicators reported in previous works [21,22,23,24,25,26,27,28,29,30,31,32,33,34,35,36,37,38,39,40,41,42], reference documents and surveys adopted by regional and national initiatives to measure the innovation capacity and performance of companies. An example is the Community Innovation Survey (CIS) in Europe [49], which is based on the guidelines proposed by the Organisation for Economic Co-operation and Development (OECD) for collecting and interpreting technological innovation data [14].
Established organisations can conduct this step in light of the criteria for selecting the indicators usually adopted in the field of monitoring and evaluation [50,51,52], starting from an initial list of innovation indicators gathered from the literature and reference documents (see Appendix C, Table A4).
The following criteria for ranking and selecting good-quality innovation indicators are suggested for use in this stage:
- C1—Relevance: The innovation indicator should be a valid measure of the result/outcome of a sustainability-oriented innovation strategy;
- C2—Measurability: The innovation indicator can be counted, observed, analysed, tested or challenged. If one cannot measure an indicator, then the progress towards the strategic innovation goal achievement cannot be evaluated;
- C3—Accuracy: Accurate indicators are considered correct. The data measure what they are intended to measure: the progress toward the strategic innovation goal achievement;
- C4—Credibility: The innovation indicator has been recommended and used by leading experts and organisations in the context of innovation management and sustainability (for example, the Global Network for Economics of Learning, Innovation, and Competence Building Systems (Globelics));
- C5—Precision: Precision means that the data collected have sufficient detail concerning the innovation indicator;
- C6—Timeliness: The innovation indicator must be timely in several aspects. The monitoring and evaluation system (and related innovation indicators) allows for the cost-effective tracking of the progress at the desired frequency for a set period.
Before ranking and selecting the innovation indicators from the BSC perspective, the following weights were assigned to the above criteria with the support of the Analytic Hierarchy Process method [53]: C1: 0.217; C2: 0.217; C3: 0.115; C4: 0.120; C5: 0.116; C6: 0.215.
The TOPSIS method was chosen [54] to rank the innovation indicators using a scale with linguistic terms, as shown in Table 2.
Table 2.
Linguistic terms for ranking importance of innovation indicators.
The TOPSIS method comprises five steps: (i) the consensual judgment by RD&I managers and collaborators concerning the performance of the innovation indicators in light of each criterion; (ii) the identification of the positive ideal solutions (A+ (benefits)) and negative ideal solutions (A− (costs)); (iii) the calculation of the Euclidean distances from the positive ideal solution (PIS) and negative ideal solution (NIS) of each innovation indicator from the BSC perspective; (iv) the calculation of the closeness coefficient of each alternative indicator concerning the PIS; (v) the determination of the ranking order of all the key innovation indicators for each BSC perspective. The best alternatives are those with higher closeness coefficient (CCi) values, and therefore they should be chosen because they are closer to the PIS. This procedure should be performed for each BSC perspective. All the formulas and parameters used in this procedure can be found in [54].
Once the strategic innovation goals associated with the four BSC perspectives are established and the respective key innovation indicators are selected, an analytic network structure for measuring and evaluating the SOIC and SOIP can be defined, as detailed in Table 3.
Table 3.
Analytical network structure for measuring and evaluating SOIC and SOIP of established organisations.
The control layer in Table 3 consists of four BSC perspectives and respective strategic innovation goals (from SIG11 to SIG4n). In turn, the assessment layer is composed of ‘n’ key innovation indicators (KIIs), which are organised in clusters that correspond to the strategic innovation goals (from SIG11 to SIG4n). Therefore, they must also be defined by the top managers within the organisation. It is essential to mention that the ‘strategy map’ that is composed of the strategic business goals (including the SIGs), key indicators and initiatives is unique for each organisation.
For measuring and evaluating the SOIC and SOIP of established organisations, the next step is to determine the influences among the key innovation indicators (KIIs). First, a zero–one interfactorial dominance matrix is built, the elements of which take the value of 1 or 0, depending on whether there is (or is not) some influence of one element on another. The matrix’s rows and columns are formed by ‘n’ KIIs, which are grouped into clusters that correspond to the strategic innovation goals (SIGs).
Before going any further, it is essential to emphasise that the four BSC perspectives are equally important in this conceptual model for measuring and evaluating the SOIC and SOIP of established organisations. Thus, in this network model, the pairwise comparisons are restricted to the strategic innovation goals (clusters) and respective key innovation indicators (assessment factors).
3.2. Stage 2: Design and Pretesting of Questionnaire for Pairwise Comparisons of Assessment and Control Elements
The design of a questionnaire for pairwise comparisons should consider the key innovation indicators (assessment layer) and strategic innovation goals (control layer) that integrate the analytic network structure represented in Figure 2.
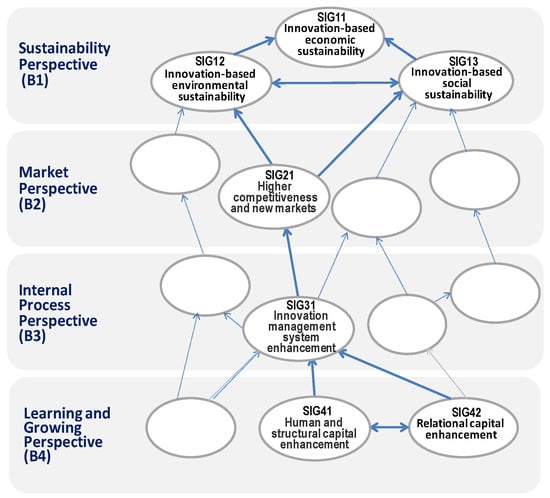
Figure 2.
Schematic representation of ‘strategy map’ of Alpha Company. Note: The seven strategic innovation goals are highlighted in the strategy map of the Alpha Company. Unfilled ellipses represent strategic goals from other business areas.
Table 4.
Saaty’s nine-point scale for paired comparisons.
In this stage, a pretesting of the questionnaire must be undertaken with the participation of innovation management experts to evaluate its clarity, suitability to the respondents, the required time to answer the questions and the possible obstacles that could arise during its application. The final version of the questionnaire must contain objective instructions for proper completion. The judgments in the paired comparisons consist of answering two questions: (i) Which of the two elements is the most important concerning the desired objective, and (ii) With what intensity? For this, the nine-point scale proposed by Saaty [55,56] must be adopted, as shown in Table 4.
After being validated, the questionnaire is ready to be applied to the managers and collaborators engaged in the RD&I activities within the organisation in focus. Suppose there are a number of experts involved in this evaluation. In this case, a consensus can be achieved in a consensus-building meeting [55,56], or by employing fuzzy logic to compute the collective weightings from the individual judgements [57].
3.3. Stage 3: Pairwise Comparisons for Determining Importance Weights of Assessment and Control Elements
In the third stage, Saaty’s nine-point scale (see Table 4) should be used for the pairwise comparisons of the assessment and control elements conducted by the RD&I managers and collaborators involved with the innovation management within the organisation.
When adopting the ANP method, the managers or panel of experts who make judgments or preferences must go through the consistency test that is conducted based on the consistency ratios (CRs) of the pairwise comparison matrixes. This is the ratio of the consistency index to the corresponding random value. The methodological details can be found in [55,56]. The corresponding pairwise comparison matrices are generated to obtain the corresponding eigenvectors (unweighted supermatrix).
The value that corresponds to the priority associated with a specific cluster determines the importance of the elements on which it acts (in the unweighted supermatrix). Thus, the weighted supermatrix can be generated. The weighted supermatrix results from combining the unweighted supermatrix and control hierarchy matrix (i.e., the pairwise comparison of the strategic innovation goals). The latter scores a cluster weight in comparison with all the others to which it is connected. An n × n matrix should be built, where ‘n’ is the number of network clusters. To establish the control hierarchy matrix, a Ci cluster is first chosen. Then, all the others connected with the Ci are pairwise compared to determine their impact on the Ci. In this way, a weighted supermatrix can be obtained. Afterwards, the matrix is limited, and the consolidation of the interdependency and relative weights are gradually derived. Accordingly, a weighted supermatrix can be obtained.
The weights of the selected key innovation indicators can be calculated with the support of Super Decisions® software version 2.8 [58] following these two last steps, as follows: (i) the use of the design-cluster-new order to establish the clusters; (ii) the use of the design-node-new order to establish the element nodes; (iii) the use of do-connections-order to establish the internal connections (internal dependency) within the same cluster, as well as the connections (external dependency) among different clusters; (iv) the use of the assess/compare-pairwise comparison order to compare the relations between the clusters and element nodes according to Saaty’s nine-point scale (Table 4), and to generate a comparison matrix; (v) the use of the computations-unweighted supermatrix order to calculate the unweighted supermatrix, which is aligned to the comparison matrix; (vi) the use of the computations-weighted supermatrix order to calculate the weighted supermatrix, which represents the degree of the global dominance of the corresponding element nodes. The sum of the elements in the columns is 1.
3.4. Stage 4: Calculation of Limit Supermatrix and Resulting Weights of Network Elements
With the support of Super Decisions® 2.8 [58], a computations-limit matrix can be used to calculate the limit supermatrix, which is derived from performing power operations on the weighted supermatrix. Its weighted value tends towards stability. Gradually, the consolidation of the interdependency and relative importance weights are obtained.
3.5. Stage 5: Determination of Five-Point Scales for Measuring SOIC and SOIP
The objective of this stage is to propose two five-point scales based on the common characteristics of previous works [59,60,61,62]. Weerawardena [59] examined the role of the marketing capabilities in a competitive-innovation-based strategy. The research helps to refine and validate the measures of entrepreneurship, marketing skills, organisational innovation and sustained competitive advantage. In turn, Alegre et al. [60] proposed scales for valid measures concerning two key performance dimensions: the effectiveness and efficiency of the product innovation. Calik et al. [61] developed an initial scale to evaluate the sustainable innovation performance. This study presented the first known scale to measure the sustainable innovation performance, and it can be used by organisations to evaluate sustainable product or process innovation performance. A year later, Calik et al. [62] proposed a scale for innovation capability measurement that was based on a survey conducted with enterprises in Turkey.
For this model, we defined two scales that range from Level 5 (high SOIC or SOIP) to Level 1 (low SOIC or SOIP) (Table 5 and Table 6).
Table 5.
Five-point scale for measuring sustainability-oriented innovation capacity (SOIC) at organisation level.
Table 6.
Five-point scale for measuring sustainability-oriented innovation performance (SOIP) at organisation level.
These scales should be adopted during the self-assessment conducted by RD&I managers and collaborators within organisations that are measuring and evaluating their SOIC and SOIP levels (see the description in the next section).
3.6. Stage 6: Application of Self-Assessment Instrument and Calculation of SOIC and SOIP Indexes
In this stage, the design of the self-assessment instrument should consider the network elements (i.e., the ‘n’ clusters (strategic innovation goals)), the ‘n’ key innovation indicators associated with them and the five-point scales proposed in Stage 5 of the model (see Table 5 and Table 6). Pretesting must be undertaken in this stage to evaluate the instrument’s clarity, suitability to the respondents and required time to answer the questions.
After being validated, the self-assessment instrument is ready to be applied to the managers and collaborators engaged in the RD&I activities within the organisation in focus. Considering that complexity, multidimensionality and uncertainty are inherent to innovation capacity and performance measurements, fuzzy logic [57] is strongly recommended in this stage, as various managers and collaborators will undoubtedly be involved. By way of illustration, the results of Hájek et al. [41,42] show that the fuzzy logic approach can be successfully used in a structured methodology in the BSC design as an innovation performance measurement system.
The next step in this stage is to calculate the SOIC and SOIP indexes. For this, the managers and collaborators that are engaged in the RD&I activities within the organisation are asked to assess the current SOIC level according to the key innovation indicators associated with the lower BSC perspectives (‘Internal Processes’ and ‘Learning and Growth’).
Using the five-point scale shown in Table 5, the SOIC index of the organisation can be calculated by multiplying the ratings assigned by the managers and experts by the relative weights of the key innovation indicators. Thus, the SOIC can be determined by multiplying the current SOIC levels (assessed by the managers and experts) with the relative weights of the key innovation indicators associated with the lower BSC perspectives (‘Internal Process’ and ‘Learning and Growth’). The resulting SOIC can be calculated by summing them up.
Similarly, the SOIP index can also be calculated, but in this case, the relative weights of the key innovation indicators will be those of the upper BSC perspectives (‘Market’ and ‘Sustainability’), and the five-point scale to be adopted is that presented in Table 6.
4. Applicability of Conceptual Model to Innovative Company in Brazilian Electricity Sector
This section presents and discusses the results of an empirical study developed for an innovative company in the Brazilian electricity sector (the Alpha Company (fictitious name)) in 2021, with the aim of demonstrating the applicability of the proposed model in a corporate environment. As a result, the current SOIC and SOIP indexes could be calculated from the assessment of the current achievement level of the SOIC and SOIP according to 23 key innovation indicators to monitor and evaluate the progress of the company’s innovation strategy toward sustainability (see Figure 3).
4.1. Empirical Study Proposition and Guiding Questions
This empirical study aims to demonstrate that the conceptual model proposed in Section 3 can be used to effectively measure and evaluate the SOIC and SOIP of established organisations that seek excellence in their sustainability-oriented innovation management systems. Following the protocol suggested by Yin [63], three guiding questions were defined:
- Is it feasible to demonstrate the applicability of the proposed model by developing an empirical study conducted for the Alpha Company with the RD&I manager and technical assistants working in the innovation area of the company?
- What are the key innovation indicators chosen to integrate the analytical network structure to be used during the assessment process?
- What are the company’s SOIC and SOIP indexes?
The results of the empirical study developed for the Alpha Company are summarised below.
4.2. Characterisation of Unit of Analysis and Its Organisational and Business Contexts
According to Yin [63], the unit of analysis needs to reflect how the research problem was defined. Thus, focusing on the central research problem, the unit of analysis in this empirical study was defined as the SOIC and SOIP measurement and evaluation based on the conceptual model presented in the previous section.
The Alpha Company is a thermal and hydroelectric generation platform that generates energy for more than 4 million people in Brazil. The company is a development platform for the Alpha Holding Group’s new thermal–hydro-generation businesses in Brazil. It operates two plants in different states in the country. With an installed capacity of 827 MW, the first plant supplies 25% of the energy consumed in the metropolitan region of one of the states, serving 2.5 million people.
The second plant began operating in 2019, it has an installed capacity of 401.88 MW and it is responsible for generating approximately 50% of the energy consumed in the other state, serving 1.5 million people. The Alpha Company has been adopting sustainable practices in the operation of both plants, demonstrating how relevant environmental practices are for the company, including emission management, the implementation of monitoring systems for improving the water quality, the implementation of a rainwater reuse project and the construction of a Centre for Environmental Experiences, where the concepts of sustainability and integration have been applied.
One reason that we chose the Alpha Company for this empirical study is that, in its strategic vision, the company states that it intends to be a competitive, profitable and socially responsible company, and to become a benchmark in thermal power generation with a strong identity, appreciated by all stakeholders, and fully integrated into the regions in which it operates. Another important aspect is the company’s sustainability policies that have been guiding its operations, including RD&I initiatives that reinforce its commitment to monitor the economic, environmental and social impacts of its activities. In this empirical study, the company’s participants believe that the conceptual model proposed here will provide a flexible and robust methodological solution to the complex problem of measuring and evaluating the SOIC and SOIP at the corporate level.
The application of the conceptual model at the Alpha Company rigorously followed all the steps described in Section 3.
4.3. Demonstrating Applicability of Conceptual Model
As described in Section 3 (Item 3.1), the four original BSC perspectives were adapted for application in the context of sustainability-oriented innovation management in general, and within the Alpha Company. During the first interview with the innovation manager, it was found that the company had already established strategic innovation goals as part of its strategic planning. However, the company had not yet adopted the BSC approach as a strategic management system. Following this, the authors proposed a virtual kickoff meeting with the innovation manager and team to explain the objectives and conceptual model, and to classify the company’s strategic innovation goals (SIGs) into a ‘strategy map’ based on the BSC framework [17]. The results of this first meeting are schematically represented in Figure 2.
After classifying the SIGs according to the four BSC perspectives, the RD&I manager and team were asked to define the key innovation indicators (KIIs) related to the seven SIGs in a second virtual session. This information was crucial to the integration of the analytical network structure based on the BSC framework. Prior to this meeting, the authors sent a list of KIIs for the measurement and evaluation of the SOIC and SOIP levels of established organisations (see Appendix C, Table A4).
Once the strategic innovation goals associated with the four BSC perspectives were established, the respective key innovation indicators were ranked and selected by employing the TOPSIS method described in Section 3 (Item 3.1). As mentioned before, the best alternatives are those with higher closeness coefficient (CCi) values, and therefore, they should be chosen because they are closer to the PIS. This procedure should be performed for each BSC perspective. All the formulas and parameters used in this procedure can be found in [54].
Table 7, Table 8, Table 9, Table 10, Table 11, Table 12 and Table 13 show the selected KIIs that integrate the Alpha Company’s system for monitoring and evaluating its SOIC and SOIP levels.
Table 7.
Euclidian distances, closeness coefficients and ranking of innovation indicators associated with strategic innovation goal ‘Innovation-based economic sustainability’ (SIG11).
Table 8.
Euclidian distances, closeness coefficients and ranking of innovation indicators associated with strategic innovation goal ‘Innovation-based environmental sustainability’ (SIG12).
Table 9.
Euclidian distances, closeness coefficients and ranking of innovation indicators associated with strategic innovation goal ‘Innovation-based social sustainability’ (SIG13).
Table 10.
Euclidian distances, closeness coefficients and ranking of innovation indicators associated with strategic innovation goal ‘Higher competitiveness and new markets’ (SIG21).
Table 11.
Euclidian distances, closeness coefficients and ranking of innovation indicators associated with strategic innovation goal ‘Innovation management system improvement’ (SIG31).
Table 12.
Euclidian distances, closeness coefficients and ranking of innovation indicators associated with strategic innovation goal ‘Human and structural capital enhancement’ (SIG41).
Table 13.
Euclidian distances, closeness coefficients and ranking of innovation indicators associated with strategic innovation goal ‘Relational capital enhancement’ (SIG42).
4.3.1. Stage 1: Determination of an Analytic Network Structure based on BSC Framework
Once key innovation indicators are ranked and selected (Table 7, Table 8, Table 9, Table 10, Table 11, Table 12 and Table 13), an analytic network structure for measuring and evaluating the SOIC and SOIP levels of Alpha Company can be represented, as shown in Figure 3.

Figure 3.
Analytic network structure for measuring and evaluating SOIC and SOIP levels of Alpha Company.
Figure 3.
Analytic network structure for measuring and evaluating SOIC and SOIP levels of Alpha Company.

In Figure 3, the control layer consists of seven strategic innovation goals (from SIG11 to SIG13, SIG21, SIG31, SIG41 and SIG42). In turn, the assessment layer comprises 23 key innovation indicators (KIIs) that are organised into seven clusters that correspond to the mentioned strategic innovation goals. The clusters in green are associated with the SOIC, while the clusters in blue correspond to the KIIs used for measuring and evaluating the SOIP level of the Alpha Company.
Table 14 details the control- and assessment-layer elements that integrate the analytical network structure that corresponds to the visual representation presented in Figure 3.
Table 14.
Analytical network structure for measuring and evaluating SOIC and SOIP levels of Alpha Company.
Following the procedure described in Section 3.1, an interfactorial dominance matrix was built in a consensus-building session (see Table 15).
Table 15.
Interfactorial dominance matrix: empirical study conducted on Alpha Company.
Likewise, a control hierarchy matrix concerning the interactions among the strategic innovation goals (the clusters in the network structure) was formed by the seven SIGs listed in Table 14 (i.e., a 7 × 7 matrix). If at least one element in a cluster influences one element in another cluster, then they become related to each other, and the hierarchical matrix cell is filled in with ‘1’. If there is no influence of any element of a cluster on any element of another, then this cell is ‘0’.
As shown in Table 16, all the clusters influenced the others, which confirmed that the strategic innovation goals formed a network, and that the interdependencies between them could be objectively evidenced.
Table 16.
Control hierarchy matrix: empirical study conducted on Alpha Company.
4.3.2. Stage 2: Design and Pretesting of Questionnaire for Pairwise Comparisons of Elements of Analytical Network Structure
The questionnaire design for the pairwise comparisons was based on the results of the interfactorial dominance matrix and control hierarchy matrix. The questionnaire was pretested with a group of six academic researchers who specialised in innovation management, to be further applied for the Alpha Company during Stage 3 (see Section 4, Item 4.3).
4.3.3. Stage 3: Determination of Importance Weights of Assessment Elements
For determining the importance weights of the 23 assessment elements and seven clusters, Saaty’s nine-point scale (Table 4) was used for the pairwise comparisons conducted by the innovation manager and two technical assistants of the Alpha Company. In this stage, an unweighted supermatrix is built, as shown in Table 17.
Table 17.
Unweighted supermatrix: empirical study conducted on Alpha Company.
For building the unweighted supermatrix, they used the questionnaire pretested in Stage 2, and they followed the general instructions provided by the authors. In this stage, Super Decisions® 2.8 was used for calculating the unweighted and weighted supermatrixes [58]. After consolidating the judgments and preferences and testing the consistency ratios (C.R.), it was possible to generate the corresponding pairwise comparison matrices to obtain the corresponding eigenvectors. Following Item 3.3, the value corresponding to the priority associated with a specific cluster determines the importance of the cluster’s elements on which it acts (in the unweighted supermatrix). Thus, the weighted supermatrix was calculated with the support of Super Decisions® software, combining the unweighted supermatrix and the results of the pairwise comparisons between the seven clusters.
The latter scored a cluster weight compared with all the others to which it was connected. A 7 × 7 matrix was built that corresponded to the network clusters (i.e., the seven strategic innovation goals). Table 18 shows the resulting weights of the network clusters. A sensitivity analysis procedure was also conducted considering all the importance weights of the SIGs equally, and the results are shown in the right column of Table 18.
Table 18.
Importance weights of network clusters: empirical study conducted on Alpha Company.
In sequence, a weighted supermatrix could be obtained, as shown in Table 19.
Table 19.
Weighted supermatrix: empirical study conducted on Alpha Company.
4.3.4. Stage 4: Calculation of Limit Supermatrix and Resulting Weights of Network Element Framework
Table 20 shows the limit supermatrix calculated with the support of Super Decisions® software.
Table 20.
Limit supermatrix: empirical study conducted on Alpha Company.
As mentioned in Item 3.4, with the support of Super Decisions® software [59], the authors used a computations-limit matrix to calculate the limit supermatrix, which is derived from performing the power operation on the weighted supermatrix. Its weighted value tends towards stability.
Finally, the resulting weights of the 23 key innovation indicators (assessment elements) could be calculated, as shown in Table 21. As mentioned before, a sensitivity analysis procedure was conducted to test the robustness of the model when all the SIG importance weights are equal. The narrow difference between the indicator weights with or without the sensitivity test can be seen.
Table 21.
Importance weights of assessment elements: empirical study conducted on Alpha Company.
The results presented here demonstrate that, from the perception of the participants, strategic innovation goal SIG31 concerning the “Internal Process” (B3), and goals SIG41 and SIG42 associated with the “Learning and Growth” (B4) perspective, have the most significant influences in the whole innovation management system of the company. The weights of the SOIC key indicators correspond to 69.50%, while the SOIC key innovation indicators correspond to 30.50%.
Both perspectives (B3 and B4) help the Alpha Company understand the efficiency and effectiveness of its internal processes that support RD&I activities and projects. Particularly, the weight assigned to the key innovation indicators of the “Learning and Growth” perspective expresses the belief that humans are the most important asset of the company’s innovation capacity to improve the business performance. This perspective considers the degree to which the Alpha Company can evolve and improve the way it pursues its strategic innovation goal (SIG) achievement.
As can be observed in Table 21, the key indicators I422 (number of new cocreated skills and knowledge through RD&I cooperation per year) and I425 (number of newly created innovative opportunities with customers, suppliers or partners) achieved the highest positions in the ranking.
These results can be explained by the fact that the Alpha Company has adopted the open innovation model, the central pillar of which is a knowledge network with customers, suppliers, universities and other institutional actors. Therefore, this company considers RD&I cooperation to be an essential dynamic capacity for enhancing its innovation management system to achieve its sustainability vision, as discussed in Item 4.2. Another argument is that the Brazilian Electrical Energy Regulatory Agency (the Portuguese acronym is ANEEL) created an institutional Research and Development Program to encourage cooperative research among firms, universities and research centres for innovation to face the technological challenges of the electric sector in Brazil. Accordingly, concessionary, permissionary or authorised electric energy distribution, transmission and generation companies must annually apply a minimum percentage of their net operating revenues to this R&D Program. Thus, the Alpha Company’s RD&I portfolio management is preponderantly based on cooperative research that involves local universities, research centres and other institutional actors.
4.3.5. Stage 5: Determination of Five-Point Scales for Measuring SOIC and SOIP
4.3.6. Stage 6: Application of Self-Assessment Instrument and Calculation of SOIC and SOIP Indexes
Based on the analytical network structure detailed in Table 14, the self-assessment instrument was designed to measure the company’s status concerning each assessment element. A pretest with a group of six academic researchers who specialised in innovation management was conducted in the second semester of 2020, before being administered to the innovation manager and two technical assistants at the Alpha Company. For making the judgments in the consensus-building meeting, they used the five-point scales proposed in Stage 5 of the model (see Table 5 and Table 6).
First, the participants were asked to evaluate the current SOIC levels regarding the key innovation indicators associated with the strategic innovation goals of the lower BSC perspectives (‘Internal Process’ (B3) and ‘Learning and Growth’ (B4)). Accordingly, they used the five-point scale shown in Table 5.
Hence, the SOIC level of the Alpha Company could be calculated by multiplying the current innovation capacity levels (from 1 to 5) with the relative weights of the 11 key innovation indicators associated with the lower BSC perspectives (B3 and B4). Then, the resulting SOIC level could be calculated by summing them up.
Table 22 shows how the SOIC of the Alpha Company was calculated, considering the weights assigned to each assessment factor.
Table 22.
Calculation of SOIC level of Alpha Company.
The results shown in Table 22 were framed on a standard scale with the aim of obtaining the relative position of the company regarding its SOIC measured by the key innovation indicators associated with the following strategic goals: ‘Innovation management system improvement’ (SIG31), ‘Human and structural capital enhancement’ (SIG41) and ‘Relational capital enhancement’ (SIG42).
From the indicator weights, it was possible to normalise the scales for the classification of the SOIC levels, as follows:
Five ranges between the Min (SOIC) and Max (SOIC) values were established to normalise the results shown in Table 20 according to the SOIC levels defined on the five-point scale. Accordingly, Table 23 refers to the normalised SOIC ranges associated with the respective SOIC levels.
Table 23.
Ranges of SOIC levels associated with five-point scale (cf. Table 5).
Following Equation (3), the SOIC index of the Alpha Company could be calculated. The index indicated that the company is situated at the medium innovation capacity level.
Figure 4 represents the current SOIC index of the Alpha Company in dashboard format.
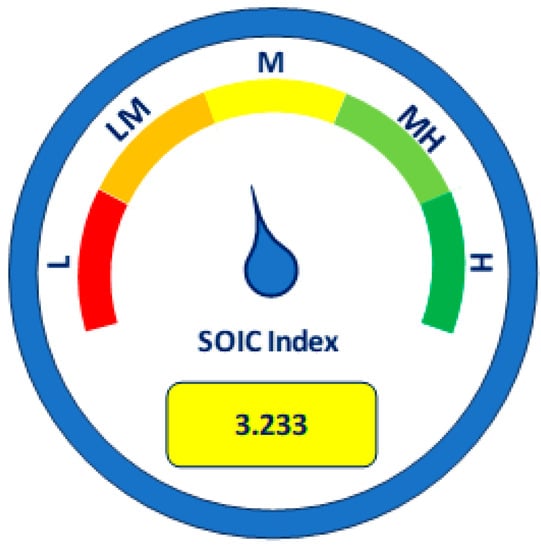
Figure 4.
Current SOIC index of Alpha Company in dashboard format.
Similarly, the SOIP of the Alpha Company could be calculated, but in this case, the relative weights of the 12 key innovation indicators were associated with the upper BSC perspectives (‘Sustainability’ (B1) and ‘Market’ (B2)).
Table 24 shows how the SOIP of the Alpha Company was measured, considering the weights assigned to each assessment factor (second column from left).
Table 24.
Calculation of SOI performance of Alpha Company.
The results were framed on a standard scale to obtain the relative position of the company regarding its SOIP measured by the key innovation indicators associated with the following strategic goals: ‘Innovation-based economic sustainability’ (SIG11), ‘Innovation-based environmental sustainability’ (SIG12), ‘Innovation-based social sustainability’ (SIG13) and ‘Higher competitiveness and new markets’ (SIG21). From the indicator weights (second column from left), it was possible to normalise the scales for the classification of the SOIP levels, following Equations (4)–(6):
Between the Min (SOIP) and Max (SOIP) values, five ranges were established to fit the results according to the innovation performance levels defined on the five-point scale (Table 25).
Table 25.
Ranges of SOIP levels associated with five-point scale (cf. Table 6).
Following Equation (6), the SOIP index of the Alpha Company could be calculated. The index indicated that the company is situated in the medium innovation performance range.
Figure 5 represents the current SOIP index of the Alpha Company in dashboard format.
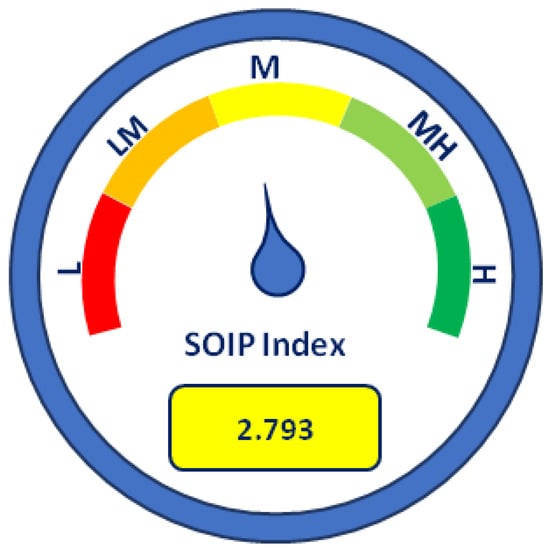
Figure 5.
Current SOIP index of Alpha Company in dashboard format.
The SOIC and SOIP indexes graphically represented in the two dashboards (Figure 4 and Figure 5, respectively) were calculated in line with the weights assigned to each assessment element in individual cases. Both indexes can help the managers in the Alpha Company to propose and implement strategic RD&I initiatives that are addressed to boost the company’s SOIC level, and consequently, its SOIP level.
5. Discussion
As stated in the introductory section, in the last decades, researchers and consulting firms have designed several multidimensional models for measuring and evaluating the innovation capacity and performance, which have been adopted by established innovative organisations worldwide. Most of these models combine financial and nonfinancial indicators to measure the organisation’s tangible and intangible assets and value creation. As mentioned in the introductory section, some outstanding examples are the BSC [16,17,18] and performance prism frameworks [19,20]. However, research on the measurement and evaluation models designed for sustainability-oriented innovation management has remained underexplored by researchers and practitioners. Moreover, the ‘strategy map’ representation presented by Kaplan and Norton [18] considers the innovation process as a linear and separately identifiable construct.
Particularly concerning the mentioned issues, in the adapted BSC framework proposed in this paper, the SOIC and SOIP are seen more holistically as parts of an organisation’s ‘strategy map’, which is schematically represented in Figure 2. The original ‘Financial’ perspective was replaced by the ‘Sustainability’ perspective, and the ‘Market’, ‘Internal Processes’ and ‘Learning and Growth’ perspectives were maintained. The following principles guided the model development: a multidimensional structure, stakeholder goal orientation, interdependence and feedback loop analyses, innovation process orientation and easy implementation and use.
Concerning the first guiding principle, a multidimensional orientation effectively accommodated a well-balanced combination of the financial and nonfinancial measures in the modelling phase of this research. In this regard, several researchers agree that the multidimensional structure of the BSC framework provides a good foundation for designing a conceptual model for measuring and evaluating the innovation capacity and performance [31,32,33,34,35,36,37,38,39,40,41,42]. Thus, the proposed model is in line with previous studies in which researchers adopted a methodological approach based on the original BSC framework but adapted it for addressing the sustainability-oriented innovation management issues not covered by them.
The second guiding principle—‘Innovation process orientation’—was a strong focus in the modelling phase because we consider it essential for innovative organisations to understand the role of process-oriented thinking and working in the innovation-driven economy. It may be worth mentioning here that the focus of the original ‘Internal Processes’ perspective in the BSC framework [16,17,18] is limited to those processes that affect either the customer value proposition or efficiency improvement, both of which lead to financial benefits. Thus, most of the previous works based entirely on the BSC framework do not adequately fulfil this second guiding principle, despite there being instances of performance measurement for R&D and new product development discussed in [21,22,23,24,25,26,27,28,29,30], which advocate an R&D process or lifecycle-based innovation performance measurement.
An innovation capacity and performance measurement model should effectively address the achievement of the organisation’s strategic vision, which is aligned to multiple stakeholder interests, such as those of shareholders, employees, customers, suppliers, regulators and society. This was the third guiding principle for the modelling phase. Kaplan and Norton [16,17,18] posit that the BSC framework can effectively address stakeholder needs to deal with stakeholder alignment and business strategy formulation and implementation. Here, the conceptual model was designed to offer an increased opportunity to address diverse stakeholder groups, and particularly regarding the SIGs and KIIs associated with the ‘Learning and Growth’ perspective. For example, three of the key innovation indicators selected in the empirical phase of this work, which express the stakeholder engagement in different stages of the innovation process, can be used to systematically monitor the implementation of RD&I initiatives to achieve the respective targets. They are I422 (number of new cocreated skills and knowledge through RD&I cooperation per year), I425 (number of newly created innovative opportunities with customers, suppliers or partners) and I427 (number of projects funded by external organisations per year).
Regarding the fourth guiding principle, the proposed model considers the interdependencies among the BSC perspectives, strategic innovation goals (SIGs) and KIIs by using the ANP method so that they are logically related to one another, and so that importance weights can be assigned to all the assessment elements of the conceptual model. In fact, this methodological orientation enables organisations to determine the value of the various RD&I activities performed by relating them to definite outcomes. The interdependencies can be effectively represented in a unique ‘strategy map’ of the organisation, which shows the linkages between the assessment elements (KIIs) and SIGs within each BSC perspective.
The last guiding principle refers to ease of use and implementation. In this regard, the conceptual model provides a notable advantage because organisations that already use BSC frameworks will find it easier to select and correlate the key innovation indicators (KIIs) with their key performance indicators (KPIs). Following [34], it was assumed that at the organisational level, a BSC framework can be defined based on the organisation’s vision and business strategy so that the relevant strategic innovation goals (SIGs) can be cascaded down. Furthermore, in the modelling phase, the SIGs should be linked to other strategic objectives across the BSC perspectives, and namely the ‘Sustainability’, ‘Market’, ‘Internal Processes’ and ‘Learning and Growth’ perspectives, as described in Section 3.
As mentioned in the introductory section, considerable research has been dedicated to developing and applying models for measuring and evaluating the innovation capacity and performance based on adaptations of the original BSC framework [21,22,23,24,25,26,27,28,29,30,31,32,33,34,35,36,37,38,39,40,41,42]. However, notwithstanding these efforts, two research gaps could be identified. The first gap refers to using a multicriteria approach in the BSC models for analysing the interdependencies and feedback loops among the SIGS and KIIs. No previous model for measuring and evaluating the innovation capacity and performance levels of established organisations has addressed sustainability-oriented innovation management while adhering to the abovementioned guiding principles [34]. Thus, a critical issue addressed in this work is how to apply and combine multicriteria decision-making (MCDM) methods to provide consistent strategic frameworks for evidence-based innovation management decisions from a systemic and sustainability-oriented perspective.
6. Conclusions
In this paper, an attempt was made to present a conceptual model for measuring and evaluating the sustainability-oriented innovation capacity (SOIC) and performance (SOIP) of established organisations, the development of which was guided by the following principles: a multidimensional structure, stakeholder goal orientation, interdependence and feedback loop analyses, innovation process orientation and ease of use and implementation. From the findings summarised in Section 3 and Section 4 and discussed in Section 5, it is possible to conclude that the general objective of this research was achieved.
Previous studies on innovation capacity and performance measurement published between 1992 and 2022 were reviewed, with a focus mainly on the methodological issues. One initial conclusion is that, among the reviewed studies, 22 adopted the BSC approach [21,22,23,24,25,26,27,28,29,30,31,32,33,34,35,36,37,38,39,40,41,42]. Thus, this finding guided the choice of the BSC framework as the basis for the conceptual model focus of this research.
An in-depth analysis of the 22 studies revealed a research gap regarding the use of a multicriteria decision-making approach that implements an analytical network structure and allows for interdependence and feedback loop analyses among the strategic innovation goals (SIGs) and key innovation indicators (KIIs) for evaluating the SOIC and SOIP levels of established organisations. Thus, the ANP method was chosen to integrate an adapted BSC framework for sustainability-oriented innovation management systems, and to effectively assign importance weights to the KIIs associated with the SIGs, highlighting and quantifying the interdependencies among them.
Based on the results presented in Section 4, one can conclude that the ANP method integrated with the BSC framework could help organisations to handle the effects of the dependencies across the BSC perspectives and over time, as illustrated by the case of the Alpha Company. With a clearer and more systemic understanding of the dependency issue, decision makers can design and implement effective innovation management systems that consider the organisation’s vision of business sustainability.
A third conclusion refers to the total alignment of the conceptual model with five guiding principles [34]: (i) multidimensional orientation; (ii) innovation process orientation; (iii) interdependence and feedback loop analyses; (iv) stakeholder goal orientation; (v) ease of use and implementation.
The applicability of the proposed model to an innovative company in the Brazilian electricity sector was demonstrated through an empirical study conducted in 2021, the findings of which are presented and discussed in Section 4.
The flexibility of the conceptual model was confirmed during the empirical study conducted on the Alpha Company as a helpful measurement and evaluation tool that can be adapted to different organisational contexts. Similar to many other empirical studies, it is situationally unique. Nevertheless, the general elements of the conceptual model and methods employed (i.e., the BSC framework combined with the ANP and the hybrid AHP/TOPSIS methods) can be replicated by organisations in other business contexts. Particularly for companies that operate in the Brazilian electricity sector, the model can be used as a benchmarking tool because a core set of key innovation indicators are used as the sectoral SOIC and SOIP indicators and metrics.
Because the study’s nature is essentially methodological, we plan to develop a multiple-case study that focuses on organisations from various sectors to demonstrate the proposed BSC framework’s applicability and validity in other business contexts. In addition, we intend to use a fuzzy logic approach instead of consensus-building meetings in the second and third phases of the framework during the subsequent study.
Future research could include more in-depth analyses of the SOIC and SOIP indicators and indexes that address the lack of benchmarking models for comparing organisations within the same business context. Assuming that each organisation’s sustainability strategy is unique, benchmarking information is helpful for comparing the SOIC and SOIP in a given context. Data envelopment analysis (DEA) and stochastic frontier analysis (SFA) could be used in benchmarking modelling to address this suggestion.
Another suggestion is the use of the ‘Decision-Making Trial Evaluation Laboratory’ (DEMATEL) combined with the ANP method. The DEMATEL uses the concept of graph theory to build visualized structural approaches based on cause–effect diagrams that show the interdependencies and feedback loops between the factors in complex systems.
Finally, the use of common innovation indicators for the SOIC and SOIP of organisations in the same business context is essential to the acceleration of the transition to the achievement of the SGDs as stated in the UN 2030 Agenda because it could help sustainability-oriented organisations to better define balanced assessment frameworks to improve the current practices for measuring and evaluating their SOIC and SOIP, allowing them to adjust their strategies to create sustainable value for the new era of business.
Author Contributions
W.L.L.R. and M.F.L.A. conceived and designed the research; W.L.L.R. performed the literature review and wrote Section 1; M.F.L.A. wrote Section 2; W.L.L.R., M.F.L.A. and R.F.C. jointly wrote Section 3, Section 4, Section 5 and Section 6. All authors commented on all the sections and reviewed the final manuscript. All authors have read and agreed to the published version of the manuscript.
Funding
This research was funded by two Brazilian funding agencies: Coordination for the Improvement of Higher Education Personnel (the Portuguese acronym is CAPES), and the National Council for Scientific and Technological Development (the Portuguese acronym is CNPq).
Institutional Review Board Statement
Not applicable.
Informed Consent Statement
Not applicable.
Data Availability Statement
Not applicable.
Acknowledgments
The authors wish to thank the managers of the Alpha Company that participated in the empirical study development. The authors are thankful for the financial support of two Brazilian funding agencies (CNPq and CAPES). Special thanks go to the anonymous reviewers for their careful reading of the manuscript.
Conflicts of Interest
The authors declare no conflict of interest.
Appendix A. Search Histories in Web of Science and Scopus Databases
Table A1.
Search strategy for Web of Science database.
Table A1.
Search strategy for Web of Science database.
| Number | Keyword Search | Documents |
|---|---|---|
| #1 | TS = (“sustainability-oriented innovation” OR “sustainable innovation”) | 1111 |
| #2 | TS = (“innovation management” OR “innovation measurement” OR “innovation indicator*” OR “innovation metric*”) | 4142 |
| #3 | TS = (“R&D management” OR “R&D measurement” OR “R&D indicator*” OR “R&D metric*”) | 663 |
| #4 | TS = (“balanced scorecard” OR BSC) | 9004 |
| #5 | TS = (“multicriteria decision-making method*” OR “multiple criteria decision-making method*” OR MCDM OR MCDA) | 13,086 |
| #6 | #2 AND #4 | 26 |
| #7 | #3 AND #4 | 13 |
| #8 | #6 OR #7 | 36 |
| #9 | #8 AND #1 | 0 |
| #10 | #8 AND #5 | 2 |
| #11 | #9 AND #10 | 0 |
Note: Search strategy and assessment on 15 November 2022.
Table A2.
Search strategy for Scopus database.
Table A2.
Search strategy for Scopus database.
| Number | Keyword Search | Documents |
|---|---|---|
| #1 | TITLE-ABS-KEY (“sustainability-oriented innovation” OR “sustainable innovation”) | 1761 |
| #2 | TITLE-ABS-KEY (“innovation management” OR “innovation measurement” OR “innovation indicator*” OR “innovation metric*”) | 6235 |
| #3 | TITLE-ABS-KEY (“R&D management” OR “R&D measurement” OR “R&D indicator*” OR “R&D metric*”) | 1074 |
| #4 | TITLE-ABS-KEY (“balanced scorecard” OR BSC) | 11,689 |
| #5 | TITLE-ABS-KEY (“multicriteria decision-making method*” OR “multiple criteria decision-making method*” OR MCDM OR MCDA) | 16,187 |
| #6 | #2 AND #4 | 25 |
| #7 | #3 AND #4 | 6 |
| #8 | #6 OR #7 | 30 |
| #9 | #8 AND #1 | 0 |
| #10 | #8 AND #5 | 0 |
| #11 | #9 AND #10 | 0 |
Note: Search strategy and assessment on 15 November 2022.
Appendix B. Innovation Capacity and Performance Measurement Models Based on BSC Framework
Table A3.
Summary of conceptual and empirical studies on innovation capacity and performance measurement based on BSC framework.
Table A3.
Summary of conceptual and empirical studies on innovation capacity and performance measurement based on BSC framework.
| Authors [Ref.] | Focus | Objective | Methodology |
|---|---|---|---|
| Kerssens-van Drongelen and Cook [21] | R&D outcome and process | To assess the impact of the R&D performance measurement in relation to the overall business performance within the context of global performance evaluation and the theory of independence. |
|
| Godener and Soderquist [22] | To demonstrate the main areas of use and impact of the results of measuring the R&D performance and new product development. |
| |
| Bremser and Barsky [23] | To propose a system for measuring the R&D performance, integrating the Stage-Gate approach to R&D management with a balanced scorecard. |
| |
| Ojanen and Vuola [24] | To propose a new practical tool to visualise and categorise the dimensional aspects in the analysis of the R&D performance and selection of indicators and metrics for R&D management. |
| |
| Chiesa et al. [25] | To propose a system for measuring the performance of R&D units, according to the scorecard approach and based on a literature review and case studies. |
| |
| Lazzarotti et al. [26] | To propose a conceptual model for measuring the performance of R&D activities based on a systemic and balanced structure of the quantitative indicators from five different performance perspectives. |
| |
| Jyot and Deshmukh [27] | To present a conceptual model for evaluating the performance of R&D organisations from four BSC perspectives: ‘Financial’, ‘Customers’, ‘Internal Business Processes’ and ‘Innovation and Learning’. |
| |
| Verhaeghe and Kfir [28] | Innovation capacity and performance | To propose an innovation management measurement model based on a scorecard approach and considering ten assessment dimensions. |
|
| Gama et al. [29] | To propose an innovation scorecard system based on innovation indicators and metrics, combined with the traditional BSC. |
| |
| Vinkemeier [30] | To combine well-known management instruments (i.e., BSC [16,17,18] and technology roadmaps to propose an innovation-adapted BSC that can elicit and measure the innovation performance aligned to the relevant information from technology roadmapping. |
| |
| Khomba et al. [31] | To redesign the innovation perspective of the BSC to a better adaptation to African organisations. The authors propose an innovation perspective that consists of four components: (i) Africanisation values; (ii) learning values; (iii) customer values; (iv) innovation values. |
| |
| Wu [32] | Innovation capacity and performance | To investigate the relationship between the use of the BSC and intellectual capital accumulation in Taiwanese companies. |
|
| Mohamed [33] | To determine the relationship between the characteristics of the BSC methodology and innovation measurement, considering diversity in the use of the performance measures, the balanced use of the performance measures and the strategic link between the performance metrics. |
| |
| Dewangan and Godse [34] | To propose a set of guiding principles for modelling an innovation performance evaluation system, and to develop the model based on the scorecard approach. |
| |
| Ivanov and Avasilcăi [35] | To propose an analytical framework created by exploiting the key indicators of the organisation used to measure the performance of the innovation processes. |
| |
| Zizlavsky [36] | To propose a management control system approach to the assessment of the innovation performance at the corporate level by integrating the input-process–output-outcomes and Stage-Gate model applied to innovation management with the balanced scorecard framework. |
| |
| Spanò et al. [37] | To propose an innovation management measurement model based on the BSC approach to improve the measurement and performance evaluations of biotechnology companies that belong to a knowledge-intensive and R&D network. |
| |
| Zhang [38] | To investigate the connection between using the BSC as a strategic management tool and the innovation performance. The author suggests the mediating effect of firm competencies in linking the use of the BSC and innovation management, as well as its performance consequences. |
| |
| Saunila and Ukko [39] | To develop a general procedure to clarify how the different performance aspects are linked to the measurement of the effects of the innovation capabilities of organisations. The measurement framework was developed by examining and matching the existing literature on innovation capability and performance measurements. |
| |
| Hájek et al. [40] | To propose a model for strategic innovation performance measurement, integrating a BSC framework and fuzzy-set qualitative comparative analysis. |
| |
| Hájek et al. [41] | Continuing the research in [40], the authors developed a model for strategic innovation performance measurement, integrating a BSC framework and fuzzy-set qualitative comparative analysis. |
| |
| Dudic et al. [42] | To propose a model for assessing theinnovative activities of small- and medium-sized firms in the Republic of Slovakia and Republic of Serbia. To investigate the model’s applicability in 223 SMEs in these countries. |
|
Appendix C. Innovation Indicators Associated with Adapted BSC Framework
Table A4.
Innovation indicators associated with adapted BSC framework.
Table A4.
Innovation indicators associated with adapted BSC framework.
| SIG11: Innovation-Based Economic Sustainability | ||
| KII | Innovation Indicator | Sources [Ref.] |
| I111 | Number of commercialized patents and products | [14,15,27,37,49] |
| I112 | ROI of realized patents and products | [15,37] |
| I113 | Royalties of commercialized patents and products per year | [15,37] |
| I114 | Net cash generated by commercialized patents and products per year | [15,26,37] |
| I115 | Budget spent on research, development and innovation (RD&I) | [15,26,27,49] |
| I116 | Share of RD&I budget from total company budget | [15,26,27,49] |
| SIG12: Innovation-Based Environmental Sustainability | ||
| KII | Innovation Indicator | Sources [Ref.] |
| I121 | Number of projects with environmental relevance to organisation’s region per year | [37] |
| I122 | Number of innovative solutions for circular economy per year | [37] |
| I123 | Improvement rate in use of alternative energy/material due to ecoinnovations | [37] |
| I124 | Number of innovative solutions to mitigate environmental risk per year | [15,37] |
| I125 | Reduction rate of adverse event impact due to ecoinnovations | [37] |
| SIG13: Innovation-Based Social Sustainability | ||
| KII | Innovation Indicator | Sources [Ref.] |
| I131 | Number of key external stakeholders integrated into R&D projects to improve sustainability concerns in value chains per year | [15,37] |
| I132 | Number of innovations with social impacts per year | [14,37,49] |
| I133 | Involvement of local SMEs in innovations with impacts on supply chain | [37] |
| I134 | Improvement in occupational rate of organisation’s region | [37] |
| I135 | Innovative startup birth rate | [37] |
| I136 | Number of knowledge transfer sessions (KTSs) | [37] |
| I137 | Number of employees dedicated to external relationships in RD&I projects | [14,15,26,49] |
| I138 | Number of local alliances dedicated to RD&I projects | [13,14,26,49] |
| SIG 21: Higher Competitiveness and New Markets Due to Innovation | ||
| KII | Innovation Indicator | Sources [Ref.] |
| I211 | Number of new or significantly improved products (goods or services) introduced into market per year | [14,49] |
| I212 | Number of innovative businesses/new venture startups | [15] |
| I213 | Number of firms adopting commercialized patents and products | [37] |
| I214 | Market share of firms adopting commercialized patents and products | [37] |
| I215 | Number of innovative businesses/new venture startups | [15] |
| I216 | New product introduction into market versus competition | [15] |
| I217 | Annual spending for market investigations aimed at generating technological innovation | [26,49] |
| SIG 31: Innovation Management System Improvement | ||
| KII | Innovation Indicator | Sources [Ref.] |
| I311 | Number of projects that developed new models, methods and/or standards to improve RD&I practices | [14,15,37,49] |
| I312 | Number of new business models or frameworks developed and implemented through collaborative projects | [37] |
| I313 | Percentage of RD&I projects abandoned after a certain degree of completion | [14,15,26,49] |
| I314 | Percentage of successful RD&I projects aligned to innovation strategy toward sustainability | [14,15,26,49] |
| I315 | Time dedicated to analysis of reasons for failure of previous projects | [26] |
| I316 | Percentage of RD&I activities formally documented | [26] |
| I317 | Percentage of RD&I projects respecting established deadlines | [15,26] |
| SIG 41: Human and Structural Capital Enhancement | ||
| KII | Innovation Indicator | Sources [Ref.] |
| I411 | Number of joint training programs for researchers and employees | [37] |
| I412 | Improvement in employee and researcher satisfaction | [37] |
| I413 | Number of meetings among partners | [37] |
| I414 | Number of publications in scientific journals or conferences per year | [15,26,27,37] |
| I415 | Number of new intangibles per year (patents, licenses, copyrights, etc.) per year | [15,26,27,37] |
| I416 | Number of information systems implemented for sharing RD&I data | [37,49] |
| I417 | Number of employees devoted to RD&I activities/total of employees per year | [14,15,26,49] |
| I418 | Percentage of time spent by managers on RD&I activities compared with other business tasks | [15] |
| SIG 42: Relational Capital Enhancement | ||
| KII | Innovation Indicator | Sources [Ref.] |
| I421 | Social engagement in organisation’s region | [37] |
| I422 | Number of new cocreated skills and knowledge through RD&I cooperation per year | [37] |
| I423 | Use of internal and external knowledge and information sources | [14,15,26,49] |
| I424 | Transfer rate of new knowledge and technology into product development (goods or services) | [26,27,49] |
| I425 | Number of newly created innovative opportunities with customers, suppliers or partners | [15] |
| I426 | Number of ideas generated with customers, suppliers or partners | [15] |
| I427 | Number of projects funded by external organisations per year | [15,26,27] |
References
- Sachs, J. The Age of Sustainable Development; Columbia University Press: New York, NY, USA, 2015; ISBN 9780231173155. [Google Scholar]
- United Nations. Transforming our World: The 2030 Agenda for Sustainable Development; UN General Assembly: New York, NY, USA, 2015; Available online: https://sdgs.un.org/2030agenda (accessed on 15 November 2022).
- United Nations Task Team on Science, Technology and Innovation for the SDGs, Science, Technology and Innovation for SDGs Roadmaps. IATT Background Paper; United Nations: Washington, DC, USA, 2018. [Google Scholar]
- Walsh, P.P.; Murphy, E.; Horan, D. The role of science, technology and innovation in the UN 2030 agenda. Technol. Forecast. Soc. Change 2020, 154, 119957. [Google Scholar] [CrossRef]
- Almeida, M.F.L.; Moraes, C.A.C.; Melo, M.A.C. Technology foresight on emerging technologies: Implications for a national innovation initiative in Brazil. J. Technol. Manag. Innov. 2015, 10, 183–197. [Google Scholar] [CrossRef]
- Adams, R.; Jeanrenaud, S.; Bessant, J.; Denyer, D.; Overy, P. Sustainability-oriented innovation: A systematic review. Int. J. Manag. Rev. 2016, 18, 180–205. [Google Scholar] [CrossRef]
- Cillo, V.; Petruzzelli, A.M.; Ardito, L.; Del Giudice, M. Understanding sustainable innovation: A systematic literature review. Corp. Soc. Responsib. Environ. Manag. 2019, 26, 1012–1025. [Google Scholar] [CrossRef]
- Ardito, L.; Carrillo-Hermosilla, J.; del Río, P.; Pontrandolfo, P. Sustainable innovation: Processes, strategies, and outcomes. Corp. Soc. Responsib. Environ. Manag. 2019, 26, 1009–1011. [Google Scholar] [CrossRef]
- Zhang, Y.; Khan, U.; Lee, S.; Salik, M. The influence of management innovation and technological innovation on organization performance. A mediating role of sustainability. Sustainability 2019, 11, 495. [Google Scholar] [CrossRef]
- Stamm, A.; Dantas, E.; Fischer, D.; Ganguly, S.; Rennkamp, B. Sustainability-Oriented Innovation Systems: Towards Decoupling Economic Growth from Environmental Pressures? DIE Research Project Sustainable Solutions through Research. Deutsches Institut für Entwicklungspolitik: Bonn, Germany, 2009. Available online: https://www.researchgate.net/publication/255666933 (accessed on 15 November 2022).
- Teece, D.J. Explicating dynamic capabilities: The nature and microfoundations of (sustainable) enterprise performance. Strateg. Manag. J. 2007, 28, 1319–1350. [Google Scholar] [CrossRef]
- Lawson, B.; Samson, D. Developing innovation capability in organisations: A dynamic capabilities approach. Int. J. Innov. Manag. 2001, 5, 377–400. [Google Scholar] [CrossRef]
- Almeida, M.F.L.; Melo, M.A.C. Sociotechnical regimes, technological innovation and corporate sustainability: From principles to action. Technol. Anal. Strateg. Manag. 2016, 29, 395–413. [Google Scholar] [CrossRef]
- OECD/Eurostat. Oslo Manual 2018: Guidelines for Collecting, Reporting and Using Data on Innovation, 4th ed.; The Measurement of Scientific, Technological and Innovation Activities; OECD Publishing: Paris, France; Eurostat: Luxembourg, 2018. [Google Scholar]
- Dziallasa, M.; Blind, K. Innovation indicators throughout the innovation process: An extensive literature analysis. Technovation 2019, 80–81, 3–29. [Google Scholar] [CrossRef]
- Kaplan, R.S.; Norton, D.P. The balanced scorecard--measures that drive performance. Harv. Bus. Rev. 1992, 70, 71–79. [Google Scholar]
- Kaplan, R.S.; Norton, D.P. The Balanced Scorecard: Translating Strategy into Action; Harvard Business School Press: Boston, MA, USA, 1996. [Google Scholar]
- Kaplan, R.S.; Norton, D.P. Strategy Maps: Converting Intangible Assets into Tangible Outcomes; Harvard Business School Press: Boston, MA, USA, 2004. [Google Scholar]
- Neely, A.; Filippini, R.; Forza, C.; Vinelli, A.; Hii, J. A framework for analysing business performance, firm innovation and related contextual factors: Perceptions of managers and policy makers in two European regions. Integr. Manuf. Syst. 2001, 12, 114–124. [Google Scholar] [CrossRef]
- Neely, A.; Adams, C.; Kennerley, M. The Performance Prism: The Scorecard for Measuring and Managing Business Success; Financial Times Prentice Hall: Upper Saddle River, NJ, USA, 2002. [Google Scholar]
- Kerssens-Van Drongelen, I.C.; Cook, A. Design principles for the development of measurement systems for research and development processes. R&D Manag. 1997, 27, 345–357. [Google Scholar]
- Godener, A.; Soderquist, K.E. Use and impact of performance measurement results in R&D and NPD: An exploratory study. R&D Manag. 2004, 34, 191–220. [Google Scholar]
- Bremser, W.G.; Barsky, N.P. Utilizing the balanced scorecard for R&D performance measurement. R&D Manag. 2004, 34, 229–238. [Google Scholar]
- Ojanen, V.; Vuola, O. Coping with the multiple dimensions of R&D performance analysis. Int. J. Technol. Manag. 2006, 33, 279–290. [Google Scholar]
- Chiesa, V.; Fratini, F.; Lazzarotti, V.; Manzini, R. Performance measurement in R&D: Exploring the interplay between measurement objectives, dimensions of performance and contextual factors. R&D Manag. 2009, 39, 487–519. [Google Scholar]
- Lazzarotti, V.; Manzini, R.; Mari, L. A model for R&D performance measurement. Int. J. Prod. Econ. 2011, 134, 212–223. [Google Scholar]
- Jyot, D.K.B.; Deshmukh, S.G. Balanced scorecard for performance evaluation of R&D organization: A conceptual model. J. Sci. Ind. Res. 2006, 65, 879–886. [Google Scholar]
- Verhaeghe, A.; Kfir, R. Managing innovation in a knowledge intensive organisation. R&D Manag. 2002, 32, 409–417. [Google Scholar]
- Gama, N.; Silva, M.M.; Ataide, J. Innovation scorecard: A balanced scorecard for measuring the value added by innovation. In Digital Enterprise Technology; Cunha, P.F., Maropoulos, P.G., Eds.; Springer: Berlin/Heidelberg, Germany, 2007; pp. 417–424. [Google Scholar]
- Vinkemeier, R. Long-term innovation management: The Balanced Innovation Card in interplay with roadmaps. Int. J. Technol. Intell. Plan. 2008, 4, 215–227. [Google Scholar] [CrossRef]
- Khomba, J.; Vermaak, F.N.; Gouws, D.G. Redesigning an innovation section of the Balanced Scorecard model: An African perspective. South. Afr. Bus. Rev. 2011, 15, 1–20. [Google Scholar]
- Wu, M.-F. The effects of balanced scorecard implementation on the intellectual capital accumulation of Taiwan-listed IT companies: Using corporate innovation activities as the moderator. J. Glob. Bus. Manag. 2012, 8, 82–93. [Google Scholar]
- Mohamed, F.A.-A. The relationship between Balanced Scorecard characteristics and innovation: Evidence from Egypt. New York Sci. J. 2013, 6, 62–73. [Google Scholar]
- Dewangan, V.; Godse, M. Towards a holistic enterprise innovation performance measurement system. Technovation 2014, 34, 536–545. [Google Scholar] [CrossRef]
- Ivanov, C.I.; Avasilcai, S. Measuring the performance of innovation processes: A Balanced Scorecard perspective. Procedia Soc. Behav. Sci. 2014, 109, 1190–1193. [Google Scholar] [CrossRef]
- Zizlavsky, O. Innovation scorecard: Conceptual framework of innovation management control system. J. Glob. Bus. Technol. 2016, 12, 10–27. [Google Scholar]
- Spanò, R.; Sarto, F.; Caldarelli, A.; Viganò, R. Innovation & performance measurement: An adapted balanced scorecard. Int. J. Bus. Manag. 2016, 11, 194–2014. [Google Scholar]
- Zhang, J. Empirical Evidence on the Use of the Balanced Scorecard and Innovation: Exploring the Role of Firm Competences and Performance Consequences. Ph.D. Thesis, University of Toledo, Toledo, Spain, 2016. [Google Scholar]
- Saunila, M.; Ukko, J. A conceptual framework for the measurement of innovation capability and its effects. Balt. J. Manag. 2012, 7, 355–375. [Google Scholar] [CrossRef]
- Hájek, P.; Stríteská, M.K.; Prokop, V. Integrating Balanced Scorecard and Fuzzy TOPSIS for Innovation Performance Evaluation. In Twenty-Second Pacific Asia Conference on Information Systems, Japan 2018. Available online: https://aisel.aisnet.org/pacis2018/26 (accessed on 15 November 2022).
- Hájek, P.; Stejskal, J.; Stríteská, M.K.; Prokop, V. Modelling innovation paths of European firms using fuzzy Balanced Scorecard. In Reliability and Statistical Computing; Springer Series in Reliability Engineering; Pham, H., Ed.; Springer Nature: Cham, Switzerland, 2020; pp. 35–46. [Google Scholar]
- Dudic, Z.; Dudic, B.; Gregus, M.; Novackova, D.; Djakovic, I. The innovativeness and usage of the Balanced Scorecard model in SMEs. Sustainability 2020, 12, 3221. [Google Scholar] [CrossRef]
- Asgari, N.; Avakh Darestani, S. Application of multi-criteria decision making methods for balanced scorecard: A literature review investigation. Int. J. Serv. Oper. Manag. 2017, 27, 262–283. [Google Scholar] [CrossRef]
- Quezada, L.E.; López-Ospina, H.A.; Palominos, P.I.; Oddershed, A.M. Identifying causal relationships in strategy maps using ANP and DEMATEL. Comput. Ind. Eng. 2018, 118, 170–179. [Google Scholar] [CrossRef]
- Martins, F.; Almeida, M.F.; Calili, R.; Oliveira, A. Design Thinking applied to smart home projects: A user-centric and sustainable perspective. Sustainability 2020, 12, 10031. [Google Scholar] [CrossRef]
- Figge, F.; Hahn, T.; Schaltegger, S.; Wagner, M. The Sustainability Balanced Scorecard—Linking sustainability management to business strategy. Bus. Strat. Environ. 2002, 11, 269–284. [Google Scholar] [CrossRef]
- Elkington, J. Partnerships from cannibals with forks the triple bottom line of 21st century business. Environ. Qual. Manag. 1998, 6, 37–51. [Google Scholar] [CrossRef]
- Butler, J.B.; Henderson, S.C.; Raiborn, C. Sustainability and the Balanced scorecard: Integrating green measures into business reporting. Manag. Account. Quartely 2011, 12, 1–10. [Google Scholar]
- Eurostat. Community Innovation Survey (CIS). Available online: https://ec.europa.eu/eurostat/web/microdata/community-innovation-survey (accessed on 15 November 2022).
- USAID. Performance Monitoring & Evaluation TIPS Constructing an Evaluation Report. 2010. Available online: http://pdf.usaid.gov/pdf_docs/pnadw106.pdf (accessed on 15 November 2022).
- Görgens, M.; Kusek, J.Z. Making Monitoring and Evaluation Systems Work: A Capacity Development Toolkit; The International Bank for Reconstruction and Development: Washington, DC, USA; The World Bank: Washington, DC, USA, 2009. [Google Scholar]
- Kusek, J.Z.; Rist, R.C. Ten Steps to a Results-Based Monitoring and Evaluation System: A Handbook for Development Practitioners; The World Bank: Washington, DC, USA, 2004. [Google Scholar]
- Saaty, T.L. How to make a decision: The analytic hierarchy process. Eur. J. Oper. Res. 1990, 1, 9–26. [Google Scholar] [CrossRef]
- Hwang, C.L.; Yoon, K. Multiple Attribute Decision Making: Methods and Applications; Springer: New York, NY, USA, 1981. [Google Scholar]
- Saaty, T.L.; Takizawa, M. Dependence and independence: From linear hierarchies to nonlinear networks. Eur. J. Oper. Res. 1986, 26, 229–237. [Google Scholar] [CrossRef]
- Saaty, T.L. Decision Making with Dependence and Feedback: The Analytic Network Process; RWS Publications: Pittsburgh, PA, USA, 1996. [Google Scholar]
- Zadeh, L.A. Fuzzy sets. Inf. Control 1965, 8, 338–353. [Google Scholar] [CrossRef]
- Creative Decision Foundation. Super Decisions V.3.2 Manual. 2019. Available online: https://www.superdecisions.com/manuals/ (accessed on 15 November 2022).
- Weerawardena, J. The role of marketing capability in innovation-based competitive strategy. J. Strateg. Mark. 2003, 11, 15–35. [Google Scholar] [CrossRef]
- Alegre, J.; Lapiedra, R.; Chiva, R. A measurement scale for product innovation performance. Eur. J. Innov. Manag. 2006, 9, 333–346. [Google Scholar] [CrossRef]
- Calik, E.; Bardudeen, F. A measurement scale to evaluate sustainable innovation performance in manufacturing organizations. Procedia CIRP 2016, 40, 449–454. [Google Scholar] [CrossRef]
- Calik, E.; Calisir, F.; Cetinguc, B. A scale development for innovation capability measurement. J. Adv. Manag. Sci. 2017, 5, 69–76. [Google Scholar] [CrossRef]
- Yin, R.K. Case Study Research: Design and Methods, 5th ed.; Sage Publications: Newbury Park, CA, USA, 2013. [Google Scholar]


Disclaimer/Publisher’s Note: The statements, opinions and data contained in all publications are solely those of the individual author(s) and contributor(s) and not of MDPI and/or the editor(s). MDPI and/or the editor(s) disclaim responsibility for any injury to people or property resulting from any ideas, methods, instructions or products referred to in the content. |
© 2022 by the authors. Licensee MDPI, Basel, Switzerland. This article is an open access article distributed under the terms and conditions of the Creative Commons Attribution (CC BY) license (https://creativecommons.org/licenses/by/4.0/).