Technical Note

Analysis of Double Inverted Flag Energy Harvesting System in Pipe Flow

1
Department of Aerospace Engineering, Tamkang University, 151, Yingzhuan Rd., Tamsui Dist., New Taipei City 25137, Taiwan
2
Taiwan Semiconductor Manufacturing Co., Ltd., No. 1, Xinke Rd., Xitun Dist., Taichung 40763, Taiwan
*
Author to whom correspondence should be addressed.
Sustainability 2023, 15(1), 704; https://doi.org/10.3390/su15010704
Submission received: 7 December 2022 / Revised: 25 December 2022 / Accepted: 26 December 2022 / Published: 30 December 2022
(This article belongs to the Special Issue Application of Green Energy Technology in Sustainable Environment)

Abstract

:
This technical note numerically and experimentally studies a vibration energy harvester (VEH) consisting of a set of two parallel elastic steel sheets (ESSs) and piezoelectric patches (PZTs) in pipe flow. The roots of the elastic steel sheets are fixed on the base with the PZTs to form a double inverted flag vibration energy harvesting system (DIF-VEHS). In this note, a semi-circular receiving device (receiver) was added to the free end of the elastic steel, and a cylinder was installed upstream to generate a periodic oscillating flow field in the pipeline to obtain better electric energy generation efficiency. This study reveals the effect of different factors on the energy harvesting system, such as the distance between the ESSs, the diameter of the cylinder, etc. This study uses ANSYS software to simulate the fluid–structure interaction vibration of ESSs to determine the feasibility of this design. An experimental setup is then implemented to find the most effective combination of factors for the system. The results of this study show that with all parameters configured properly, the electric energy generation reaches a maximum average value of 1.6657 V per minute. In the future, such devices could be installed in sewers, pipes or rivers, allowing the flow energy of the fluid to be recycled to generate more energy.

1. Introduction

The 2020 edition of the “BP World Energy Statistical Yearbook” [1] stated that the global renewable energy growth in 2019 hit a record high, accounting for more than 40% of the global primary energy growth, higher than other types of fuels. The share of renewable energy in power generation (10.4%) surpassed nuclear power for the first time. In recent decades, the global climate has undergone rapid changes, and the earth’s ecology has turned a red light due to human intervention. Therefore, human beings are committed to the development of renewable energy, which has flourished under the promotion of governments and non-profit organizations. Common renewable energy sources include solar energy and wind power, but in addition to such energy sources that have been used and known by the public, scientists are also trying their best to find other energy sources that can be used, and the vibration energy harvesting system was born in this context. Roundy [2] mentioned that energy harvesting from the environment has gradually become a power source for low-power sensors, coupled with the advancement of very-large-scale integration (VLSI) fabrication technology. He proposed the concept of a microelectromechanical system to provide viable energy sources in wireless sensor networks. Roundy [3] implemented the previously proposed concept and analyzed the optimized product, stating that piezoelectric converters provide more power per unit volume than capacitive converters. The representative research of mechanical vibration electric energy generation is the bistable energy harvester (BEH). Preliminary experiments by Rivest et al. [4] in 2005 demonstrated the potential of bistable energy harvesting systems. Cottone et al. [5] and Ramlan et al. [6] both successfully realized a vibration model with a bistable energy well through numerical analysis and research, and indicated that for low-frequency vibration input, the bistable energy harvesting system can provide more energy than the traditional VEH systems. This was also proved by the experimental results of Cottone et al. [5]. Moon et al. [7] conducted an experimental study on the bistable vibration model, and the results showed that the behavior of the vibration model was chaotic during the experiment, and the bistable phenomenon was limited to certain frequency ranges and amplitudes. Therefore, it is extremely challenging to design a successful bistable energy harvesting system. Experimental studies by Arrieta et al. [8] and Stanton et al. [9] have demonstrated that switching between two stable equilibrium points in a bistable system can provide more energy than in-well motion.
Compared with the bistable energy harvesting system, the use of the energy of the stable or unstable flow field caused by the fluid to harvest its energy has also been widely studied. In order to successfully apply hydrokinetic energy to energy harvesting, Kim et al. [10] argue that a model should be designed that tends to become unstable at low critical flow rates and has higher excitation. They therefore came up with the design concept of a reversed flag, and this model has a free leading edge and a fixed trailing edge, with the constraints opposite to typical flags. In this study, they experimented with the stability and flapping behavior of twin reversed flags arranged side-by-side and limited in height, and showed that reversed flags were more unstable than regular flags fixed to the leading edge. Li et al. [11] proposed to add a mass to the free end of the reverse flag to induce the flag to oscillate itself. Orrego et al. [12] subsequently conducted outdoor experiments and used the harvested ambient wind energy to power the temperature sensor, and this study also represented the first practical application of the energy harvesting in natural environment conditions.
Pipeline transportation has the advantages of large volume, unaffected by weather factors during transportation, 24 h uninterrupted and good continuous transportation performance, all of which meet some of the requirements of green energy technology. In addition, in general oil pipelines or urban trails, the pipeline is the vibration of fluid–structure coupling, which provides an excellent vibration source. If the principle associated with piezoelectric materials can be combined with it, we believe that this fluid–structure coupling concept can be implemented for useful electric energy generation. A number of advanced methods have been employed to harvest and convert the vibrational energy of fluids into electrical energy by inducing the vibrations produced by the PZT through the fluid. The phenomenon of vibration induced by fluid flow is called flow-induced vibration (FIV), and two cases are most often discussed, one is vortex-induced vibration (VIV) and the other is wake-induced vibration (WIV). Taylor et al. [13] and Alberto et al. [14] proposed a flexible PZT similar to a flag. When the flexible PZT was placed in water and affected by a fluid, they found that the swing of the flag can achieve the purpose of electrical energy conversion. In another application, Bezanson [15] used a set of encapsulated piezoelectric devices to collect energy. A cantilever beam is connected on the top of the VEH device. The beam will swing after being affected by the ocean current. After swinging, the bottom of the beam will make the piezoelectric material of the energy-harvesting device deform to generate electricity. Erik et al. [16] designed a set of models equipped with cantilever beams and cylinders, installed cylinders under the beams with piezoelectric layers, and then placed the entire set of models vertically into the water and successfully obtained electricity. From their experimental results, the vortex-induced vibration (VIV) potential for energy harvesting in water flow can be seen. Zhang et al. [17] placed the beam with the piezoelectric layer in a different orientation from Erik et al. [16], and found the best combination of electric energy generation benefits from different circuits. From their experimental results, the potential of vortex-induced vibration for electrical energy conversion in water flow can be seen. Pritam et al. [18] used two cylinders to conduct experiments and explored whether the downstream cylinder would be affected by wake-induced vibration and lead to an increase in the vibration amplitude. Lin et al. [19] discussed wake-induced vibration through the interactive motion of two cylinders in the water flow and concluded from the results that a system of two interleaved cylinders can harvest more energy from the water flow than two separate cylinders. In order to successfully apply fluid to energy harvesting, Gunasekaran and Ross [20] used the flexible inverted piezo embedded polyvinylidene difluoride (PVDF) as a simultaneous energy harvester and put it in the wake of a 2D NACA 0012 model and SD7003 model to explore the power generation of the PVDF. Recently, Tavallaeinejad et al. [21] proposed a theory of electrical energy conversion for inverted flag vibrations. It is worth noting that, through theoretical analysis, they provide bifurcation diagrams of different flow velocities in this system. These data give an excellent reference for future fluid–structure interaction (FSI) analysis. Ojo et al. [22] analyzed the bistable fluttering response of heavy inverted flags with different aspect ratios. Their work focused on the effect of VIV on the inverted flags in the axial flow field. These analyzes focused on amplifying the vibration energy harvesting benefits of inverted flags, so the effects of resonance or flow field instability caused by some FSIs are considered, but the normal operation of general engineering facilities was not analyzed. Cao et al. Cao et al. [23] have reviewed many papers on flow-induced vibration (FIV), including VIV and WIV, for energy conversion benefits. At a normal flow speed, regardless of limit cycle oscillation (LCO) or galloping, the traditional FIV power generation is probably between several μW. Mujtaba et al. [24] proposed a fluid-dynamic energy harvesting system of two piezoelectric tandem flags arranged in series under the influence of an upstream bluff body. At a flow rate of 0.1 m/s, its power conversion efficiency is about 10 mV.
Based on the results of the previous references, we designed an energy harvesting system that integrates the inverted flag vibration, the flow field in the pipe, and the receiving device (receiver). This study initially demonstrates that the concept of the double inverted flag vibration energy harvesting system (DIF-VEHS) model can also be expected in a normal operation of general engineering facilities if small-scale experiments in the laboratory can generate electricity. In the present work, we use the vibration of flow-induced inverted flags to drive the PZT installed on the elastic steel sheet to achieve the effect of electric energy generation through its deformation and force. The two pieces of elastic steel sheets (ESSs) will swing alternately to achieve the effect of generating electricity in turn. Several typical distances between two ESSs and the lengths of the ESSs are studied to find the best electric energy conversion for DIF-VEHS.

2. System Modelling

The present work is divided into numerical analysis and experimental measurement. In order to easily explain the model designed in this study, this Section first explains the experimental model and the setting of some parameters, so that readers can have a preliminary concept of the designed model.

2.1. Research Model and Research Method Conception

The experiments in this study are divided into three parts: (1) The establishment of DIF-VEHS. This model is to fix two elastic steels on the base in a side-by-side form, and place a piezoelectric sheet (PZT) on the fixed end (root) of the steel. The bi-morph material type of the PZT patch (produced by Superex TechnologyTM, Taipei, Taiwan) was used in this study. The size of the PZT is 60 mm × 20 mm × 0.6 mm in this experiment. When the elastic steel is affected by the fluid in the water, it will oscillate and generate electricity, as shown in Figure 1. Figure 1a,b are the top view and front view of the pipe, respectively. Figure 1c is the parameter description in the experiment. (2) Install a semi-circular receiver at the tip of the free end of the elastic steel sheet. The semi-circular receiver faces the direction of water flow, and uses the vibration of the flow generated by vortex-induced vibration to generate electricity, as shown in Figure 2. Figure 2a,b are the top view and front view of the pipe, respectively. Figure 2c is the parameter description in the experiment. (3) A fixed cylinder is set in front of the DIF-VEHS. After the fluid passes through the cylinder, two regular oscillating flow fields will be generated downstream. The two pieces of ESS will swing alternately to achieve the effect of generating electricity in turn. This phenomenon will cause the ESSs to generate more frequent and larger vibrations, which will generate more electricity, as shown in Figure 3, which will be shown later in this study.
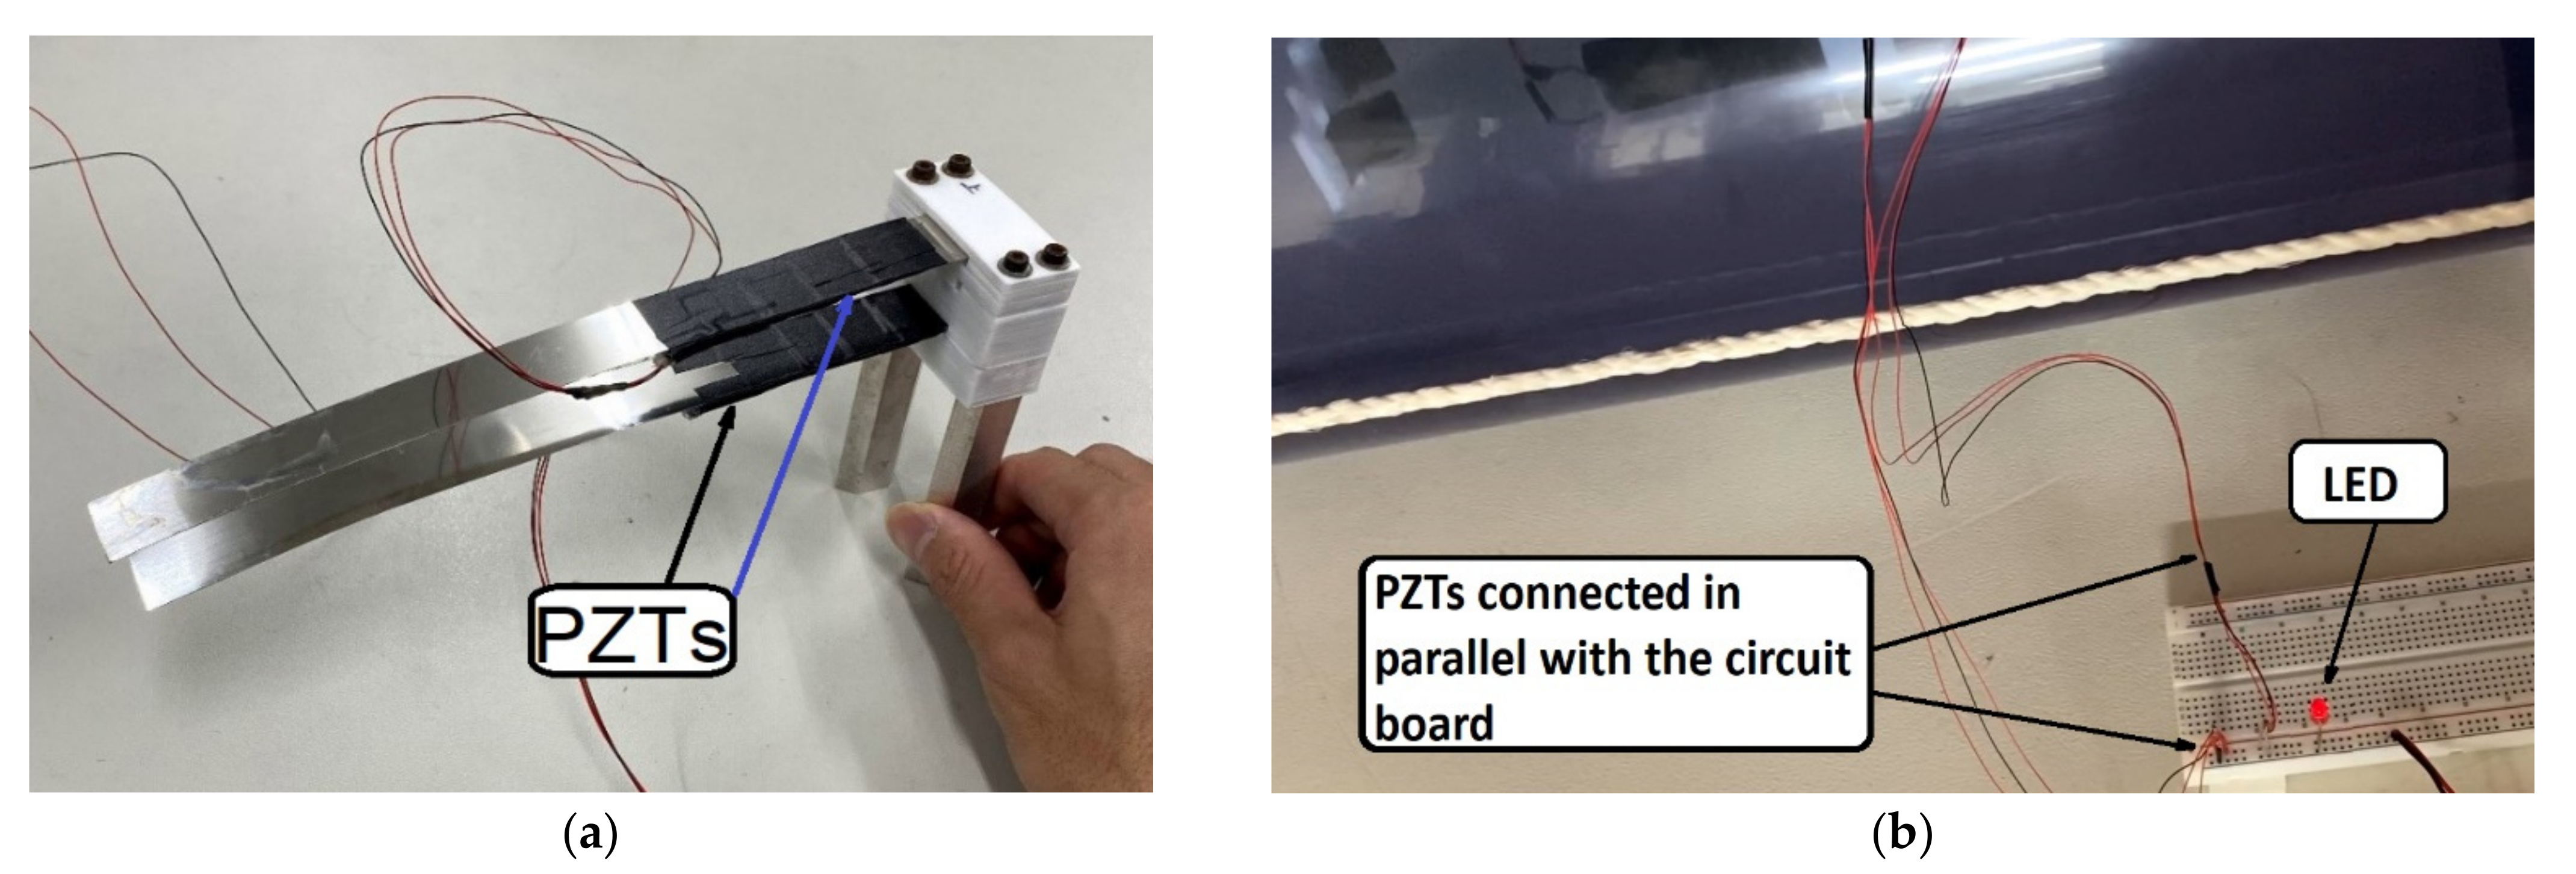
In this experiment, the PZTs are first welded with single-core enameled wire, and then wrapped with insulating tape as shown in Figure 4a. The other end of the wire is connected in parallel with the circuit board as shown in Figure 4b, and then connected to the instrument to measure the voltage.

2.2. Fluid–Structure Interaction Numerical Analysis

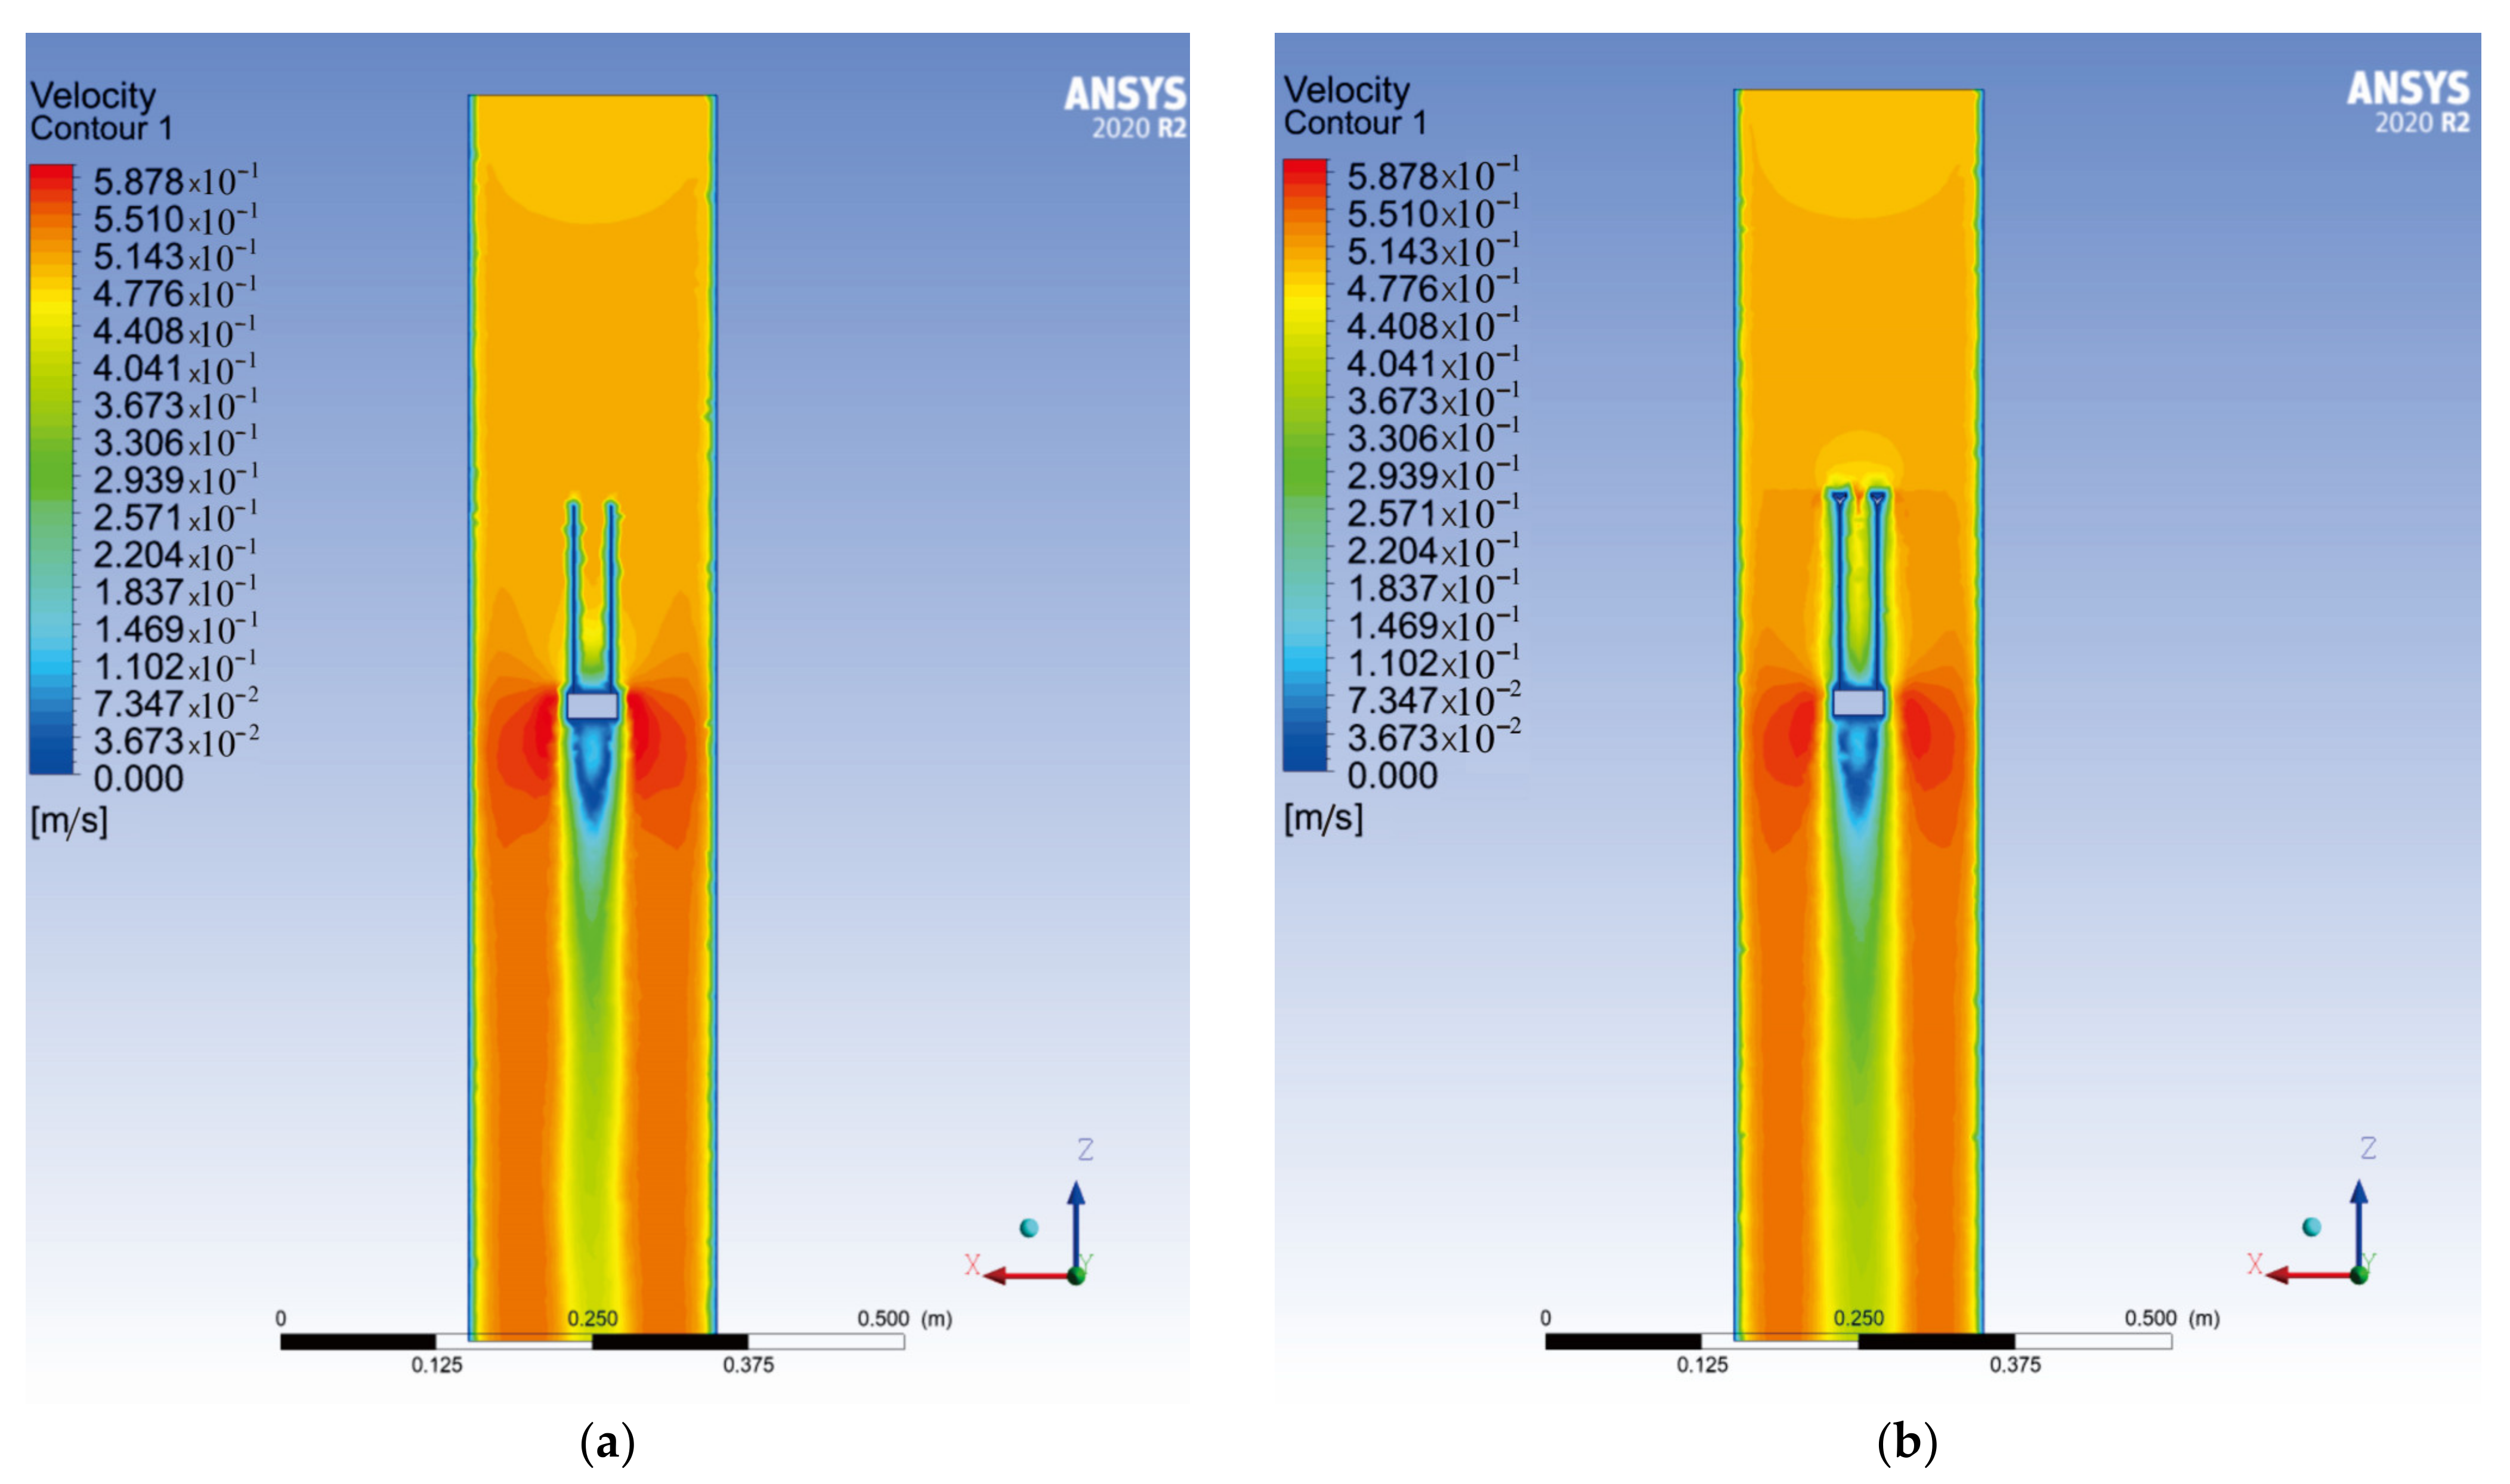
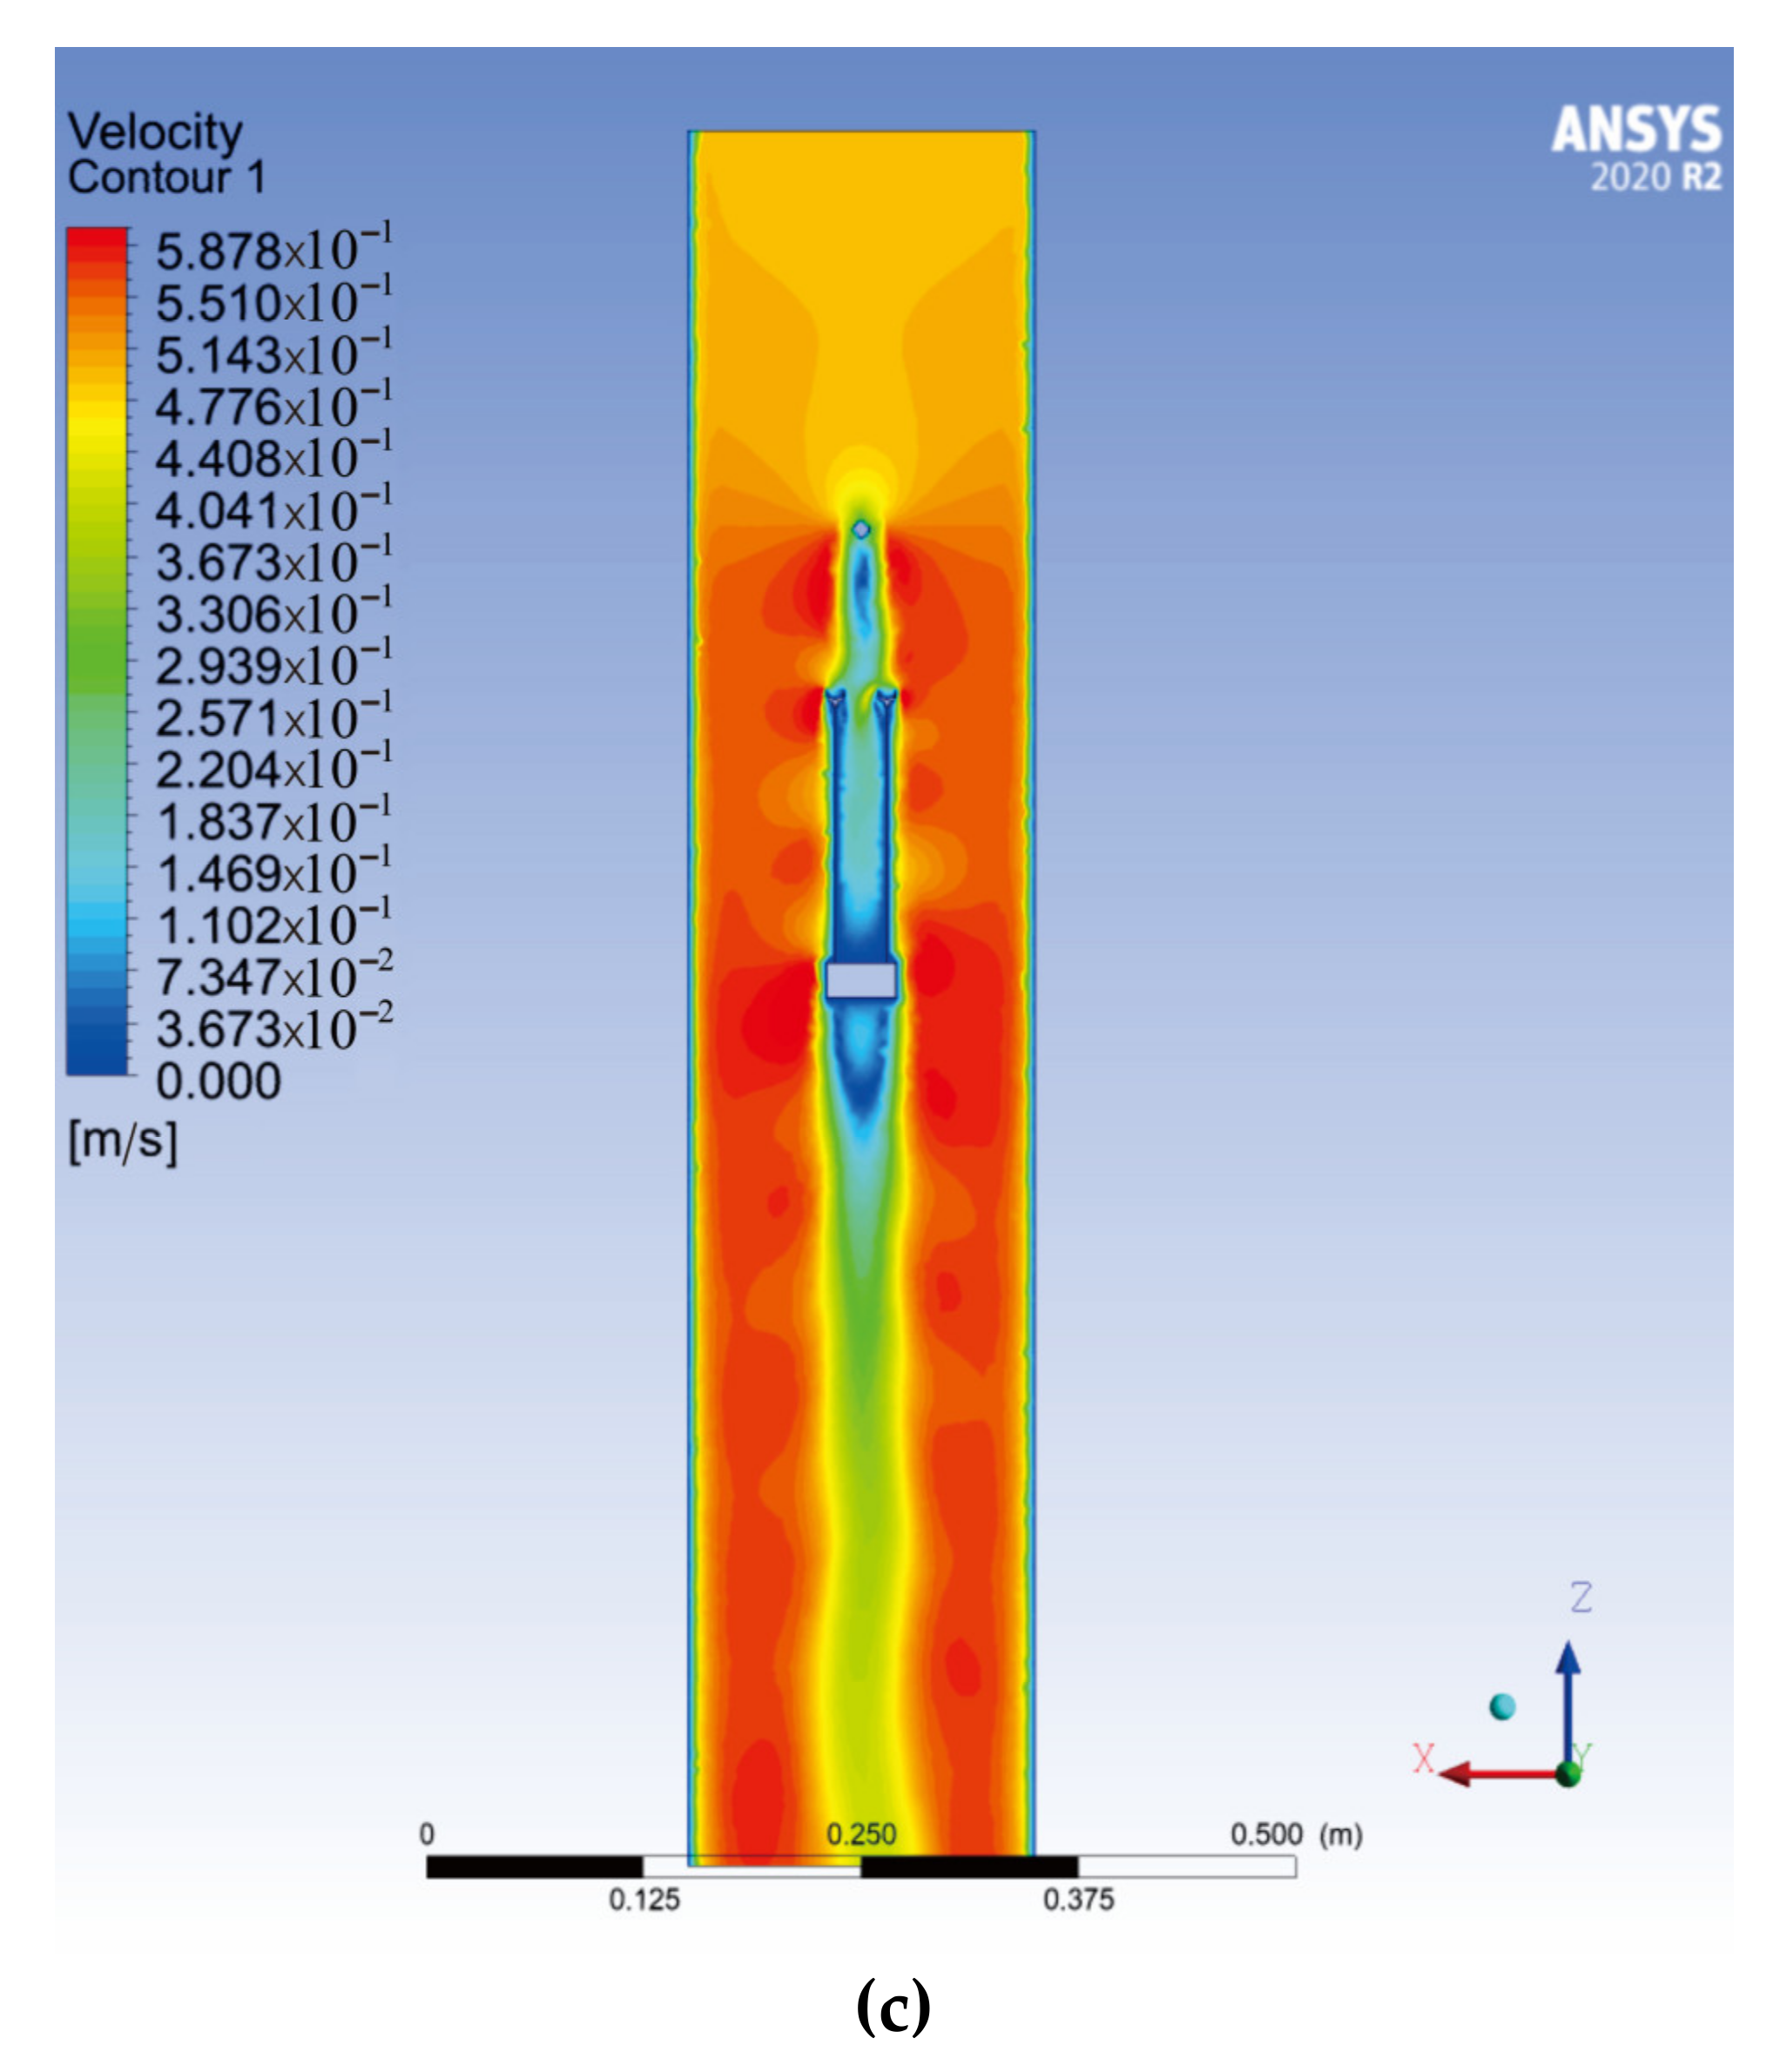
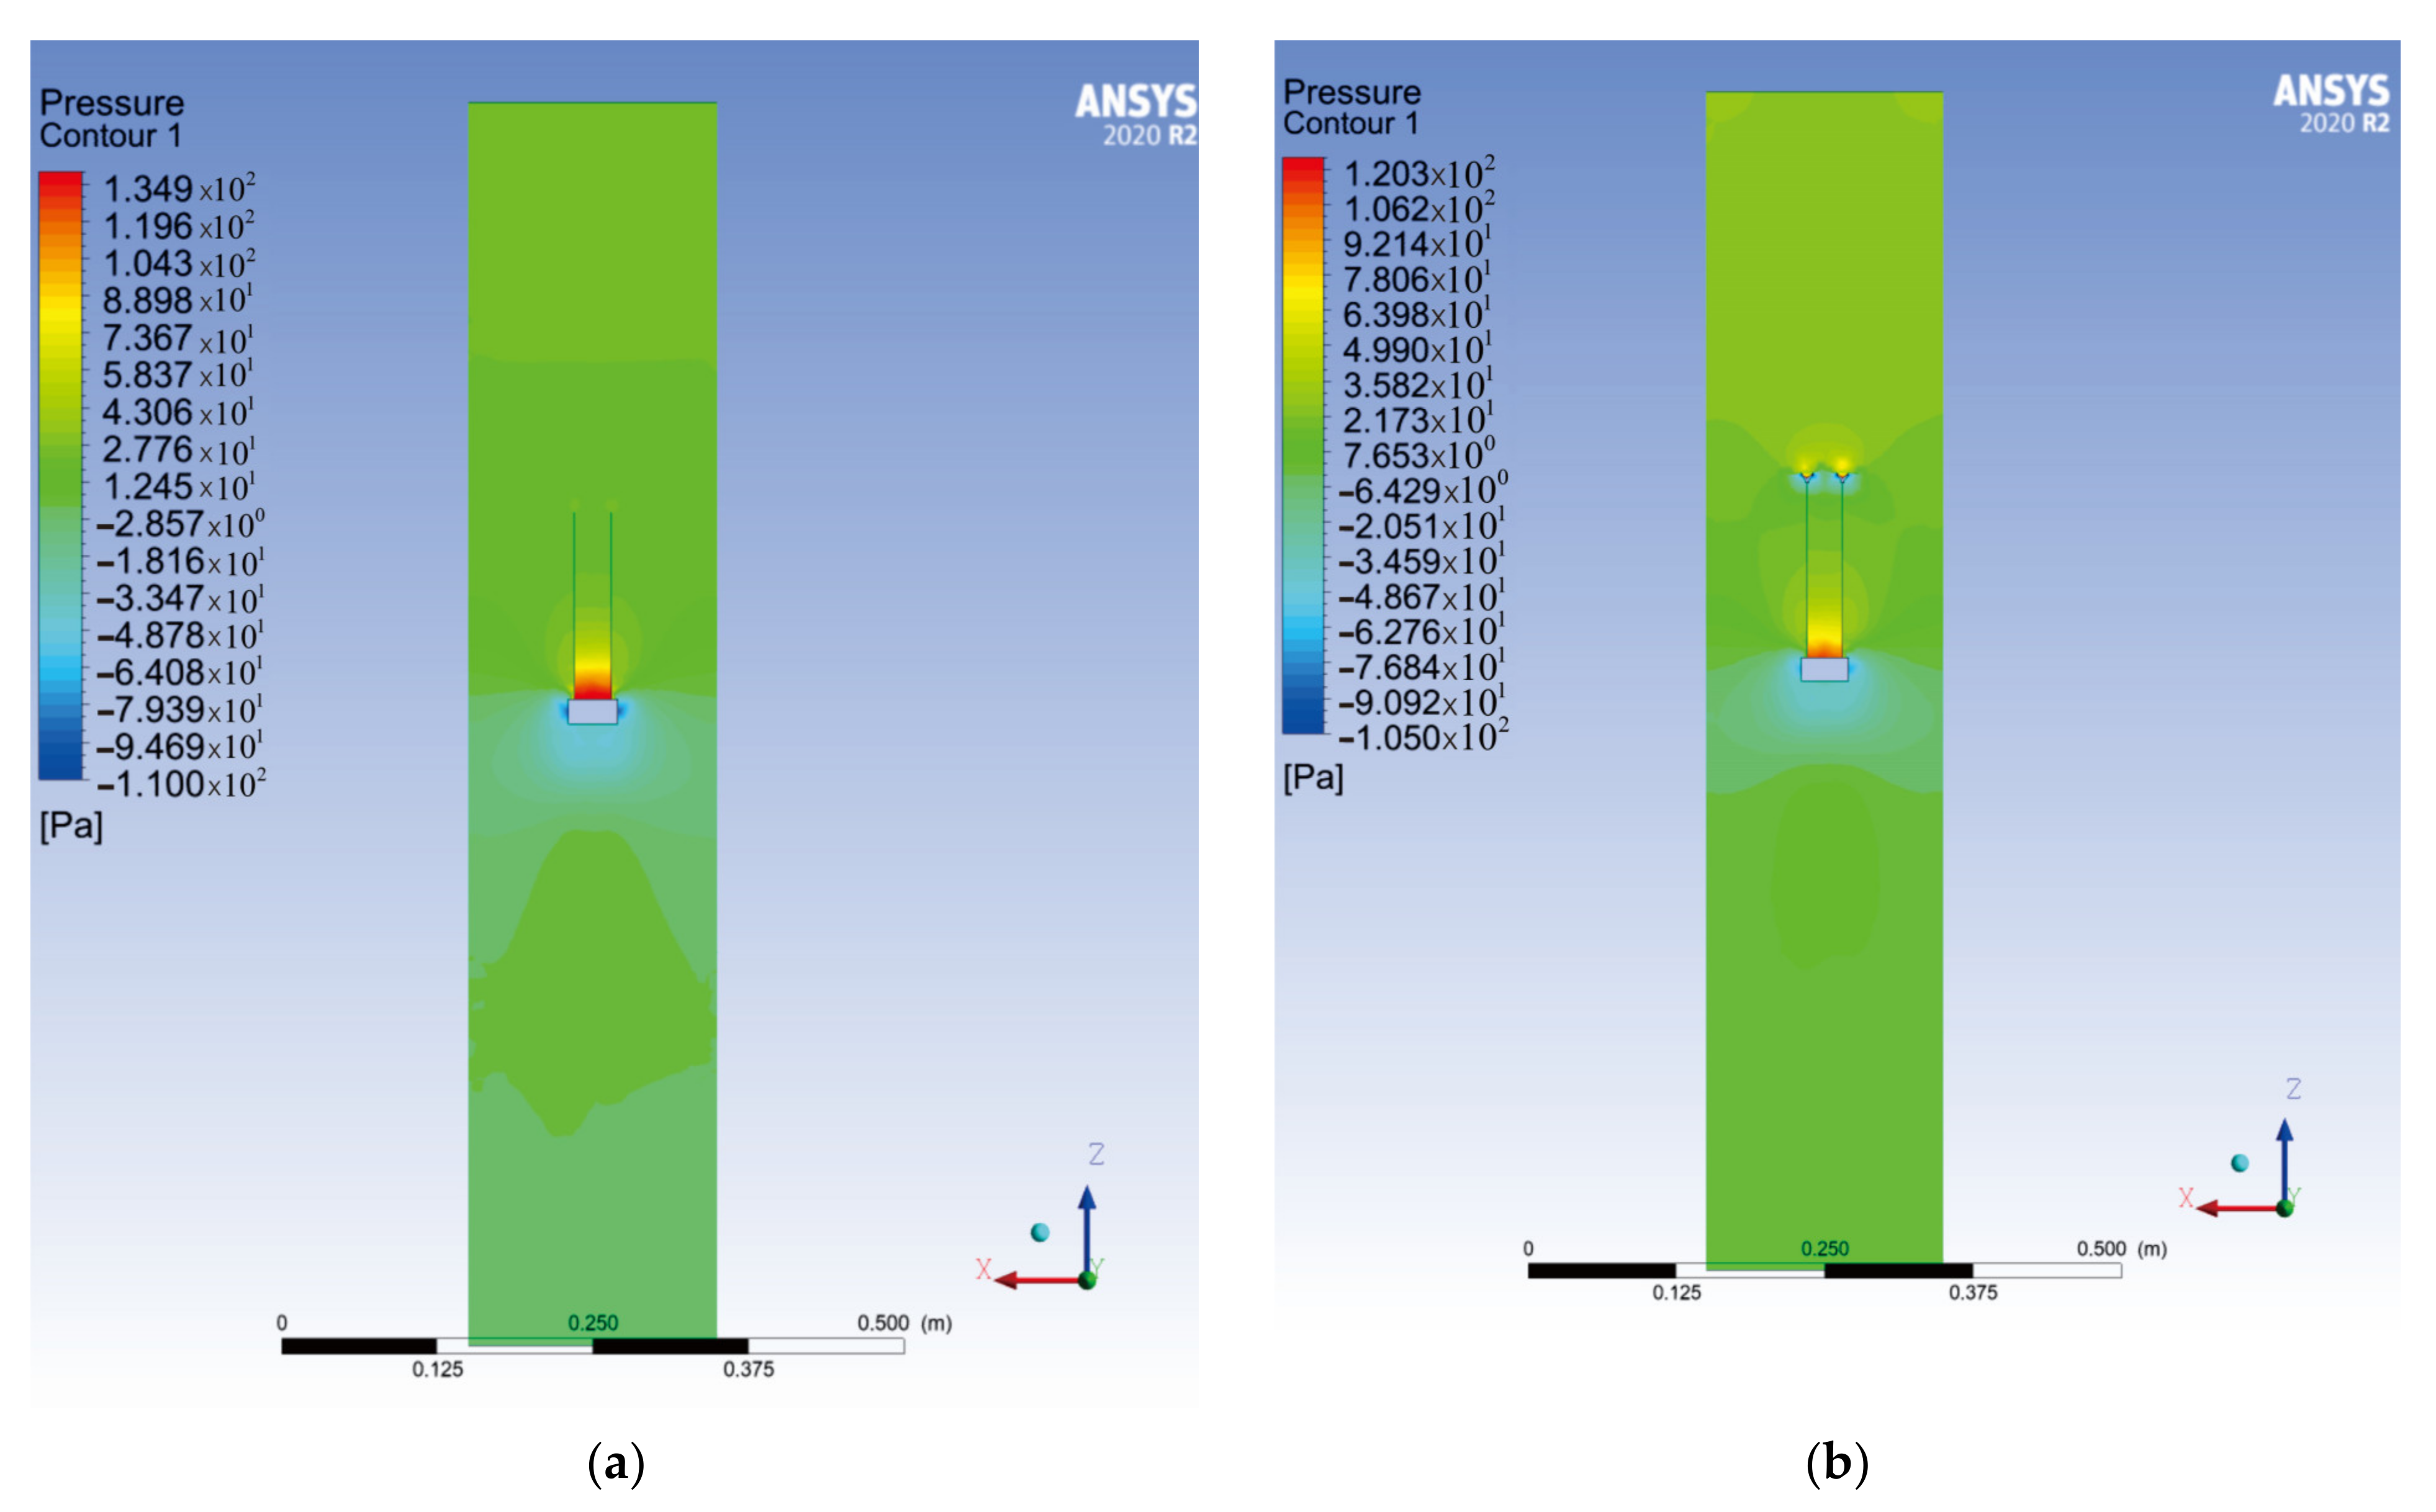
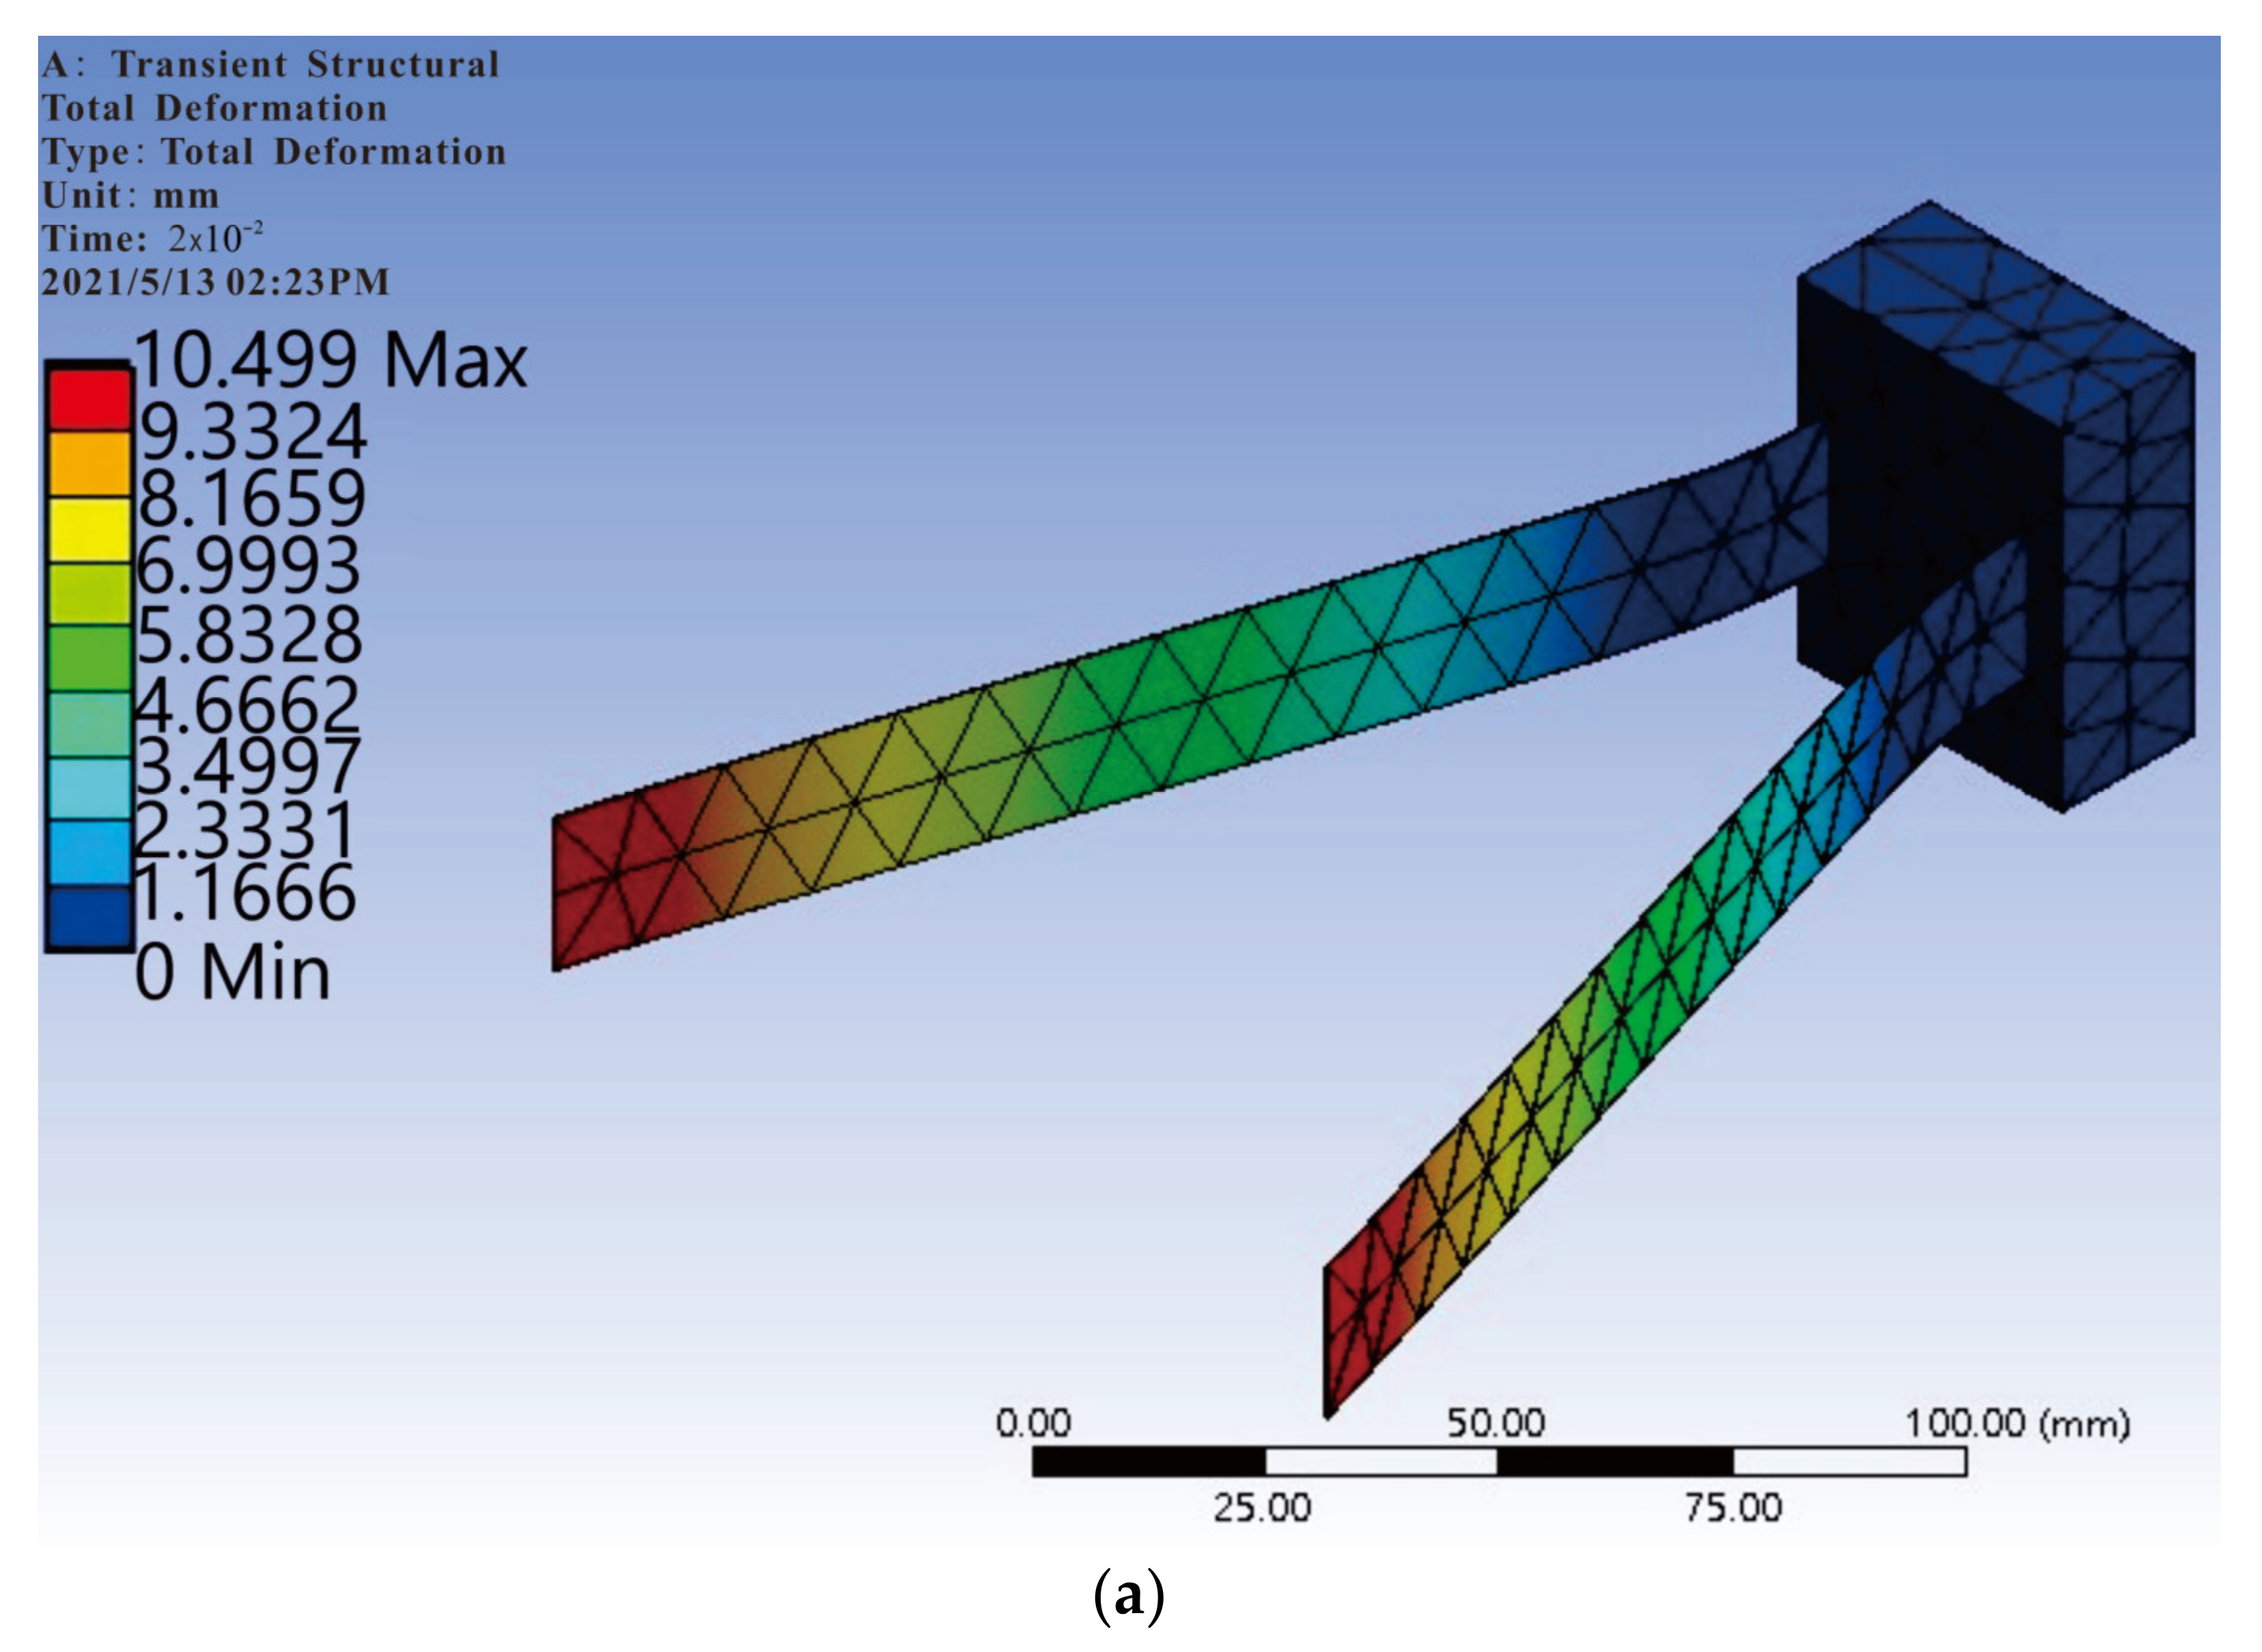
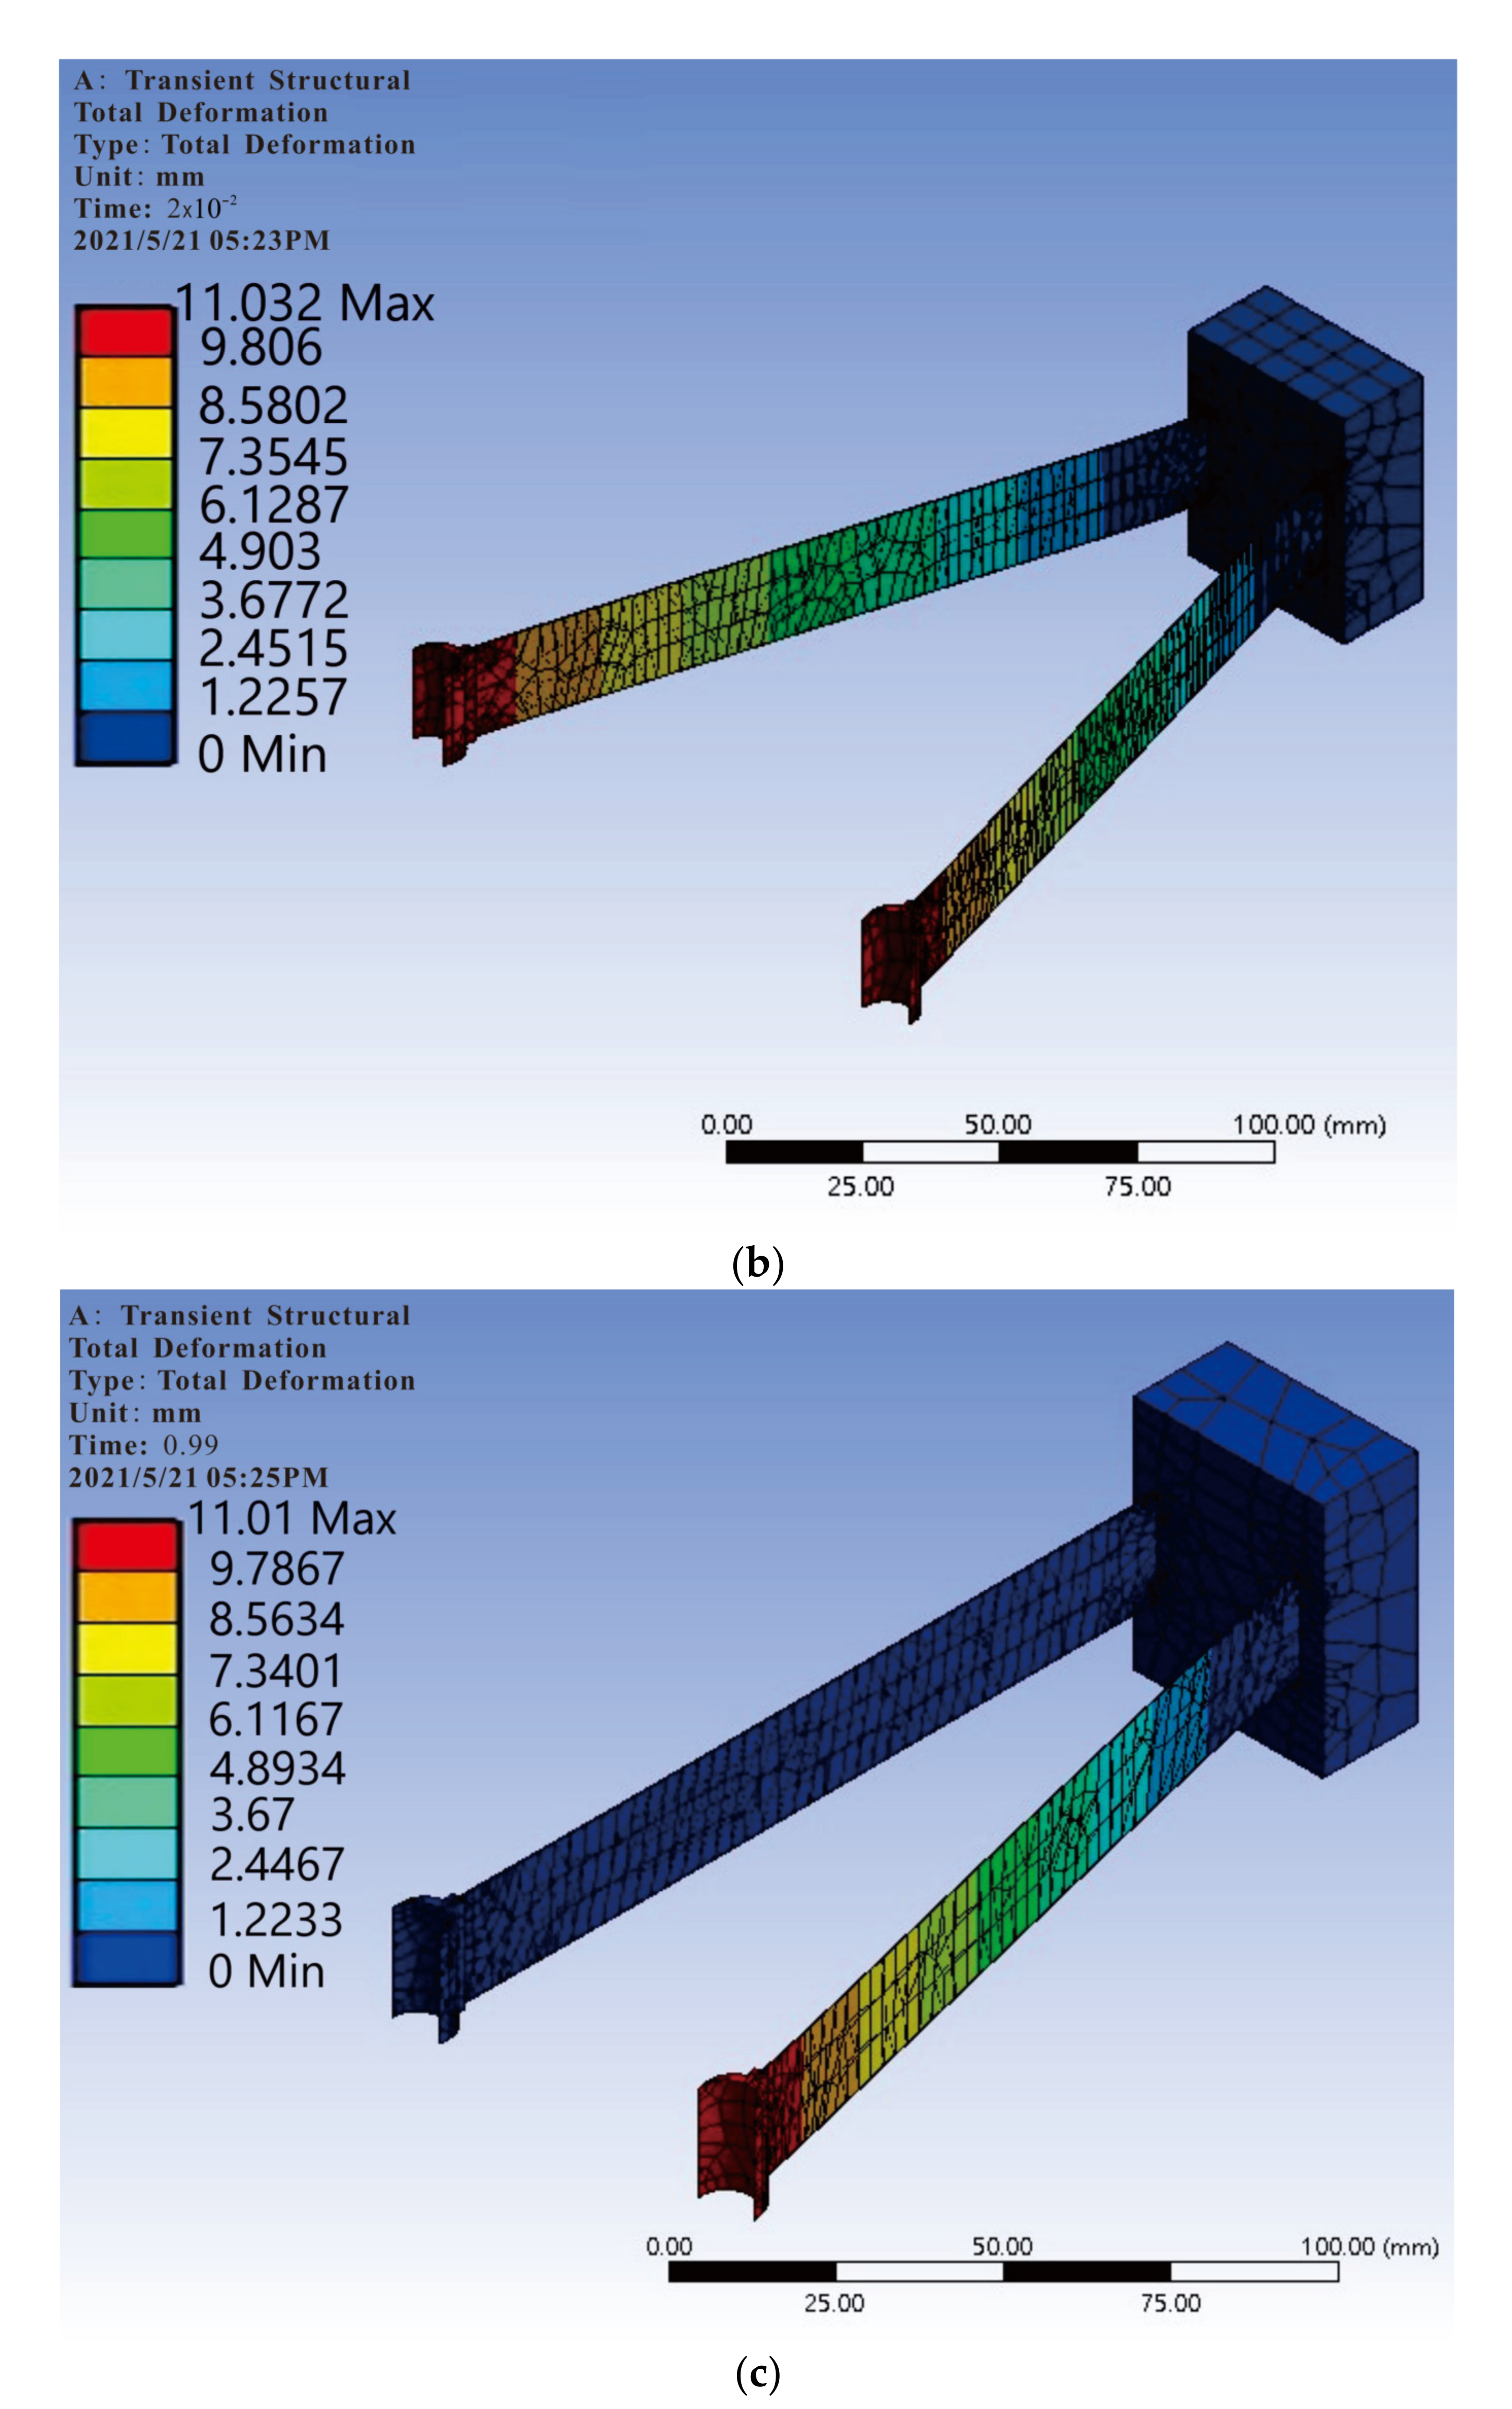
The purpose of performing numerical simulation with ANSYS on this proposed model is to observe the vibration of the elastic steel sheets (ESSs) of this double inverted flag vibration energy harvesting system (DIF-VEHS) in the pipe flow field. Before performing the experiment, we confirmed that this model is feasible for electrical energy conversion. In this numerical study, the two-way simulation module in ANSYS was used to analyze the vibration of the elastic steel in the flow pipe. The two-way fluid–structure interaction (FSI) module was used to simulate the system coupling by the change of the flow field in the pipe and the displacements of the elastic steels. We used Fluent to simulate the flow field in the pipe. First, we used “Geometry” and “mesh” to generate graphics and grids, then set the material of the fluid domain to water and set the algorithm and the number of iteration steps, and finally used the “Check” function to check whether there is a problem with the settings and performed iteration calculations. Figure 5 shows the DIF-VEHS models of cases 1~3. The dimensions are given as L1 = 150 mm, L2 = 30 mm for Case 1; L1 = 150 mm, L2 = 30 mm, D1 = 10 mm for Case 2; and L1 = 150 mm, L2 = 30 mm, D1 = 10 mm, D2 = 10 mm, L3 = 100 mm for Case 3. In the next step, we used the function of two-way fluid–structure interaction to simulate this problem. The simulation process is divided into three parts: model establishment, Fluent calculation, and transient stress calculation, in which Fluent fluid dynamics calculation and transient stress calculation will iterate each other repeatedly. The purpose of the proposed model in this study is to repeatedly vibrate the elastic steel in the water flow in order to generate voltage, so this simulation should be based on two-way fluid–solid coupling. Figure 6 shows the flow velocity simulated by ANSYS of cases 1~3. Figure 7 shows the pressure contour predicted by ANSYS of cases 1~3. Figure 6c shows the vortex shedding from the cylinder in Case 3. Figure 7c shows more pressure exerted on the receiver in Case 3. From this initial analysis, it can be known that Case 3 is the most likely to achieve the periodic vibration of elastic steel and have a large deformation. Figure 7c also shows that where the ESSs are connected to the base, the pressure is not as strong as that of Case 1 and Case 2, so it is more favorable for the two pieces of ESS to bounce outwards and return to their original positions, so as to obtain greater deformation and electric energy generation. Figure 8 shows the amplitudes simulated by ANSYS of cases 1~3.

2.3. Experimental Setup

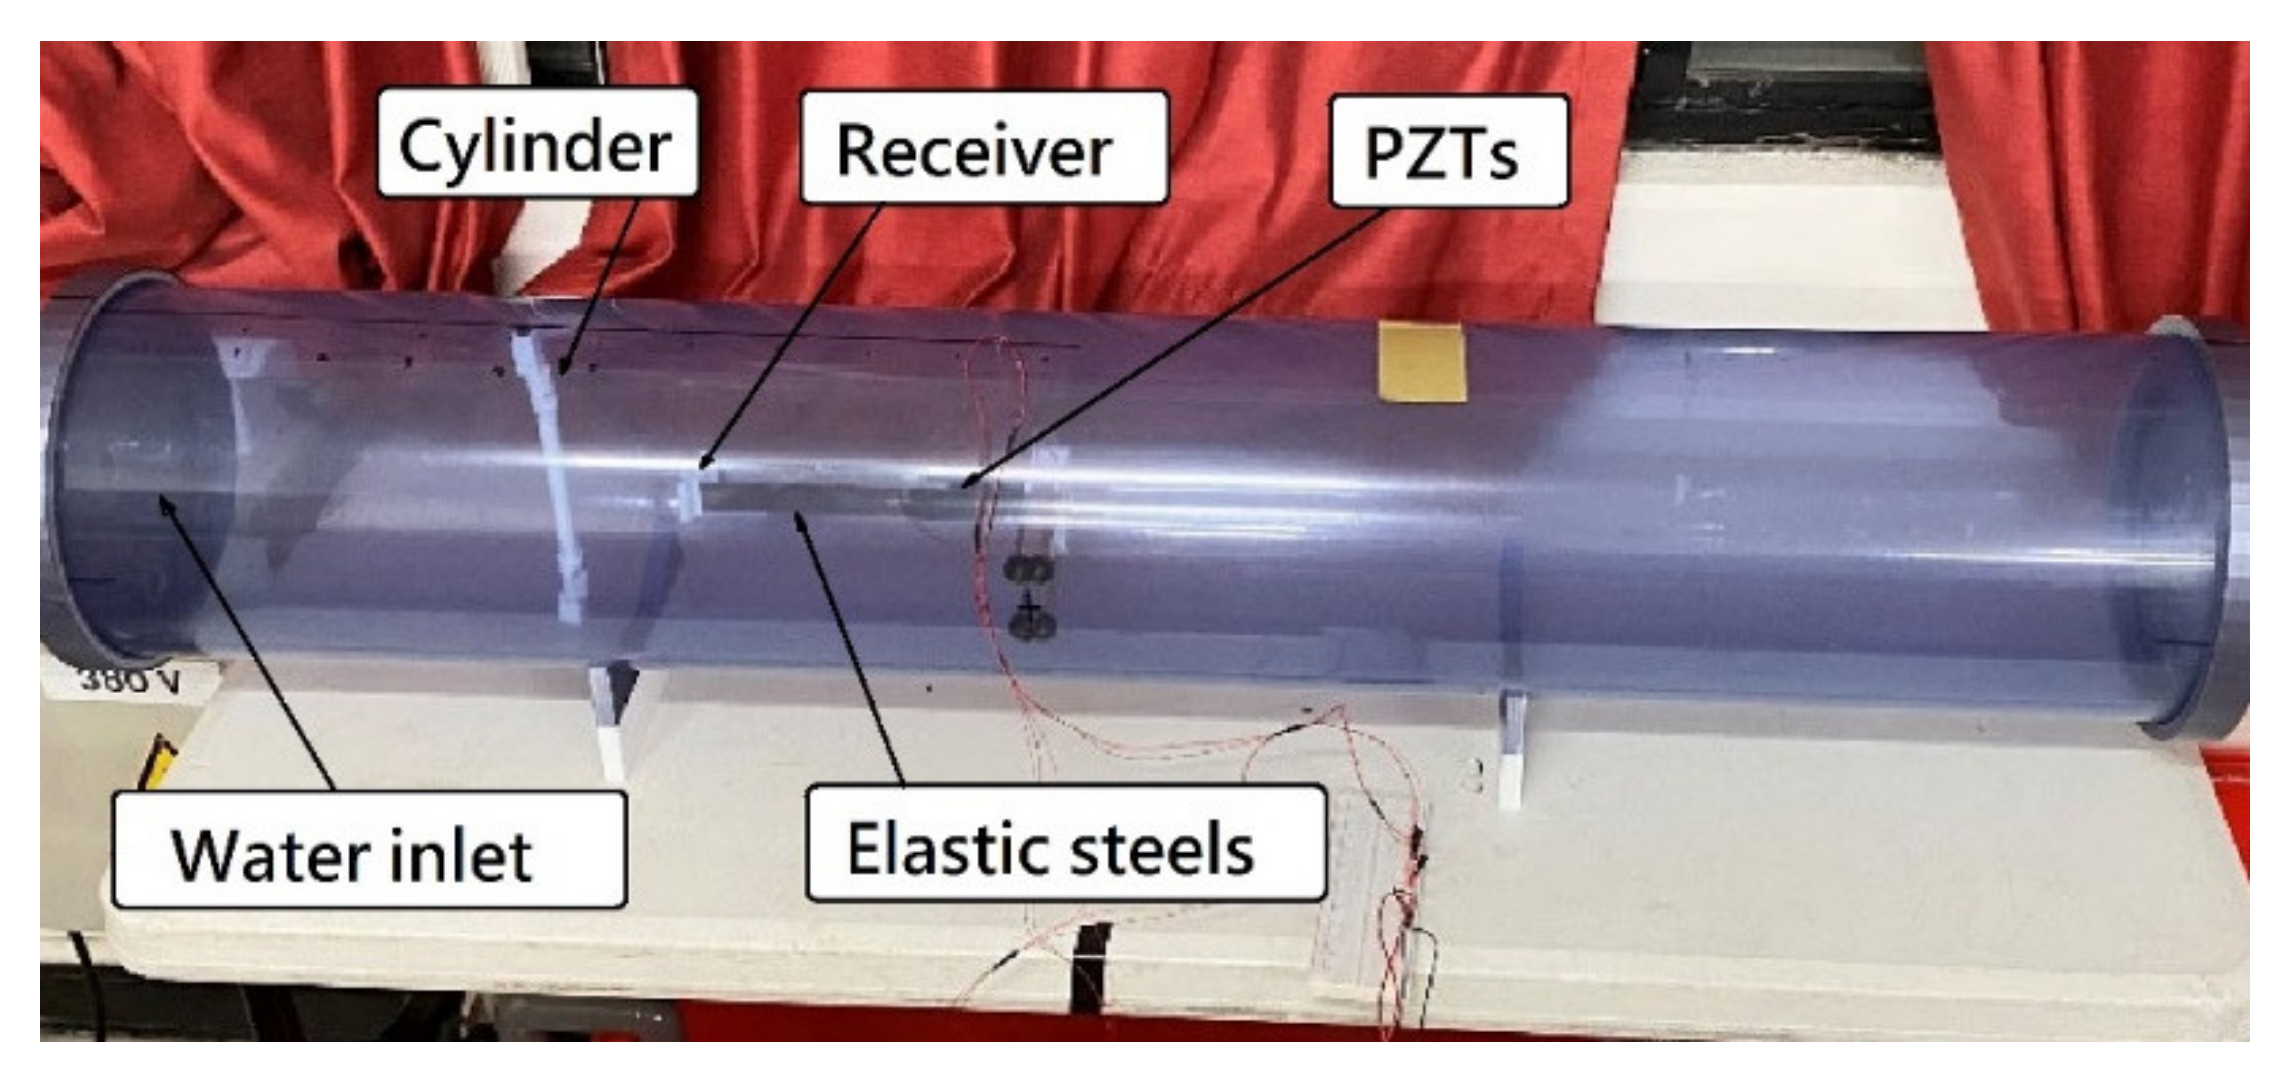
It is confirmed that the vibration scheme of using fluid flow to drive ESS is feasible by using the ANSYS simulation. The fluid pressure on the receivers and the vibration amplitudes of the ESSs of Cases 2 and 3 are greater than those of Case 1, and then the experimental setup is carried out. We achieved the purpose of circulating water flow through a constant pressure motor to fix the flow speed as 0.2 m/s, and then made a clear transparent plastic pipe with an inner diameter of 201.7 mm, an outer diameter of 219.1 mm, and a length of 1500 mm, respectively. The experimental setup of this study is shown in Figure 9.
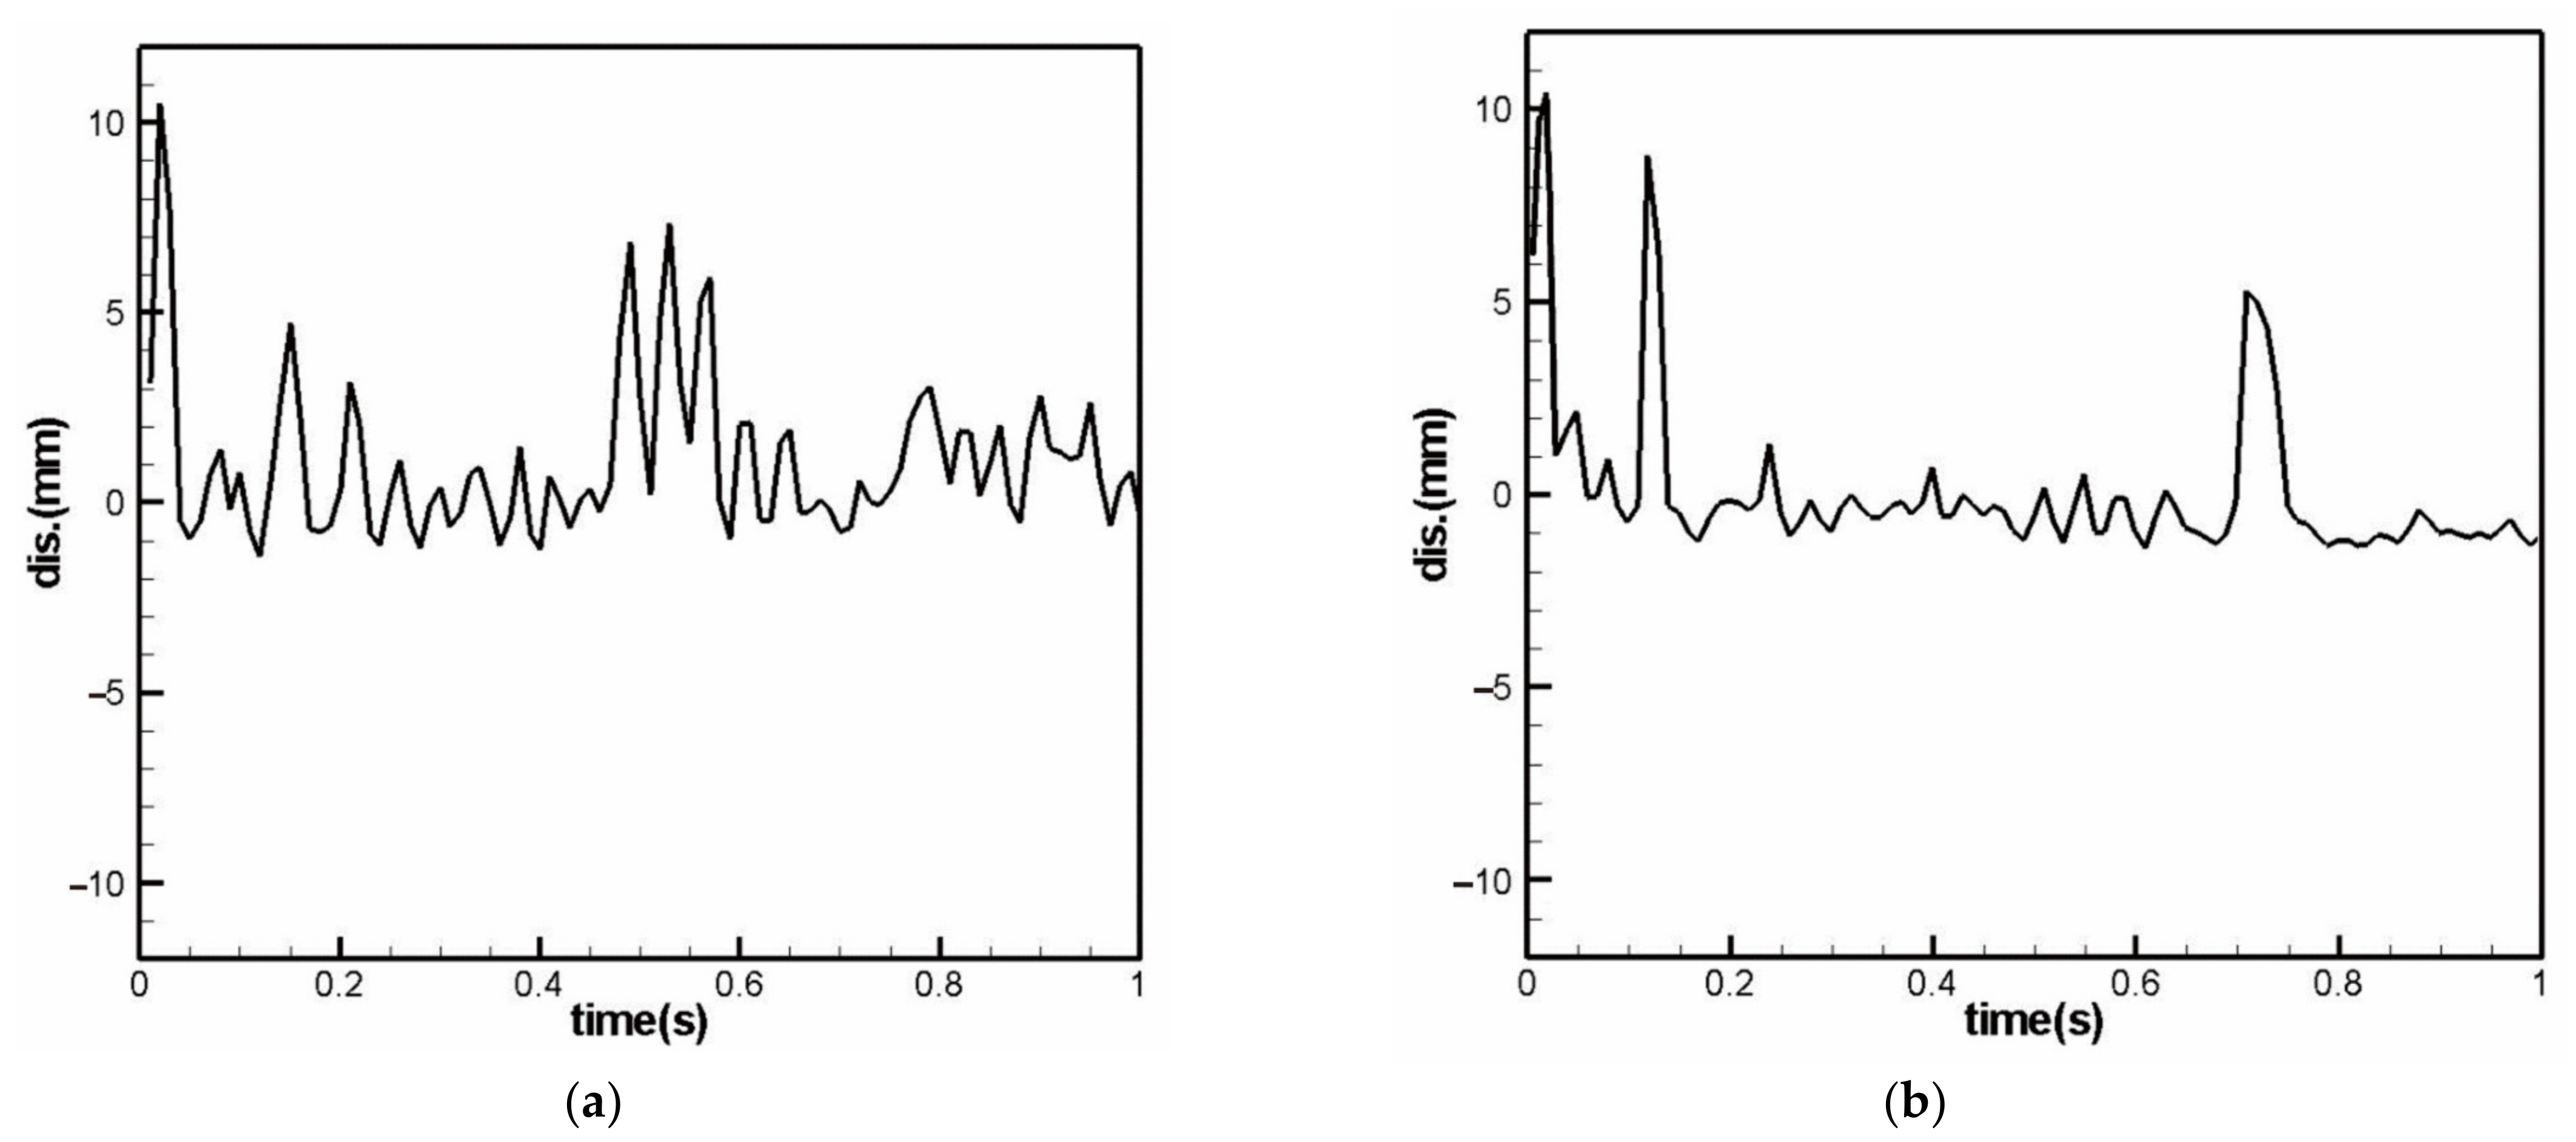
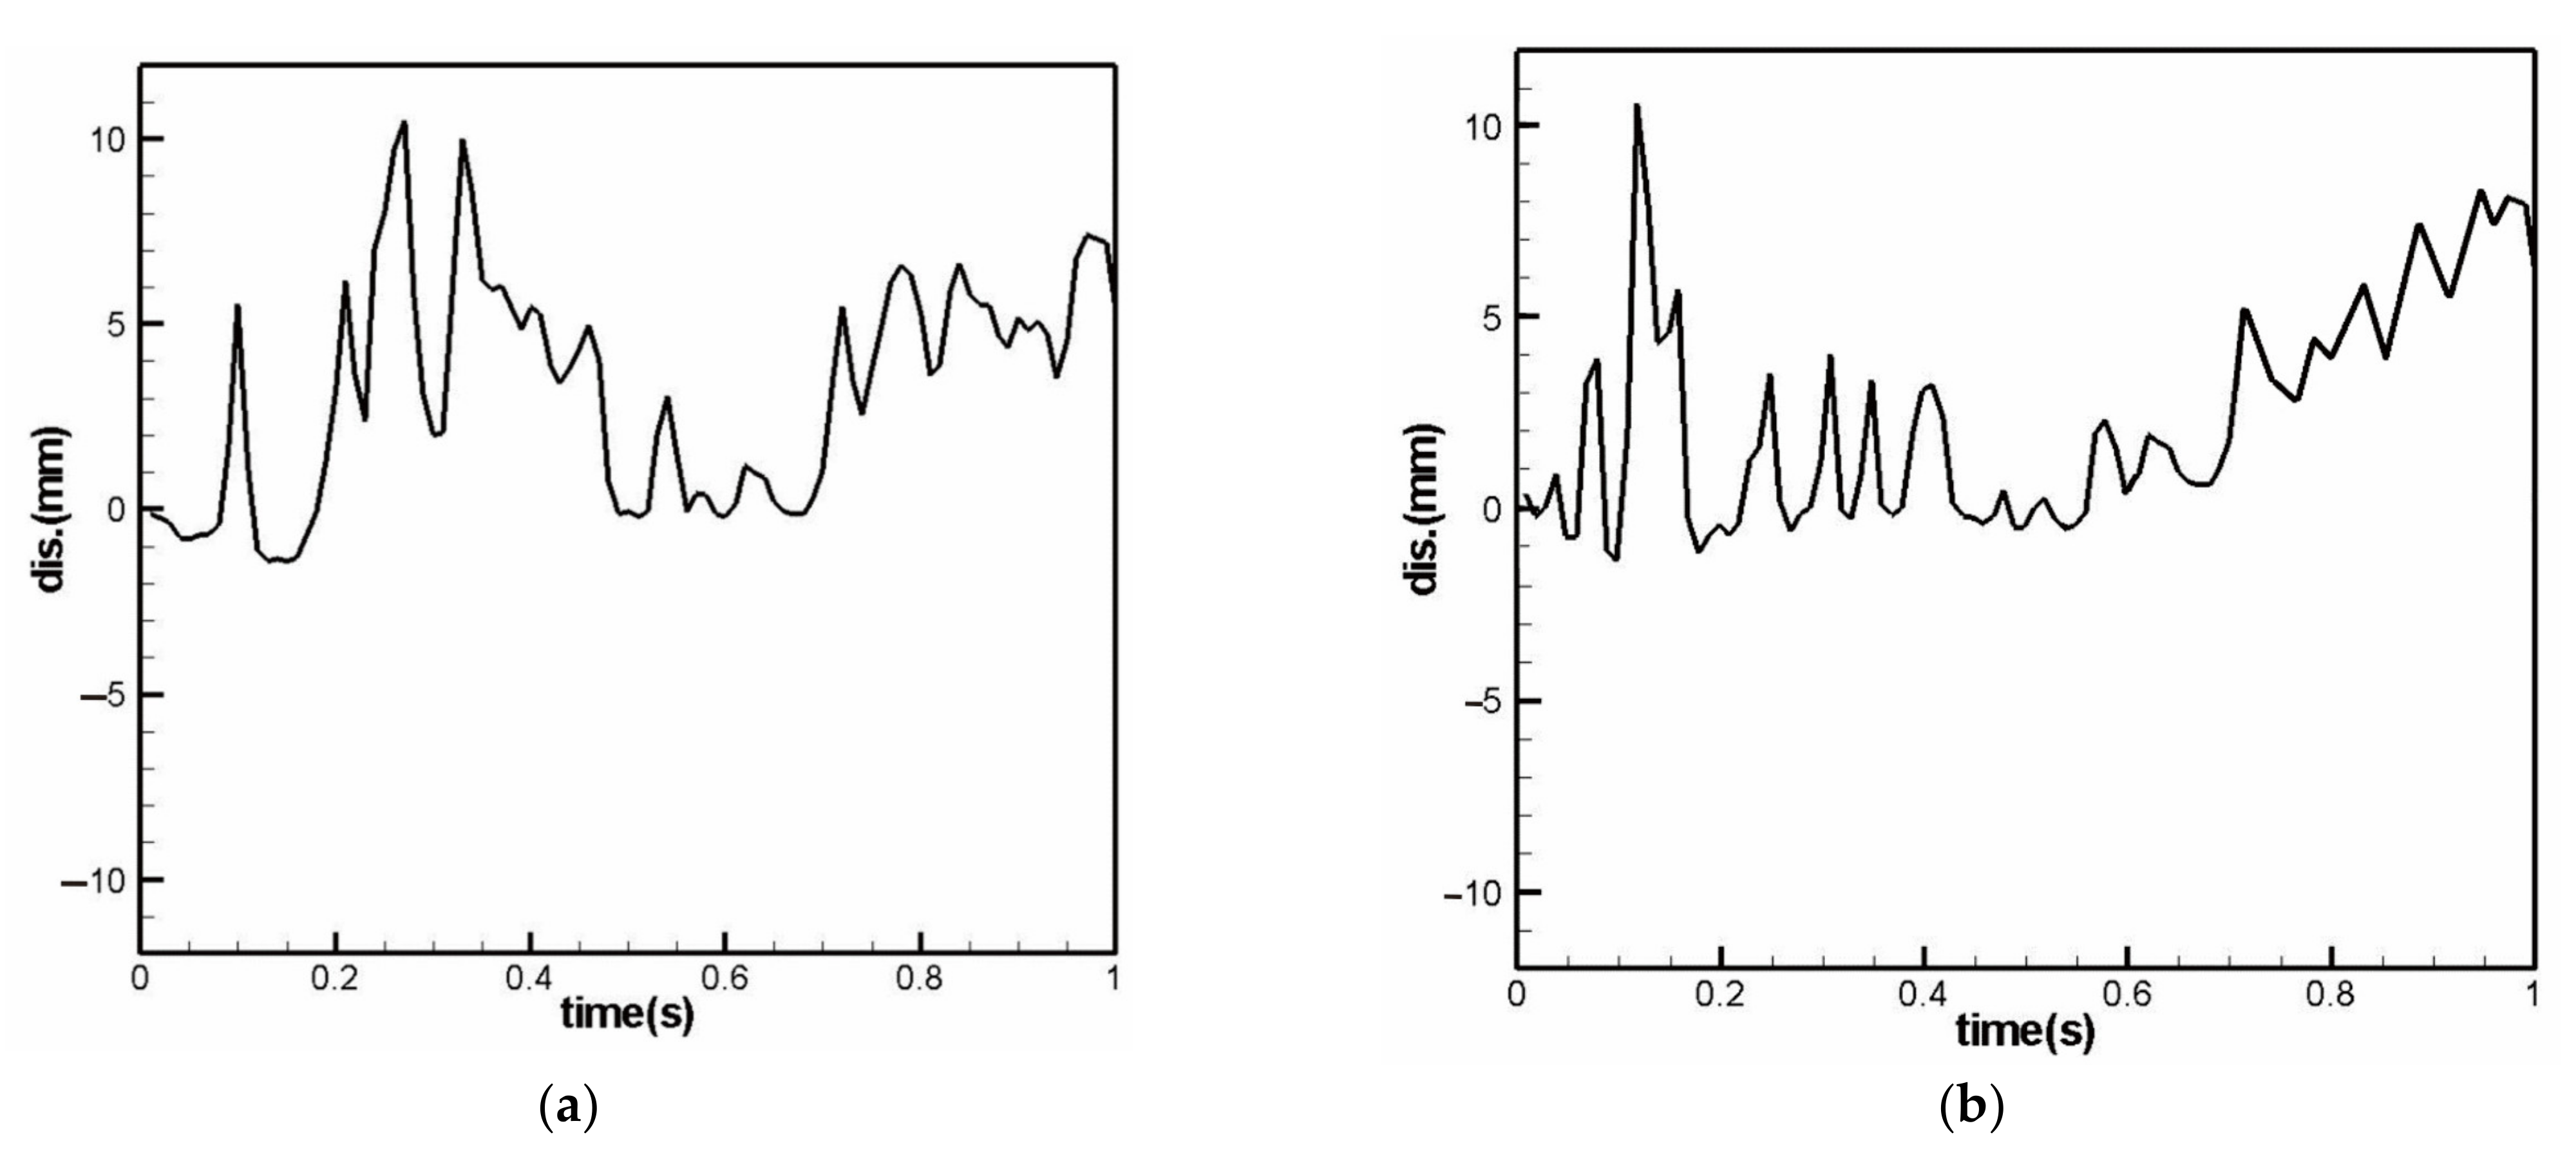
Because the magnitude of the ESS amplitude directly affects the value of the output voltage, this study will compare the ESS amplitude simulated by ANSYS with the amplitude measured experimentally. Figure 10, Figure 11 and Figure 12 present the experimentally measured ESS vibration amplitudes using the laser displacement gauge (LDG) of Cases 1~3 with a flow speed of 0.2 m/s. The laser displacement gauge is the AR700-24 type produced by Acuity CompanyTM (Oregon, USA), which can accurately measure the displacement of 10−5 m. Place the LDG horizontally and align it with Side A (as shown in Figure 1c, Figure 2c and Figure 3c). At the same time, place the other LDG horizontally and align it with Side B (as shown in Figure 1c, Figure 2c and Figure 3c) to obtain the amplitude data of the two elastic steel sheets. The data will be sent to the imc© data acquisition system. The imc© is an instrument manufactured by System Access Co., Ltd. (Taipei, Taiwan). The elastic steel sheets’ amplitudes are obtained by the microprocessor built in imc©. A relatively small time interval is intercepted (1 s) for comparison with the maximum amplitude simulated by ANSYS (Figure 8a–c). There is a 5% error between the maximum displacement simulated by ANSYS and the experimental result, which is about 0.5 mm, and is within the allowable error range of our experiment.

3. Energy Harvesting Analysis

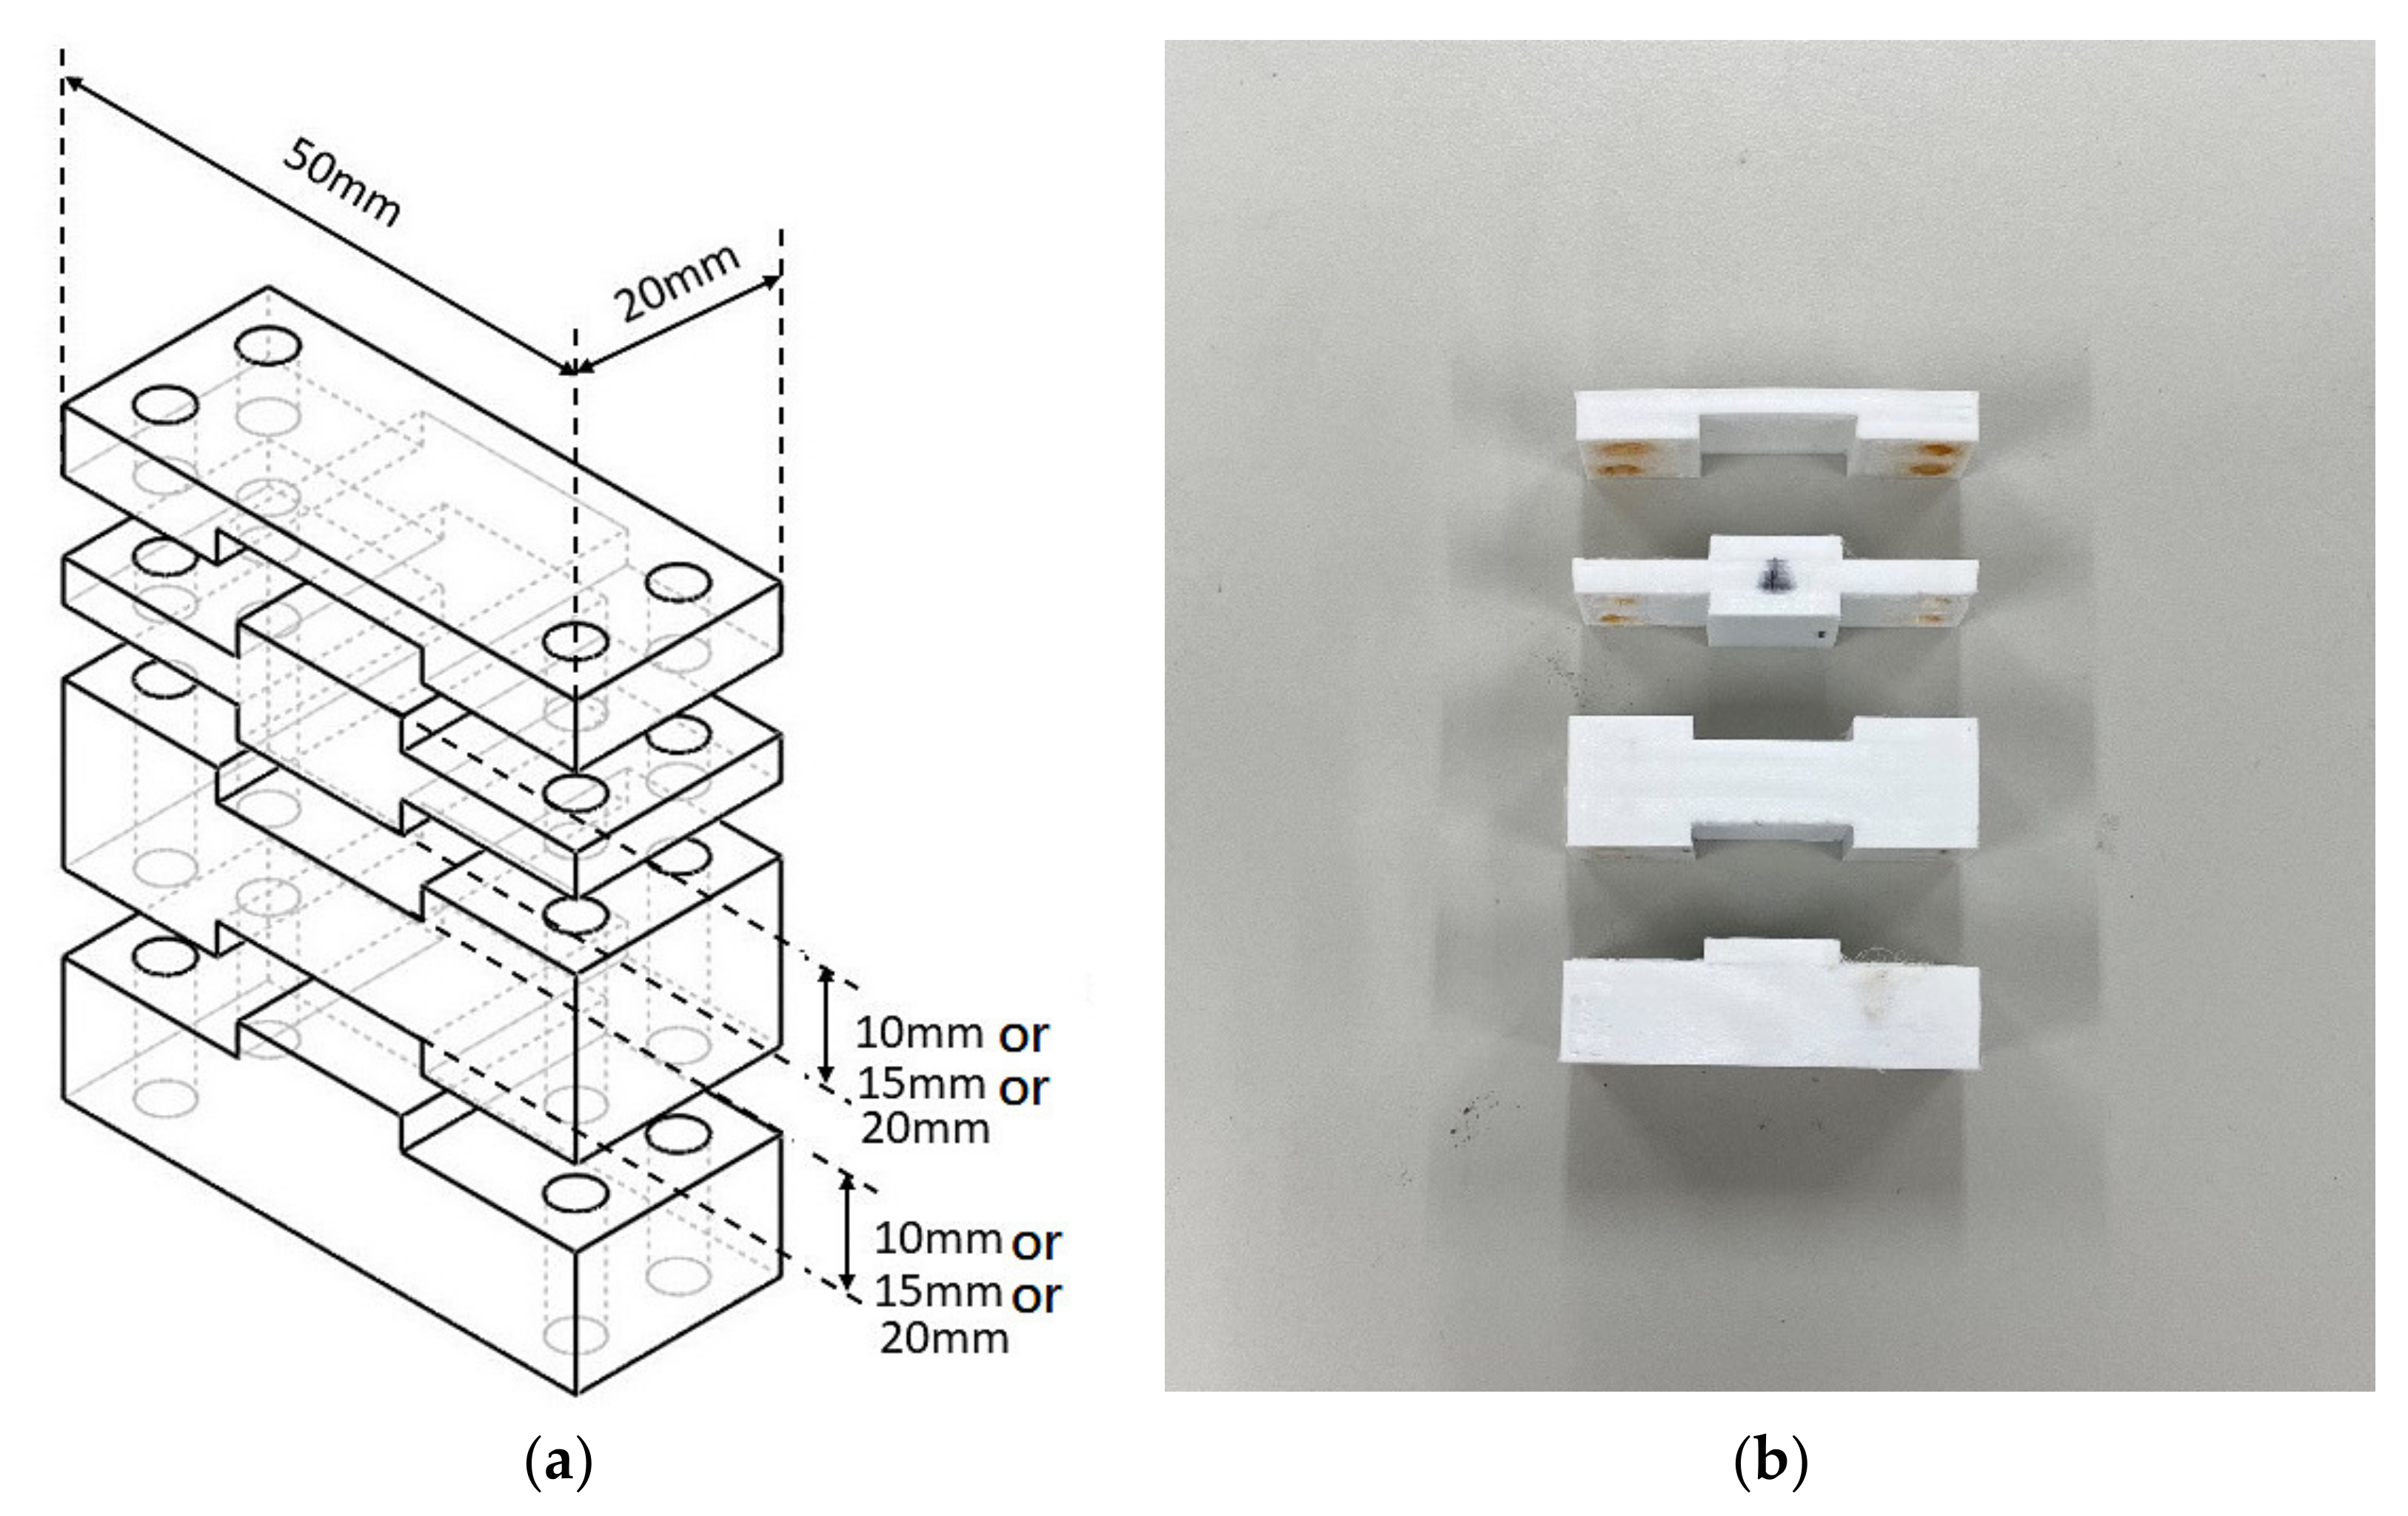
In this experiment, except for metal pillar and elastic steel sheets, other parts are made by the 3D printer, such as the base (see Figure 1a) used to fix the ESS, which contains the distances between various ESSs. The component design diagram is shown in Figure 13a, an example of one of the finished products is shown in Figure 13b. When all the components are assembled, the water is injected into the transparent water pipe. After filling the entire pipe with water, let the water flow continuously in order to measure the amplitude of the ESS and the output voltage of the system. The two elastic steel sheets are connected in parallel. The reason is to provide continuous voltage for the system through the mutual vibration of two elastic steel sheets. Then, change the various parameter combinations and redo the same procedure. The amplitude of the ESS is measured by LDG. The output voltage is measured by imc©. The imc© is an instrument manufactured by System Access Co., Ltd. The instrument has a built-in microprocessor and sensors to measure the voltage generated by the piezoelectric patch. We use imc© to measure the output voltage of this system. The low-pass filter is used to filter noise, and then the voltage waveform is obtained through the Butterworth Filter. In this experiment, the flow speed is set to 0.2 m/s, and the average value of 20 sets of voltages is measured.

3.1. Case 1

In Case 1, we installed piezoelectric patch at the root of ESS. We measured the voltage through the imc©, and installed light-emitting diodes (LED) on the circuit board to easily observe the electric energy generation effect. Table 1 is the parameter setting and measurement data, Figure 1c is the variable setting diagram, and Figure 14a,b are the voltage diagrams of Samples 5 and 6 measured by Case 1, respectively.
It is noted that at the beginning of the experiment in this study, the PZT produced by Superex TechnologyTM was first used with the dimension of 40 × 20 × 0.6 mm. After several experiments, the effect was not satisfied. For the experiment of Case 1, the output voltage is 0.26 voltage for L1 = 100 mm, L2 = 20 mm. We believe it should be possible to further improve the benefits of PZT. Therefore, we used the same material, but longer PZT, and its dimension is 60 × 20 × 0.6 mm. In the end, its manifest effect is as shown in this experiment (see Table 1). The focus of this study is to verify the feasibility of the design concept proposed in this present work. After replacing the longer PZT, its effect was significantly improved. The reason is that the longer PZT obviously provides more deformation and also increases the voltage output. The experimental data also proved this fact. We believe that these findings can provide a reference for other users.

3.2. Case 2

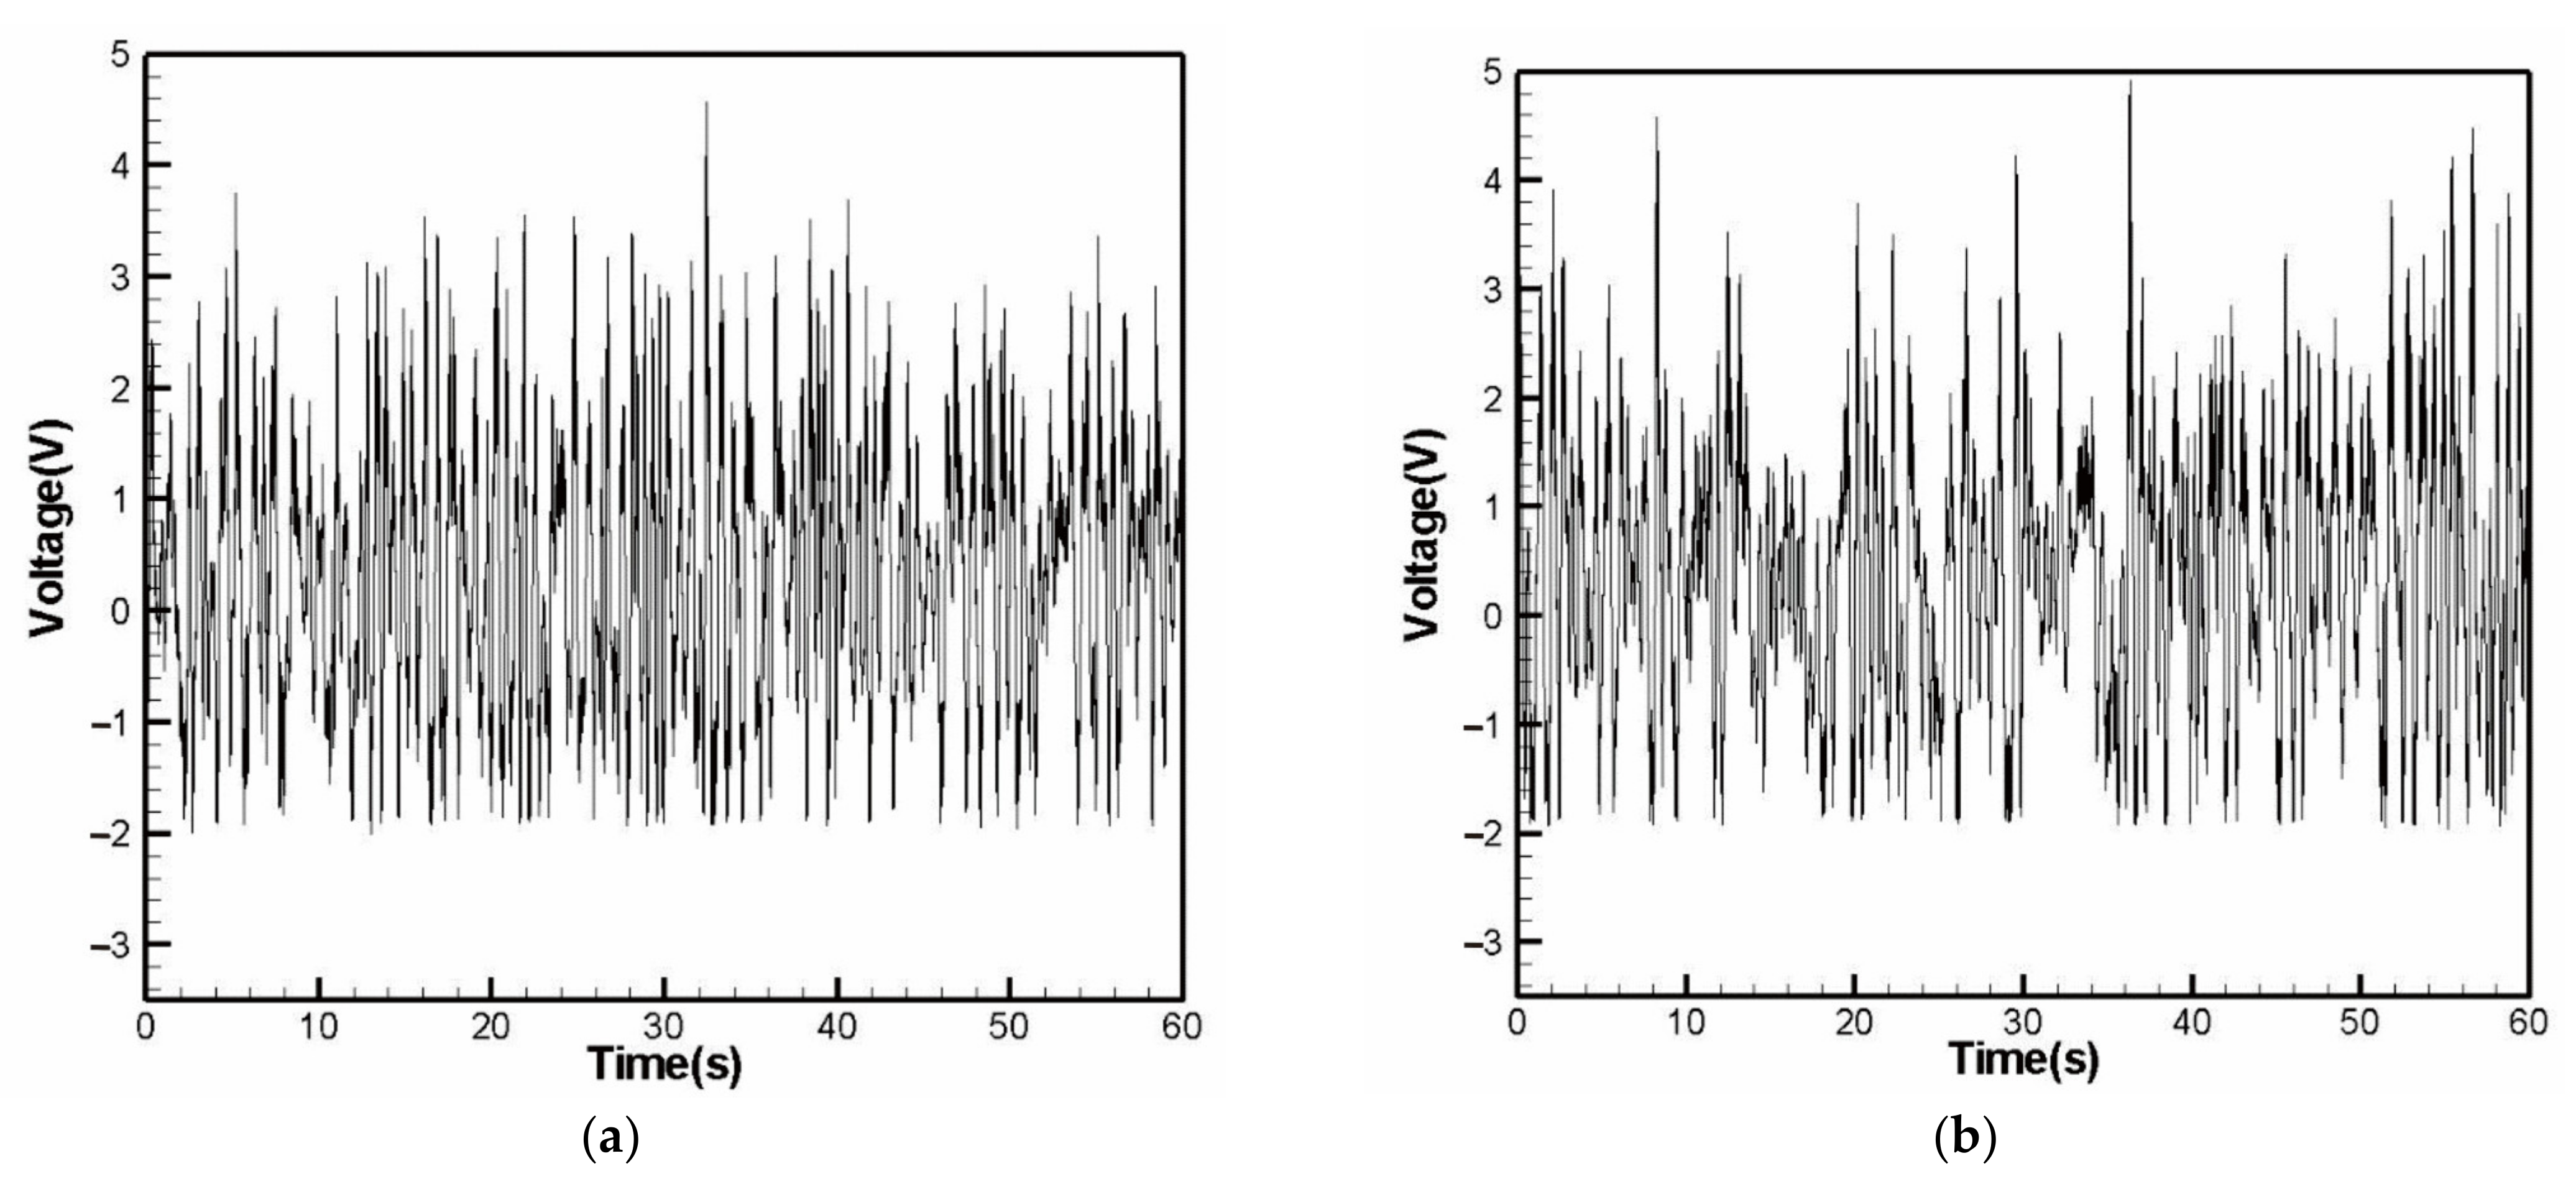
In Case 2, we designed a semi-circular receiver and placed it on the front edge of the free end of the ESS. After the fluid flows through the receiver, it will cause different pressures on different sides of the ESS, and this pressure difference can cause the ESS to vibrate. Table 2 is the table of parameter setting and measurement data, Figure 2c is the variable setting diagram, and Figure 15a,b are the voltage diagrams of Samples 13 and 14 measured by Case 2. From the experiments, we can see that the swing frequency of each combination of Case 2 is more frequent than that of Case 1. It can also be seen from the voltage data measured by imc© that most of the data show an increasing trend, which means that the effect of Case 2 with the addition of the receiver is better than that of Case 1.

3.3. Case 3

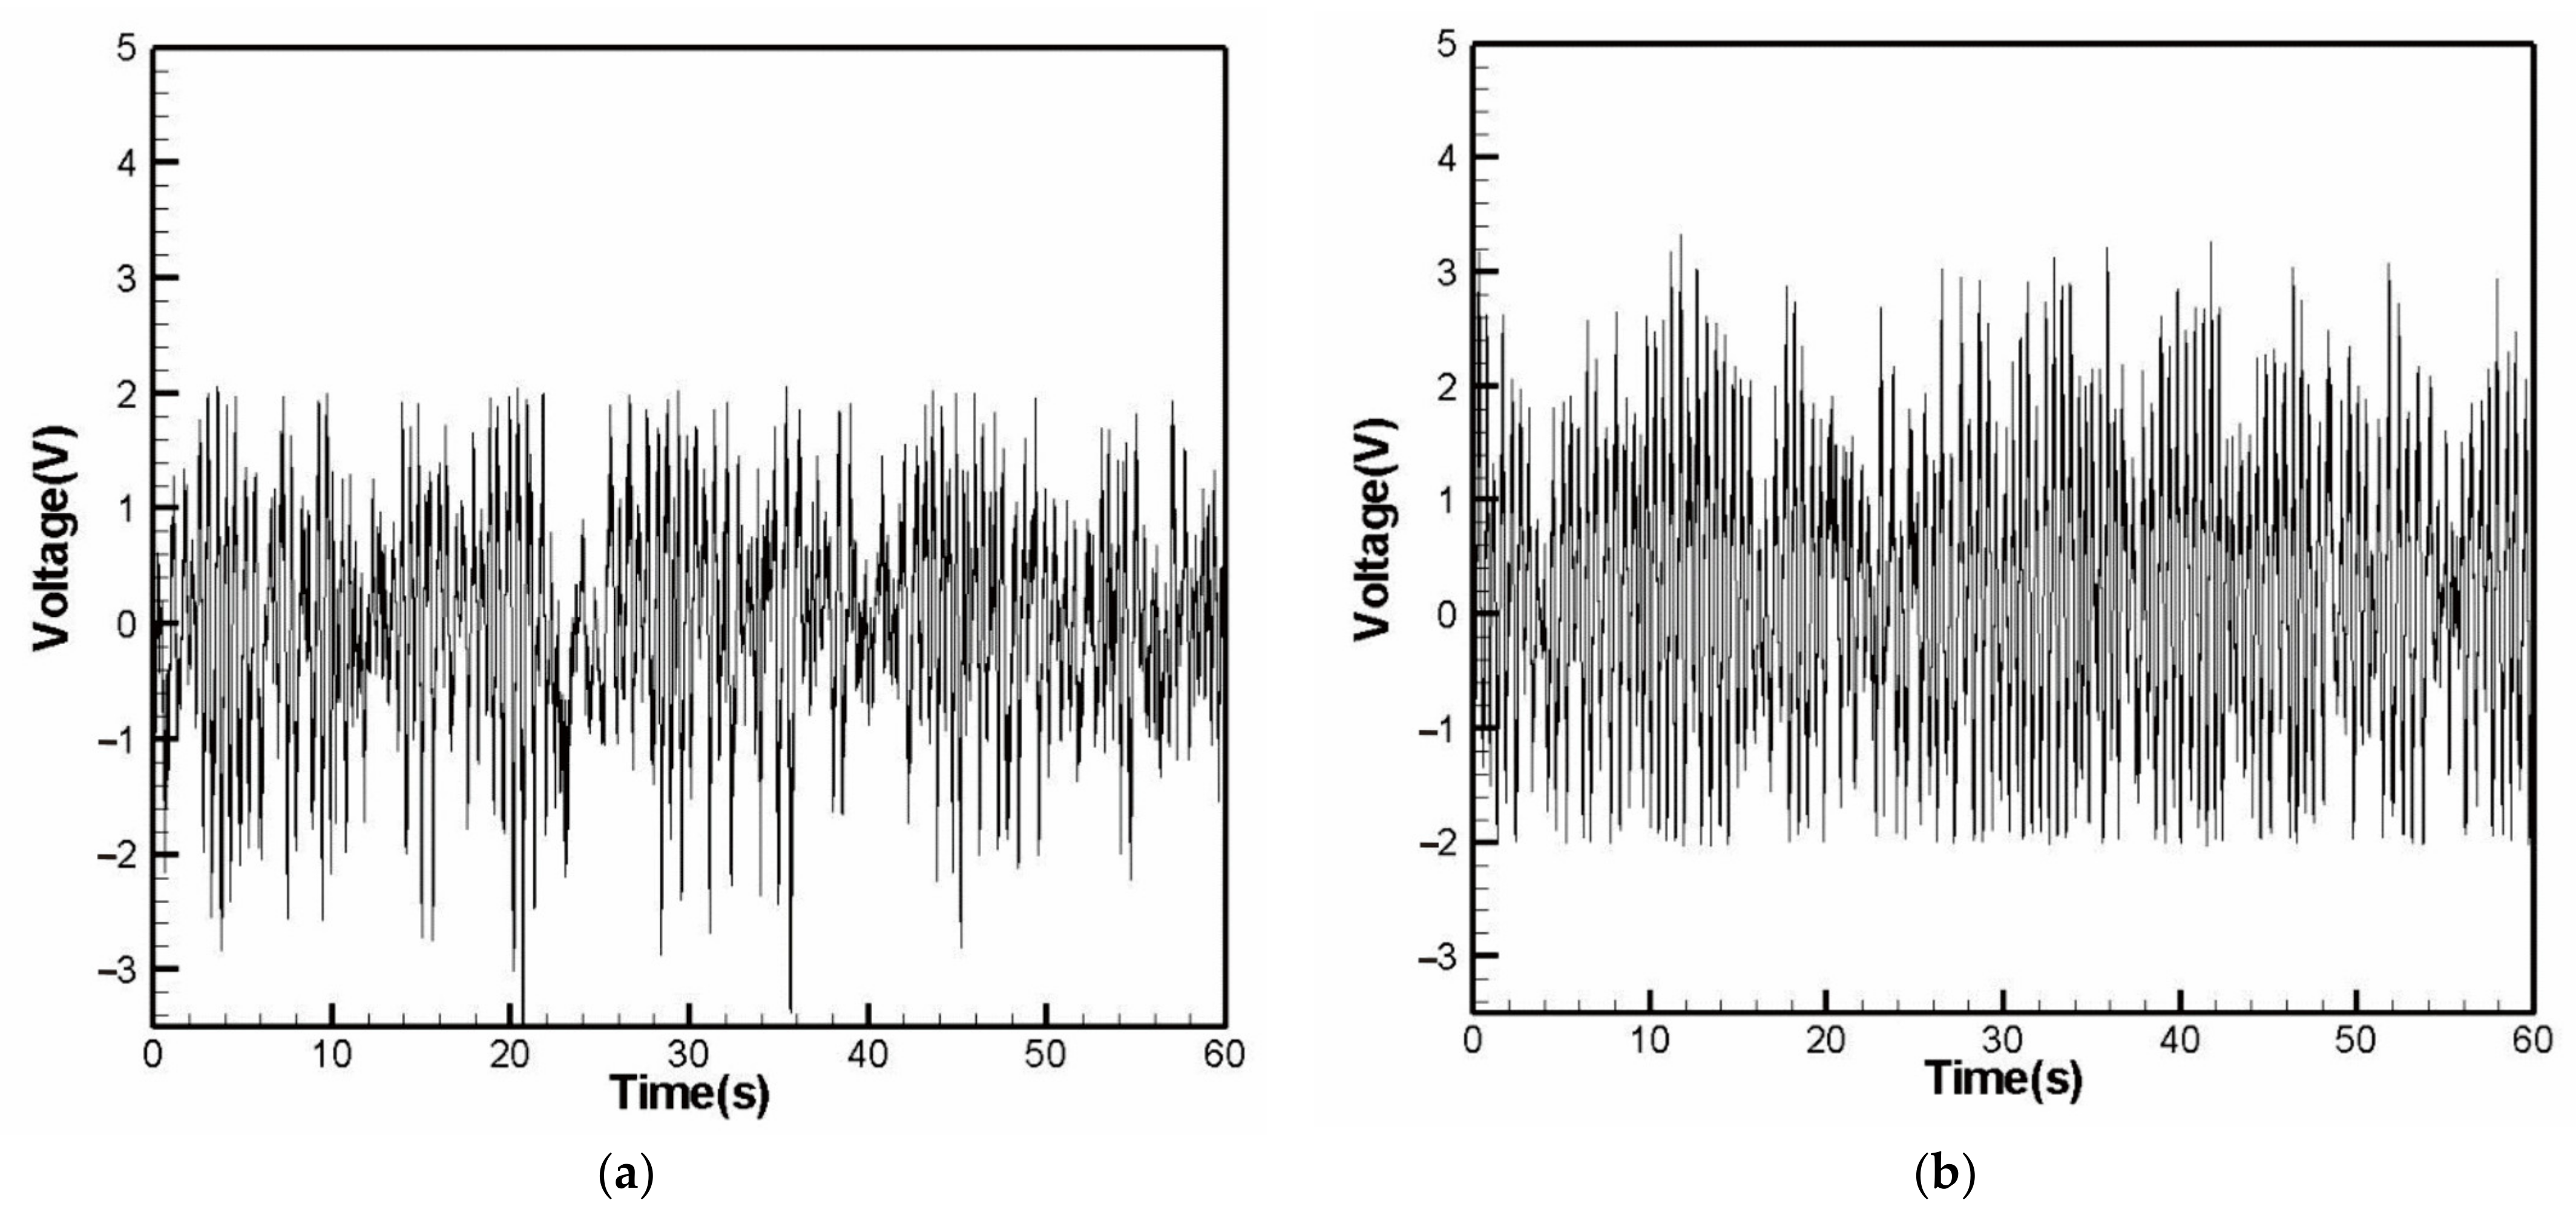
In Case 3, we attempted to increase the instability of the flow field near the receiver of Case 2. For this purpose, this experiment designed a cylinder placed in the pipe in order to generate a downstream vortex. Table 3 is the table of the parameter setting and the measurement data, Figure 3c is the variable setting diagram, and Figure 16a,b are the voltage diagrams of Samples 3 and 4 measured by Case3. When observing the experimental data from Case 3, we found that its maximum vibration amplitude was similar to that of Case 2, but its vibration frequency was significantly higher than that of Case2, and it can be expected that the voltage value measured by imc© will be higher, as shown in Table 3.

4. Results and Discussion

This research completes four tasks: (1) The phenomenon of fluid–structure interaction is simulated with the ANSYS software to confirm the feasibility of this research. In addition, the vibration amplitude of the steel sheet is simulated numerically to verify it with the experiment. (2) The electric energy generation of the double elastic steel model with the PZTs installed in the flow field is set and tested. (3) In order to increase the force on the elastic steel, the receiver is installed at the front of the free end of the elastic steel. (4) In order to make the flow field have more “disturbance”, a cylinder is added in front of the DIF-VEHS. Through the experimental results of the above stages, it is known that the idea of generating electricity by introducing this DIF-VEHS is feasible.
We analyze and discuss the experimental data measured in Section 3, and present the following results:
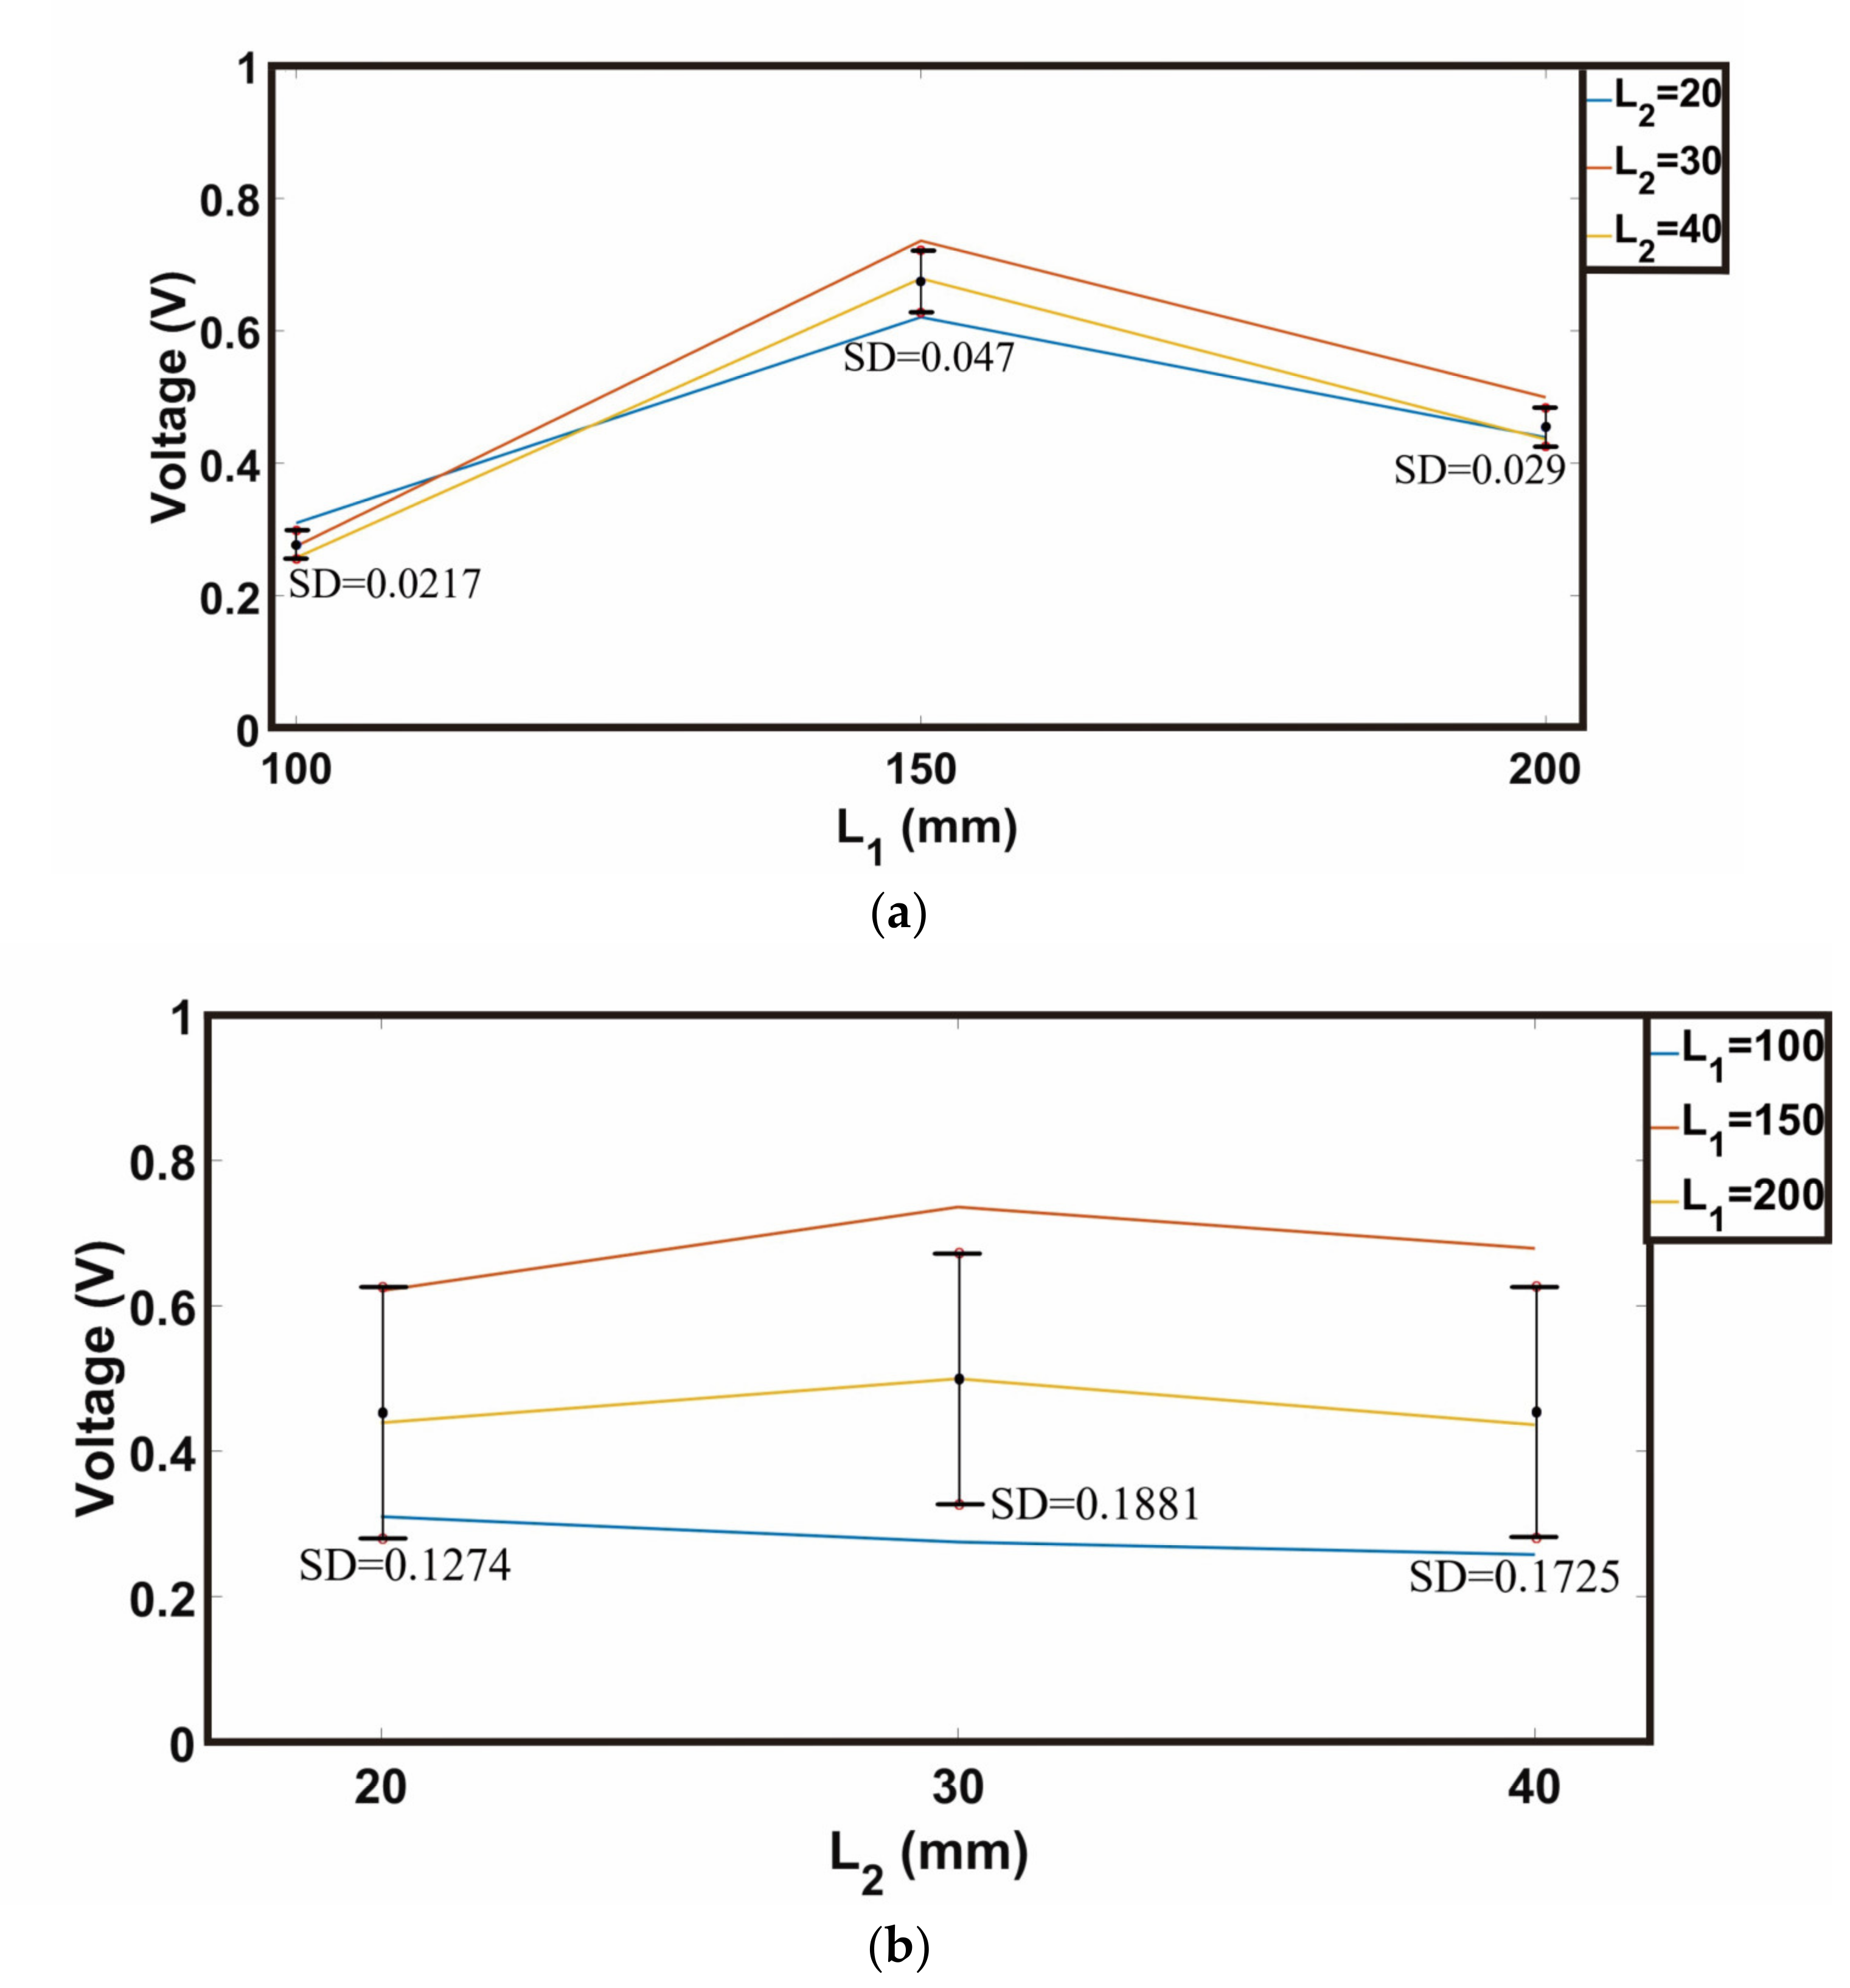
  • Figure 17a and Figure 18a show the effect of elastic steel length (L1). Most elastic steels have the highest voltage generation at a length of 150 mm, followed by 200 mm and the worst at 100 mm. The reason is that proper elasticity is required to make the object rebound after being stressed, resulting in repeated vibrations. The 150 mm elastic steel has both proper elasticity and stiffness in this experimental environment. After being deformed by force, it rebounds with its own elasticity, and then deforms again after being subjected to force. Repeatedly, the vibration frequency of 150 mm ESS is higher than those of 100 mm and 200 mm ESSs, so the voltage generation is also higher. The ESS with a length of 100 mm is more rigid, resulting in a small displacement and a lower voltage generation; the ESS with a length of 200 mm is less rigid and cannot rebound immediately, so the voltage generation is also lower.
  • Figure 17b and Figure 18b show the effect of the spacing distance between two ESSs (L2). In this experiment, the distance variable between the two elastic steels does not have a significant impact on the experimental results, so it can be seen that the distance is not very important in this condition setting. However, the spacing distance of 30 mm between the two ESSs shows the best voltage generation.
  • Figure 18c shows the effect of the diameter of the receiver (D1). When the diameter of the receiver is larger, the voltage generation increases more obviously, and the vibration amplitude of the ESS is larger than expected. We believe that in addition to the occurrence of this phenomenon, the uneven force of the water flow near the receiver also causes the elastic steel to oscillate after being impacted by water flow.
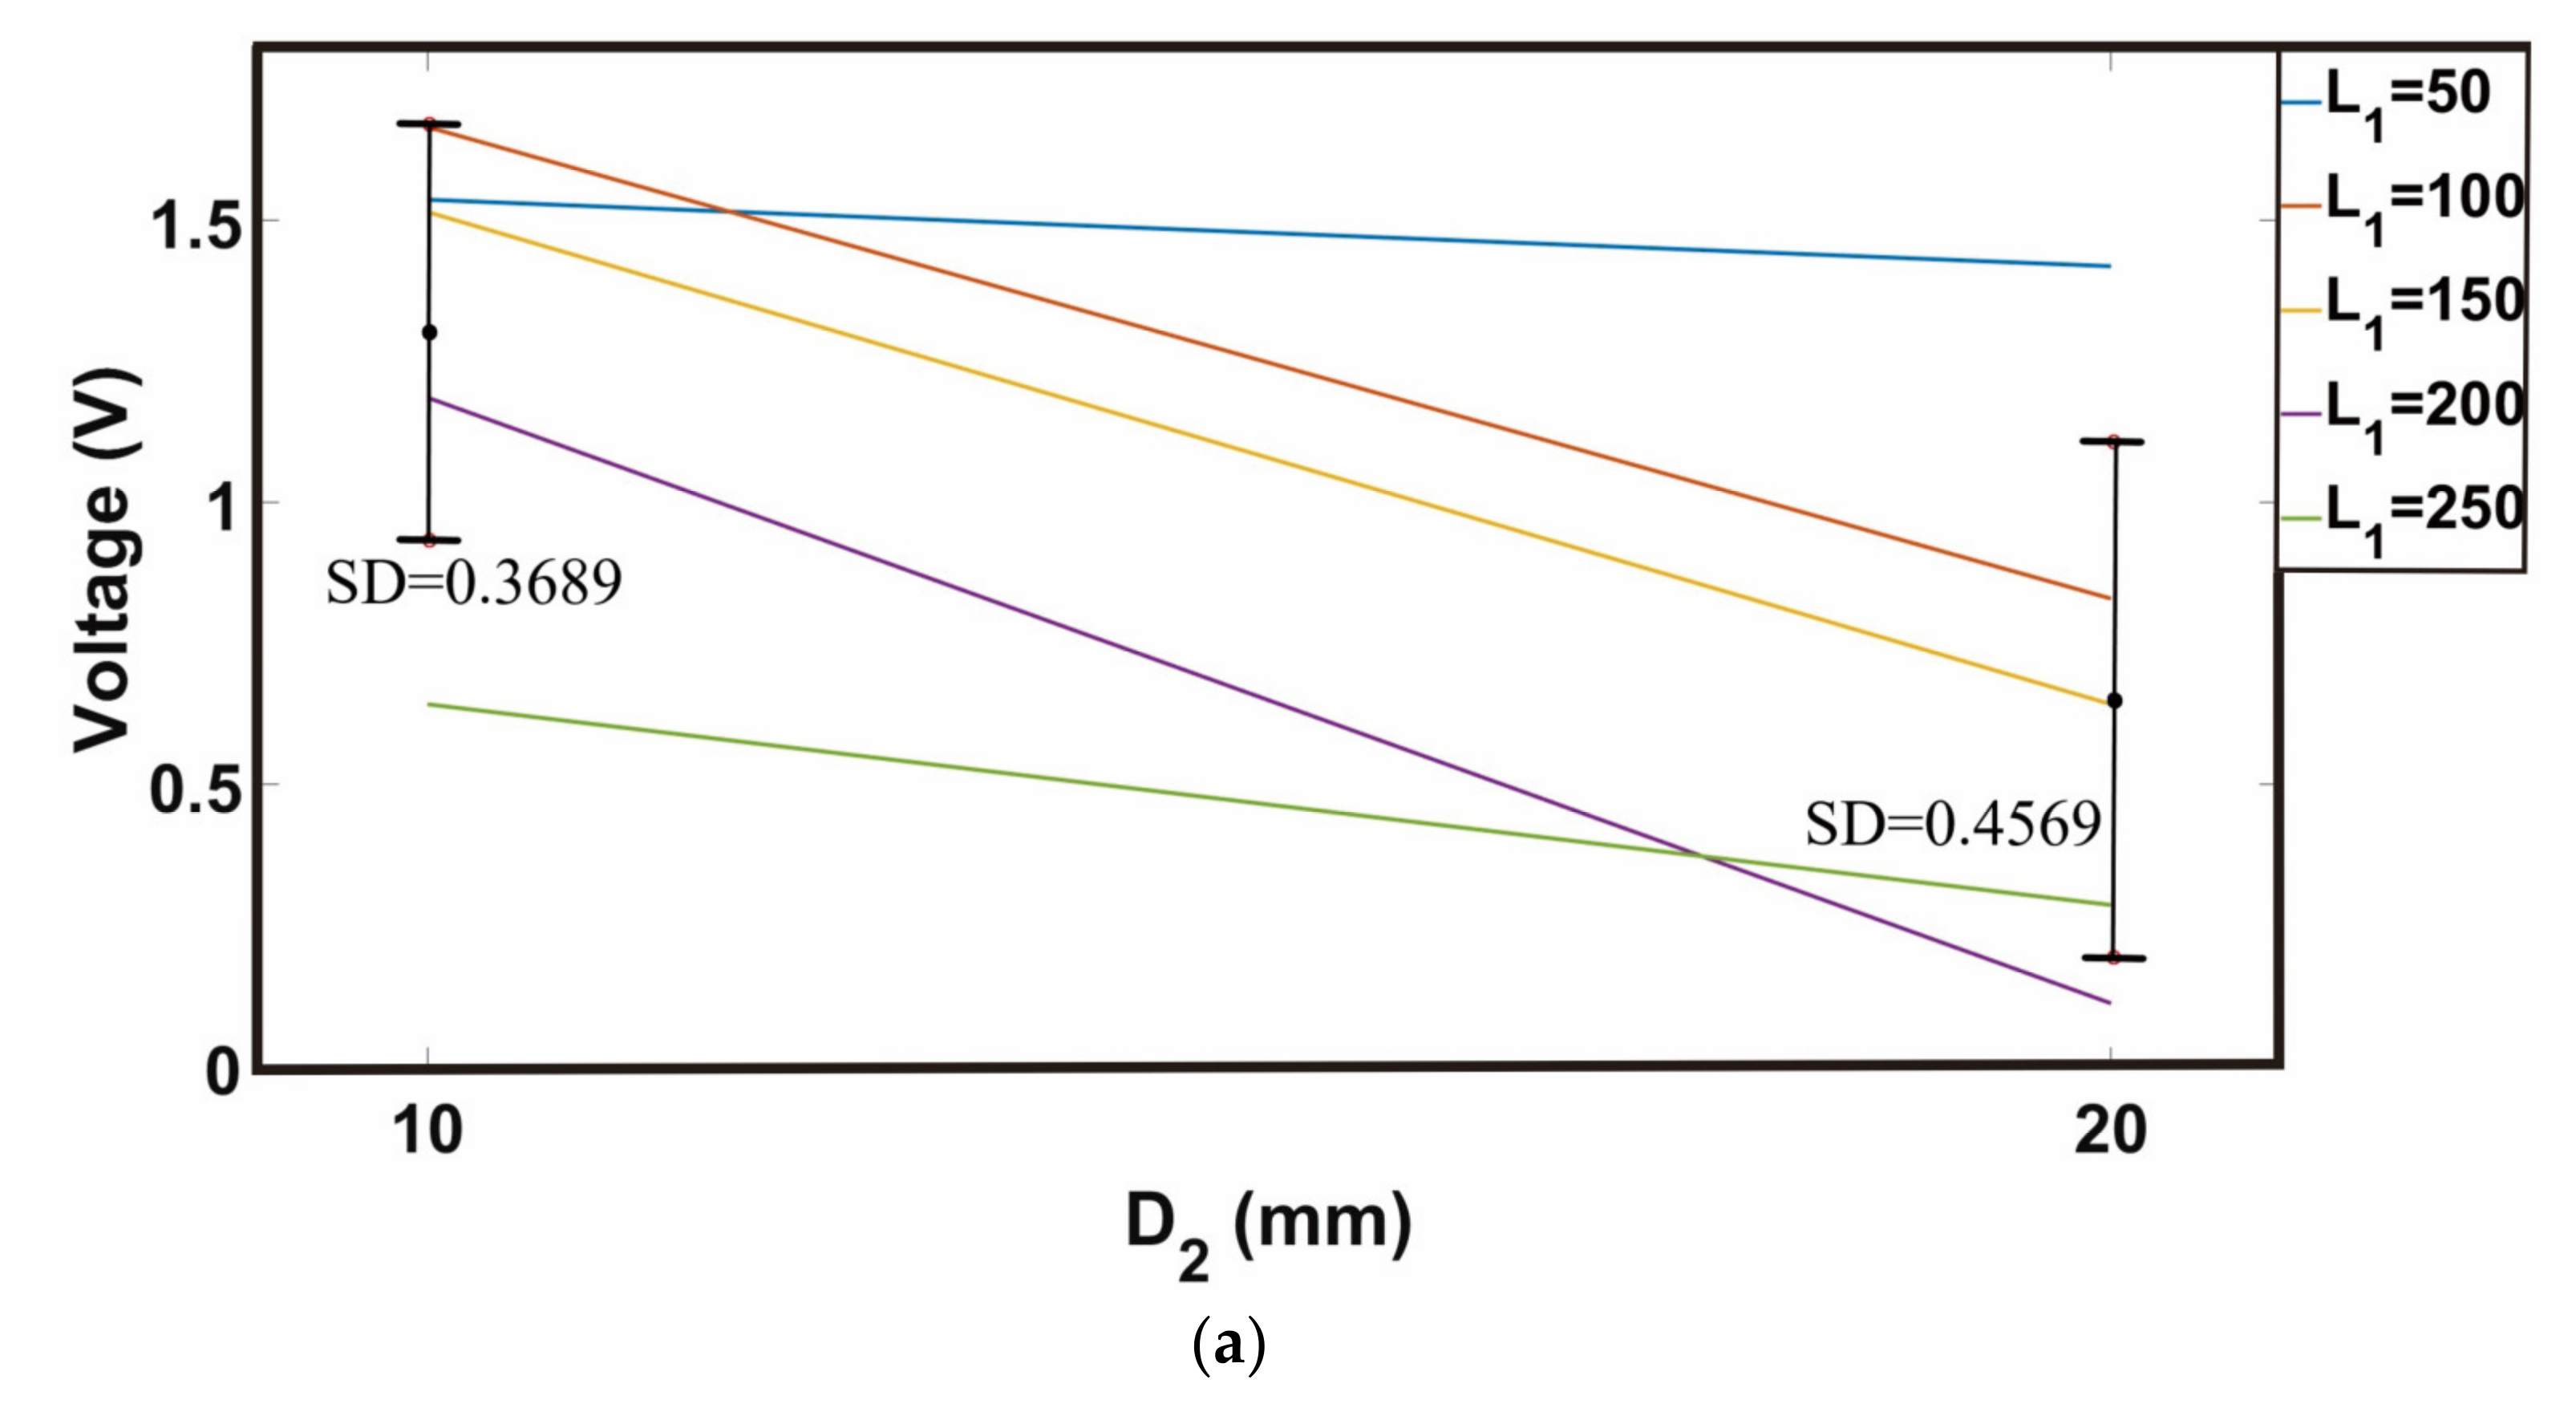
  • Figure 19a shows the effect of cylinder diameter in Case 3 (D2). It can be seen that when the diameter of the cylinder equals 10 mm, it generates more voltage than when the diameter of the cylinder is 20 mm. The reason may be that the cylinder with a diameter of up to 20 mm blocks most of the water flow that will flow to the receiver.
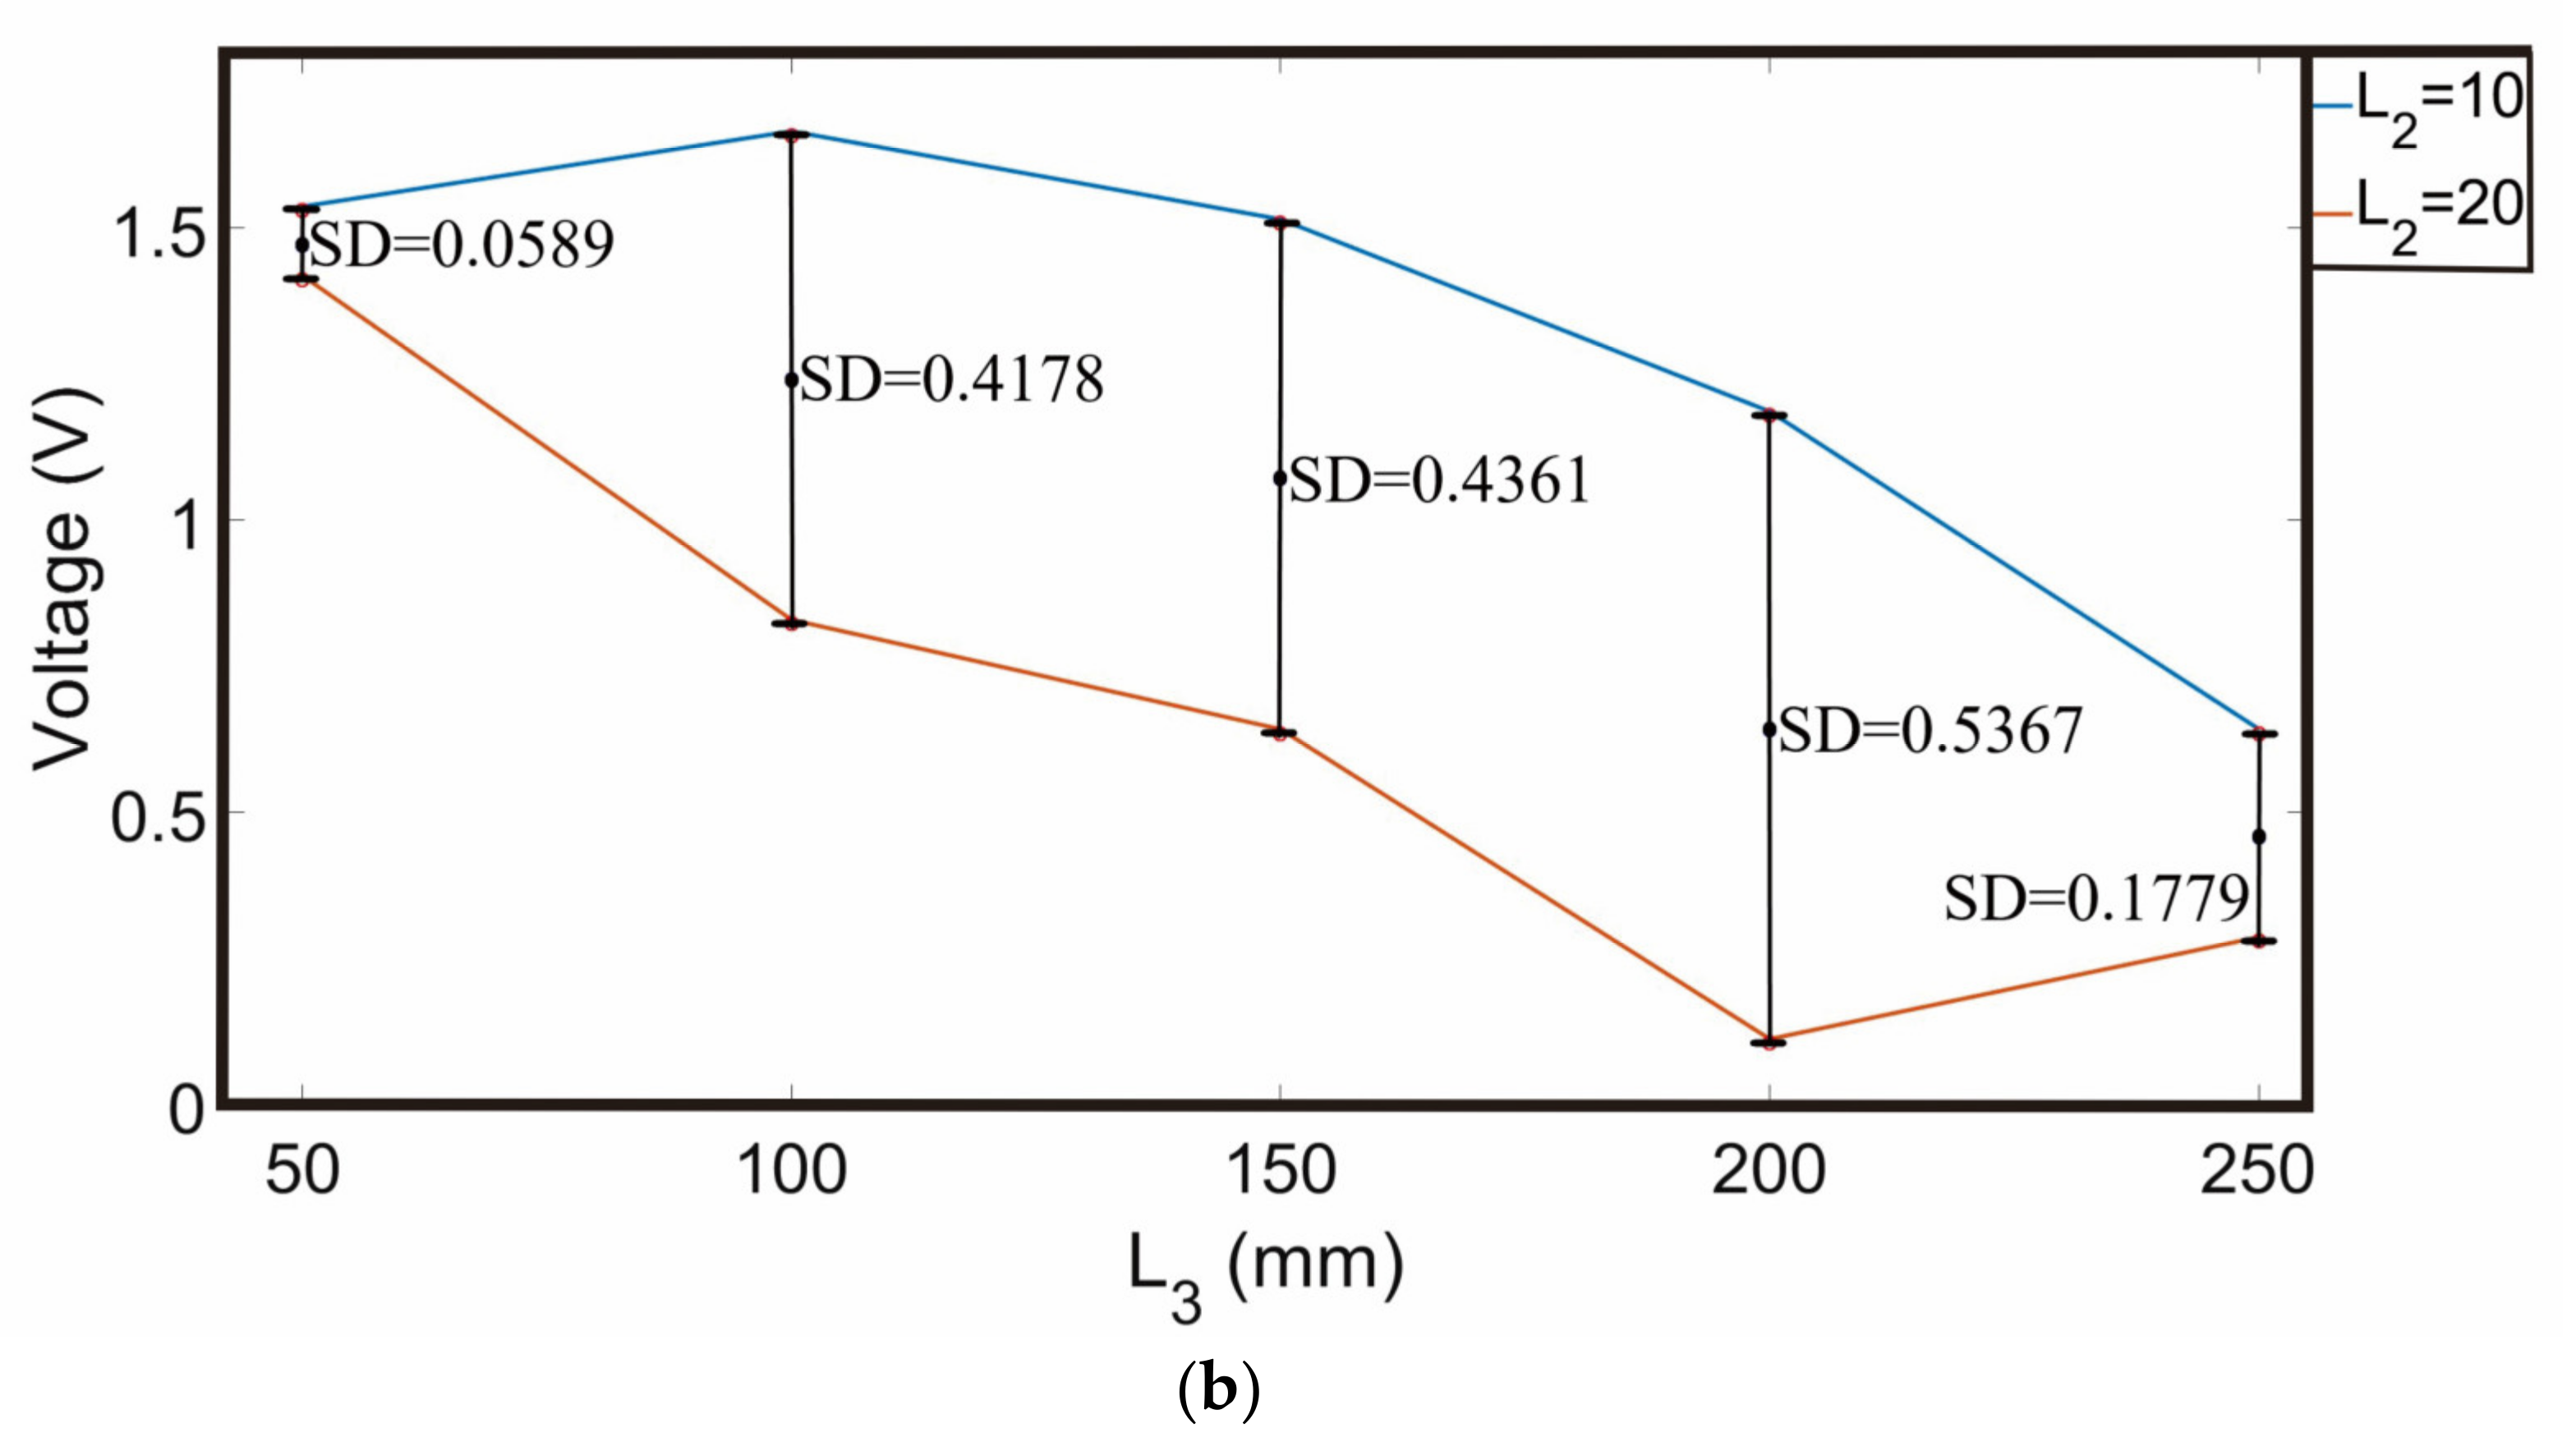
  • Figure 19b shows the effect of the distance between the cylinder and the ESSs (L3). When the cylinder starts to approach the ESSs from 250 mm, the voltage generation increases accordingly, until it reaches a peak when the distance is 100 mm, and when it is closer to 50 mm, the voltage generation decreases. When the distance is 200 mm and 250 mm, the voltage generation effect is not good. It can be explained that when the distance between the cylinder and the elastic steel is small, the water flow directly hits on the receiver, causing it to swing more violently, thus increasing the voltage generation, and if it is too far away, it will be neutralized by the surrounding water flow.
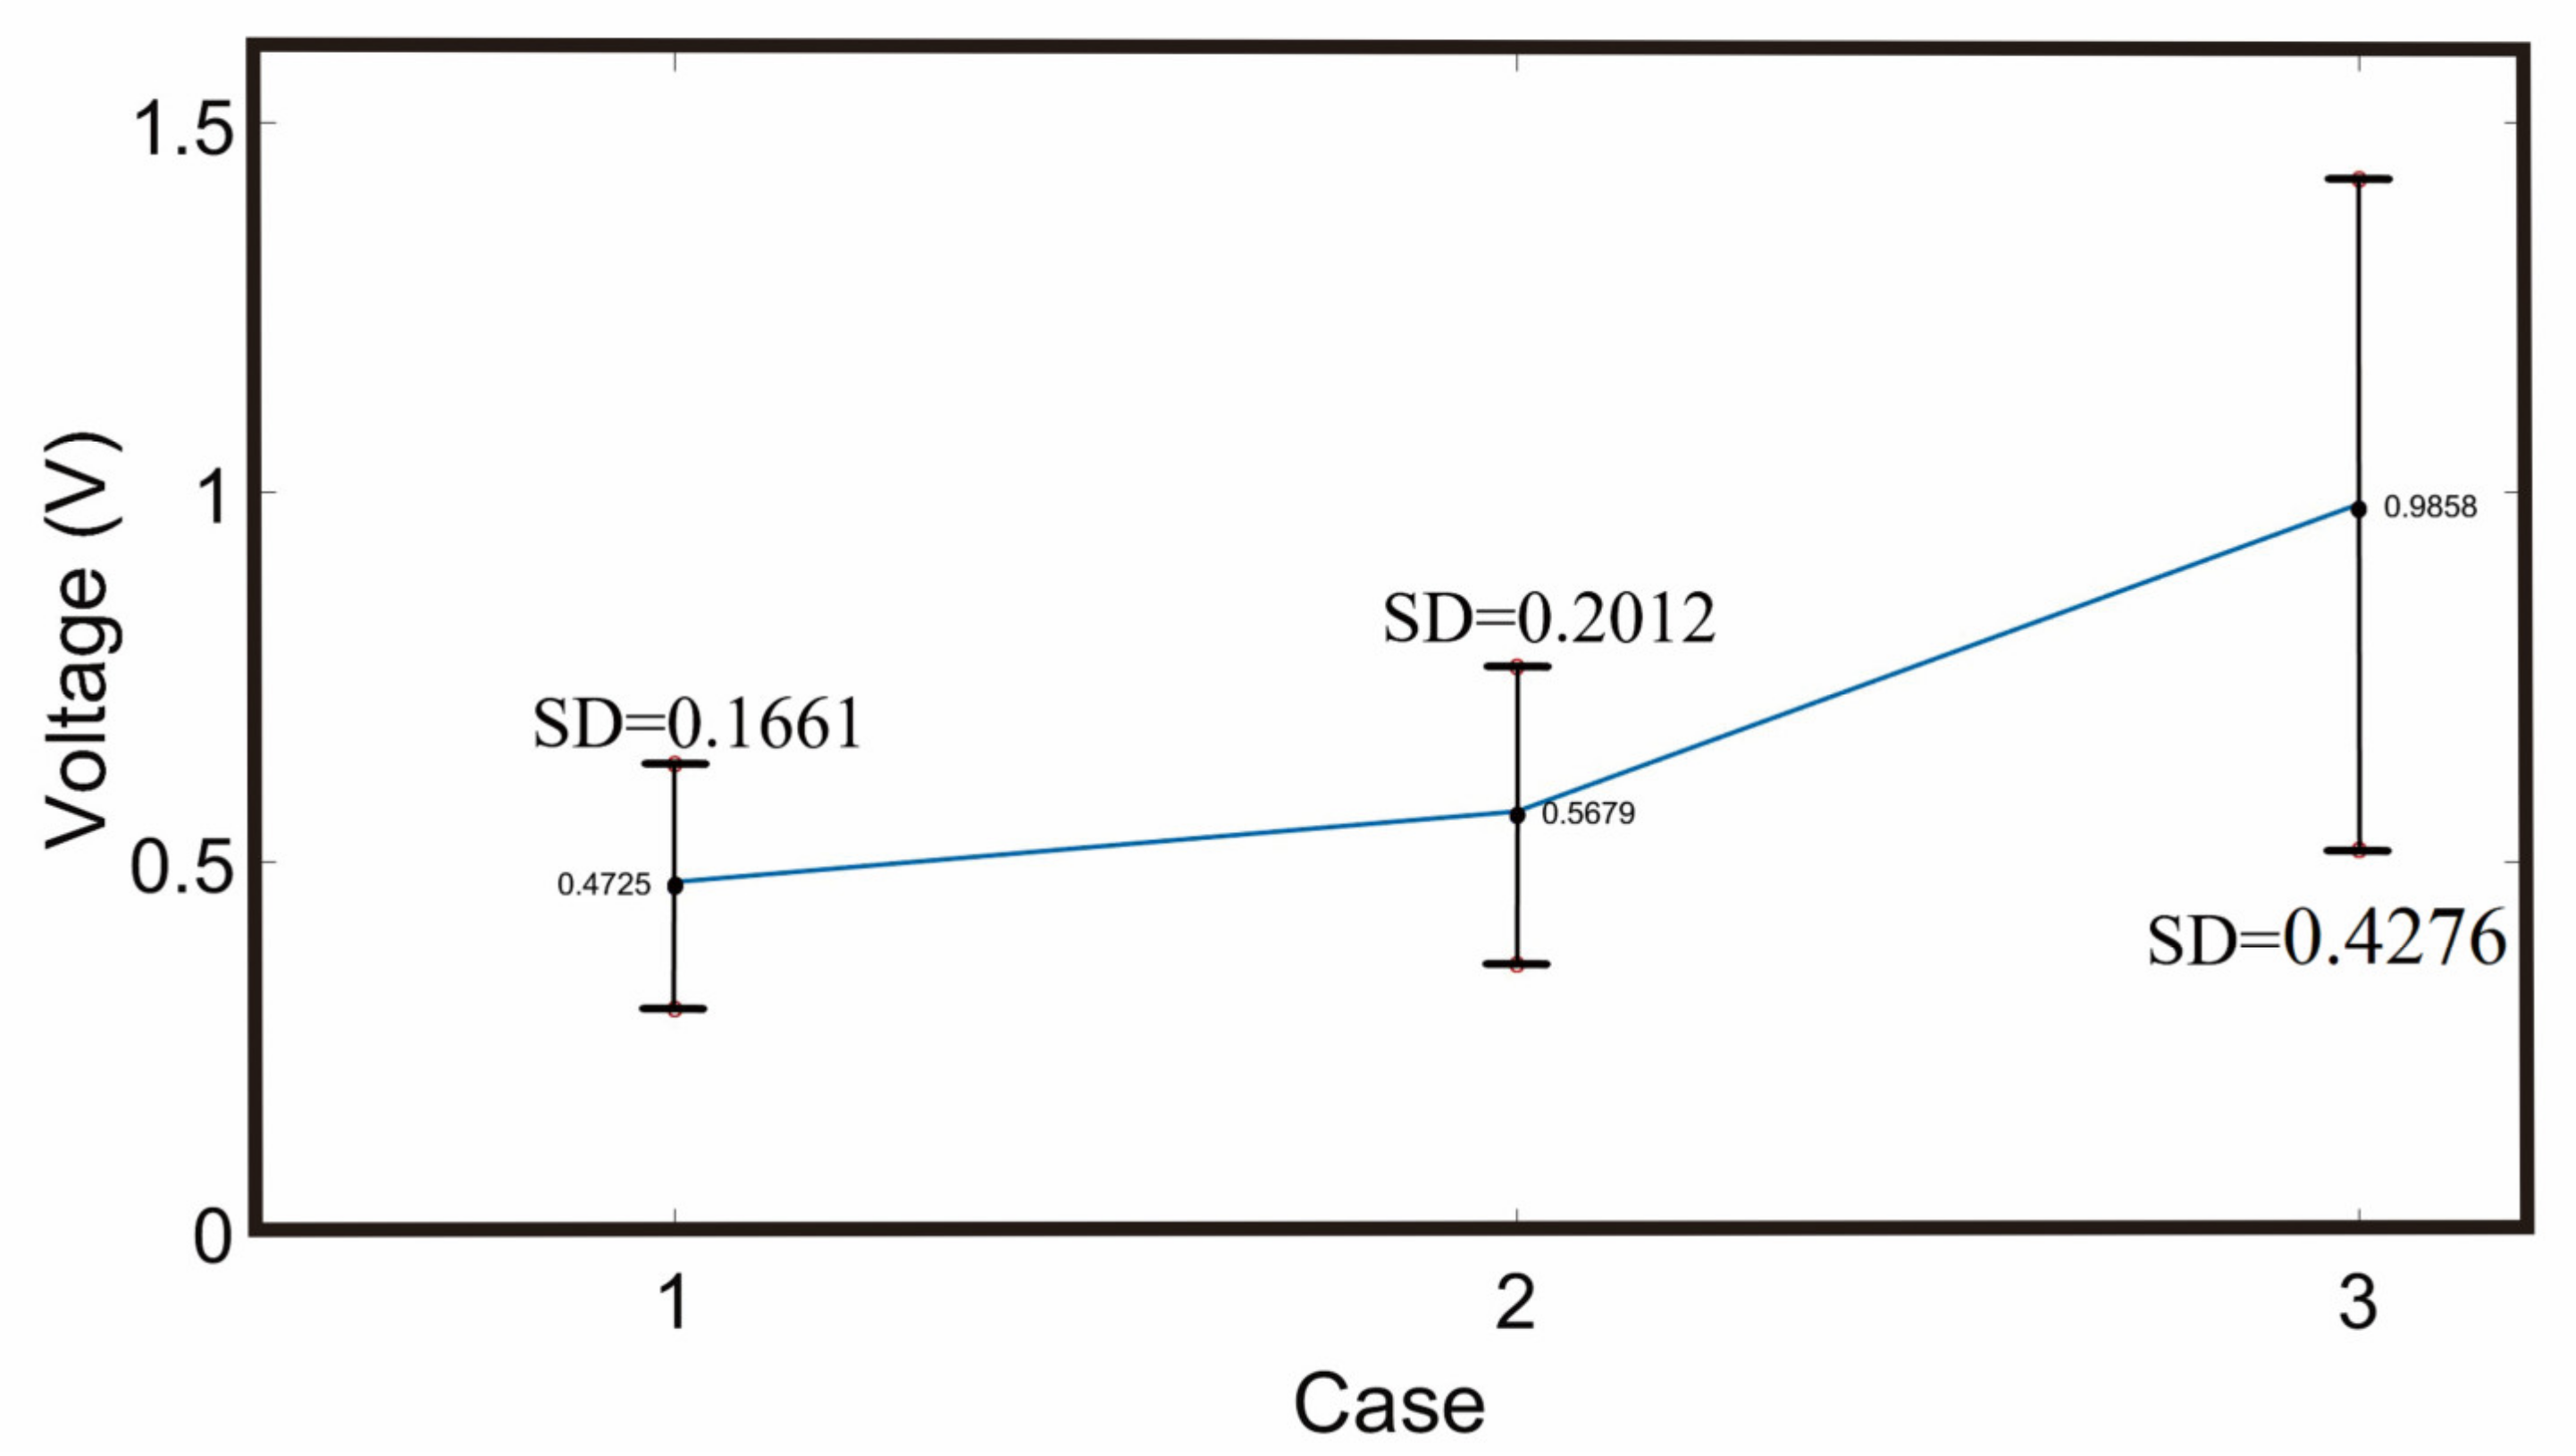
Based on the above experimental results, it can be seen that most of the equipment installed on Case 3 has obvious benefits for the increase in voltage generation, as shown in Table 3. Figure 20 presents the average voltage output of Cases 1, 2 and 3. Case 3 shows the best voltage generation. The best combination is: elastic steel length 150 mm, elastic steel spacing distance 30 mm, water receiver diameter 10 mm, cylinder diameter 10 mm, and cylinder 100 mm from elastic steel. Its highest voltage output can reach 1.67 V. Compared with the results from Mujtaba et al. [24], the DIF-VEHS design proposed in this study can provide more swing amplitude of elastic steel sheets through inverted flags and improve the voltage output efficiency under the same low flow speed.
We also plotted the standard deviation (SD) in Figure 17, Figure 18, Figure 19 and Figure 20. The black dots in the figures represent the mean value, and the short black dashes above and below the mean value represent the value of one standard deviation. The standard deviation is calculated from the data in Table 1, Table 2 and Table 3. From Figure 17, Figure 18, Figure 19, we can see that almost all the data are within 1 or 2 standard deviations, representing the reliability of the experimental data. As for the large standard deviation of Case 3 in Figure 20, it is not caused by experimental error. The reason may be that Case 3 added a cylinder and a receiver, causing the vortex and the structure to collide with each other. Therefore, the swing amplitude of the elastic steel sheets sometimes suddenly increases, which will cause severe fluctuations in the output voltage. Therefore, the combination of Case 3 and many fluid–structure interaction phenomena must still be observed experimentally.
It is noted that in this study, the connection between PZT and wire is only wrapped with insulating tape, and it is not dealt with in detail. In terms of the current experimental condition, the time to inject water and measure the voltage output does not exceed 15 min each time. During the experiment, no sudden drop in voltage was found. We believe that if it is actually applied in the industry, and the connections are insulated in detail, the electric energy generation effect and durability of this design should be better. It is also noted that in this experiment, an LED is connected to the circuit board when measuring the system voltage. This LED is a common commercial part, its wavelength range is 610~760 nm, forward voltage is 1.6~2.0 V, and the current is 10 mA. The forward voltage is the voltage used up by the LED, or dropped, when the current is traveling in the appropriate direction, forward. Based on this information, the design proposed in this study can generate a maximum power of 16.7 mW. Compared with [23,24], the power conversion of the design model proposed in this work is higher than that of similar devices.

5. Conclusions

This study explores whether the inverted flag model can add a feasible voltage generation scheme to the fluid–structure coupled energy harvesting system. The two pieces of elastic steel sheet will swing alternately to achieve the effect of generating electricity in turn. The following conclusions are drawn from this study:
  • The best combination of Case 1 is steel length = 150 mm, steel distance = 30 mm, and an average voltage generation per minute of about 0.7357 V.
  • The best combination of Case 2 is steel length = 150 mm, steel distance = 30 mm, receiver diameter = 10 mm, and an average voltage generation per minute of about 1.0368 V.
  • The best combination of Case 3 is steel length = 150 mm, steel distance = 30 mm, receiver diameter = 10 mm, and a distance between the cylinder and the elastic steel = 100 mm, cylinder diameter = 10 mm, and an average voltage generation per minute of about 1.6657 V.
In this experiment, it can be observed that two pieces of elastic steel vibrated with each other. Under the state of mutual vibration in turn, the elastic steel can rebound in a short time, thereby generating more electricity in a cycle. This model proves that it is possible to try to place the system in general rivers or sewers, and gradually change the experimental environment from a closed laboratory to a natural environment, so as to bring the system into the field of practical application.

Author Contributions

Y.-R.W. organized the content, wrote this article, designed this study and analyzed the data; P.-T.C. performed the numerical analysis and correlated with the experimental data. Y.-T.H. made the figures and plots, performed the experiment and collected data. All authors have read and agreed to the published version of the manuscript.

Funding

This research was supported by the Ministry of Science and Technology of Taiwan, Republic of China (grant number: MOST 110-2221-E-032-026).

Institutional Review Board Statement

Not applicable.

Informed Consent Statement

Not applicable.

Data Availability Statement

Not applicable.

Conflicts of Interest

The authors declare no conflict of interest.

References

  1. Lonney, B. Statistical Review of World Energy, 69th ed.; BP Company: London, UK, 2020; pp. 2–3. [Google Scholar]
  2. Roundy, S.; Wright, P.; Pister, K. Micro-Electrostatic Vibration-to-Electricity Converters. In Proceedings of the ASME International Mechanical Engineering congress and Exposition, New Orleams, LA, USA, 17–22 November 2002. [Google Scholar]
  3. Roundy, S.; Wright, P.; Pister, J.M. A Study of Low Level Vibration as a Power Source for Wireless Sensor Nodes. Comput. Commun. 2003, 26, 1131–1144. [Google Scholar] [CrossRef]
  4. Rivest, J.; Roundy, S.; Weight, P. Alternative Geometries for Increasing Power Density in Vibration Energy Scavenging for Wireless Sensor Networks. In Proceedings of the 3rd International Energy Conversion Engineering Conference, San Francisco, CA, USA, 15–18 August 2005. [Google Scholar]
  5. Cottone, F.; Vocca, H.; Gammaitoni, L. Nonlinear Energy Harvesting. Phys. Rev. Lett. 2009, 102, 080601. [Google Scholar] [CrossRef] [PubMed] [Green Version]
  6. Ramlan, R.; Brennan, M.; Mace, B.; Kovacic, I. Potential Benefits of a Nonlinear Stiffness in an Energy Harvesting Device. Nonlinear Dyn. 2010, 59, 545–558. [Google Scholar] [CrossRef]
  7. Moon, F.C.; Holmes, P.J. A Magnetoelastic Strange Attractor. JSV 1979, 65, 275–296. [Google Scholar] [CrossRef]
  8. Arrieta, A.; Hagedorn, P.; Inman, D. A Piezoelectric Bistable Plate for Nonlinear Broadband Energy Harvesting. Phys. Rev. Lett. 2010, 97, 4. [Google Scholar] [CrossRef] [Green Version]
  9. Stanton, S.; Mcgehee, C.; Mann, B. Nonlinear Dynamics for Broadband Energy Harvesting: Investigation of a Bistable Piezoelectric Inertial Generator. Physica D 2010, 239, 640–653. [Google Scholar] [CrossRef]
  10. Kim, D.; Cossé, J.; Cerdeira, C.; Gharib, M. Flapping Dynamics of an Inverted Flag. J. Fluid Mech. 2013, 736, R1. [Google Scholar] [CrossRef] [Green Version]
  11. Li, S.; Yuan, J.; Lipson, H. Ambient Wind Energy Harvesting Using Cross-Flow Fluttering. Appl. Phys. 2011, 109, 026104. [Google Scholar] [CrossRef] [Green Version]
  12. Orrego, S.; Shoele, K.; Ruas, A.; Doran, K.; Caggiano, B.; Mittal, R.; Kang, S.H. Harvesting Ambinet Wind Energy with an Inverted Piezoelectric Flag. Appl. Phys. 2017, 194, 212–222. [Google Scholar]
  13. Taylor, G.W.; Burns, J.R.; Kammann, S.A.; Powers, W.B.; Welsh, T.R. The Energy Harvesting Eel: A Small Subsurface Ocean/River Power Generator. IEEE J. Ocean. Eng. 2001, 26, 539–547. [Google Scholar] [CrossRef] [Green Version]
  14. Alberto, G.; Maurizio, P. Underwater Energy Harvesting from a Heavy Flag Hosting Ionic Polymer Metal Composites. Appl. Phys. 2017, 109, 084903. [Google Scholar]
  15. Bezanson, L.; Thornton, J.; Konchuba, N.; Priya, S. Utilizing Deep Ocean Current to Power Extended Duration Sensors. In Proceedings of the Oceans 2010 MTS/IEEE, Seattle, DC, USA, 20–23 September 2010. [Google Scholar]
  16. Erik, M.M.R.; Carbonell, M.; Carles, F.F.; Antoni, M.; Daniel, T. Piezoelectric, Energy Harvesting from Induced Vortex in water Flow. In Proceedings of the IEEE International Instrumentation and Measurement Technology, Graz, Austria, 13–16 May 2012. [Google Scholar]
  17. Zhang, M.; Liu, Y.Z.; Cao, Z.M. Modeling of Piezoelectric Energy Harvesting from Freely Oscillating Cylinders in Water Flow. Math. Probl. Eng. 2014, 2014, 985360. [Google Scholar] [CrossRef]
  18. Pritam, K.; Kumar, S.; Deepak, K.; Subhankar, S. Wake-Induced Vibrations of Tandem Circular Cylinders of Different Diameters. SSRN Electron. J. 2017, 6. [Google Scholar] [CrossRef]
  19. Lin, D.; Zou, Q.F.; Li, Z.; Wang, H.B. Research on Flow-Induced Vibration and Energy Harvesting of Three Circular Cylinders with Roughness Strips in Tandem. Energies 2018, 11, 17. [Google Scholar] [CrossRef] [Green Version]
  20. Gunasekaran, S.; Ross, G. Effect of Piezo-Embedded Inverted Flag in Free Shear Layer Wake. Aerospace 2019, 6, 33. [Google Scholar] [CrossRef] [Green Version]
  21. Tavallaeinejad, M.; Salinas, M.F.; Païdoussis, M.P.; Legrand, M.; Kheiri, M.; Botez, R.M. Dynamics of inverted flags: Experiments and comparison with theory. J. Fluids Struct. 2021, 101, 103199. [Google Scholar] [CrossRef]
  22. Ojo, O.; Wang, Y.C.; Erturk, A.; Shoele, K. Aspect ratio-dependent hysteresis response of a heavy inverted flag. J. Fluid Mech. 2022, 942, A4. [Google Scholar] [CrossRef]
  23. Cao, D.; Wang, J.; Guo, X.; Lai, S.K.; Shen, Y. Recent advancement of flow-induced piezoelectric vibration energy harvesting techniques: Principles, structures, and nonlinear designs. Appl. Math. Mech.-Engl. Ed. 2022, 43, 959–978. [Google Scholar] [CrossRef]
  24. Mujtaba, A.; Latif, U.; Uddin, E.; Younis, M.Y.; Sajid, M.; Ali, Z.; Abdelkefi, A. Hydrodynamic energy harvesting analysis of two piezoelectric tandem flags under influence of upstream body’s wakes. Appl. Energy 2021, 282, 116173. [Google Scholar] [CrossRef]
Figure 1. DIF-VEHS experiment set up, Case 1, a pair of elastic steels: (a) top view; (b) front view; (c) parameter description.
Sustainability 15 00704 g001
Figure 2. DIF-VEHS experiment set up, Case 2, with receivers: (a) top view; (b) front view; (c) parameter description.
Sustainability 15 00704 g002
Figure 3. DIF-VEHS experiment set up, Case 3, with cylinder and receivers: (a) top view; (b) front view; (c) parameter description.
Sustainability 15 00704 g003
Figure 4. Connection of PZT and electronic circuit: (a) connection of PZTs and elastic steel sheets; (b) connection of PZTs in parallel with the circuit board.
Sustainability 15 00704 g004
Figure 5. ANSYS simulation models: (a) Case 1; (b) Case 2; (c) Case 3.
Sustainability 15 00704 g005
Figure 6. ANSYS simulation of flow velocity: (a) Case 1; (b) Case 2; (c) Case 3.
Sustainability 15 00704 g006aSustainability 15 00704 g006b
Figure 7. ANSYS simulation of flow pressure contour: (a) Case 1; (b) Case 2; (c) Case 3.
Sustainability 15 00704 g007aSustainability 15 00704 g007b
Figure 8. ANSYS simulation of ESS vibration amplitudes: (a) Case 1; (b) Case 2; (c) Case 3.
Sustainability 15 00704 g008aSustainability 15 00704 g008b
Figure 9. Experimental setup of the DIF-VEHS.
Sustainability 15 00704 g009
Figure 10. Experimental results of elastic steel displacement of Case 1: (a) Side A (see Figure 1c); (b) Side B (see Figure 1c).
Sustainability 15 00704 g010
Figure 11. Experimental results of elastic steel displacement of Case 2: (a) Side A (see Figure 2c); (b) Side B (see Figure 2c).
Sustainability 15 00704 g011
Figure 12. Experimental results of elastic steel displacement of Case 3: (a) Side A (see Figure 3c); (b) Side B (see Figure 3c).
Sustainability 15 00704 g012
Figure 13. (a) The component design diagram of the base; (b) an example of one of the finished bases.
Sustainability 15 00704 g013
Figure 14. Experimental results of Case 1: (a) Sample 5; (b) Sample 6.
Sustainability 15 00704 g014
Figure 15. Experimental results of Case 2: (a) Sample 13; (b) Sample 14.
Sustainability 15 00704 g015
Figure 16. Experimental results of Case 3: (a) Sample 3; (b) Sample 4.
Sustainability 15 00704 g016
Figure 17. Voltage output of different factors of Case 1: (a) steel length; (b) steel distance.
Sustainability 15 00704 g017
Figure 18. Voltage output of different factors of Case 2: (a) steel length; (b) steel distance; (c) receiver diameter.
Sustainability 15 00704 g018aSustainability 15 00704 g018b
Figure 19. Voltage output of different factors of Case 3: (a) different cylinder diameter; (b) different distance between cylinder and receiver.
Sustainability 15 00704 g019aSustainability 15 00704 g019b
Figure 20. Average voltage output of Cases 1, 2 and 3.
Sustainability 15 00704 g020
Table 1. Experimental data of Case 1.
SampleL1 (mm)L2 (mm)Average (V)
1100200.3100
2100300.2751
3100400.2578
4150200.6205
5150300.7357
6150400.6788
7200200.4391
8200300.4996
9200400.4363
AVE 0.4725
Table 2. Experimental data of Case 2.
SampleL1 (mm)L2 (mm)D1Average (V)
11002050.2332
21003050.3273
31004050.3235
41502050.6841
51503050.7691
61504050.6147
72002050.4924
82003050.5410
92004050.4408
1010020100.3295
1110030100.3802
1210040100.3493
1315020100.9959
1415030101.0368
1515040100.7220
1620020100.6107
1720030100.6073
1820040100.5550
1910030150.4490
2010040150.4452
2115030150.7691
2215040150.6629
2320030150.7051
2420040150.6147
AVE 0.5691
Table 3. Experimental data of Case 3.
SampleL3 (mm)D2 (mm)Average (V)
150101.5369
250201.4190
3100101.6657
4100200.8300
5150101.5151
6150200.6428
7200101.1863
8200200.1128
9250100.6428
10250200.2871
AVE 0.9858
Disclaimer/Publisher’s Note: The statements, opinions and data contained in all publications are solely those of the individual author(s) and contributor(s) and not of MDPI and/or the editor(s). MDPI and/or the editor(s) disclaim responsibility for any injury to people or property resulting from any ideas, methods, instructions or products referred to in the content.