Abstract
The C spheres synthesized by a hydrothermal method were used as a C source, which was doped with LaFeO3 to obtain C-LaFeO3 composites with different C contents (5%, 10%, 15%, and 20%). The effects of C content on the structure, morphology, and photoelectric properties of LaFeO3 were investigated experimentally. The results show that C doping does not change the crystal structure of LaFeO3. The proper amount of C doping improves the photocatalytic and electrochemical activities of the composites. However, excessive C reduces the photocatalytic and electrochemical activities of the C-LaFeO3 composites. Comparing the different C contents, when the C content is 15%, the photocatalytic performance of C-LaFeO3 photodegrading methylene blue solution (MB) under visible light is the best, reaching an efficiency of 97%. In addition, electrochemical tests in a 6 M KOH electrolyte solution demonstrate that C doping significantly improves the redox reaction capacity, and the specific capacitance of 15% C-LaFeO3 (466.08) F/g) at a current density of 0.5 A/g is about 2.5 times that of LaFeO3 (180.10 F/g). Furthermore, EIS studies show that that the ion diffusion resistance of the 15% C-LaFeO3 electrode decreased, which is indicative of good electrochemical performance.
1. Introduction
Due to its high chemical stability, excellent catalytic activity, non-toxicity, small band gap, and good physicochemical properties, LaFeO3 has attracted attention [1,2,3,4,5,6]. However, LaFeO3 generally has poor conductivity, a much lower capacity than that of carbon anode materials, limited visible light absorption, and weaker charge separation rates, resulting in less contact with organic contaminants and lower photoelectrochemical performance [7,8]. Therefore, to improve conductivity and increase capacity, a second phase with a high electron conductivity is added to form a composite [9,10,11,12,13,14,15,16]. The resulting C–semiconductor composite photocatalyst has high electrical conductivity, excellent charge mobility, can reduce the recombination rate of the e-/h+ pairs, and ensures close contact or formation of a covalent bond between the C-based carrier and the semiconductor nanomaterial, which improves photoelectric performance [17,18,19,20,21,22,23]. Therefore, it is of great research value to immobilize LaFeO3 nanoparticles on the surface of C-based supports.
This paper describes a simple and environmentally-friendly method to synthesize C-LaFeO3 nanocomposites. The synthesis method has several advantages, including a short reaction time, low energy consumption, high synthesis efficiency, and uniform particles. Water and ethanol are used as solvents, and glucose and metal nitrate are used as raw materials. The LaFeO3 and C are first dispersed and combined. The effects of different C contents on the structure, morphology, and photoelectric properties of the samples are systematically investigated.
2. Experiment
2.1. Materials and Methodology
A chemical of analytical grade was purchased from Sigma-Aldrich USA for use with no extra purification. Crystal structures were analyzed using powder X-ray diffraction (Bruker, D8 Advance, Germany) employing Cu Kα1 radiation (λ = 0.154056 nm) in the two-theta range of 10° to 80°. Surface morphologies were observed using a field-emission scanning electron microscope (JEOL, JSM-7500F, Tokyo, Japan). An INCA PentaFET × 3 X-ray energy spectrometer (EDS, Oxford, UK) was also employed for analyzing low content elements at an accelerating voltage of 10 kV. Furthermore, surface structure was studied by XPS analysis (Oxford Instruments plc, Thermo K-Alpha+, UK). The surface area was obtained on the basis of N2 adsorption–desorption isotherms at 77 K using an ASPS2020 gas adsorption apparatus (Edinburgh, USA), and all of the samples were degassed at 180 °C for 10 h before N2 adsorption measurements.
2.2. Synthesis of C-LaFeO3 Nanocomposites
The LaFeO3 composites were synthesized via a hydrothermal method. In a typical preparation process, the first step was to mix lanthanum nitrate hexahydrate (La(NO3)2·6H2O), iron (III) acetylacetonate (C15H21FeO6), and citric acid in a molar ratio of 1:1:2 in 40 mL of ethanol by magnetic stirring to form a stable and uniform precursor. The pH of the solution was adjusted to 6 by adding NH3·H2O. Afterwards, the solution was transferred into a 100 mL Teflon-lined stainless-steel autoclave and hydrothermally treated at 160 °C for 10 h. After cooling to room temperature, the obtained gray product was centrifuged and washed several times with deionized water followed by absolute ethanol. The product was then dried in an oven at 80 °C for 10 h. Finally, the product was calcined at 600 °C for 3 h in air to produce the final samples.
The C spheres synthesized by a hydrothermal method with C6H12O6·6H2O as a raw material. A certain amount of C6H12O6·6H2O was dissolved in deionized water to form a solution. The solution was transferred into a 100 mL Teflon-lined stainless-steel autoclave and hydrothermally treated at 180 °C for 6 h. After cooling to room temperature, the obtained product was centrifuged. The product was then dried in an oven at 60 °C for 5 h.
A certain stoichiometric ratio of LaFeO3 and C was dispersed in deionized water and sonicated for 1 h. After mixing for 0.5 h, 20 mL of C2H5OH solution was added to the solution and irradiated for 1 h. The product was filtered and dried at 80 °C to obtain C-LaFeO3 nanosphere composites with different carbon contents (5%, 10%, 15%, and 20%).
2.3. Photocatalytic Measurements
Photocatalytic activity was measured with a Carry 5000 UV–Vis spectrometer (Varian, Palo Alto, CA, USA) using H2O as a reference. In brief, 0.05 g of sample was added to 50 mL of methylene blue (MB, 5 mg·L−1) aqueous solution under magnetic stirring for 20 min in the dark. After establishing the adsorption–desorption equilibrium, the suspension was exposed to a 125 W high-pressure fluorescent Hg lamp (22.5 mW/cm2) for 2 h. Next, 5 mL of solution was taken out and centrifuged (3000 r/min) instantly every 30 min. Finally, the absorbance of the centrifuged solution was determined by the spectroscopy equipment described earlier. The illumination distance was 15 cm, and the maximum absorption wavelength was 664 nm. According to the Lambert–Beer law, the photocatalytic activity can be described by the following Equation (1):
where η is the degradation rate, and C0/A0 and Ct/At are the initial MB concentration/absorbance and the t-min illuminated MB concentration/absorbance, respectively.
η = [(C0 − Ct)/C0] × 100% = [(A0 − At)/A0] × 100%
2.4. Electrochemical Measurement
All electrochemical properties were tested in a three-electrode configuration system. Before the experiments, 1 cm2 of Ni foam was successively cleaned using acetone, hydrochloric acid (1 M), ethanol, and de-ionized water. The Ni foam was then dried in a vacuum atmosphere at 80 °C for 12 h. Electrodes for supercapacitors were fabricated by mixing 80 wt.% active materials, 10 wt.% acetylene black, and 10 wt.% polyvinylidene difluoride (PVDF) in N-methyl pyrrolidone (NMP), followed by stirring for 8 h to form a homogeneous slurry. Afterwards, the paste was uniformly laid on the Ni foam and dried in vacuum oven at 60 °C overnight. Next, the electrodes were pressed for a few seconds under a pressure of 10 MPa before they were immersed in 6 M KOH electrolyte for about 10 h. The quantity of active materials of every working electrode was approximately 1 mg.
For measurements, Hg/HgO (1 M KOH was internal reference solution) together with Pt foil were used as the reference and counter electrodes, respectively, in the KOH (6 M) aqueous electrolyte solution. The CV and EIS tests were conducted using a CHI604D Electrochemical Analyzer (Chenhua, Shanghai, China). Cyclic voltammetry (CV) curves were recorded from 0.15 V to 0.55 V at scan rates from 10 mV·s−1 to 100 mV·s−1. Galvanostatic charge and discharge (GCD) curves were recorded from 0.15 V to 0.55 V at current densities from 0.5 A/g to 10 A/g. Electrochemical impedance spectroscopy (EIS) was measured at open circuit potential with a 5 mV amplitude in the frequency range of 100 kHz to 0.01 Hz.
3. Results and Discussion
3.1. Structure and Morphology
The XRD spectra of different C-LaFeO3 samples (b, 0%; c, 5%; d, 10%; e, 15%; f, 20%) and C are shown in Figure 1a. Among them, a is the preparation of amorphous C nanospheres [24], b is pure phase LaFeO3, and c, d, e, and f correspond to C-LaFeO3 samples with different C contents. The results in Figure 1 show that C-LaFeO3 samples with different C contents are consistent with the main diffraction peaks of LaFeO3 and have an orthorhombic perovskite structure. Different C contents do not change the lattice structure of the LaFeO3 samples, and each sample retains the orthorhombic perovskite structure. The enlarged XRD spectra of different C-LaFeO3 samples (b, 0%; c, 5%; d, 10%; e, 15%; f, 20%) are shown in Figure 1b. Compared to b, the diffraction peaks of c, d, e, and f of different C-LaFeO3 samples were reduced, and none of them exhibited diffraction peaks of C. These trends may be due to the low C content and the high dispersion of C in the LaFeO3 lattice that occupies part of its growth site [25], which causes LaFeO3 to grow incompletely and the diffraction peak intensities to decrease. Second, in the comparison of the spectra in c, d, e, and f, the diffraction peak of the e sample is sharper, the intensity is higher, and the crystallinity is improved.
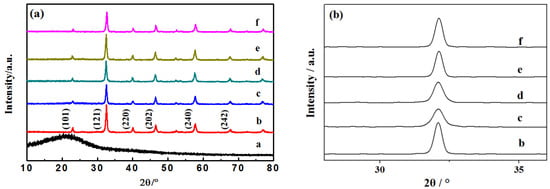
Figure 1.
(a) XRD pattern of C and different C-doped C-LaFeO3 nanocomposites; (b) enlarged XRD pattern of different C-doped C-LaFeO3 nanocomposites (a, C; b, 0%; c, 5%; d, 10%; e, 15%; f, 20%).
The SEM images of C, LaFeO3, and different C-LaFeO3 samples are shown in Figure 2. Here, a corresponds to the preparation of amorphous carbon nanospheres [26]; b corresponds to LaFeO3, which shows spherical particles; c, d, e, and f represent different C-LaFeO3 samples with different C contents of 5%, 10%, 15%, and 20%, respectively. As the C content increases, the C spheres in the nanocomposite increase, and LaFeO3 is dispersed on the surface of the C nanospheres.
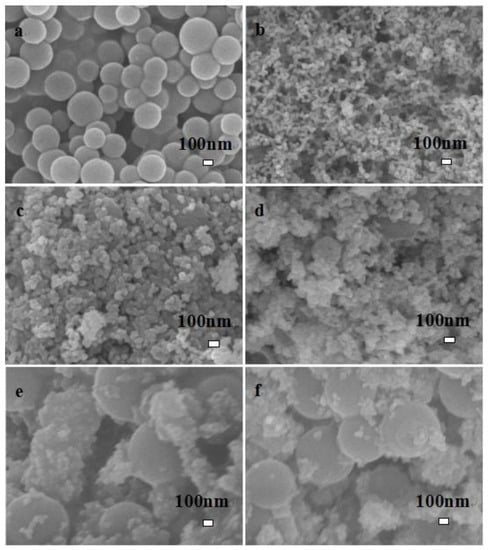
Figure 2.
SEM image of C and different C content C-LaFeO3 materials (a, C; b, 0%; c, 5%; d, 10%; e, 15%; f, 20%).
The point and face sweeps of the LaFeO3 in Figure 3a and 15% C-LaFeO3 (b) sample EDS are shown in Figure 3 and Figure 4. Among them, Figure 3a,b correspond to the LaFeO3 and 15% C-LaFeO3 samples, respectively, and the inset displays the weight and content ratio of each sample. From the energy spectrum (EDS) in Figure 3a, the sample contains three elements of La, Fe, and O, and the atomic ratio of La, Fe, and O is 1:1:3, which is consistent with the structure of LaFeO3. The Pt is the result of pretreatment of the sample prior to testing. Comparing the energy spectra (EDS) in Figure 3a,b, in addition to the elements in Figure 3a, there is clearly C in Figure 3b, further indicating the successfully incorporation of C into LaFeO3. From the surface scan of Figure 4, the dispersion of each element is relatively uniform, and the distribution of doped C elements is relatively uniform.
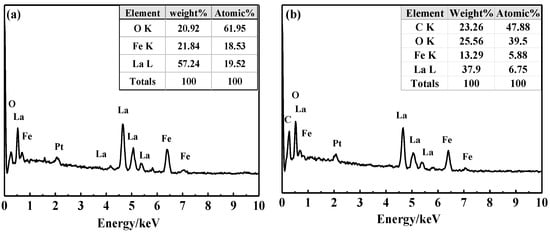
Figure 3.
EDS diagram of LaFeO3 (a) and 15% C-LaFeO3 (b) samples.
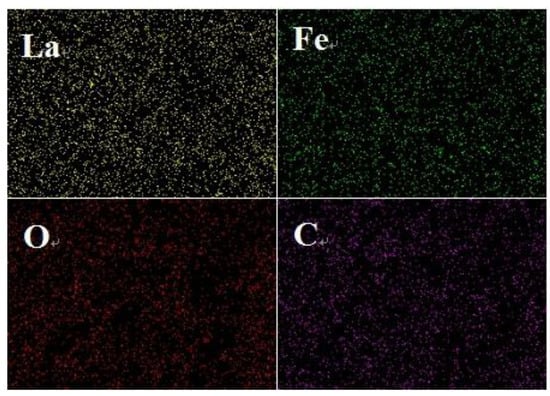
Figure 4.
Mapping diagram of the 15% C-LaFeO3 sample.
The chemical composition of the surface of the material and the chemical state of the element have a great influence on photoelectric properties and, therefore, X-ray photoelectron spectroscopy (XPS) analysis was performed. The XPS spectra of LaFeO3 and C-LaFeO3 nanocomposites, and the peaks corresponding to La, Fe, and O in the LaFeO3 spectrum and the corresponding La, Fe, O and C in the C-LaFeO3 spectrum, are shown in Figure 5. Among them, the peaks of La 3d5/2 and La 3d3/2 in the LaFeO3 and C-LaFeO3 spectra in Figure 5a are located at 833.38 eV and 837.68 eV and 850.18 eV and 854.58 eV, respectively, and these results confirm the presence of La3+ [27]. The peaks at 709.68 eV and 723.48 eV for LaFeO3 and C-LaFeO3 in Figure 5b are attributed to the binding energies of Fe 2p3/2 and Fe 2p1/2, respectively. In addition, compared to LaFeO3, the binding energy of La 3d and Fe 2p of C-LaFeO3 nanocomposites is lower, indicating a decrease in the electron density around La3+ and Fe3+ and a strong interaction between LaFeO3 and C spheres. These results signify that the C-LaFeO3 nanocomposites exhibit a change in electron transfer and chemical bonding, which indicates that surface O species play an important role in the photocatalytic process [28,29]. The O 1s spectra of LaFeO3 and C-LaFeO3 nanocomposites possess two main peaks (Figure 5c). The peak at 528.65 eV in LaFeO3 is assigned to the lattice O atom in a fully coordinated environment, and the peak at 531.08 eV is attributed to the O atom near the O vacancy [30]. Compared to LaFeO3, the peaks of lattice O and non-stoichiometric O in C-LaFeO3 shift to the right, indicating a strong interaction between LaFeO3 and C spheres, which signifies that electron transfer exists in C-LaFeO3 nanocomposites [31]. Because LaFeO3 nanoparticles are immobilized on C spheres, C-LaFeO3 nanocomposites absorb more O than LaFeO3. Peaks ascribed to C-C, C-H, C-O and C=O(COOR) exist at the binding energies of 284.5 eV, 285.0 eV, 286.2 eV, and 288.9 eV, respectively [28,30].
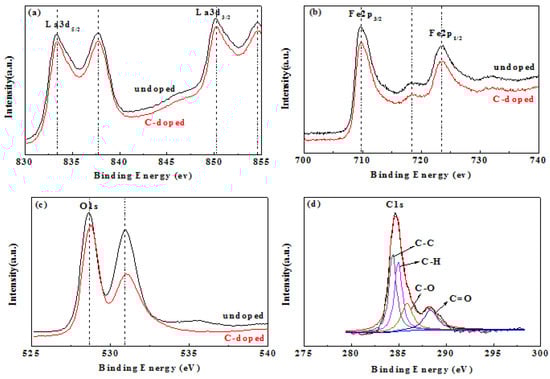
Figure 5.
XPS spectra of LaFeO3 and C-doped LaFeO3 samples. (a) La 3d, (b) Fe 2p, (c) O 1 s, and (d) C 1 s.
3.2. Photocatalytic Activity
The photocatalytic activity of different C-LaFeO3 samples (a, 0%; b:, 5%; c, 10%; d, 15%; e, 20%) for the degradation of 5 mg·L−1 MB under visible light is shown in Figure 6. According to the figure, the photocatalytic degradation ability of MB of C-LaFeO3 samples b, c, d, and e is different, but they are all larger than that of a. To some extent, there is a strong interaction between C and LaFeO3 such that the photogenerated carriers rapidly migrate to the surface of LaFeO3, resulting in efficient electron–hole separation and improved photocatalytic performance. Comparing the photocatalytic effects of different C-LaFeO3 samples, when the C content is 15%, the efficiency of photocatalytic degradation of MB is 97.0%, and the photocatalytic activity reaches its maximum value. This finding indicates that an appropriate amount of C is critical for the enhancement of the photocatalytic activity of LaFeO3. When the C doping content is small, fewer O vacancies generated by the action of C and LaFeO3 enhance the absorption of visible light by the LaFeO3 catalyst and improve its photocatalytic activity. When the C doping content is high, the excess O vacancies form an electron–hole recombination center, which decreases the photocatalytic activity of LaFeO3 [32].
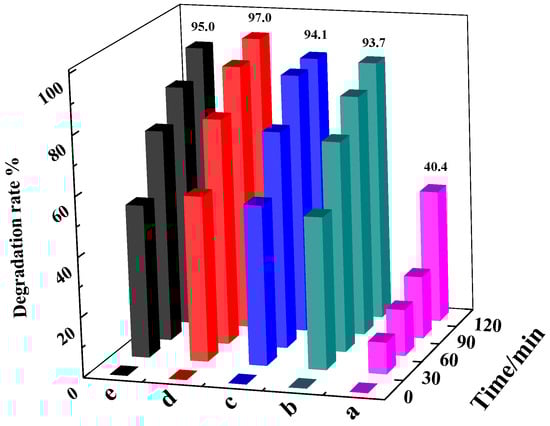
Figure 6.
Photocatalytic degradation of C-LaFeO3 samples with different carbon contents (a, 0%; b, 5%; c, 10%; d, 15%; e, 20%).
3.3. Electrochemical Performance
The CV curves of different C-LaFeO3 samples at 10 mV/s are displayed in Figure 7a. The shape of the CV curve in the figure indicates that the electrode has undergone a redox reaction, and the reversible oxidation and reduction peaks of the C-LaFeO3 sample are sequentially located at 0.421 V and 0.319 V, respectively. At the same scan rate, the 15% C-LaFeO3 sample exhibits a stronger current response and a larger integrated area than the two samples, indicating a relatively good capacitance performance, which is attributed to the presence of the C. This is because C, which is combined with LaFeO3 to form a highly conductive composite, shortens the ion diffusion path, thereby effectively increasing charge mobility and facilitating the reversible electrochemical behavior of the electrode. These effects improve the electrochemical performance of the C-LaFeO3. Figure 7b displays the CV curve of 15% C-LaFeO3 at different scan rates. According to the figure, there are clear oxidation peaks and reduction peaks in the CV curve of 15% C-LaFeO3. When the scan rate increases, the curve does not undergo significant deformation, the redox current and the curve area increase, the peak potentials shift slightly, and a small polarization occurs. Taken together, these results indicate that the electrode has excellent electrochemical reversibility.
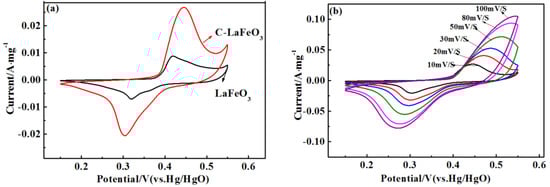
Figure 7.
(a) CV curves of different C-LaFeO3 samples; (b) CV curve of 15% C-LaFeO3 sample at different scan rates.
To further verify the electrochemical behavior of the samples, galvanostatic charge and discharge (GCD) tests were conducted at various current densities. The GCD curves of LaFeO3 and 15% C-LaFeO3 are shown in Figure 8. The figure shows that the shape of the curve is similar, the voltage varies nonlinearly with time, and that there is a significant charge and discharge platform, which indicates that the material is redox active. Compared to the LaFeO3 sample in Figure 8a, 15% C-LaFeO3 (b) exhibits a relatively long discharge time, indicating that it has a higher specific capacitance, which is consistent with the CV analysis. Often, GCD testing is used to calculate the specific capacitance of a sample. The specific capacitances of the LaFeO3 samples were 162.79 F/g, 144.86 F/g, 128.00 F/g, 89.90 F/g, 83.68 F/g, and 82.6 F/g at current densities of 0.5 A/g, 1 A/g, 2 A/g, 5 A/g, and 10 A/g, respectively. The specific capacitance of the 15% C-LaFeO3 sample was 466.08 F/g, 502.42 F/g, 448.16 F/g, 395.30 F/g, 361.92 F/g and 350.4 F/g, respectively. Clearly, the specific capacitance of 15% C-LaFeO3 is much higher than that of LaFeO3 because C is combined with LaFeO3 to form a highly conductive composite. The contact area between the electrolyte and the active material is increased to some extent, thereby exhibiting efficient charge storage.
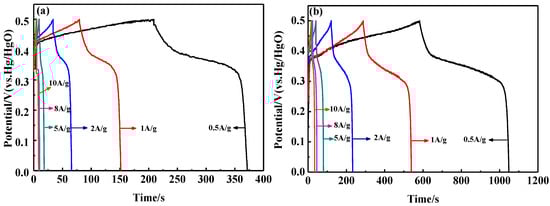
Figure 8.
(a) The GCD curves of LaFeO3 samples at different current densities; (b) the GCD curves of 15% C-LaFeO3 samples at different current densities.
The EIS spectra of the LaFeO3 and C-LaFeO3 samples are shown in Figure 9. As can be seen from the figure, the EIS lines are composed of semicircles in the high frequency region and oblique lines in the low frequency region. Compared to LaFeO3, the EIS of the C-LaFeO3 sample possesses a reduced semicircle diameter and an increased linear slope. These results indicate that the charge transfer resistance and ion diffusion resistance of the C-LaFeO3 sample are reduced, and the electrochemical performance is improved. This improvement is primarily due to the good conductivity of the carbon material. The combination of C with LaFeO3 accelerates ion diffusion and the migration rate on the electrode surface and reduces the composite impedance of the C-LaFeO3 sample.
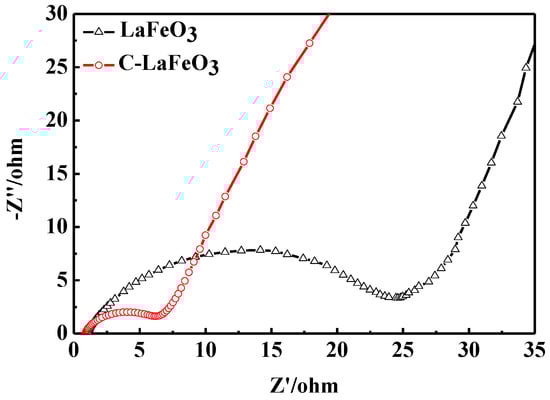
Figure 9.
EIS spectrum of LaFeO3 and C-LaFeO3 samples.
The HRTEM and SAED techniques would be better to employ in addition to SEM to present clear images of the morphology. The band gap configuration and charge transfer for LaFeO3/C composite are very important for the photocatalytic mechanism. We will further study these in future work.
4. Conclusions
Different C-LaFeO3 composites were synthesized. The results demonstrate that C doping does not change the crystal structure of LaFeO3. The proper amount of C doping improves the photocatalytic and electrochemical activities of the composite, but excess C reduces the photocatalytic and electrochemical activities of the C-LaFeO3 composite. Comparing LaFeO3 with different C contents, when the C content is 15%, the photocatalytic performance of C-LaFeO3 for MB reaches a maximum value of 97%. In addition, electrochemical tests in a 6 M KOH electrolyte solution showed that the 15% C-LaFeO3 electrode possesses lower charge transfer impedance, lower ion diffusion resistance, and more reversible ratios in CV and GCD.
Author Contributions
Conceptualization: K.G.; methodology: S.L.; validation: K.G.; formal analysis: S.L., M.L., M.X., X.L. and K.G.; data curation: S.L.; writing—original draft: S.L.; writing—review and editing: S.L. All authors have read and agreed to the published version of the manuscript.
Funding
This research was funded by the Nature Science Foundation of Heilongjiang Province of China, grant number LH2020B004, National Innovation and Entrepreneurship Training for University of PRC, grant number 202210234058, and the Youth Doctor Foundation of Harbin University, grant Number HUDF2019202, HUDF2019203.
Informed Consent Statement
Informed consent was obtained from all subjects involved in the study.
Data Availability Statement
The data presented in this study are available on request from the corresponding author.
Acknowledgments
The authors acknowledge the School of Food Engineering of Harbin University S.L. would like to thank the Nature Science Foundation of Heilongjiang Province of China (grant LH2020B004), National Innovation and Entrepreneurship Training for the University of PRC (grant 202210234058), and the Youth Doctor Foundation of Harbin University (grant HUDF2019202). Finally, K.G. would like to thank the YDF (grant HUDF2019203).
Conflicts of Interest
The authors declare no conflict of interest.
References
- Gao, X.M.; Shang, Y.Y.; Liu, L.B.; Nie, W.; Fu, F. AgCl/Ag/LaFeO3 heterojunction with a prolonged charge lifetime and enhanced visible light catalytic property. J. Phys. Chem. Solids 2019, 127, 186–193. [Google Scholar] [CrossRef]
- Chen, Z.; Fan, T.; Zhang, Q.; He, J.W.; Fan, H.Q.; Sun, Y.F.; Yi, X.D.; Li, J.H. Interface engineering: Surface hydrophilic regulation of LaFeO3 towards enhanced visible light photocatalytic hydrogen evolution. J. Colloid Interface Sci. 2019, 536, 105–111. [Google Scholar] [CrossRef] [PubMed]
- Humayun, M.; Qu, Y.; Raziq, F.; Yan, R.; Li, Z.J.; Zhang, X.L.; Jing, L.Q. Exceptional Visible-Light Activities of TiO2-Coupled N-Doped Porous Perovskite LaFeO3 for 2,4-Dichlorophenol Decomposition and CO2 Conversion. Environ. Sci. Technol. 2016, 50, 13600–13610. [Google Scholar] [CrossRef]
- Humayun, M.; Sun, N.; Raziq, F.; Zhang, X.L.; Yan, R.; Li, Z.J.; Qu, Y.; Jing, L.Q. Synthesis of ZnO/Bi-doped porous LaFeO3 nanocomposites as highly effiffifficient nano-photocatalysts dependent on the enhanced utilization of visible-light-excited electrons. Appl. Catal. B Environ. 2018, 231, 23–33. [Google Scholar] [CrossRef]
- Zhou, Y.J.; Lu, Z.; Li, J.W.; Xu, S.F.; Xu, D.; Wei, B. The electronic properties and structural stability of LaFeO3 oxide by niobium doping: A density functional theory study. Int. J. Hydrogen Energ. 2021, 46, 9193–9198. [Google Scholar] [CrossRef]
- Li, X.Y.; Li, Z.S.; Lu, C.Q.; Li, D.Y.; Li, Z.Q.; Gao, J.; Wei, J.L.; Li, K.Z. Enhanced performance of LaFeO3 oxygen carriers by NiO for chemical looping partial oxidation of methane. Fuel Process. Technol. 2022, 236, 107396. [Google Scholar] [CrossRef]
- Kumar, A.; Chandel, M.; Sharma, A.; Thakur, M.; Kumar, A.; Pathania, D.; Singh, L. Robust visible light active PANI/LaFeO3/CoFe2O4 ternary heterojunction for the photo-degradation and mineralization of pharmaceutical effluent: Clozapine. J. Environ. Chem. Eng. 2021, 9, 106159. [Google Scholar] [CrossRef]
- Iervolino, G.; Vaiano, V.; Sannino, D.; Rizzo, L.; Ciambelli, P. Production of hydrogen from glucose by LaFeO3 based photocatalytic process during water treatment. Int. J. Hydrogen Energ. 2016, 41, 959–966. [Google Scholar] [CrossRef]
- Li, M.; Liu, Z.W.; Wang, F.; Xuan, J.J. The inflfluence of the type of N dopping on the performance of bifunctional N-doped ordered mesoporous carbon electrocatalysts in oxygen reduction and evolution reaction. J. Energy Chem. 2017, 26, 422–427. [Google Scholar] [CrossRef]
- Chandel, M.; Thakur, M.; Sharma, A.; Pathania, D.; Kumar, A.; Singh, L. Chlorophyll sensitized (BiO)2CO3/ CdWO4/rGO nano-hybrid assembly for solar assisted photo-degradation of chlorzoxazone. Chemosphere 2022, 305, 135472. [Google Scholar] [CrossRef]
- Wang, Q.J.; Tan, Q.H.; Liu, Y.K. Enhanced ferromagnetism in N-doped BiFeO3: A first-principles prediction. J. Alloy. Compd. 2015, 644, 30–39. [Google Scholar] [CrossRef]
- Li, X.Z.; Shi, H.Y.; Yan, X.Y.; Zuo, S.X.; Zhang, Y.Y.; Chen, Q.; Yao, C.; Ni, C.Y. Rational construction of direct Z-scheme doped perovskite/palygorskite nanocatalyst for photo-SCR removal of NO: Insight into the effect of Ce incorporation. J. Catal. 2019, 369, 190–200. [Google Scholar] [CrossRef]
- Li, Z.S.; Lv, L.; Wang, J.S.; Ao, X.; Ruan, Y.J.; Zha, D.C.; Hong, G.; Wu, Q.H.; Lan, Y.C.; Wang, C.D.; et al. Engineering phosphorus-doped LaFeO3-δ perovskite oxide as robust bifunctional oxygen electrocatalysts in alkaline solutions. Nano Energy 2018, 47, 199–209. [Google Scholar] [CrossRef]
- Ma, Q.L.; Zhu, J.J.; Gleisner, R.; Yang, R.D.; Zhu, J.Y. Valorization of Wheat Straw Using a Recyclable Hydrotrope at Low Temperatures (≤90 °C). ACS Sustain. Chem. Eng. 2018, 6, 14480–14489. [Google Scholar] [CrossRef]
- Li, X.Z.; Shi, H.Y.; Zhu, W.; Zuo, S.X.; Lu, X.W.; Luo, S.P.; Li, Z.Y.; Yao, C.; Chen, Y.S. Nanocomposite LaFe1−xNixO3 /Palygorskite catalyst for photo-assisted reduction of NOx: Effect of Ni doping. Appl. Catal. B Environ. 2018, 231, 92–100. [Google Scholar] [CrossRef]
- Pan, F.; Zhang, W.D.; Ferronato, C.; Valverde, J.L.; Giroir-Fendler, A. Boosting propene oxidation activity over LaFeO3 perovskite catalysts by cobalt substitution. Appl. Catal. A Gen. 2022, 643, 118779. [Google Scholar] [CrossRef]
- Kumar, A.; Sharma, K.; Thakur, M.; Pathania, D.; Sharma, A. Fabrication of high visible light active LaFeO3/Cl-g-C3N4/RGO heterojunction for solar assisted photo-degradation of aceclofenac. J. Environ. Chem. Eng. 2022, 10, 108098. [Google Scholar] [CrossRef]
- Ji, F.; Li, J.; Cui, X.L.; Liu, J.; Bing, X.M.; Song, P. Hierarchical C-doped BiPO4/ZnCoAl-LDO hybrid with enhanced photocatalytic activity for organic pollutants degradation. Appl. Clay Sci. 2018, 162, 182–191. [Google Scholar] [CrossRef]
- Duan, Y.W.; Chen, X.W.; Zhang, X.X.; Xiang, W.; Wu, C.F. Inflfluence of carbon source on the anatase and brookite mixed phase of the C-doped TiO2 nanoparticles and their photocatalytic activity. Solid State Sci. 2018, 86, 12–18. [Google Scholar] [CrossRef]
- Kumar, A.; Pathania, D.; Gupta, N.; Raj, P.; Sharma, A. Photo-degradation of noxious pollutants from water system using Cornulaca monacantha stem supported ZnFe2O4 magnetic bio-nanocomposite. Sustain. Chem. Pharm. 2020, 18, 100290. [Google Scholar] [CrossRef]
- Wang, W.; Huang, R.J.; Dai, H.L.; Shan, Y.; Zhao, Y.Q.; Guo, S.B.; Huang, C.J.; Li, L.F. Tunable near-zero thermal expansion in the C-doped La(Fe, Si)13 compounds at cryogenic temperatures. Mater. Lett. 2019, 237, 26–28. [Google Scholar] [CrossRef]
- Liu, W.; Li, X.Z.; Chu, X.N.; Zuo, S.X.; Gao, B.Y.; Yao, C.; Li, Z.Y.; Chen, Y.S. Boosting photocatalytic reduction of nitrate to ammonia enabled by perovskite/biochar nanocomposites with oxygen defects and O-containing functional groups. Chemosphere 2022, 94, 133763. [Google Scholar] [CrossRef] [PubMed]
- Wang, X.; Zhang, Y.N.; Liu, C.; Yuan, Z.T.; Yu, X.H.; Zhong, Y.; Zhan, Z.L. Microwave-Assisted Sol-Gel Modification of Al- or C-doped Li4Ti5O12 Samples as Anode Materials for Li-ion Batteries. Int. J. Electrochem. Sci. 2017, 12, 12009–12018. [Google Scholar] [CrossRef]
- Zubenko, D.; Singh, S.; Rosen, B.A. Exsolution of Re-alloy catalysts with enhanced stability for methane dry reforming. Appl. Catal. B Environ. 2017, 209, 711–719. [Google Scholar] [CrossRef]
- Liu, X.; Wang, L.S.; Ma, Y.T.; Zheng, H.F.; Lin, L.; Zhang, Q.F.; Chen, Y.Z.; Qiu, Y.L.; Peng, D.L. Enhanced Microwave Absorption Properties by Tuning Cation Defificiency of Perovskite Oxides of Two-Dimensional LaFeO3/C Composite in X-Band. ACS Appl. Mater. Int. 2017, 9, 7601–7610. [Google Scholar] [CrossRef]
- Joula, M.H.; Farbod, M. Synthesis of uniform and size-controllable carbon nanospheres by a simple hydrothermal method and fabrication of carbon nanosphere super-hydrophobic surface. Appl. Surf. Sci. 2015, 347, 535–540. [Google Scholar] [CrossRef]
- Yang, J.; Hu, R.S.; Meng, W.W.; Du, Y.F. A novel p-LaFeO3/n-Ag3PO4 heterojunction photocatalyst for phenol degradation under visible light irradiation. Chem. Commun. 2016, 52, 2620–2623. [Google Scholar] [CrossRef]
- Ren, X.; Yang, H.T.; Gen, S.; Zhou, J.; Yang, T.Z.; Zhang, X.Q.; Cheng, Z.H.; Sun, S.H. Controlled growth of LaFeO3 nanoparticles on reduced graphene oxide for highly effiffifficient photocatalysist. Nanoscale 2016, 8, 752–756. [Google Scholar] [CrossRef]
- Wang, K.X.; Niu, H.L.; Chen, J.S.; Song, J.M.; Mao, C.J.; Zhang, S.Y.; Gao, Y.H. Immobilizing LaFeO3 nanoparticles on carbon spheres for enhanced heterogeneous photo-Fenton like performance. Appl. Surf. Sci. 2017, 404, 138–145. [Google Scholar] [CrossRef]
- Cao, E.S.; Yang, Y.Q.; Cui, T.T.; Zhang, Y.J.; Hao, W.T.; Sun, L.; Peng, H.; Deng, X. Effect of synthesis route on electrical and ethanol sensing characteristics for LaFeO3-nanoparticles by citric sol-gel method. Appl. Surf. Sci. 2017, 393, 134–143. [Google Scholar] [CrossRef]
- Deganello, F.; Testa, M.L.; Parola, V.L.; Longo, A.; Tavares, A.C. LaFeO3-based nanopowders prepared by a soft-hard templating approach: The effffect of silica texture. J. Mater. Chem. A 2014, 2, 8438–8447. [Google Scholar] [CrossRef]
- Li, Z.X.; Shen, Y.; Yang, C.; Lei, Y.C.; Guan, Y.H.; Lin, Y.H.; Liu, D.B.; Nan, C.W. Signifificant enhancement in the visible light photocatalytic properties of BiFeO3-graphene nanohybrids. J. Mater. Chem. A 2013, 1, 823–829. [Google Scholar] [CrossRef]


Disclaimer/Publisher’s Note: The statements, opinions and data contained in all publications are solely those of the individual author(s) and contributor(s) and not of MDPI and/or the editor(s). MDPI and/or the editor(s) disclaim responsibility for any injury to people or property resulting from any ideas, methods, instructions or products referred to in the content. |
© 2022 by the authors. Licensee MDPI, Basel, Switzerland. This article is an open access article distributed under the terms and conditions of the Creative Commons Attribution (CC BY) license (https://creativecommons.org/licenses/by/4.0/).