Article

Source Apportionment and Risk Assessment of Soil Heavy Metals due to Railroad Activity Using a Positive Matrix Factorization Approach

1
The School of Public Administration, Southwest University of Finance and Economics, Chengdu 611130, China
2
Faculty of Geosciences and Environmental Engineering, Southwest Jiaotong University, Chengdu 611756, China
3
Graduate School, Tokyo University of Agriculture and Technology, Tokyo 1838509, Japan
*
Author to whom correspondence should be addressed.
Sustainability 2023, 15(1), 75; https://doi.org/10.3390/su15010075
Submission received: 7 November 2022 / Revised: 12 December 2022 / Accepted: 14 December 2022 / Published: 21 December 2022

Abstract

:
The effects of railway operation on soil environments are an important topic. In this research, soil samples were collected from two diesel-driven railways and two electric railways in Japan. A positive matrix factorization (PMF) model was applied to investigate the sources of eight heavy metals in the soil near the railways. The results showed that railway operation was the dominant anthropogenic source of heavy metals in the soil in the study areas among five potential sources, with contributions ranging from 11.73% to 42.55%. Compared with that of electricity-driven railways, the effect of diesel-driven railways was larger. The environmental risk-assessment analysis suggested that the soils near the selected railways fall within the weak-to-extremely strong contamination category, and experienced moderate-to-extremely strong ecological risk. A health risk assessment revealed that the soil presented both noncarcinogenic and carcinogenic risks for children, with ingestion as the principal exposure pathway. The PMF-Environment Risk Assessment and PMF-Human Health Risk Assessment models were developed to obtain the ecological and human health risks for every source category. Railway operation was regarded as the major factor influencing ecology and human health at the diesel-driven railway sampling sites. However, at electricity-driven railway sampling sites, natural sources were dominant.

1. Introduction

Heavy metals are ubiquitous pollutants and are detrimental to the environment due to their persistent, toxic, and nonbiodegradable characteristics [1]. Metals can be taken up into the human body through the trophic system, soil–plant–animal–human [2,3], and their adverse health effects in humans are well-established [4,5,6]. Although metals are present naturally in the environment due to volcanic eruptions, soil formation alongside river sedimentation, rainfall, and rock weathering [7], as development has progressed, anthropogenic sources, such as industrial facilities [8,9,10], mines [11,12,13], and agricultural activities [14,15], have been shown to increasingly contribute to heavy-metal contamination.
Railways are one of the most common public transportation routes at present. Previous studies have revealed that the operation of railways is related to the heavy-metal contents in the soil in the vicinity of railway areas [16,17,18,19,20]. However, the heavy metals in the soil usually originate from various sources. Therefore, identifying the specific sources of the heavy metals in the soil near railways and apportioning their corresponding contributions is critical for assessing the degree to which railways influence the environment. In general, the sources of soil heavy metals can be considered natural or anthropogenic. It is challenging to acquire more specific information since soil heavy metals usually originate from both parent materials, emissions from railway operations, and various other human activities. In addition, from the view of risk management and control, it is necessary to determine the effects of soil heavy metals on the environment and human health, and the contributions of potential sources to ecological risk and human health. In many places, railways are close to residential areas or agricultural fields. However, knowledge of the relationship between railway operation and ecological and health risks in soil remains limited. Positive matrix factorization (PMF) is one of the commonly used receptor models in the apportioning of element sources in the soil, water, and atmosphere [21,22,23,24]. Compared with other source-apportionment methods, PMF does not need to measure the source component spectrum. Meanwhile, in the PMF model, the standard deviation of data can be used for optimization, and the missing data and inaccurate data can be processed. However, there is still a limitation to the PMF model. A basic assumption of sources is not always satisfied when using PMF [25]. Therefore, the selection of sampling sites is one of the critical factors for the successful application of the PMF model.
In view of the above considerations, there were three main aims of the present study, as follows: (1) to find the contribution of railway operation to soil heavy metals; (2) to investigate the environmental and health risks of the soil in the vicinity of railways; (3) to assess the contributions of the identified sources to the environmental and health risks of soil heavy metals. In this research, four representative railways in Japan were selected as targets. A PMF model was applied to investigate the source apportionment of Cr, Mn, Co, Ni, Cu, As, Cd, and Pb in the soil near a railway. The geoaccumulation index (Igeo), potential-ecological-risk index (PERI), total hazard index (THI), and total cancer risk (TRC) were used to evaluate the environmental risk of soil heavy metals. Based on the research above, we combined models named positive matrix factorization–environmental risk assessment (PMF-ERA) and positive matrix factorization–human health risk assessment (PMF-HHRA) to determine the contributions of the identified sources to the environment and human health.

2. Materials and Methods

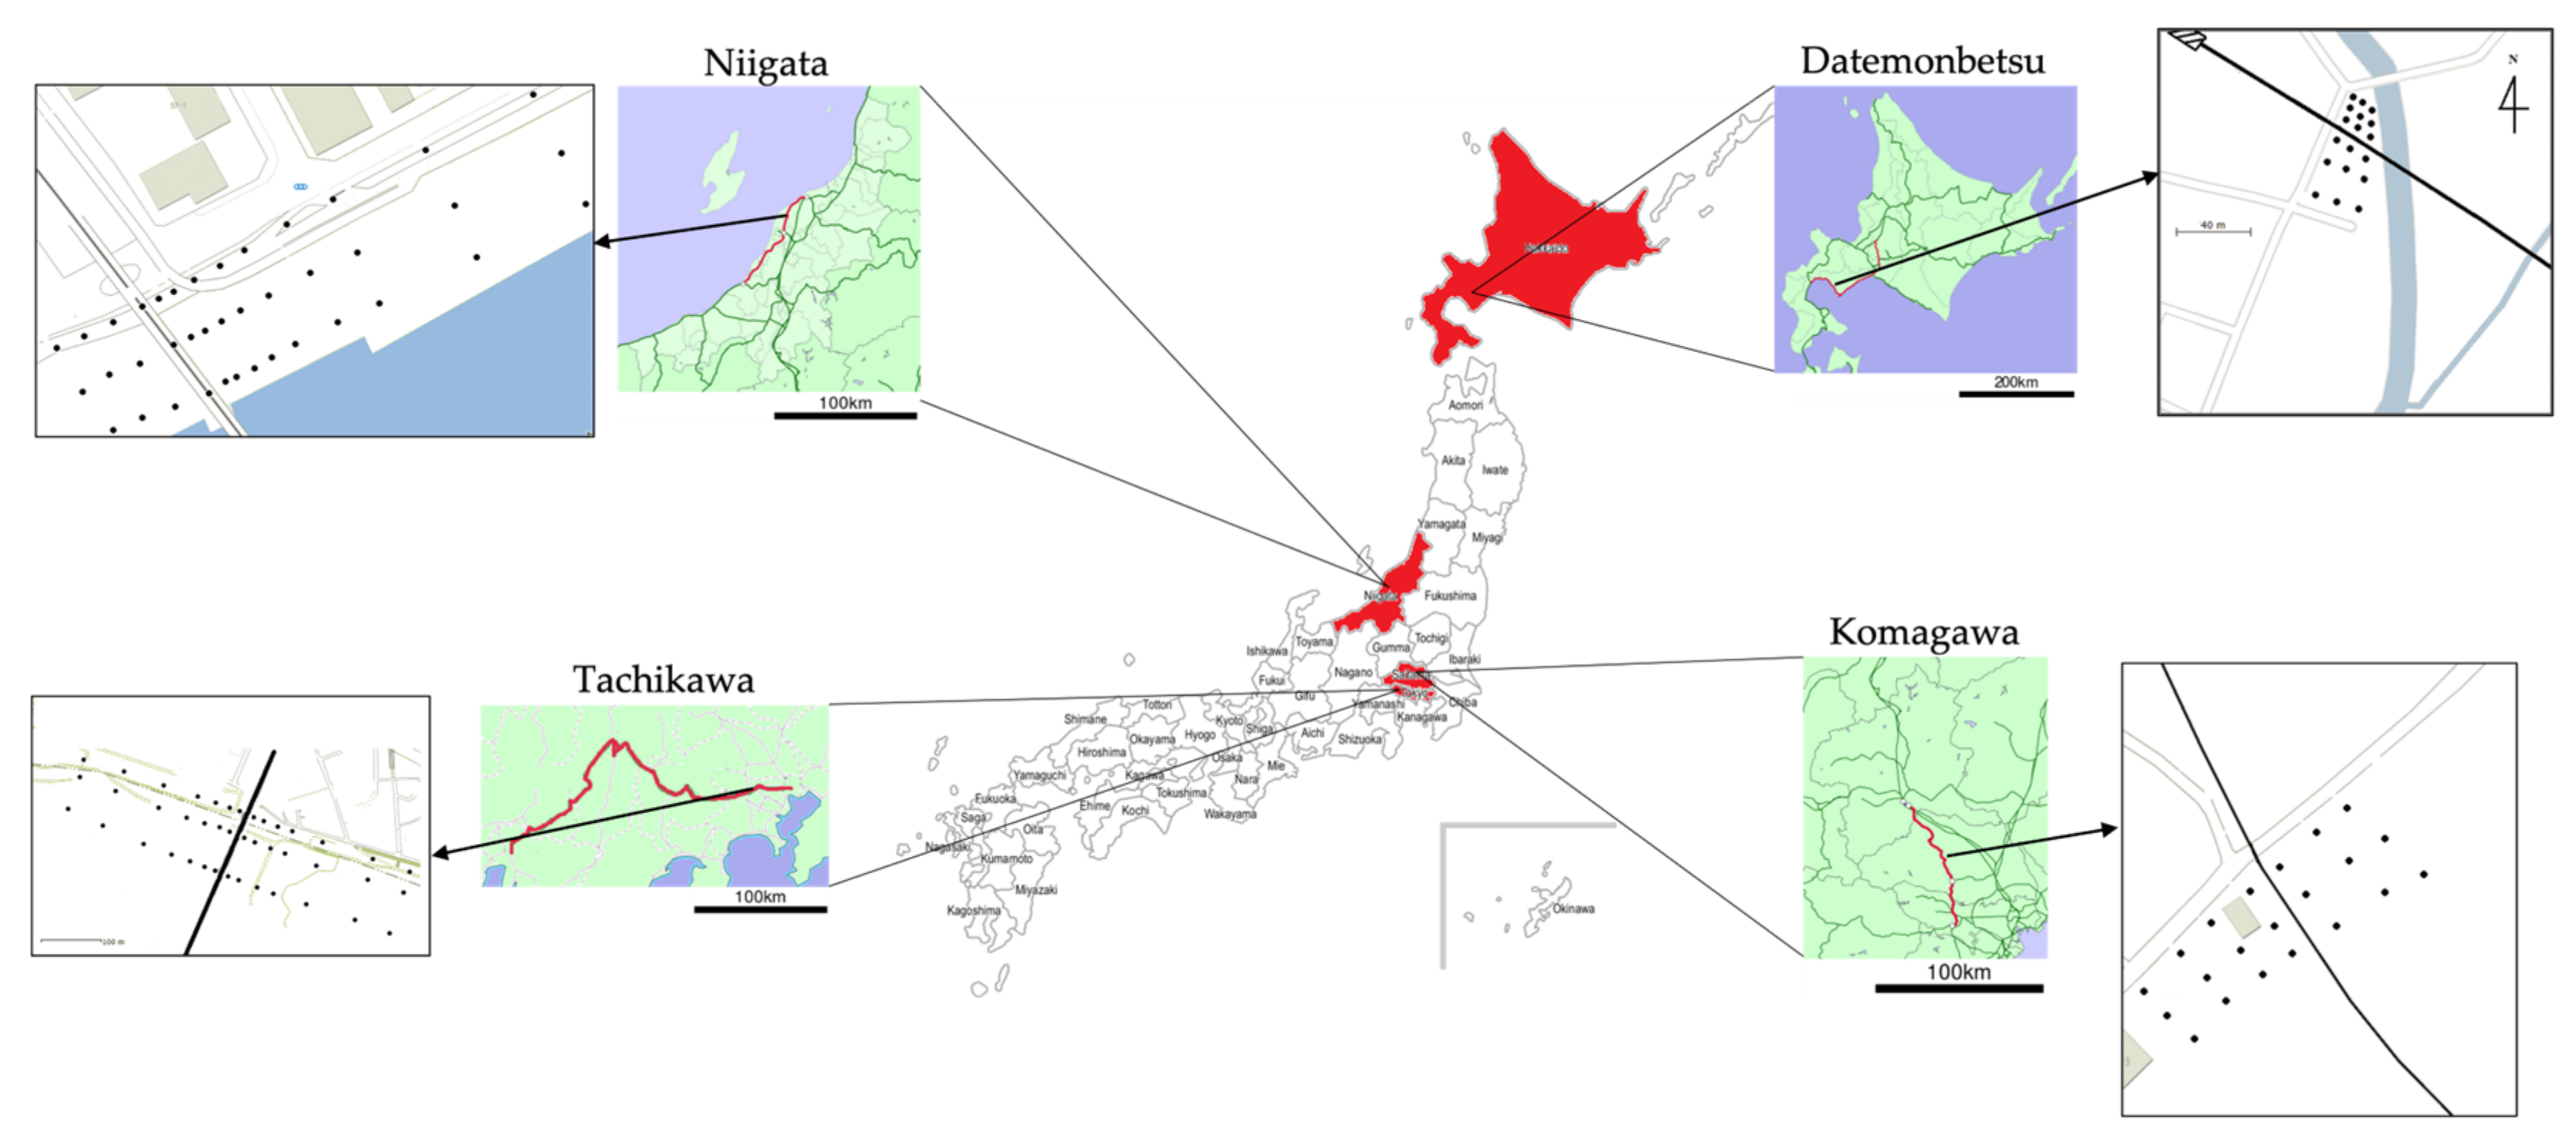
2.1. Study Area and Railway Information

Samples were collected in four areas in Japan: Datemonbetsu in Hokkaido (42°28′14″ N–140°51′58″ E), Komagawa in Saitama (35°54′18″ N–139°19′49″ E), Tachikawa in Tokyo (32°42′07″ N–139°50′13″ E), and Niigata city in Niigata (37°54′38″ N–139°02′13″ E). The Datemonbetsu and Komagawa sampling sites were located in the countryside, while the Tachikawa and Niigata sampling sites were located in urban areas. In brief, the main land-use type of the sampling areas was public green space. The topography of all the sampling areas was planted flat ground. There was a road beside each sampling area (Figure 1).
Trains on the railway in the Datemonbetsu and Komagawa sampling areas are driven by diesel and are named the Muroran main line and Hachigo line, respectively. The selected railways in Tachikawa and Niigata are the Chuo main line and Echigo line, respectively, which are electricity-driven. The Muroran main line and Chuo main line have both passenger and cargo trains. The frequency of the former line is 51 passenger trains/day and 43 cargo trains/day. The Chuo main line has 482 passenger trains per day and 64 cargo trains per day. The other two lines have only passenger trains, with frequencies of 40 and 83 trains/day, respectively. All the railways have been in operation for over 80 years at least.

2.2. Sampling and Analysis

In this research, samples were collected through the following strategies. Surface soil (<3 cm) samples were collected at various distances from the track for different areas of the selected sites (Figure 1). At each distance, the samples were collected by plastic brushing from three random sampling locations. Polythene bags were used to store the samples temporarily. The samples were dried in a drying oven at 50 °C for 48–72 h in the laboratory; after that, they were crushed and sieved for analysis [26].
In this research, Cr, Mn, Co, Ni, Cu, As, Cd, and Pb were selected as targets for analysis. Digestion for the analysis of heavy metals was carried out by using hydrofluoric acid (HF). To each polytetrafluoroethylene (PTFE) beaker, 1.00 g of sample, 10 mL of nitric acid (HNO3), and 2.5 mL of perchloric acid (HClO4) were added, and these beakers were then heated to 140 °C until the digestate was almost dried. Subsequently, 2.5 mL of HClO4 and 10 mL of HF were added to each beaker. Fifteen minutes after the appearance of white smoke, another 10 mL of HF was added to the beakers. The beaker was heated until dry again, and 5 mL of HCl (20%) and 1.0 mL of HNO3 were added. After boiling for 1 h, 15 mL of ultrapure water was added to each beaker, and they were boiled for an additional hour. At last, the digestate was filtered and diluted for analysis. All the heavy metals were analyzed by inductively coupled plasma–mass spectrometry (Agilent 7500, Yokogawa, Tokyo, Japan). The samples were divided into four groups for analysis. Each group included three blanks. Descriptive statistical analysis and difference analysis were performed using IBM SPSS Statistics 26.

2.3. PMF Model

PMF is a multivariate factor analysis tool introduced by Paatero and Tapper [27]. PMF decomposes a matrix of speciated sample data into two matrices: factor contributions and factor profiles. In this study, EPA PMF v5.0 software was applied to estimate the potential sources of heavy metals in soil near the railway tracks. The equation is as follows:
x i j = k = 1 p g i k f k j + e i j
where x i j is the concentration of heavy metal j in sample i, g i k is the factor contributing to the sample, f k j is the source profile of element j for the k source factor, and e i j is the residual matrix.
The factor contributions and factor profiles were obtained using the objective function Q:
Q = i = 1 n j = 1 m e i j u i j 2
where u i j is the uncertainty of heavy metal j in sample i.
u i j = 5 6 × M D L   ( i f   x i j M D L )
u i j = σ j × x i j 2 + 0.5 × M D L 2   ( i f   x i j > M D L )
where MDL is the method detection limit and σ j is the relative standard deviation (RSD) of heavy metal j. More detailed information about the software can be found in reference [28].

2.4. Environmental Risk Assessment

2.4.1. Geoaccumulation Index (Igeo)

The geoaccumulation index is a method to evaluate heavy-metal contamination using the following equation [29]:
I g e o = l o g 2 C n / 1.5 B n
where Cn represents the heavy-metal concentration in the samples, while Bn is the background concentration of the corresponding element. In this research, the background values of the soil were determined in Japan [30]. According to Mullar’s research, the degree of heavy-metal contamination can be classified into seven levels (Table 1) [29] (Mullar, 1969).

2.4.2. Potential Ecological Risk Index (PERI)

The potential ecological risk index was first applied by Hakanson [31] to analyze the pollution strength of heavy metals. The PERI considers the toxicity and sensitivity of elements in soil. The equation of the PERI is as follows:
P E R I = i = 1 n E r i
E r i = T r i × C r i
C r i = C i / C n i
where E r i is the index of heavy metal i and T r i is the toxic response factor of metal i. In this research, the T r i values of the studied elements are Mn = 1, Cr = 2, Cu = 5, Pb = 5, Ni = 5, Co = 5, As = 10, and Cd = 30 [32]. C r i is the individual contamination index of element i, C i represents the heavy-metal concentration in the samples, and C n i is the background value of the elements, as described above.
In this research, the maximum T r i is 30, according to the potential ecological risk index classification method [33]. The upper limit of the first level of E r i is calculated by the value of the maximum T r i multiplied by the contamination index of the nonpolluted element. The upper limit of the second level is double the upper limit of the first level. The upper limit of the first level of the risk index is calculated by the sum of T r i of selected elements multiplied by the contamination index of nonpolluted elements (Table 2) [34].

2.4.3. PMF-ERA

In this research, a PMF-ERA was developed to quantitatively assess the potential ecological risk for identified heavy-metal sources by combining a PMF model and a PERI model. First, a PMF model was applied to determine the contributions of various potential sources of heavy metals. Then, the contribution of heavy metals from different sources and the concentration of heavy metals were multiplied. Finally, the potential ecological risk from various sources in each sample was obtained by an ERA model using source-based heavy-metal concentrations [28].
The source-based heavy-metal concentration was calculated by the following equation:
C j k i = P j k i × C i
where C j k i is the concentration of heavy metal j from source k in sample i (mg/kg), P j k i is the contribution of heavy metal j from source k in sample i, and C i represents the heavy-metal concentration in the samples. The source-oriented potential ecological risk was calculated by Equations (6) and (7), using C j k i instead of C i in these two equations.

2.5. Health Risk Assessment

2.5.1. Noncancer and Cancer Risks

Human health risk assessments include noncancer risk and cancer assessment. Noncancer risk is assessed by the HI, and the equation is as follows [35]:
H I = H Q i = A D D i R f D i
where HQ is the hazard quotient of elements and ADD(i) is the average daily dose of element i by three exposure pathways. If the value of HI is > 1, it could be considered as indicating potential noncarcinogenic risk, while HI < 1 indicates no noncarcinogenic risk.
The cancer risk was analyzed using the following equation:
T C R = A D D i × S F i
where TCR is the total cancer risk and SF(i) is the cancer-risk index of element i by three exposure pathways. As recommended by the International Commission on Radiological Protection (ICRP), the maximum acceptable TCR is 5.0 × 10⁻⁵.
The ADD of the three pathways was estimated with the following equations:
A D D i n g = C × R i n g × E F × E D × C F B W × A T
A D D i n h = C × R i n h × E F × E D P E F × B W × A T
A D D d e r = C × S A × A F × A B S × E F × E D × C F B W × A T
where ADDing is the average daily dose by ingestion, ADDinh is the average daily dose by inhalation, and ADDder is the average daily dose by dermal contact. C is the concentration of elements in the samples. All other parameters in the above equations are listed in Table S1 [36,37,38,39].

2.5.2. PMF-HHRA

Similar to the PMF-ERA model, a PMF-HHRA was developed to quantitatively assess the human health risk from identified heavy-metal sources by combining a PMF model and an HHRA model. The calculation method was similar to the PMF-ERA model, using Equations (12)–(14) with C j k i .

3. Results and Discussions

3.1. Contamination Characteristics

3.1.1. Descriptive Statistics of Heavy Metals

In this research, Takeda’s research was selected as the background value [30]. As shown in Table 3, the average concentrations of Cu and Pb at all sampling sites exceeded the background values. In addition, the coefficients of variation of Cu exceeded 1.0 in three areas, and Pb exceeded 1.0 in two areas, reflecting a wider extent of variability in their means. These results indicated that the contents of these two elements were affected by human activities. The mean concentrations of Cr, Mn, Co, Ni, As, and Cd exceeded the background concentrations at Datemonbetsu, Komagawa, and Tachikawa. The mean concentrations of Cr, Mn, and Co at the Komagawa sampling site were higher than those in other areas. The Datemonbetsu sampling site had the highest mean concentrations of Ni, Cu, and As. The highest mean concentrations of Cd and Pb were found in Tachikawa. One explanation might be that Tachikawa is located in Tokyo, which means there may be more automobile emissions than at other sampling sites. More discussion about potential sources is presented in Section 3.2.

3.1.2. Difference Analysis

To assess significant differences in heavy metals in soil samples from four sampling zones, the Kruskal–Wallis H test was applied in this research. The p-values of all the elements were smaller than 0.05. The differences in the concentrations of all selected elements were statistically significant in the sampling zones. Two independent sample tests (Mann–Whitney U) were conducted to determine whether the concentrations differed between samples from diesel-driven and electronic-driven railways. The p-values of Cr, Ni, and Cu were higher than 0.05, indicating that the concentrations of these three elements in the soil in the vicinity of the two kinds of railways were not significantly different from each other. These results indicated that both types of railways had similar effects on the contents of Cr, Ni, and Cu in the soil samples.

3.2. Source Apportionment by PMF

3.2.1. Results of the Positive Matrix Factorization Model

To execute the model and interpret the results, previous research on the sampling areas was needed. As shown in Figure 2, four factors were extracted for the four sampling areas. The extracted source profiles for Datemonbetsu and Komagawa were similar, suggesting that heavy metals in the soil originated from similar sources. Railway operation, automobile emissions, agricultural activities, industrial activities, and natural sources were determined to be potential main sources of the heavy metals in the soil based on two criteria: first, these five factors could encompass the majority of soil heavy metals in the study area; and second, these five factors had different effects on the concentrations of heavy metals in the soil. The background values were applied to distinguish which heavy metals were mainly from natural sources or anthropogenic sources. The factor dominating the loading of heavy metals with concentrations lower than the background can be considered a natural source. On the other hand, anthropogenic sources need further analysis based on anthropogenic activities in the sampling area to identify specific sources. Normally, one heavy metal may originate from several potential sources; in this situation, all these potential sources need to be considered.
In this research, the mean concentrations of Cd in Datemonbetsu, As in Tachikawa, and Cr, Mn, Co, Ni, and As in Niigata were lower than the background values. The soil parent material could be considered the dominant source of these elements. The second factor in Datemonbetsu, Tachikawa, and Niigata had high loadings of elements with lower concentrations than the background. Therefore, factor two for these three sampling sites was inferred to be a natural source.
At the Datemonbetsu sampling site, the mean concentrations of Cr, Ni, Cu, Cd, and Pb were larger than the background values, indicating that these heavy metals in the soil mainly originated from, or may be affected by, anthropogenic activities. The distribution of these four elements in the soil had a strong relationship with the distance to the trailway, and a higher concentration was found in samples closer to the track. Thus, the operation of railways was considered to be the main anthropogenic source of these elements in the soil. These results are supported by previous studies [40,41,42,43,44]. It can be clearly noticed that factor one had a high loading of these heavy metals. Then, the same situation was observed at the Komagawa sampling site; factor one had the highest loading of these five elements. Therefore, factor one at the Datemonbetsu and Komagawa sampling sites was inferred to have been affected by railway operation. At the Tachikawa and Niigata sampling sites, the highest concentrations of Cu, As, Cd, and Pb were found in samples collected close to the railway. In addition, the mean concentrations of these elements exceeded background values. These results indicated that the operation of railways was the main anthropogenic source of these elements. Factor four had high loadings of Cu, As, Cd, and Pb in these two sampling zones. It could be concluded that factor four was affected by railway operation.
Previous studies have revealed that automobile exhaust has an effect on the contents of Pb and Cu [45,46,47,48]. In this research, all sampling sites were close to at least one road; therefore, another potential anthropogenic source of heavy metals in the soil was from automobiles. At the Datemonbetsu and Komagawa sampling sites, factor three had a relatively high loading of these elements and could be identified as having been affected by automobile emissions. Similarly, factor one in Tachikawa and factor three in Niigata had high loadings of these two elements. They were inferred to have been affected by automobile emissions. The fourth factor for Datemonbetsu and Komagawa had high Co loadings, followed by Mn loadings. Previous studies have revealed that Co in soil mainly originates from agricultural or industrial sources [49,50]. These two sampling zones were located in the countryside in Hokkaido and Saitama. Among the main activities in the area are agricultural activities, such as irrigation, pesticide application, and fertilization. Therefore, factor four in Datemonbetsu represented agricultural activities. The third factor in Tachikawa and the first factor in Niigata were weighted by Cu, Pb, and As. These two sampling sites were in city areas. According to previous studies, industrial activities in cities are anthropogenic sources of these elements [51,52,53]. Thus, factor three in Tachikawa and factor one in Niigata might represent industrial activities. Finally, factor one at the Komagawa sampling site was identified as having been affected by industrial activities. One reason for this identification was that the concentrations of Cr, Co, and Cu in all samples collected there were higher than the background values, indicating that these heavy metals were affected by industrial activities, which was the last candidate source in this research. Another reason could be that even though the sampling site in Komagawa was in the countryside, there were two vehicle repair plants and a warehouse nearby. Thus, it was reasonable to attribute heavy metals in the soil to industrial activities in these areas.
In summary, a range of sources, including railway operations, automobile emissions, agricultural activities, industrial activities, and natural sources, contributed to the heavy metals detected in the soil samples in this research. However, the results revealed that there were certain differences in the source contributors among the four sampling sites, even though there were some similar conditions among these four areas.

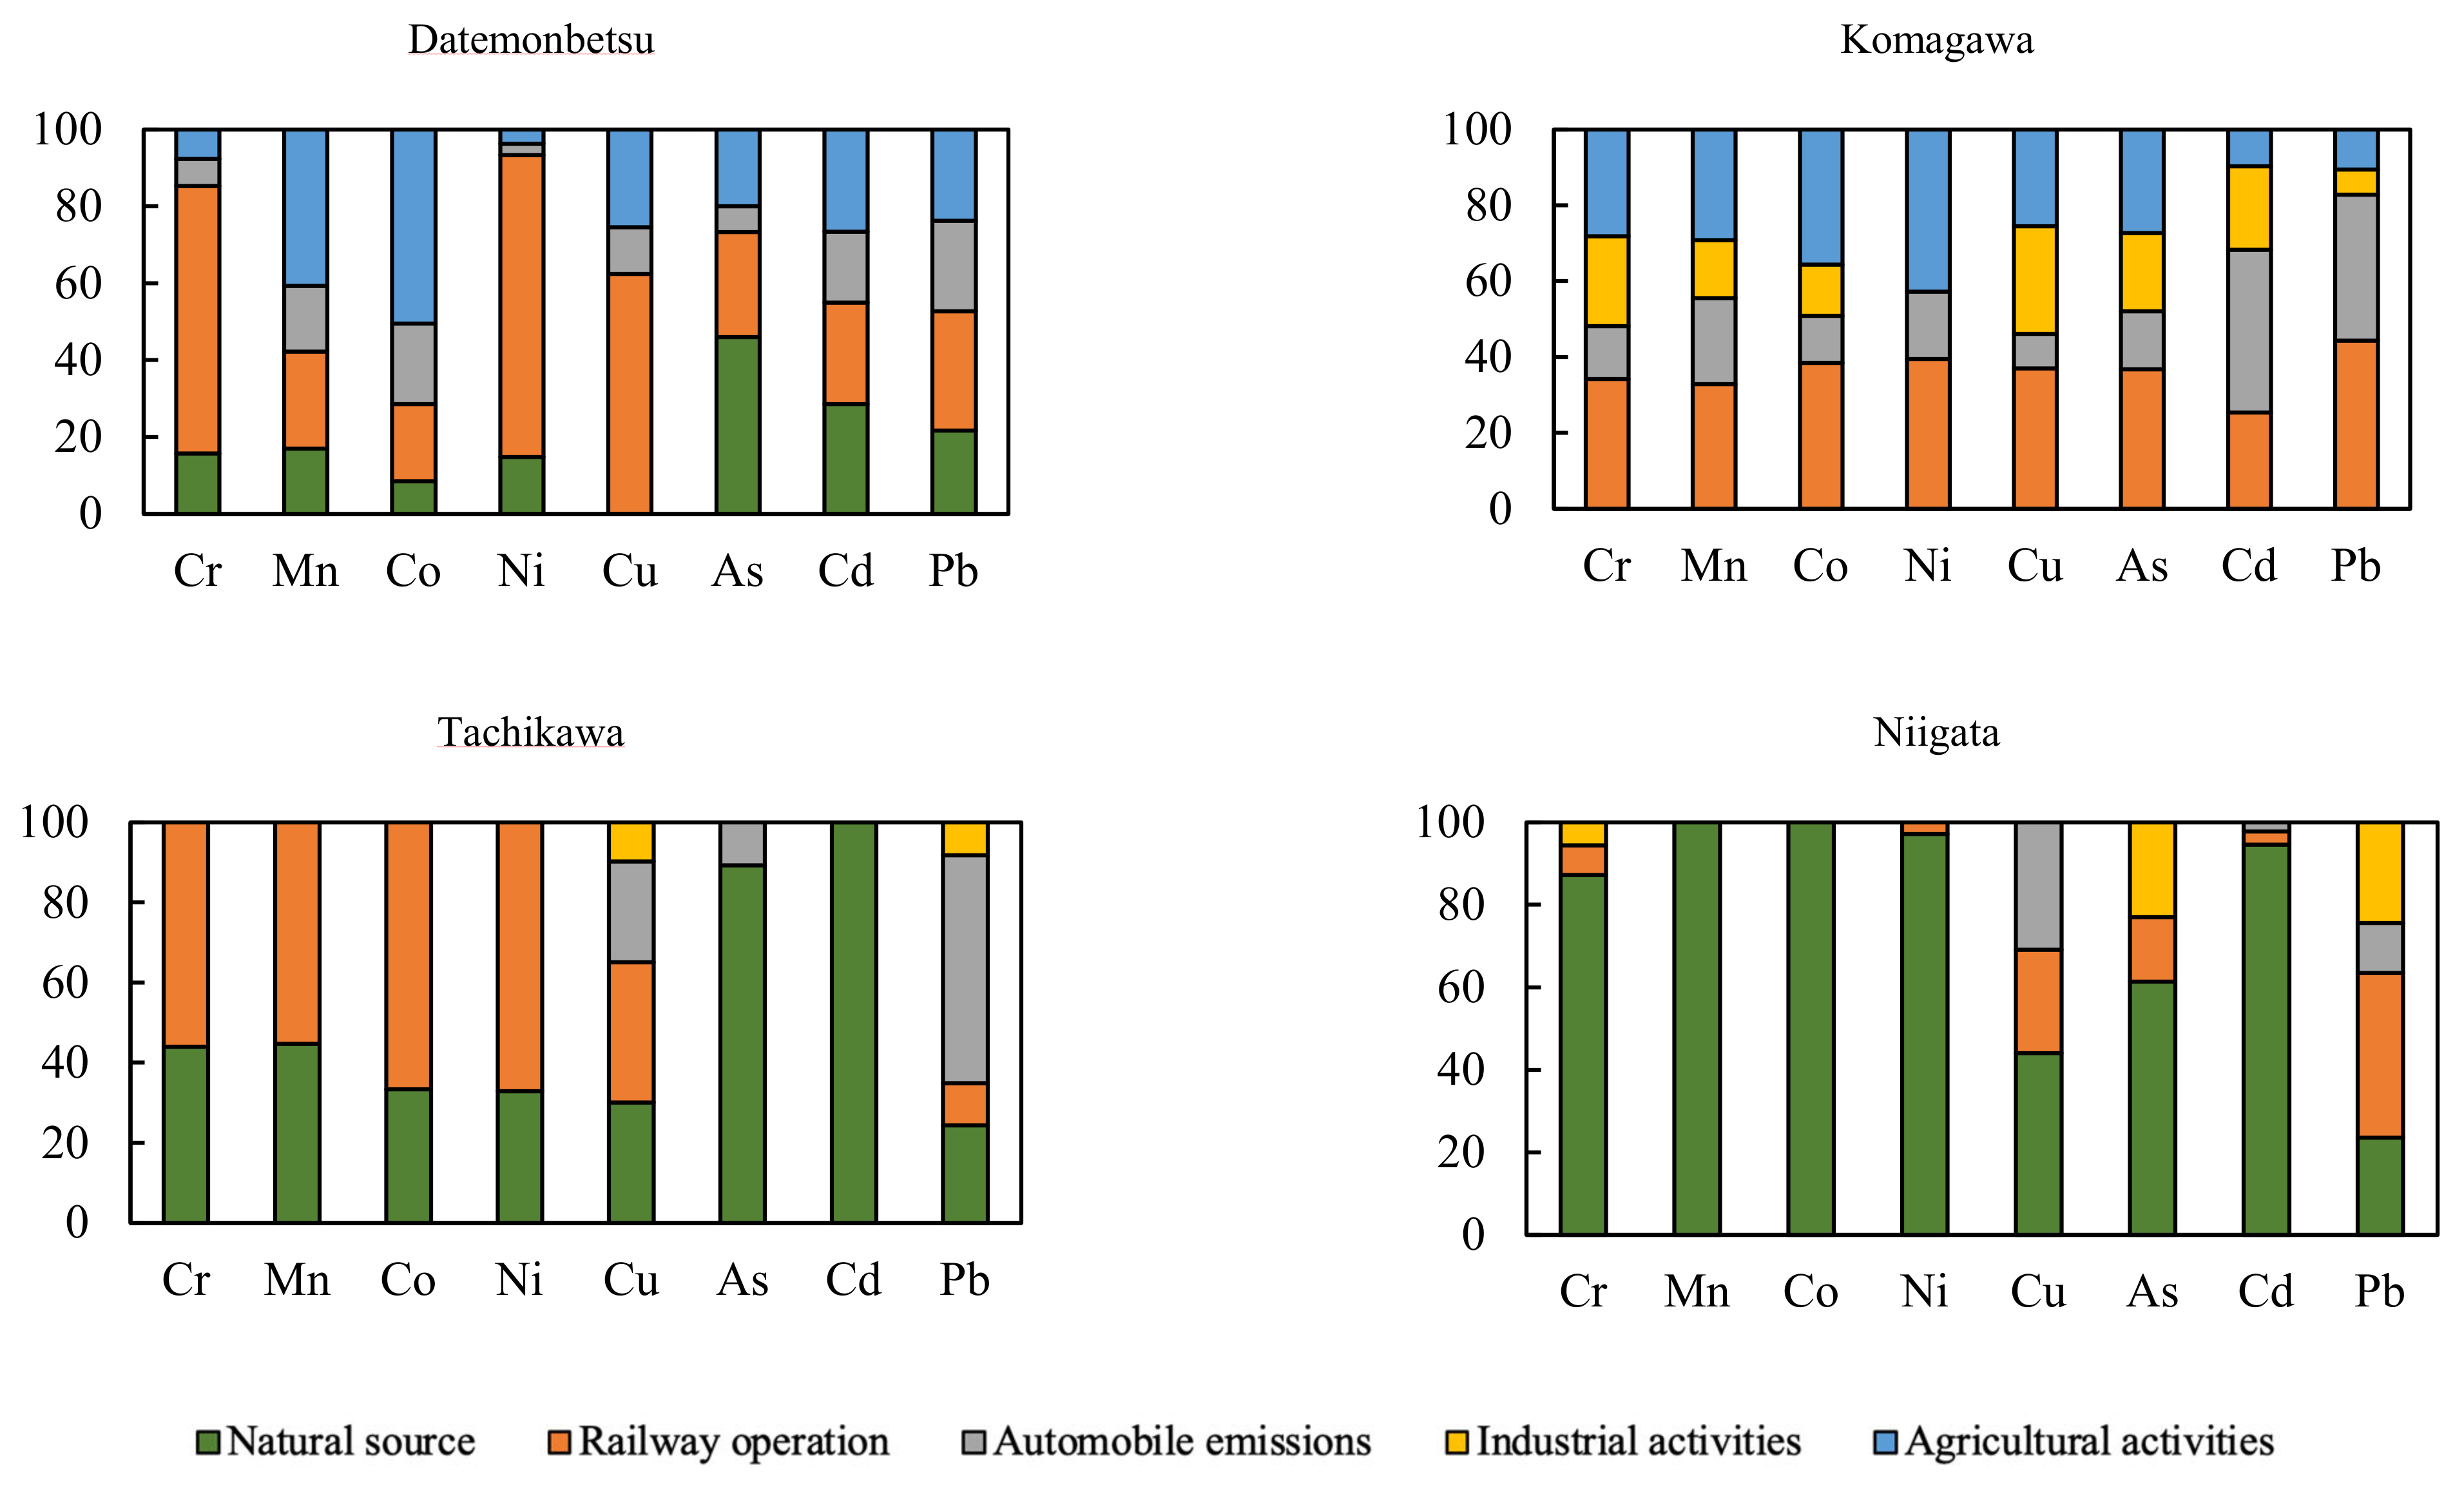
3.2.2. Source Contributions

Each source contribution for each heavy metal could be determined by the factor score derived from the PMF model. The percent contribution of each source to the soil samples was described based on the average of individual percent contributions. As shown in Table 4, at all sampling sites, railway operation was the main anthropogenic source, contributing 11.73% to 42.55%. The second dominant source in in Datemonbetsu and Komagawa was agricultural activities at 24.81% and 26.13%, respectively. As the second dominant anthropogenic source, automobile emissions contributed 11.6% of the heavy metals in the soil in Tachikawa. In Niigata, natural sources contributed more than 75% of the heavy metals. In Tachikawa, this percentage was almost 50%. Thus, natural sources were the main sources of heavy metals in these two zones. In conclusion, in soil near diesel-driven railways, railway operation was the major source of heavy-metal pollution, whereas near electricity-driven railways, railway operation was the second major contributor. These results indicated that diesel-driven railways had a stronger influence on soil heavy metal than electricity-driven railways.
The source contributions of the elements are shown in Figure 3. In Datemonbetsu, Komagawa, and Tachikawa, railway operation was the main source of Cr, Ni, and Cu. The dominant sources of As and Cd were natural sources in all zones, with the exception of Komagawa. Lead in the soil samples mainly originated from automobile emissions in this research. The contents of Mn and Co were from different sources among the different sampling sites. In the Datemonbetsu and Komagawa zones, agricultural activities were determined to be the main source for these two heavy metals. At the Tachikawa sampling site, the heavy metals were emitted from railway operations. In Niigata, Mn and Co were from natural sources. The contributions of industrial activities ranged from 2.25 to 16.28%. Furthermore, industrial activities were not the dominant source for any elements in all sampling zones, indicating that industrial activities were not the main anthropogenic source in this research.
In this research, the associated uncertainty was evaluated indirectly through the displacement–boot strap (DISP-BS) method. For DISP, the derived factors showed no factor swaps for the cases, suggesting a well-defined PMF solution. The change in percentage for the Q robust parameter (%dQrobust) in the constrained run was 0.5%, much less than the maximum permissible change in the recommended value (5%) [29], indicating that the DISP results were acceptable. For BS error analysis, it could be observed that there were no unmapped factors, which indicates the reliability of the base run results. Therefore, in this research, the PMF results are acceptable.

3.3. Environmental Risk Assessment by PMF-ERA

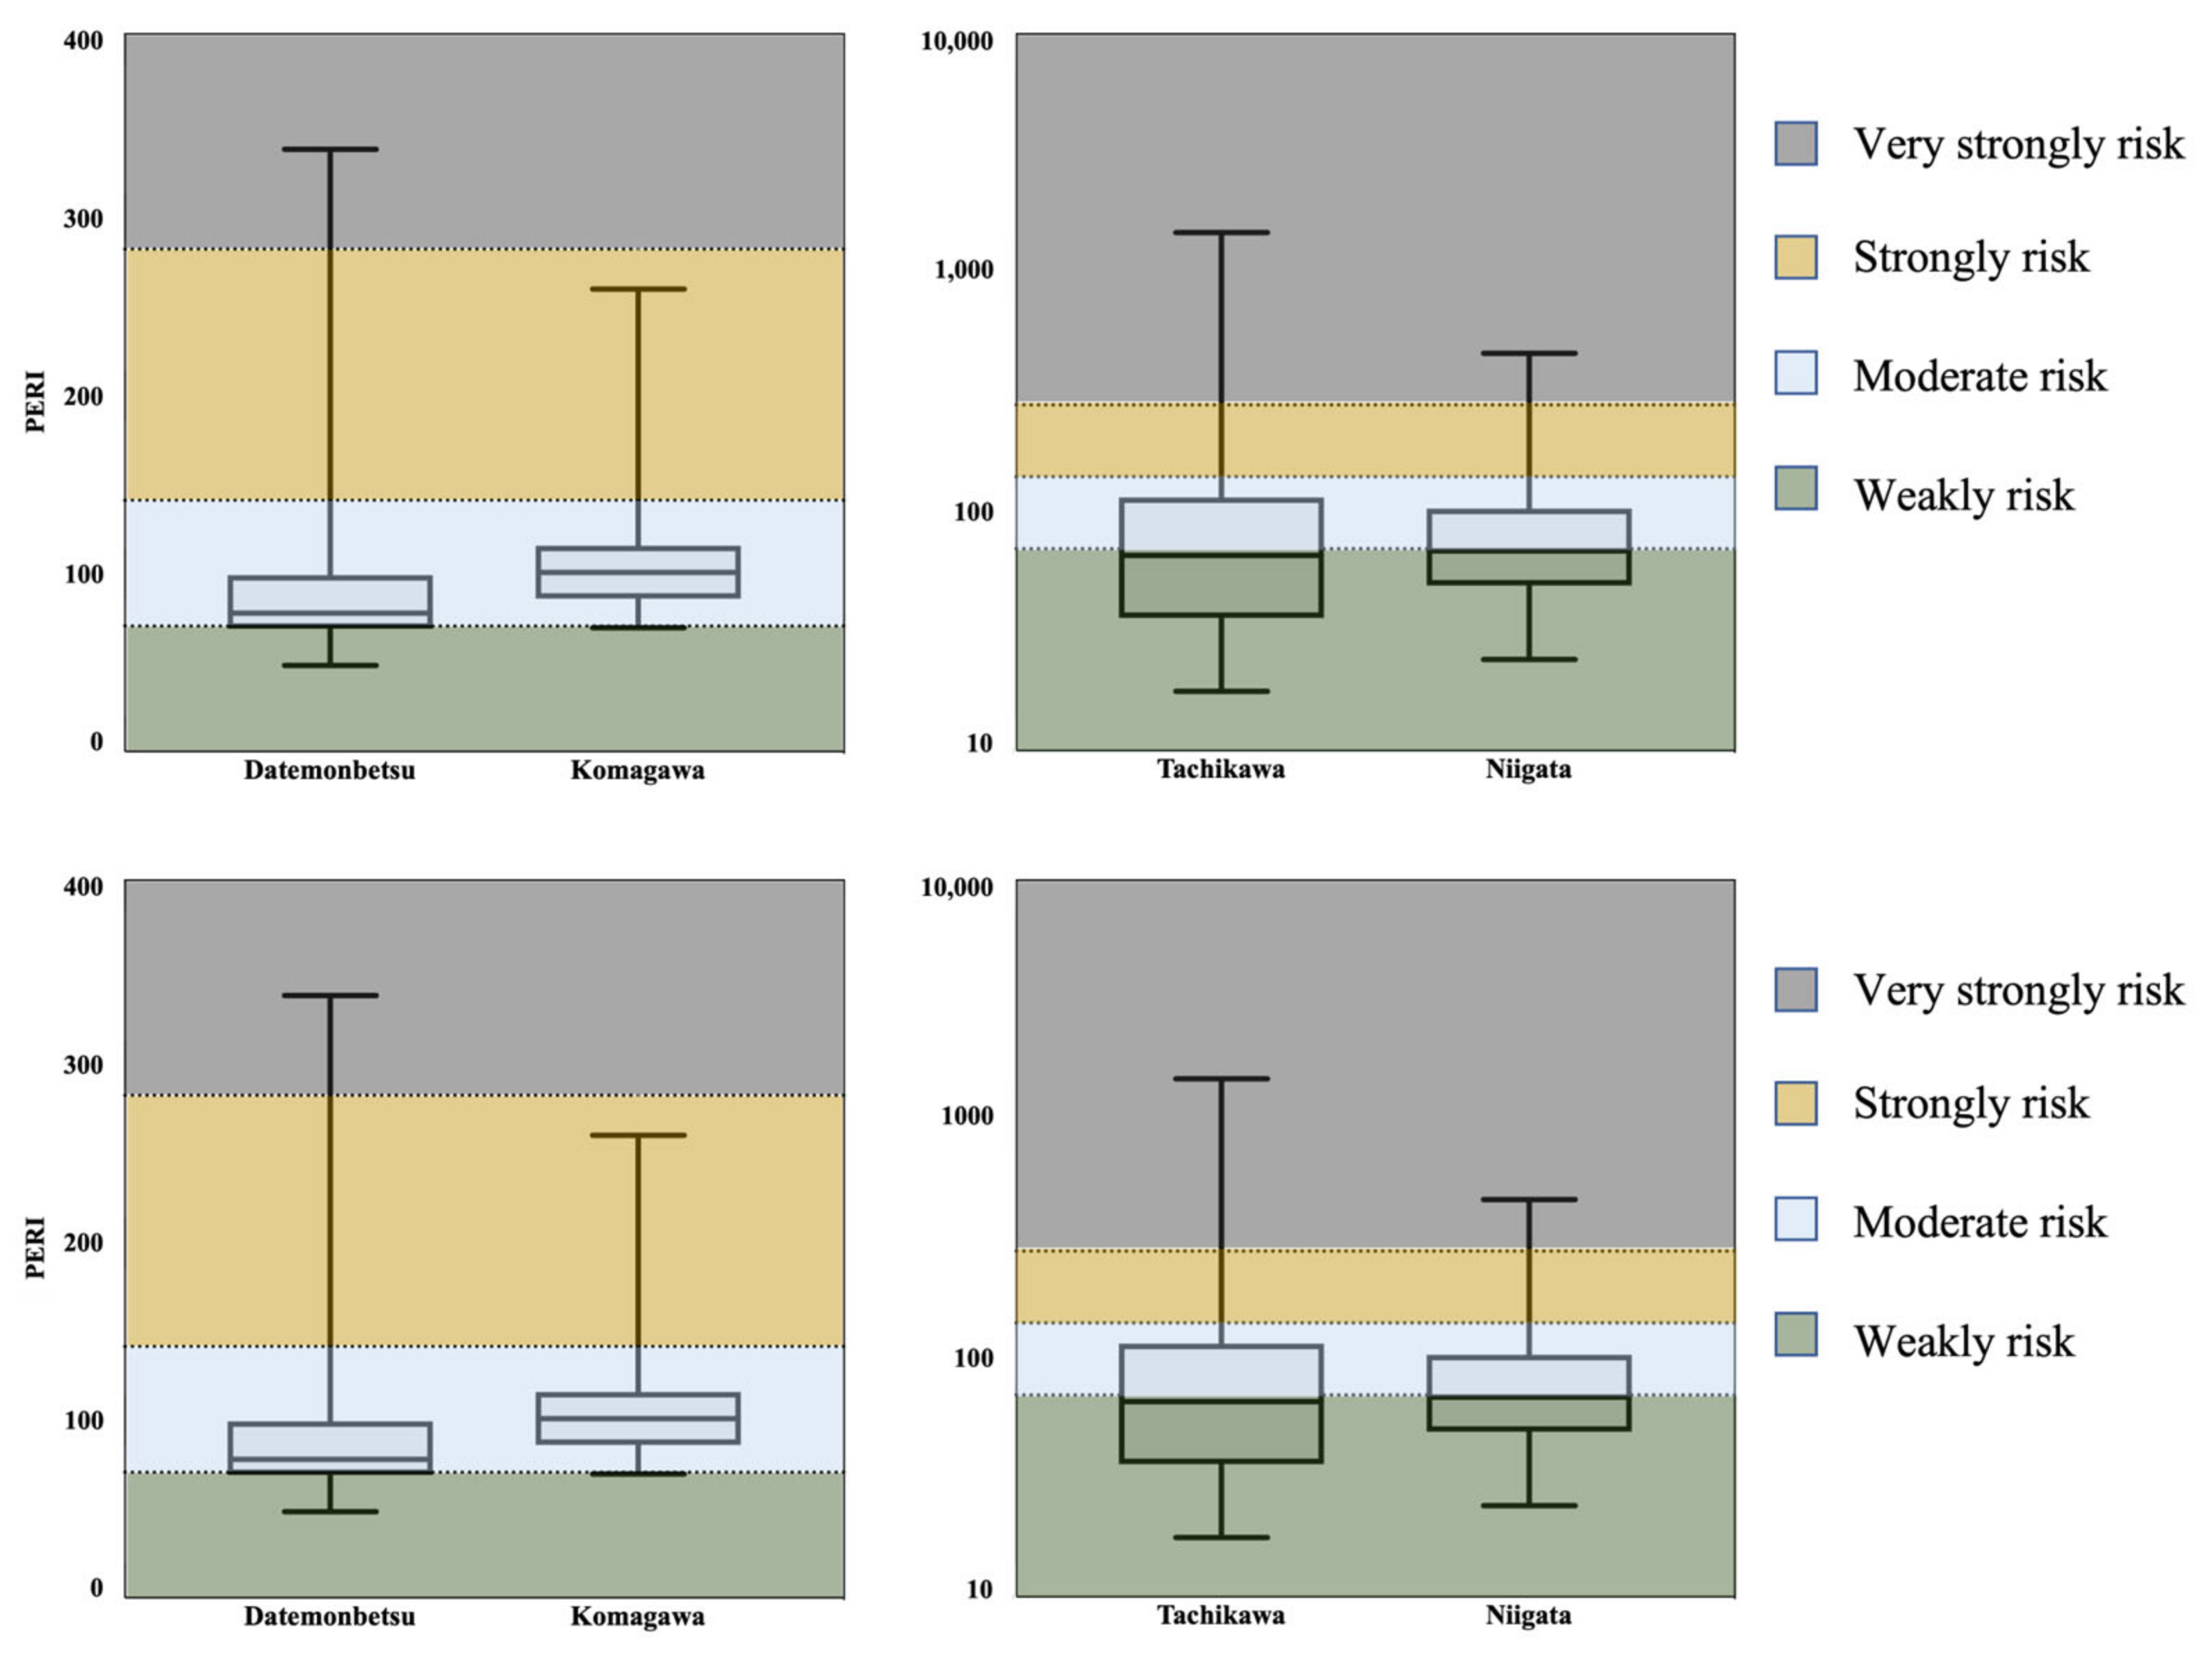
3.3.1. Concentration-Oriented Environmental Risk Assessment

The calculated Igeo values for each metal in the soil samples are shown in Figure 4. It can be noticed that in Datemonbetsu, all elements showed at least “moderate contamination”. The Igeo values of Cr and Cu were “strongly contaminated” and “extremely contaminated”, respectively. In Komagawa, the Igeo values of Cu in all samples showed “moderate contamination”, followed by Ni and Cr, whose Igeo values showed “moderate contamination” in 90% and 60% of the samples, respectively. The Igeo values of other elements showed “contamination” in less than 50% of the samples. In Tachikawa, Cu, Cd, and Pb showed “extremely contaminated”, while other elements showed “moderately contaminated” in less than 40% of the samples. In Niigata, the Igeo values of Cu and Pb showed “extremely contaminated”, while those of Cr, As, and Cd showed “moderately contaminated”. Mn, Co, and Ni fell under the “not to weakly contaminated” (Igeo < 0). These results indicated that selected elements in the soil in the vicinity of the railway caused different degrees of contamination.
According to the results of the potential ecological risk assessment (Figure 5), only Ni, Cu, Cd, and Pb showed different degrees of ecological risk in the different sampling zones. In Datemonbetsu, Cd in 36% of the samples showed moderate-to-strong ecological risk. In approximately 30% of the samples, Cu showed moderate-to-very strong ecological risk. Ni in only 10% of the samples showed moderate ecological risk. In Komagawa, only Cd showed ecological risk. However, the degree was moderate-to-very strong, and the percentage of risk samples was over 90%. The results in Tachikawa and Niigata were similar. Cu, Cd, and Pb showed moderate-to-extremely strong ecological risk. The cumulative value was used to calculate the PERI, as shown in Figure 6. At the Datemonbetsu and Komagawa sampling sites, the mean PERI of elements showed moderate risk, which was higher than that in Tachikawa and Niigata. The highest values of the PERI in all zones ranged from 257.75 to 1473.75 and were found in samples closest to the track. This result indicated that ecological risk of heavy metals near diesel-driven railways was higher than electricity-driven railways.

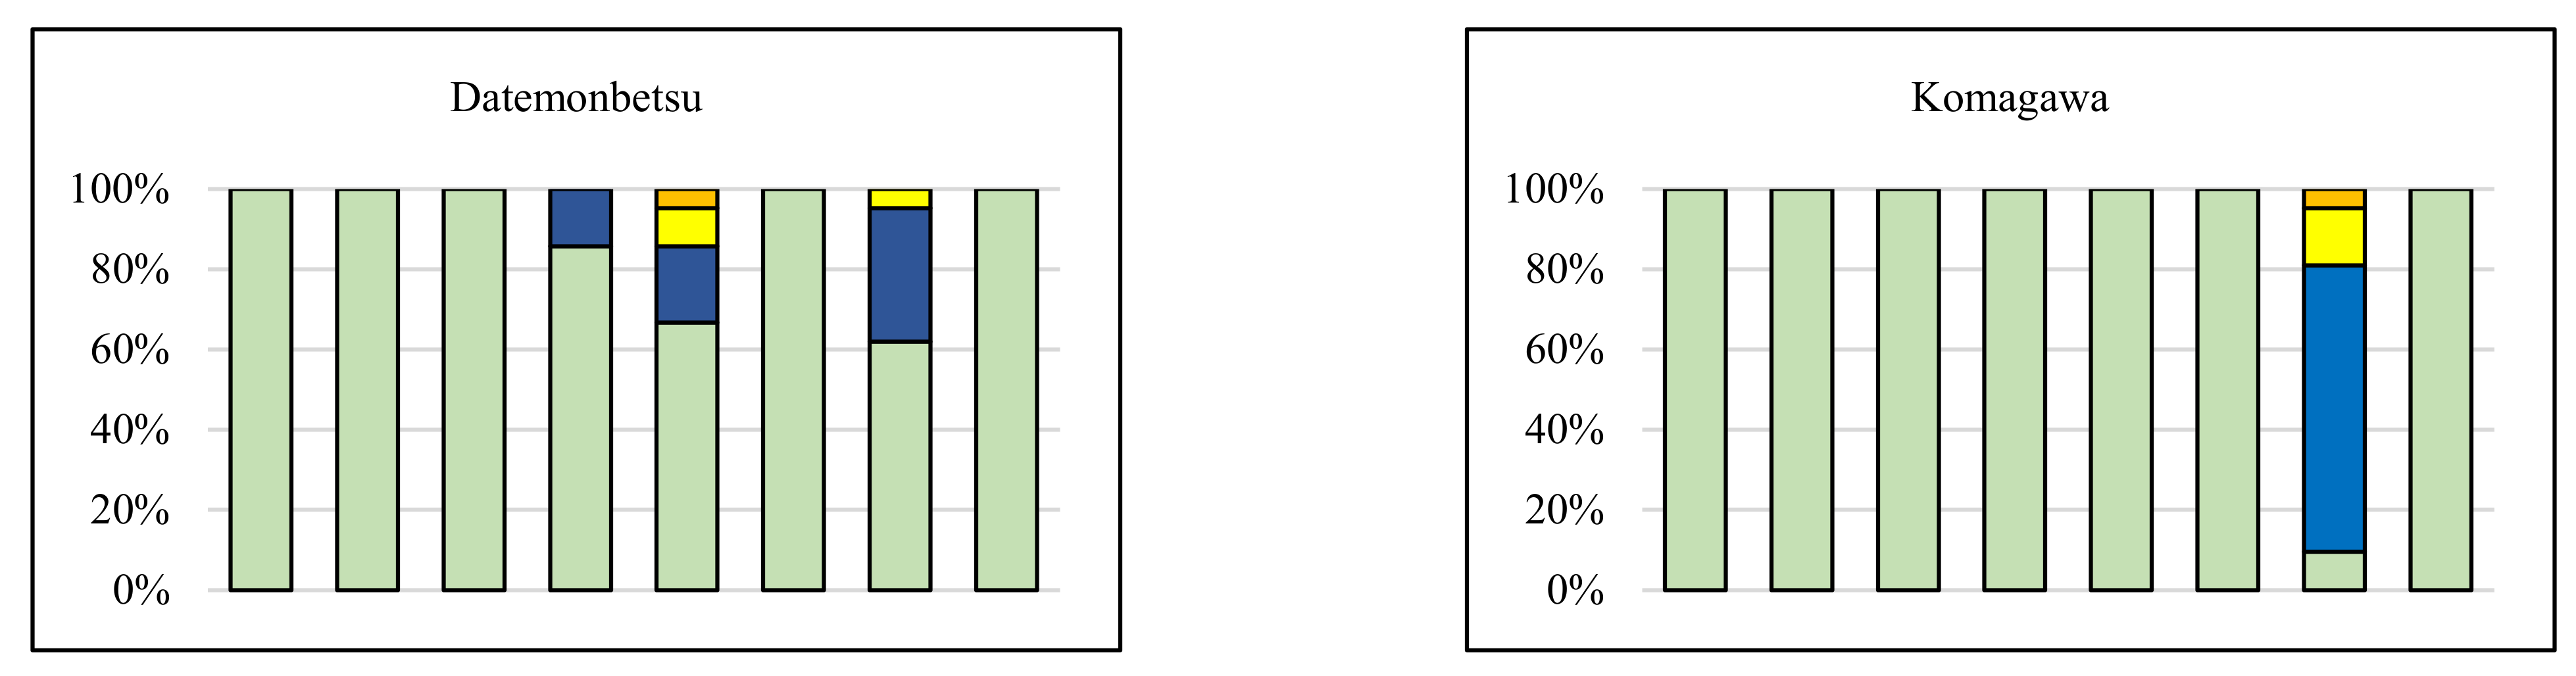
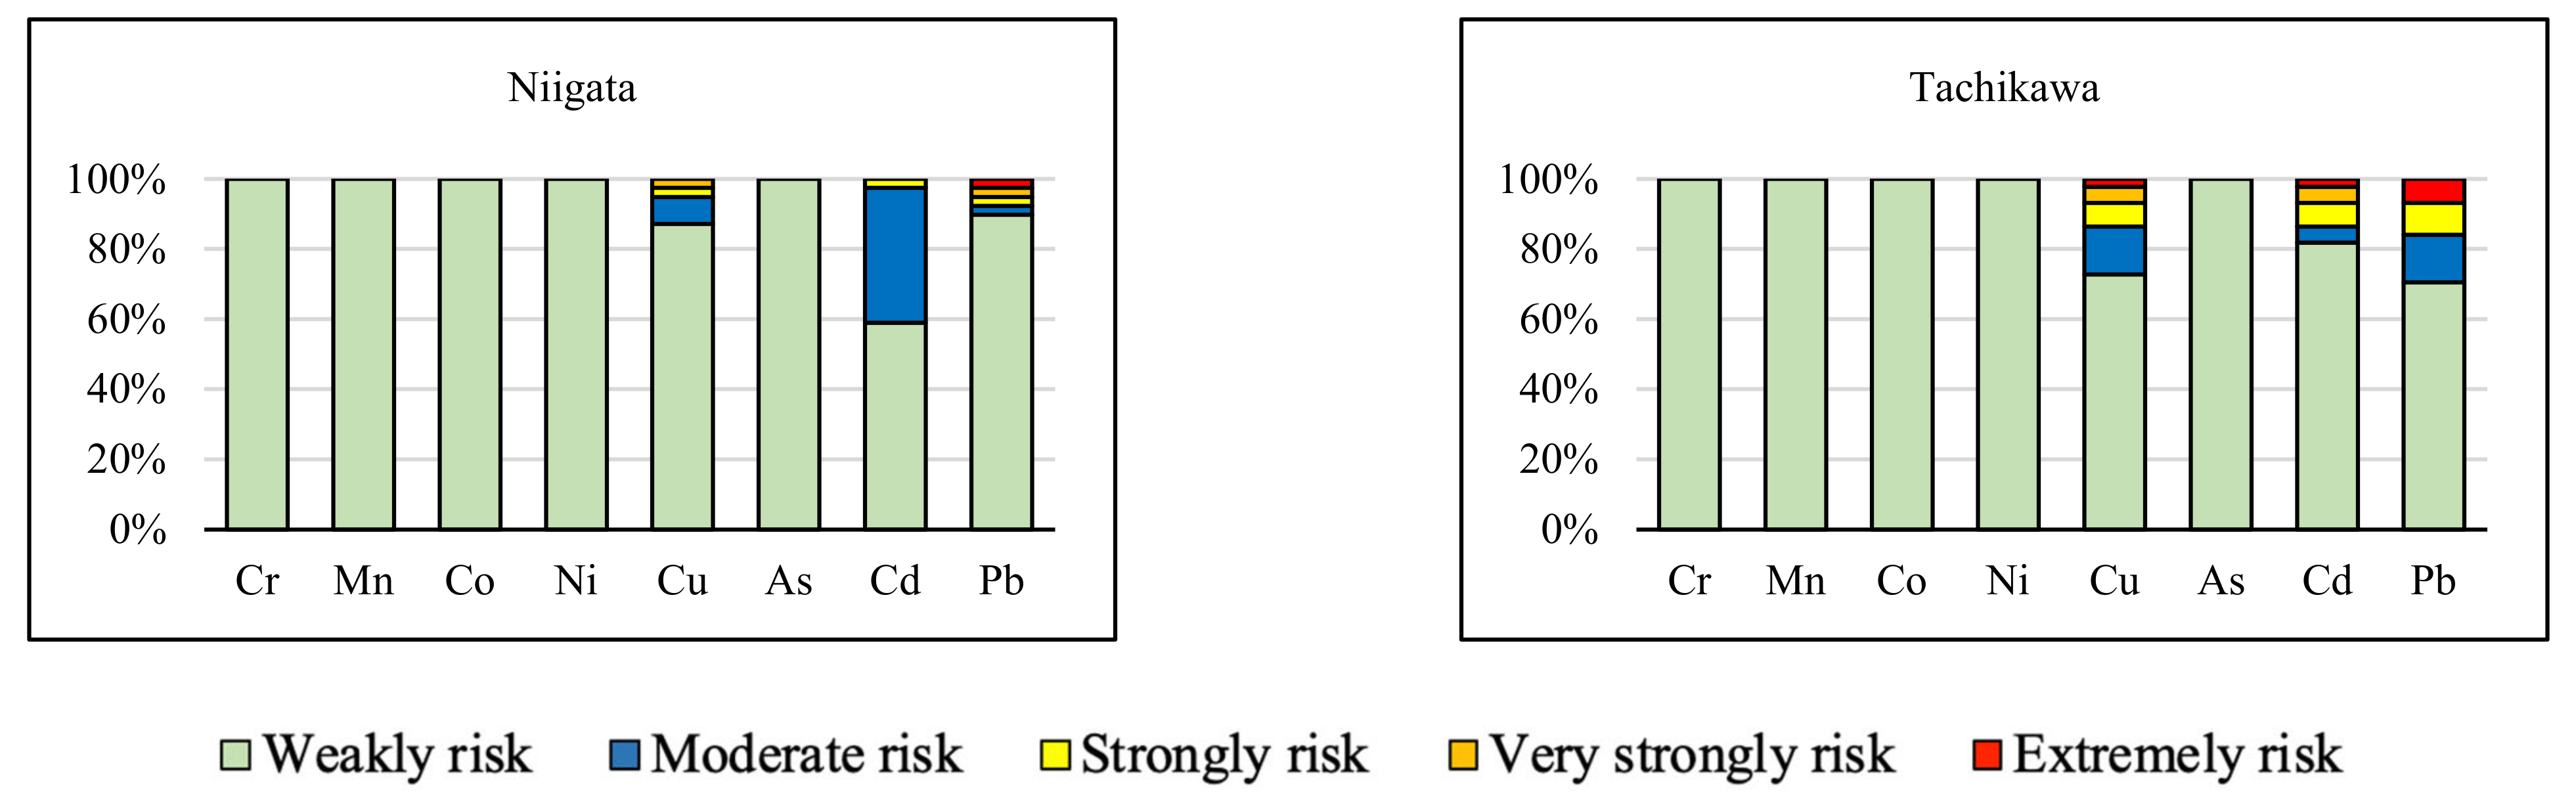
3.3.2. Source-Oriented Environmental Risk Assessment

The contribution proportions of different sources to potential ecological risk are shown in Table 5. At the Datemonbetsu and Komagawa sampling sites, railway operation was the major potential contributor, with contributions of 44.58% and 31.83%, respectively. In the Tachikawa and Niigata sampling zones, natural sources were the dominant contributors, while the contributions of railway operation were only 16.97% and 17.91%, respectively. The contributions of railway operation to the ecological risk near diesel-driven railways were about twice as high as those near electricity-driven railways. This indicated that diesel-driven railways had a larger influence on ecology than electricity-driven railways. Automobile emissions were the second main contributor to the potential ecological risk in the Komagawa and Tachikawa areas, with contributions of 29.65% and 32.01%, respectively. In this research, industrial and agricultural activities only showed high contributions in the two sampling areas. Industrial activities were the third dominant contributor in Komagawa, with a contribution of 20.97%, and agricultural activities were the second contributor in Datemonbetsu, with a contribution of 23.95%.

3.4. Human Health Risk Assessment by PMF-HHRA

3.4.1. Concentration-Oriented Health Risk Assessment

As shown in Table S2, HIPb, HQing, and TH values in Tachikawa for children were larger than 1. Therefore, at the Tachikawa sampling site, soil heavy metals had a noncarcinogenic risk for children, especially Pb and ingestion contact. All other HI and THI values for the three population groups were below 1, indicating that the noncarcinogenic risk of these heavy metals in the soil in the vicinity of the railway was acceptable. Among the three contact paths, ingestion contact was the principal exposure pathway. The proportion of the average THQ ingestion ranged from 72.65% to 94.75% among various population groups and sampling sites. Table S2 also shows that Cr and Pb were the elements that people were most exposed to, whose average HI accounted for 20.05% to 60.08% and 12.22% to 67.86%, respectively.
For the carcinogenic risk assessment, the only TCR values for children at the Datemonbetsu and Komagawa sampling sites exceeded 1 × 10⁻⁴. Similar to noncarcinogenic risk, ingestion contact was the principal exposure pathway. These results indicated that diesel-driven railways could cause carcinogenic risk for children. As shown in Table S2, people were most exposed to Ni in regard to carcinogenic risk, followed by Cr. The average TCR of Ni and Cr accounted for at least 46.48% and 26.72%, respectively.

3.4.2. Source-Oriented Health Risk Assessment

The contribution proportions of different sources to noncarcinogenic and carcinogenic risks among the three populations are shown in Table S3. The proportions for males and females were the same due to the same indices in the calculation, while those for children were similar. Thus, only the health risks of adults are discussed in this paper. For both noncarcinogenic and carcinogenic risks, railway operation was the dominant contributor to adults at the Datemonbetsu and Komagawa sampling sites, with contributions of 54.34% and 35.43% for noncarcinogenic risk and 70.56% and 37.42% for carcinogenic risk, respectively. At the Niigata sampling sites, the major health risk contributor was a natural source for both risks. At the Tachikawa sampling site, the major contributors to the two risks were not the same, with automobile emissions for noncarcinogenic risk and railway operation for carcinogenic risk.
The source contribution to health risk was significantly different from the concentration source. For instance, at the Niigata sampling site, the contributions of natural sources to adult noncarcinogenic and carcinogenic risks were 56.34% and 86.06%, respectively, which were 1.13 and 1.73 times higher, respectively, than the proportion of natural sources to concentration. On the other hand, at Datemonbetsu, agricultural activities contributed 17.39% of the adult noncarcinogenic risk. For adult carcinogenic risk, this percentage falls to 6.59%, which was only approximately a quarter of the contribution to content. These differences may be due to different toxic response factors of selected elements. In addition, some elements were not included in the calculation of health risks. If one source had a high contribution to the contents of these elements, the corresponding contribution to health risk would decrease.

4. Conclusions

This study focused on the relationship between railway operation and heavy metals in the soil in the vicinity of railways. PMF analysis showed that, among various factors, including automobile emissions, industrial activities, and agricultural activities, railway operation was the dominant anthropogenic source of soil heavy metals in the studied areas. Compared with the effect of electricity-driven railways, the effect of diesel-driven railways was larger. Environment risk assessment revealed that the soil near the railway experienced moderate-to-extreme contamination and had moderate potential ecological risk. The contributions of railway operation to the ecological risk near diesel-driven railways were about two times higher than those near electricity-driven railways. The results of a human health risk assessment showed that children might be vulnerable to soil heavy metals near railways. At the Tachikawa sampling site, the soil heavy metals pose a noncarcinogenic risk to children. Samples from the diesel-driven railways showed a carcinogenic risk for children, with ingestion as the principal exposure pathway. Overall, railway operation was the main anthropogenic source of heavy metals in the soil in the vicinity of railways and made a nonnegligible contribution to the ecological and health risks of soil heavy metals. Diesel-driven railways had more detrimental effects on the environment than electricity-driven railways. Therefore, the negative impacts of railway operation could be mitigated by keeping railways at a distance from residential or agricultural areas and employing more electricity-driven trains.

Supplementary Materials

The following supporting information can be downloaded at: https://www.mdpi.com/article/10.3390/su15010075/s1. Table S1: Calculation parameters used in health risk assessment; Table S2: Mean value of noncarcinogenic risk index and carcinogenic risk index from heavy metals to different populations by three pathways; Table S3: Method and source contribution (%) to human health risk for different sampling sites.

Author Contributions

Conceptualization, J.Z. and I.W.; methodology, I.W.; investigation, Z.W.; resources, I.W.; data curation, Z.W.; writing—original draft preparation, Z.W.; writing—review and editing, Z.W., J.Z., and I.W.; supervision, J.Z. and I.W.; project administration, Z.W. All authors have read and agreed to the published version of the manuscript.

Funding

This research was funded by the Xihua University Japan Emergency Management Research Center Annual Project 2021: “Research on the discipline composition and practice of emergency management personnel cultivation in Japan” (No. RBYJ2021-004).

Institutional Review Board Statement

Not applicable.

Informed Consent Statement

Not applicable.

Data Availability Statement

The data used in this study are available upon request.

Conflicts of Interest

The authors declare no conflict of interest.

References

  1. Rajmohan, N.; Prathapar, S.A.; Jayaprakash, M.; Nagarajan, R. Vertical distribution of heavy metals in soil profile in a seasonally waterlogging agriculture field in Eastern Ganges Basin. Environ. Monit. Assess. 2014, 186, 5411–5427. [Google Scholar] [CrossRef] [PubMed]
  2. Kabata, P.A.; Mukherjee, A.B. Trace Elements from Soil to Human; Springer: Berlin/Heidelberg, Germany, 2007; pp. 381–399. [Google Scholar]
  3. Wiłkomirski, B.; Sudnik-Wójcikowska, B.; Galera, H.; Wierzbicka, M.; Malawska, M. Railway transportation as a serious source of organic and inorganic pollution. Water Air Soil Pollut. 2011, 218, 333–345. [Google Scholar] [CrossRef] [PubMed] [Green Version]
  4. Koch, M.; Rotard, W. On the contribution of background sources to the heavy metal content of municipal sewage sludge. Water Sci. Technol. 2001, 43, 67–74. [Google Scholar] [CrossRef] [PubMed]
  5. Cheng, S. Effects of Heavy metals on plants and resistance mechanisms. Environ. Sci. Pollut. Res. 2003, 10, 256–264. [Google Scholar] [CrossRef] [PubMed]
  6. Chaudhari, P.R.; Gupta, R.; Gajghate, D.G.; Wate, S.R. Heavy metal pollution of ambient air in Nagpur City. Environ. Monit. Assess. 2012, 184, 2487–2496. [Google Scholar] [CrossRef]
  7. Alengebawy, A.; Abdelkhalek, S.T.; Qureshi, S.R.; Wang, M. Heavy Metals and Pesticides Toxicity in Agricultural Soil and Plants: Ecological Risks and Human Health Implications. Toxics 2021, 9, 42. [Google Scholar] [CrossRef]
  8. Karuppiah, M.; Gupta, G. Impact of Point and Nonpoint Source Pollution on Pore Waters of Two Chesapeake Bay Tributaries. Ecotoxicol. Environ. Saf. 1996, 35, 81–85. [Google Scholar] [CrossRef]
  9. Velea, T.; Gherghe, L.; Predica, V.; Krebs, P.R. Heavy metal contamination in the vicinity of an industrial area near Bucharest. Environ. Sci. Pollut. Res. 2009, 16 (Suppl. S1), 27–32. [Google Scholar] [CrossRef]
  10. Dwivedi, A.K.; Vankar, P.S. Source identification study of heavy metal contamination in the industrial hub of Unnao, India. Environ. Monit. Assess. 2014, 186, 3531–3539. [Google Scholar] [CrossRef]
  11. Jewett, S.C.; Naidu, A.S. Assessment of Heavy Metals in Red King Crabs Following Offshore Placer Gold Mining. Mar. Pollut. Bull. 2000, 40, 478–490. [Google Scholar] [CrossRef]
  12. Kim, J.Y.; Kim, K.W.; Ahn, J.S.; Ko, I.; Lee, C.H. Investigation and risk assessment modeling of As and other heavy metals contamination around five abandoned metal mines in Korea. Environ. Geochem. Health 2005, 27, 193–203. [Google Scholar] [CrossRef] [PubMed]
  13. Angelovičová, M.; Kunová, S.; Čapla, J.; Zajac, P.; Bučko, O.; Angelovič, M. Comparison of fatty acid profile in the chicken meat after feeding with narasin, nicarbazin and salinomycin sodium and phyto-additive substances. J. Environ. Sci. Health Part B 2016, 51, 374–382. [Google Scholar] [CrossRef] [PubMed]
  14. Nouri, H.; Beecham, S.; Kazemi, F.; Hassanli, A.M. A review of ET measurement techniques for estimating the water requirements of urban landscape vegetation. Urban Water J. 2013, 10, 247–259. [Google Scholar] [CrossRef]
  15. Waeles, M.; Tanguy, V.; Ricardo, D.; Riso, R.D. On the control of copper colloidal distribution by humic substances in the Penzé estuary. Chemosphere 2015, 119, 1176–1184. [Google Scholar] [CrossRef]
  16. Baltrenas, P.; Vaitiekunas, P.; Baciulyte, Z. Investigation of soil’s contamination with heavy metal by railway transport. J. Environ. Eng. Landsc. 2009, 17, 244–251. [Google Scholar] [CrossRef]
  17. Zhang, H.; Wang, Z.; Zhang, Y.; Hu, Z. The effects of the Qinghai–Tibet railway on heavy metals enrichment in soils. Sci. Total Environ. 2012, 439, 240–248. [Google Scholar] [CrossRef]
  18. Ma, J.H.; Chu, C.J.; Li, J.; Song, B. Heavy Metal Pollution in Soils on Railroad Side of Zhengzhou-Putian Section of Longxi-Haizhou Railroad, China. Pedosphere 2009, 19, 121–128. [Google Scholar] [CrossRef]
  19. Liu, Y.H.; Ren, X. Solidification, repair and long-term stability analysis of heavy metal contaminated soil on Zhongchuan railway. Fresenius Environ. Bull. 2021, 30, 2193–2200. [Google Scholar]
  20. Vaiškūnaitė, R.; Jasiūnienė, V. The analysis of heavy metal pollutants emitted by railway transport. Transport 2020, 35, 213–223. [Google Scholar] [CrossRef]
  21. Srishti, J.; Sharma, S.K.; Vijayan, N.; Mandal, T.K. Seasonal characteristics of aerosols (PM2.5and PM10) and their source apportionment using PMF: A four year study over Delhi, India. Environ. Pollut. 2020, 262, 114337. [Google Scholar] [CrossRef]
  22. Mohammad, H.G.; Assefa, M.M.; Lakshmi, R. Water quality assessment and apportionment of pollution sources using APCS-MLR and PMF receptor modeling techniques in three major rivers of South Florida. Sci. Total Environ. 2016, 566–567, 1552–1567. [Google Scholar] [CrossRef]
  23. Schaefer, K.; Einax, J.W. Source apportionment and geostatistics: An outstanding combination for describing metals distribution in soil. Clean–Soil Air Water 2016, 44, 877–884. [Google Scholar] [CrossRef]
  24. Liu, J.; Liu, Y.J.; Liu, Y.; Liu, Z.; Zhang, A.N. Quantitative contributions of the major sources of heavy metals in soils to ecosystem and human health risks: A case study of Yulin, China. Ecotoxicol. Environ. Saf. 2018, 164, 261–269. [Google Scholar] [CrossRef] [PubMed]
  25. Adgate, J.L.; Willis, R.D.; Buckley, T.J.; Chow, J.C.; Watson, J.G.; Rhoads, G.G.; Lioy, P.J. Chemical mass balance source apportionment of lead in house dust. Environ. Sci. Technol. 1998, 32, 108–114. [Google Scholar] [CrossRef]
  26. Wang, Z.; Watanabe, I.; Ozaki, H.; Zhang, J. Enrichment and bioavailability of trace elements in soil in vicinity of railways in Japan. Arch. Environ. Contam. Toxicol. 2018, 74, 16–31. [Google Scholar] [CrossRef]
  27. Paatero, P.; Tapper, U. Positive matrix factorization: A non-negative factor model with optimal utilization of error estimates of data values. Environmetrics 1994, 5, 111–126. [Google Scholar] [CrossRef]
  28. U.S.EPA. EPA Positive Matrix Factorization (PMF) 5.0 Fundamentals and User Guide; Office of Emergency and Remedial Response: Washington, DC, USA, 2014. [Google Scholar]
  29. Mullar, G. Index of geoaccumulation in sediments of the Rhine River. Geojournal 1969, 2, 108. [Google Scholar]
  30. Takeda, A.; Kimura, K.; Yamasaki, S. Analysis of 57 elements in Japanese soils, with special reference to soil group and agricultural use. Geoderma 2004, 119, 349–354. [Google Scholar] [CrossRef]
  31. Hakason, L. An ecological risk index for aquatic pollution control: A sedimentological approach. Water Res. 1980, 14, 975–1000. [Google Scholar] [CrossRef]
  32. Xu, Z.Q.; Ni, S.J.; Tuo, X.G.; Zhang, C.J. Calculation of Heavy Metals’ Toxicity Coefficient in the Evaluation of Potential Ecological Risk Index. Environ. Sci. Technol. 2008, 2, 112–115. (In Chinese) [Google Scholar]
  33. Fernandez, J.A.; Carballeria, A. Evaluation of contamination, by different elements, in terrestrial mosses. Arch. Environ. Contam. Toxicol. 2001, 40, 461–468. [Google Scholar] [CrossRef] [PubMed]
  34. Wu, J.; Li, J.; Teng, Y.; Chen, H.; Wang, Y. A partition computing-based positive matrix factorization (PC-PMF) approach for the source apportionment of agricultural soil heavy metal contents and associated health risks. J. Hazard Mater. 2020, 388, 121766. [Google Scholar] [CrossRef] [PubMed]
  35. USEPA. Risk Assessment Guidance for Superfund, Vol I: Human Health Manual Evaluation; Office of Emergency and Remedial Response: Washington, DC, USA, 1989. [Google Scholar]
  36. Cao, S.; Duan, X.; Zhao, X.; Ma, J.; Dong, T.; Huang, N.; Wei, F. Health risks from the exposure of children to As, Se, Pb and other heavy metals near the largest coking plant in China. Sci. Total Environ. 2014, 472, 1001–1009. [Google Scholar] [CrossRef] [PubMed]
  37. Chen, H.; Teng, Y.; Lu, S.; Wang, Y.; Wu, J.; Wang, J. Source apportionment and health risk assessment of trace metals in surface soils of Beijing metropolitan, China. Chemosphere 2016, 144, 1002–1011. [Google Scholar] [CrossRef]
  38. Mamut, A.; Eziz, M.; Mohammad, A.; Ismayil, D. Assessment of trace element pollution of farmland soils in the oases along the lower reaches of the Kaidu River and its potential health risks. J. Agro-Environ. Sci. 2018, 37, 2142–2149. (In Chinese) [Google Scholar]
  39. Shen, Z.; Xu, D.; Li, L.; Wang, J.; Shi, X. Ecological and health risks of heavy metal on farmland soils of mining areas around Tongling City, Anhui, China. Environ. Sci. Pollut. Res. 2019, 26, 15698–15709. [Google Scholar] [CrossRef]
  40. Staszewski, T.; Malawska, M.; Studnik-Wόjcikowska, B.; Galera, H.; Wiłkomirski, B. Soil and plants contamination with selected heavy metals in the area of a railway junction. Arch. Environ. Prot. 2015, 41, 35–42. [Google Scholar] [CrossRef] [Green Version]
  41. Stojic, N.; Pucarevic, M.; Stpjic, G. Railway transportation as a source of soil pollution. Transp. Res. Part D Transp. Environ. 2017, 57, 124–129. [Google Scholar] [CrossRef]
  42. Li, D.; Liao, Y. Spatial Characteristics of Heavy Metals in Street Dust of Coal Railway Transportation Hubs: A Case Study in Yuanping, China. Int. J. Environ. Res. Public Health 2018, 15, 2662. [Google Scholar] [CrossRef] [Green Version]
  43. Meng, X.; Ai, Y.; Li, R.; Zhang, W. Effects of heavy metal pollution on enzyme activities in railway cut slope soils. Environ. Monit. Assess. 2018, 190, 197. [Google Scholar] [CrossRef]
  44. Samarska, A.; Kovrov, O.; Zelenko, Y. Investigation of Heavy Metal Sources on Railways: Ballast Layer and Herbicides. J. Ecol. Eng. 2020, 21, 32–46. [Google Scholar] [CrossRef]
  45. Eludoyin, O.S.; Ogbe, O.M. Assessment of Heavy Metal Concentrations in Pawpaw (Carica papaya Linn.) around Automobile Workshops in Port Harcourt Metropolis, Rivers State, Nigeria. J. Health Pollut. 2017, 7, 48–61. [Google Scholar] [CrossRef] [Green Version]
  46. Appiah-Adjei, E.K.; Baidu, E.E.; Adjei, K.A.; Nkansah, M.A. Potential heavy metal pollution of soils from artisanal automobile workshops: The case of Suame Magazine, Ghana. Environ. Earth Sci. 2019, 78, 62. [Google Scholar] [CrossRef]
  47. Agyemang, J.; Gyimah, E.; Ofori, P.; Nimako, C.; Akoto, O. Pollution and Health Risk Implications of Heavy Metals in the Surface Soil of Asafo Auto-Mechanic Workshop in Kumasi, Ghana. Chem. Afr. 2022, 5, 189–199. [Google Scholar] [CrossRef]
  48. Li, Y.; Dong, Z.; Feng, D.; Zhang, X.; Jia, Z.; Fan, Q.; Liu, K. Study on the risk of soil heavy metal pollution in typical developed cities in eastern China. Sci. Rep. 2022, 12, 3855. [Google Scholar] [CrossRef] [PubMed]
  49. Yin, G.; Zhu, H.; Chen, Z.; Su, C.; He, Z.; Chen, X.; Qiu, J.; Wang, T. Spatial Distribution and Source Apportionment of Soil Heavy Metals in Pearl River Delta, China. Sustainability 2021, 13, 9651. [Google Scholar] [CrossRef]
  50. Wang, S.; Zhang, Y.; Cheng, J.; Li, Y.; Li, F.; Li, Y.; Shi, Z. Pollution Assessment and Source Apportionment of Soil Heavy Metals in a Coastal Industrial City, Zhejiang, Southeastern China. Int. J. Environ. Res. Public Health 2022, 19, 3335. [Google Scholar] [CrossRef]
  51. Acosta, J.A.; Faz, A.; Martinez-Martinez, S. Identification of heavy metal sources by multivariable analysis in a typical Mediterranean city (SE Spain). Environ. Monit. Assess. 2021, 169, 519–530. [Google Scholar] [CrossRef]
  52. Huang, S.; Shao, G.; Wang, L.; Tang, L. Spatial Distribution and Potential Sources of Five Heavy Metals and One Metalloid in the Soils of Xiamen City, China. Bull. Environ. Contam. Toxicol. 2019, 103, 308–315. [Google Scholar] [CrossRef]
  53. Hanfi, M.Y.; Mostafa, M.Y.A.; Zhukovsky, M.V. Heavy metal contamination in urban surface sediments: Sources, distribution, contamination control, and remediation. Environ. Monit. Assess. 2020, 192, 32. [Google Scholar] [CrossRef]
Figure 1. Selected railway and sampling sites.
Sustainability 15 00075 g001
Figure 2. Factor profiles and corresponding contributions for four sampling sites.
Sustainability 15 00075 g002
Figure 3. Mean concentration for each heavy-metal concentration from each source.
Sustainability 15 00075 g003
Figure 4. Distribution of metals in the study areas showing Igeo.
Sustainability 15 00075 g004
Figure 5. Individual index of heavy metals in different sampling sites.
Sustainability 15 00075 g005aSustainability 15 00075 g005b
Figure 6. Potential ecological risk of different sampling sites.
Sustainability 15 00075 g006
Table 1. Classification of Igeo.
IgeoLevelContamination Degree
<01Not-to-weakly contaminated
0–12Weakly-to-moderately contaminated
1–23Moderately contaminated
2–34Moderately-to-strongly contaminated
3–45Strongly contaminated
4–56Strongly-to-extremely contaminated
>57Extremely contaminated
Table 2. Classification of E and PERI.
EPERIContamination Degree
<30<70Weak risk
30–6070–140Moderate risk
60–120140–280Strong risk
120–240>280Very strong risk
>240-Extreme risk
Table 3. Descriptive statistics of heavy-metal concentrations in soil and road dust from different sampling sites (mg/kg).
StatisticsCrMnCoNiCuAsCdPb
Background value569301524196.82 0.295 17.2
Datemonbetsu soil
samples (n = 21)
Mean ± SD71.4 ± 93.8980 ± 26717.5 ± 3.9949.6 ± 74.8134 ± 151.39.56 ± 3.240.299 ± 0.10621.9 ± 9.32
Min19.55199.498.7339.35.320.16311.7
Max352163024.627659016.60.62245.7
Coefficient of
variation
1.310.270.231.511.130.340.350.43
Komagawa soil
samples (n = 21)
Mean ± SD86.6 ± 8.871236 ± 18120.2 ± 2.2143.9 ± 4.4763.3 ± 10.17.42 ± 1.370.532 ± 0.34324.6 ± 6.61
Min66.290815.532.747.95.480.25114.2
Max104159224.752.587.110.31.8935.4
Coefficient of
variation
0.150.110.110.100.160.190.650.27
Tachikawa soil
samples (n = 47)
Mean ± SD69.0 ± 29.21051 ± 40419.0 ± 8.4227.2 ± 9.77123 ± 2165.25 ± 6.851.28 ± 4.49283 ± 814
Min28.45529.536.26<0.001<0.001<0.001<0.001
Max161183044.759.8112034.121.73973
Coefficient of
variation
0.420.370.440.361.011.303.512.88
Niigata soil
samples (n = 39)
Mean ± SD33.5 ± 16.5664 ± 24511.0 ± 4.6215.0 ± 6.3670.9 ± 98.68.12 ± 2.690.295 ± 0.17874.1 ± 162
Min15.42 367.51 5.27 6.75 12.30 4.02 <0.00113.90
Max109.16 1292.32 2101.00 3203.00 504.00 15.40 0.80 907.00
Coefficient of
variation
0.490.370.420.421.390.330.602.19
Table 4. Source contribution results (%) of different sampling sites.
 DatemonbetsuKomagawaTachikawaNiigata
Natural source19.02N49.7975.99
Railway operation42.5536.0336.3611.73
Automobile emission13.6221.5711.605.66
Industrial activitiesN16.282.256.62
Agricultural activities24.8126.13NN
Table 5. Source contribution (%) to potential ecological risk for four sampling sites.
 DatemonbetsuKomagawaTachikawaNiigata
Natural source18.02N45.2863.24
Railway operation44.5831.8316.9717.91
Automobile emission13.4529.6532.029.97
Industrial activitiesN20.975.738.88
Agricultural activities23.9517.65NN
Disclaimer/Publisher’s Note: The statements, opinions and data contained in all publications are solely those of the individual author(s) and contributor(s) and not of MDPI and/or the editor(s). MDPI and/or the editor(s) disclaim responsibility for any injury to people or property resulting from any ideas, methods, instructions or products referred to in the content.

