Abstract
Choosing the appropriate management system is essential for sustainable agricultural practices. Yet, soil-specific properties at the subsurface are seldom considered when choosing the appropriate tillage system. This study assessed the effect of tillage depth on physical–hydraulic properties in three contrasting soil classes in the establishment of perennial crops. Tillage practices were evaluated in soils with natural dense layers (Inceptisols and Ultisols), and soils with very small and stable granular structure (Oxisols). From least to most aggressive, tested tillage systems included surface furrowing + plant holes (MT); plowing followed by two diskings + furrowing (CT); plowing followed by two diskings + subsoiling (SB); and plowing followed by two diskings + rotary hoeing (DM). Physical indicators with the greatest explanatory power were relative field capacity (RFC, 97%), aeration capacity (AC, 95%), macroporosity (Pmac, 95%), the S index (Sgi, 89%), and bulk density (Bd, 81%). DM caused the greatest modification in soil structure, especially at the surface. It increased values of AC, Pmac, and Sgi, and reduced Bd values. Only deep tillage systems (DM and SB) improved soil structure in deeper layers. Highest Bd values were observed for MT (1.47 g cm−3), and lowest for DM (1.21 g cm−3). Soil classes responded differently to soil tillage systems. DM was most effective in soils with densified layers (Inceptisol and Ultisol). Effects were less expressive in the studied Oxisol. Comparing MT and DM, Pmac increased by more than 100% in the studied Ultisol, but by less than 20% in the Oxisol. No tillage system affected the Oxisol’s soil structure in deeper layers, due to its small and stable granular structure. The choice of optimal tillage strategies should consider soil-specific properties, especially at greater depths, to guarantee more productive and sustainable crop systems.
1. Introduction
Plants use soil as a growth medium, as it provides them with water, oxygen, and nutrients. The soil structure and its correlated physical–hydraulic properties are responsible for many ecosystem services, since they are related to heat flow, water retention, soil organisms, available nutrients, and carbon stocks [1,2,3,4]. Understanding the dynamics of these properties is essential to guarantee sustainable agricultural activities without reducing productivity [5,6,7,8]. Ideally, agricultural soils should constitute an environment favorable to adequate plant growth, biological activity, and the supply of water and oxygen [9].
The depth where water can easily percolate and roots can effectively grow is defined as effective soil depth. Reduced depths negatively affect plant growth by restraining drainage and physically hindering root growth [10]. It can have natural causes, such as the nature of the soil class itself, or have anthropic origin, being induced by soil compaction [11,12]. Shallow effective depths make soils more prone to erosion and reduce productivity, thereby reducing biomass production and carbon preservation in soils. For that reason, adequate site-specific management practices are important for the sustainability of crop systems [13].
Soil tillage should always aim to improve the root growth environment [14,15,16]. Traditionally, the physical changes resulting from soil tillage occur at a depth of 0–0.2 m. However, some soils have an underlying natural dense layer, unaffected by superficial tillage. Other soil classes might experience subsurface compaction under intensive cropping. That is, tillage affects soil classes differently. Depending on soil properties, certain tillage methods may not improve root growth significantly, or may even reduce the effective depth of soils, which is not ideal. The subsurface soil layers have recognized potential for storing and providing water and nutrients to crops [17,18,19]. Therefore, soil management practices must account for soil-specific properties, focusing on maximizing the volume of the soil explored by plant roots in order to increase crop resilience to erosion and climatic variations [20,21]. This is especially true for perennial crop systems, as soils are only tilled once.
Deeper tillage may provide an effective solution for mitigating physical-hydraulic restrictions of soils with dense underlying layers [22]. Deeper soil tillage prior to sowing in association with other management practices have made it possible for the root system of the plants to explore a greater volume of soil [19,23,24]. Deeper root systems give plants access to more nutrients and water, thus minimizing the effect of regional water deficit, dry spells and other unexpected climatic events, which should become more frequent with climate change [17,20,21].
Deep tillage has shown to be effective in improving the physical–hydraulic properties and/or crop yield, as reported in studies about different soil classes in Australia [22], in India [12], the USA [25], China [26], and Brazil [11]. In addition, confirmation of increased sugarcane yield and root growth [27], greater soil aeration and moisture content [28,29], and reduced resistance to penetration [30] have also been reported.
Conversely, an absence of positive results has also been observed, for instance, for sugarcane yield in Oxisols in Brazil [31], and for maize and soybean in paddy soils in Korea [32]. This indicates that different soils can respond differently to tillage practices, due to differences in properties such as structure, pore size distribution, effective depth, and densification. These differences play an important role at greater depths, where there is less influence of organic matter, and mineralogy and texture will have more influence over the soil’s structure and its resulting physical–hydraulic properties. Naturally, soil classes greatly affect root development in depth.
The problem is that few studies evaluate these soil properties for subsurface layers and relate them to plant growth or to management systems. Generally, the effects of management practices are only assessed in the 0–0.30 m layer, and the influence of physical–hydraulic properties of deeper horizons on crop growth and production are seldom considered [33,34,35,36,37,38,39,40]. This is appropriate even more so for perennial crops.
Increasing the sustainability of agricultural practices is an urgent need, and involves adopting the adequate management practices based on soil- and site-specific properties. Hence, the aim of this study was to assess the effect of tillage systems on the physical quality of different soil classes at greater depths. The central hypothesis of this study was that improvement in the physical–hydraulic environment of soils depends not only on the type of tillage, but also on intrinsic properties of soil classes, especially in deeper horizons, often neglected in soil management studies.
2. Materials and Methods
2.1. Study Area
The study was conducted in the experimental area of the Fruit Farming sector of the Federal University of Lavras (UFLA), in the southeast of Brazil (Figure 1). The climate of the region is classified as Cwa, according to the Köppen system [41], with hot and humid summers and cool and dry winters. The mean annual temperature is 21.6 °C and mean annual rainfall is 1339.5 mm, concentrated between November and March, according to data obtained in the period from January 1 of 1998 to January 1 of 2018 [42]. Unseasonable hot and dry periods can occur during the rainy period, intensifying water deficit.
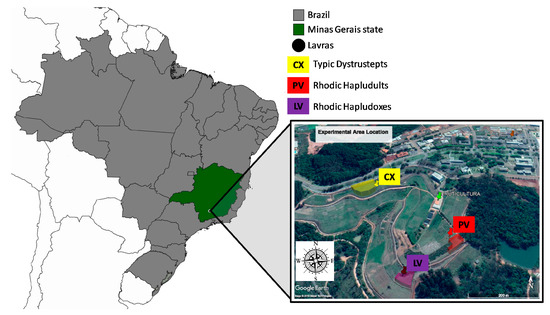
Figure 1.
Map of the study area showing the locations of the plots where the experiment was conducted in Lavras, Minas Gerais, Brazil.
The study site is in the geomorphological unit of the Atlantic Plateau. Granite-gneisses are the predominant lithology, and native vegetation is represented by semi-perennial rainforest. Three soil classes were selected, mapped in detail and classified by [43]. By the Soil Taxonomy [44], they were classified as Typic Dystrustepts (CX), Rhodic Hapludults (PV), and Rhodic Hapludoxes (LV). According to the Brazilian Soil Classification System [45], as Cambissolo Háplico Tb distrófico típico (CX), Argissolo Vermelho distrófico típico (PV), and Latossolo Vermelho eutrófico típico (LV). The topography is strongly rolling in the CX, moderately rolling in the PV, and gently rolling in the LV. These soils are highly representative of Brazil (Latossolos—31.6%, Argissolos—26.9%, Cambissolos—5.26%) [45], and even worldwide (Inceptisols—15%, Ultisols—8%, Oxisols—8%) [46].
The structure was granular in the A horizon of all the studied soil classes. CX presented a blocky structure in its Bw horizon, and PV and LV had a granular structure in their Bt and Bw horizons, respectively [43]. The natural subsurface densification found in the Inceptisols and Ultisols is characteristic of these soil classes in this region [43,46,47]. Another common feature is the granular structure that is very small, rounded, and stable, present in the solum of the Oxisols [48]. These contrasting properties tend to affect root development of the crops, especially perennial crops, and the availability of water in the soil.
2.2. Characterization of Studied Soils
Before setting up the experiment, undisturbed samples were collected from the horizons of each soil profile for physical–hydraulic characterization (Table 1). Disturbed samples were also collected for chemical characterization at the depths of 0–0.2, 0.2–0.4, and 0.4–0.6 m (Table 2). Analyses followed the standard methods described in [49].

Table 1.
Physical–hydraulic characterization of the soils before setting up the experiment.
Table 2.
Chemical characterization of the soils before setting up the experiment.
The study areas remained fallow for 5 years before setting up the experiment. Weed control was carried out sporadically with the use of herbicide or through mechanized cutting. Each area had 1200 m2.
2.3. Experimental Design and Treatments
Four treatments and three replications were tested in a completely randomized design, for a total of 60 experimental plots. Each plot was composed of one row containing 6 atemoya plants, occupying an area of 40.5 m2. The treatments corresponded to different manners of soil tillage for establishing the perennial crop, using different equipment: minimum tillage—surface furrowing (0.10 m depth) for marking off the plant row using a ridger + plant hole (0.40 m diameter by 0.70 m depth) with a plant hole auger (MT); conventional tillage—disk plowing (0.25 m), two diskings (0.20 m) + furrowing (0.25 m) using a ridger (CT); subsoiling—disk plowing (0.25 m), two diskings (0.20 m) + subsoiler with a wedge tip of two shanks spaced at 0.50 m (0.45 m) (SB); deep mixing tillage—disk plowing (0.25 m), two diskings (0.20 m) + soil deep tillage device (0.50 m width by 0.60 m depth) (DM). The deep tillage device is a type of modified rotary hoe with width of action of 0.50 m, composed of a vertical cutting tine blade wheel that mixes the surface and subsurface horizons, BigMix® AS-2 model, manufactured by Mafes Agromecânica [51]. The experimental area was tilled in the spring, on 29 November 2018, 3 days after the last rainfall of 20 mm.
Atemoya (Annona cherimola × Annona squamosa) was planted on 14 December 2018, at a spacing of 4.50 × 1.50 m, with 6 plants per plot. The soil was amended with limestone, calculated for the depth of 0 to 0.40 m with the purpose of raising the saturation of Ca2+ and Mg2+ to 70% and 15%, respectively, except for MT, where liming was performed in the plant hole. In addition, Brachiaria ruziziensis (Urochloa ruziziensis) grass was sown between the rows, which was maintained through periodic cutting. Recommendations for liming and fertilization were followed according to crop demands [52]. Monthly climate data during each step of the experiment are presented in Figure 2.
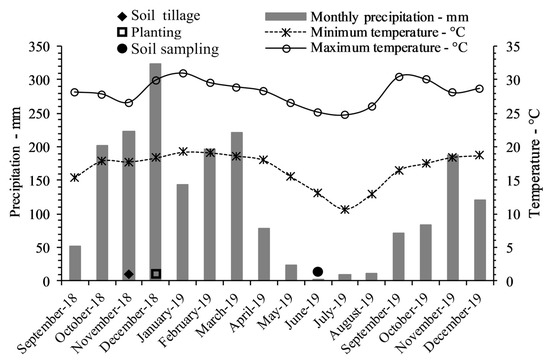
Figure 2.
Climate data of the study area in Lavras, Minas Gerais, Brazil, during the period in which experiments were conducted. Data obtained from [42].
2.4. Water Retention Curve (WRC)
To evaluate the effect of the treatments on the physical–hydraulic properties of the soils, undisturbed samples (6.5 cm diameter by 2.5 cm height) were collected at the center of the depths of 0–0.2, 0.2–0.4, and 0.4–0.6 m using an Uhland sampler. Sampling was carried out seven months after the soil preparation practices. After preparation of the samples and slow saturation with distilled water, they were placed under sequential suction at matric potentials (h) of −2, −4, and −6 kPa using perforated plate funnels (Büchner funnels) and of −33, −100, −500, and −1500 kPa using a Richards’ pressure chamber [53]. After reaching equilibrium, the samples were weighed and dried in a laboratory oven at 105–110 °C for 24 h to obtain the soil dry matter and to calculate the moisture content (θ) at each potential.
Water retention curves (WRCs) were fitted using the model proposed by van Genuchten (Equation (1)) with the Mualem restriction [54,55], with assistance of the software RETC version 6.02 [56], where “n” and “m” are parameters related to the slope of the curve and “n” is an empirical parameter related to the shape of the WRC.
where:
θ: volumetric water content according to matric potential (m3 m−3);
θs: volumetric water content in saturation (m3 m−3);
θr: residual volumetric water content (m3 m−3);
h: matric potential in module (cm);
α and n: model fitting parameters;
m: fitting parameter obtained by the Mualem restriction (m = 1 − (1/n)).
2.5. Soil Physical Quality Indicators
Due to the extensive set of data and of indicators taken from the WRC, a selection of the soil physical quality indicators was made through principal component analysis (PCA) using all the indicators obtained by the WRC. For each tested soil class and tillage system, the indicators obtained were the following: PWP—water content at the permanent wilting point estimated at −1500 kPa; FC—water content at field capacity estimated at −10 kPa; PAW—plant available water capacity calculated by the difference between FC and PWP; AC—aeration capacity; RFC—relative field capacity; Pmac—macroporosity (pores with diameter > 50 µm); Pmic—microporosity (pores with diameter < 50 µm); TP—total porosity; Bd—soil bulk density; d.median—median of pore diameter; d.mode—mode of pore diameter; d.mean—mean pore diameter; Sd—standard deviation of pore distribution; skewness—skewness of pore distribution; kurtosis—kurtosis of pore distribution; Sgi—S index of [57]; EI_paw—integral energy of the PAW [58].
Statistical analyses were performed with the assistance of the R software, using the packages “FactoMineR” and “factoextra”. The matrix of the squared cosine (cos2) was accessed, representing the quality of the indicator (Table 3). A high cos2 means good representation of the indicator by the principal component (PC) on the PCA axis. Based on [59,60], indicators that had values of cos2 > 0.80 were selected; namely, AC, RFC, Pmac, Bd, and Sgi (Table 1). These indicators are further explained in the following sections.
Table 3.
Values of cos2 extracted from the PCA containing physical–hydraulic indicators of the 3 soil classes (CX, PV, and LV) under 4 management systems (MT, CT, SB, and DM) at 3 depths (0–0.2, 0.2–0.4, and 0.4–0.6 m).
2.5.1. Aeration Capacity (AC)
AC is defined as the water content obtained by the difference between the water content at saturation (θS (ψ = 0 m)) and the water content at field capacity (θFC (ψ = 1 m)) [50]. AC indicates the volume of pores responsible for rapid drainage of water and aeration of the soil; values lower than 0.10 m3m−3 indicate a deficit in soil aeration, which can decrease plant yield [61].
2.5.2. Relative Field Capacity (RFC)
RFC is a non-dimensional indicator obtained by the ratio between water content in field capacity and at saturation (θFC/θS). It represents soils’ air and water storage capacity in relation to the total porosity, here represented by θS [50].
The ideal balance between AC and the water capacity of soils occurs at 0.6 ≤ RFC ≤ 0.7. In this range, microbial production of nitrate is maximized [62]. RFC values < 0.6 indicate limited water availability in soils, while RFC values > 0.7 indicate limitation of aeration. Both situations hinder the production of microbial nitrate and plant development [63,64].
2.5.3. Macroporosity (Pmac)
Pmac (m3m−3) is the volume of pores greater than 50 µm. It can also be defined as the difference between θS and θ0.6 (ψ = 0.6 m) [65,66,67,68]. Values of Pmac between 0.05 and 0.1 m3m−3 are considered optimal, whereas values lower than 0.04 m3m−3 indicate soils degraded by compaction or densification [69,70].
2.5.4. Soil Bulk Density (Bd)
Bd (g cm−3) is defined as the quotient between the soil dry matter and the cylinder volume. Critical values of Bd are based on the texture of the soil class. The critical Bd (Bdc) refers to the variation in Bd values when the least limiting water range (LLWR) is zero. Such values were compiled by [71] in a pedotransfer function (Bdc LLWR = 0.00078 clay + 1.83803) for Brazilian conditions, which was used as a comparative reference.
2.5.5. S Index (Sgi)
Sgi (non-dimensional) was determined according to [57] and represents the slope of WRC (g g−1) at the inflection point. Limiting values were established based on the study of [72] involving a wide variety of Brazilian soil classes and proposing the value of 0.045 as the limit between soils of good structural quality and those with a tendency to degradation, and values ≤0.025 for physically degraded soils.
2.5.6. Pore Distribution Per Volume
Soil pore distribution per volume was determined according to [50]. The function of normalized pore distribution was obtained by the ratio between the slope of the WRC and the slope at the inflection point of the WRC (Equation (2)).
where:
S*(h): normalized pore distribution;
Sv (h): slope of the soil water retention curve;
Svi: slope of the inflection point of the soil water retention curve;
h: matric potential;
α, n, and m: fitting parameters obtained in modeling of the WRC, by Equation (1).
The models of S*(h) were compared by the “localization” parameters, i.e., median diameter (d.median), mode diameter (d.mode), and mean diameter (d.mean), and the “shape” parameters, i.e., standard deviation (Sd), skewness, and kurtosis. Parameters were calculated following [50].
2.6. Statistical Analysis
Since the treatments include different soil tillage depths, the statistical analysis was performed according to sampled soil depth. An analysis of variance (ANOVA) was performed in a completely randomized design, using a factorial arrangement with two factors (soil classes and soil tillage methods).
To compare the soil tillage methods and their effects on different soil classes, the normality, independence, and homogeneity of variance were tested for all studied variables, including soil physical quality indicators (AC, RFC, Pmac, Bd and Sgi), and location and shape parameters of the pore distribution (d.median, d.mode, d.mean, Sd, skewness, and kurtosis). Upon verifying these assumptions, ANOVA and mean comparison tests (Tukey’s test, p > 0.05) were carried out for each soil depth.
In search of possible correlations between the management systems and the initial development of the atemoya plants, the root collar diameter (base of the stem) and plant height prior to pruning were measured eight months after planting, and these measurements were compared to the soil quality indicators.
Pearson’s linear correlation analysis was carried out between plant height and root collar diameter and the soil physical quality indicators per sampling depth. Principal component analyses (PCAs) were performed for each depth to evaluate distinctions and similarities between soil classes and soil tillage systems. All statistical analyses were conducted using R software [73]. A summary of each step taken during the experiment is presented in Figure 3.
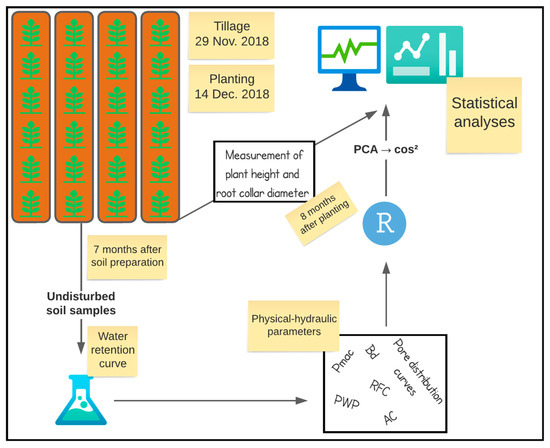
Figure 3.
Flowchart illustrating the steps taken during the experiment. PWP—water content at the permanent wilting point; AC—aeration capacity; RFC—relative field capacity; Pmac—macroporosity; Bd—soil bulk density; PCA—principal component analysis. Created using LucidChart.
3. Results
3.1. Parameters of the Normalized Pore Volume Distribution Function
The normalized functions of the pore volume distribution (S*(h)) for each soil management system in each soil class and depth are shown in Figure 4. No significant differences were found at depth 0.0–0.2 m between CX and LV. For CX, the S*(h) curve for DM tillage was displaced to the right. This indicated an increase in the frequency of greater diameter pores compared to the other tillage treatments. This displacement reached a value of 667 µm, which is 3.1 times higher than CT and 1.9 times higher than MT and SB (Figure 4B).
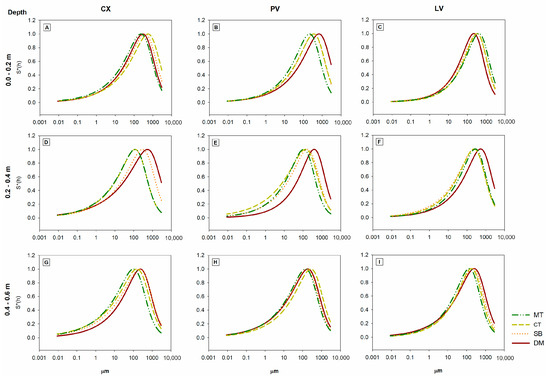
Figure 4.
Normalized function of the pore volume distribution for different management systems in three soil classes: Typic Dystrustepts (CX—A,D,G), Rhodic Hapludults (PV—B,E,H), and Rhodic Hapludoxes (LV—C,F,I). MT—minimum tillage; CT—conventional tillage; SB—subsoiling; DM—deep mixing tillage.
The difference between the types of tillage was most evident at the 0.2–0.4 m depth, where the displacement of S*(h) curves to the right is observed for DM tillage in all soil classes (Figure 4D–F). For CX, DM (542.3 µm) led to an increase of 4.5× in relation to MT and CT, and of 1.8× compared to SB. For soil classes PV and LV, there was greater homogeneity of differences. Most frequent pore diameters for DM were 2.9× greater in relation to MT, CT, and SB in the PV For LV, they were 2.1× greater in relation to MT, CT, and SB.
Between depths 0.4 and 0.6 m, small differences were seen among soil tillage treatments. A gradual increase in the displacement of curves to the right was observed with the increase in depth and aggressiveness of tillage for CX and LV. DM stood out compared to the other tillage treatments (Figure 4G,I). This increase occurred in the following order: MT, CT, SB, and DM (101, 153, 216, and 231 µm in CX; 139, 176, 211, and 254 µm in LV).
Comparing soil classes, the DM tillage altered the deepest layers of CX and LV, increasing the diameter of the most frequent pores at depths 0.2–0.4 and 0.4–0.6 m. However, for PV, DM obtained greater values of most frequent pore diameter at the 0.0–0.2 and 0.2–0.4 m depths, with values of 667.1 and 392.6 µm, respectively, but did not show significant differences at depth 0.4–0.6 m. Perhaps the DM had not reached this depth.
The localization parameters (d.median, d.mode, and d.mean—µm) and shape parameters (Sd, skewness, and kurtosis) for the normalized pore distribution are shown in Figure 5. DM was the tillage system that caused the greatest modification in soil structure, exhibiting highest frequency of pores (d.mode) with diameter greater than 300 µm, especially in the 0.2–0.4 m layer, regardless of soil class (Figure 5D–F). In addition, DM exhibited greater d.median and d.mean in relation to the other treatments. These results indicated that the DM tillage has greater capacity for altering the structure of soils at depth, rupturing even the densified layers naturally found in the CX and PV up to 0.4 m.
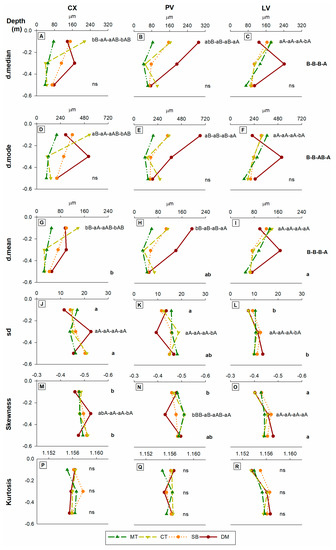
Figure 5.
Localization parameters (d.median, d.mode, and d.mean—µm) and shape parameters (Sd, skewness, and kurtosis) for the normalized pore volume distribution functions for different management systems and three soil classes: Typic Dystrustepts (CX—A,D,G,J,M,P), Rhodic Hapludults (PV—B,E,H,K,N,Q), and Rhodic Hapludoxes (LV—C,F,I,L,O,R). MT—minimum tillage; CT—conventional tillage; SB—subsoiling; DM—deep mixing tillage. Lowercase letters compare soil classes; uppercase letters compare management systems, both within each soil depth. Uppercase and lowercase letters in sequence represent interaction between the soil class and management system factors. Letters outside the plots represent the significance of each tillage type separately.
In general, deep tillage methods obtained higher mean pore diameter values than conventional tillage (CT), including in LV, which had higher total porosity compared to CX and PV (Figure 5; Table 1).
Results for the Sd shape parameter indicated that the treatments had no effect on soil classes (uppercase letters, Figure 5J–L), in spite of the significant effect of the test. Furthermore, comparing the effect of the treatment in each soil class, only DM presented significant differences, which were greater in CX than in PV and LV. Kurtosis did not show statistically significant differences. For all the soil tillage treatments in all the soil classes and depths, a leptokurtic distribution was obtained, i.e., curves sharper in the center and with longer tails compared to the normal log distribution [50].
3.2. Physical Indicators of Soil Quality
The analyses of variance performed on the physical indicators of soil quality did not show significant interaction (p < 0.05) between the soil class and management system factors. Therefore, the statistical analysis exclusively involved the mean values of these factors. That is, the mean values of results per management system were calculated and compared. Management system means are presented in the lower part of plots in Figure 6 (only when significant). The same applies for soil classes: the means of results per soil class were calculated and compared. Means per soil class are represented by gray bars in Figure 6.
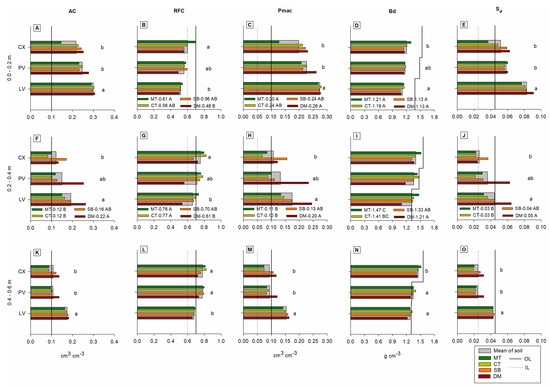
Figure 6.
The effect of tillage systems in physical indicators of soil quality at different depths in three soil classes: Typic Dystrustepts (CX), Rhodic Hapludults (PV), and Rhodic Hapludoxes (LV). MT—minimum tillage; CT—conventional tillage; SB —subsoiling; DM—deep mixing tillage; AC—aeration capacity (A,F,K); RFC—relative field capacity (B,G,L); Pmac—microporosity (C,H,M); Bd—soil bulk density (D,I,N); Sgi—S index (E,J,O). OL and IL—optimal and inferior limits defined by the literature, respectively. Lowercase letters in the vertical direction compare result means per soil class, represented by the gray horizontal bar; uppercase letters compare result means per management system, presented below each plot, when significant.
DM presented the best results. It improved properties related to soil structure in all soil class depths. DM increased values of AC, Pmac, and Sgi, and reduced Bd values. LV was the soil class that presented the best results, regardless of the management system (Figure 5).
The DM treatment in LV had the worst RFC results (Figure 5B,G,L). This indicated an excess of large pores, which was corroborated by AC (Figure 5A,F,K). An excess of larger diameter pores substantially increases drainage, reducing water storage capacity. It also reduces soil–root contact, which may hinder uptake of water and nutrients by crops. LV has naturally high porosity due to its small and stable granular structure. These properties, intrinsic to this soil class, were enhanced by the DM tillage system. In contrast, at depths 0.2–0.4 and 0.4–0.6 m, both CX and PV had RFC above 0.7 in all the treatments, indicating possible limitations regarding deficient aeration.
AC and Pmac, the main indicators of aeration, behaved differently depending on soil classes and tillage systems (Figure 7), especially at depth 0.2–0.4 m. Their values were higher for deep tillage methods (SB and DM at 0.2–0.4 m) and for LV at all depths. At depth 0–0.2 m, no tillage method had results lower than the minimum limit of AC and Pmac. No soil class was considered dense after tillage, following the classification of [74], independently of tillage system. Even in tillage systems that did not reach deeper soil layers, the lowest value of Pmac was 14.6% in CX at depth 0.2–0.4 m using the CT tillage system, which was similar to MT.
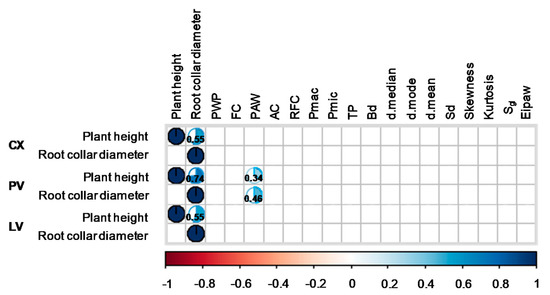
Figure 7.
Pearson’s correlation coefficients between plant measurements and soil quality indicators. Only correlations significant at p < 0.05 are shown.
Comparing MT and DM, for example, at all depths of CX, a mean increase of 51% was observed in Pmac. At 0–0.2 and 0.4–0.6 m in PV, there was a mean increase of 31%; at 0.2–0.4 m, an increase of 100%. For LV, at depths 0–0.2 and 0.4–0.6 m, increases of 6% and 15% were observed, respectively, while at 0.2–0.4 m, there was an increase of 79% in Pmac.
The tillage systems did not change Bd at depths 0–0.2 and 0.4–0.6 m, and no tillage system reached Bdc at 0–0.2 m (Figure 6D). Bd varied according to soil class; its lowest values were observed in LV. In contrast, tillage systems affected Bd at 0.2–0.4 m (Figure 6I). The lowest values of Bd were observed for the DM system (1.21 g cm−3), and the highest values for MT (1.47 g cm−3). It is noteworthy that the MT, CT, and SB systems exceeded Bdc in LV, presenting values greater than 1.32 g cm−3. This corroborates other indicators that evaluate aeration and soil structure (AC and Pmac). No tillage system exceeded the Bdc value for CX. Conversely, Bdc was exceeded for all systems in PV (values > 1.31 g cm−3) at depth 0.4–0.6 m, except for DM.
The mean values of Sgi per soil class were higher than the limit of 0.045 at 0–0.2 m for all soil classes (Figure 6E,J,O). Sgi was significantly higher for LV, showing that the tillage systems at this depth provided an excellent physical environment for the plants. However, the deeper layers show a big reduction in Sgi values and a discrepancy in results of the DM treatment at 0.2–0.4 m and 0.4–0.6 m for CX and PV. No tillage system affected the soil structure of LV at 0.4–0.6 m. In the deeper layers of studied soil classes, only deep tillage systems (DM and SB) led to improvements in soil structure, as indicated by Sgi values (Figure 6E,J,O).
3.3. Correlations and Principal Component Analysis (PCA)
Pearson’s correlation coefficients are presented in Figure 7; only significant correlations are shown (p < 0.05). Positive correlations were observed between plant height and root collar diameter (r = 0.55 for CX and LV; 0.74 for PV). Only in PV was there significant correlation between plants measurements and soil physical quality indicators. PAW had a positive correlation with plant height (r = 0.34) and root collar diameter (r = 0.46) (Figure 7), indicating the importance of soil water availability for plant growth in the initial phase.
Tillage systems did not present differing tendencies at depth 0–0.2 m. Comparing soil classes, LV showed different behavior. It was affected mainly by TP, Sgi, and skewness (Figure 8B,C). At 0.2–0.4 m of depth, DM showed clear differences compared to other treatments, except for SB. DM was positively correlated with the d.mode, d.mean, d.median, Pmac, AC, and Sgi. Other treatments showed positive correlation mainly with Pmic, Bd, and RFC (Figure 8E,F). At depth 0.4–0.6 m, the tillage systems did not differ from each other. LV, however, again presented a distinct trend, correlated with TP, Sgi, skewness, PAW, Pmac, and AC.
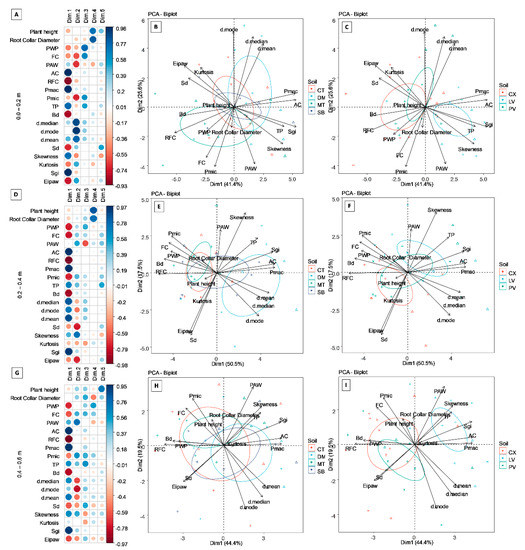
Figure 8.
Principal component analysis (PCA) of soil physical quality indicators for three soil classes: Typic Dystrustepts (CX), Rhodic Hapludults (PV), and Rhodic Hapludoxes (LV). PCA used soil properties and results of the treatments. (A,D,G) (plots on the left): variables and their contributions for each dimension. The ellipses delimit the mean values of the groups: treatments in (B,E,H) and soil classes in (C,F,I), with a confidence interval of 95%.
In general, the LV stood out at all the depths compared to other soil classes, and was affected mostly by Pmac, AC, Sgi, and skewness. CX and PV were grouped and showed better correlation with Eipaw, Sd, and RFC (Figure 8).
4. Discussion
4.1. The Effect of Tillage Practices on Pore Size Distribution
Deep tillage promotes the reorganization of the soil structure [24,75,76,77], which changes the porosity and water retention capacity of soils [75,78,79]. The effect of tillage systems on the pore distribution curves (S*(h)) at depth 0–0.2 m showed similarities between the soil classes (Figure 4A–C). This was expected, since most tillage systems mobilized this layer, except MT (ridger to mark off the plant row, reaching 0.1 m). An important aspect is that the surface was permanently covered with Brachiaria Ruziziensis, and hence there was direct influence of plant roots. The beneficial effects of this grass between the rows of perennial crops, such as coffee, have been reported by many studies [11,80], especially on bulk density and soil porosity.
The displacement of the S*(h) curves to the right observed in the DM tillage system (Figure 4), especially at 0.4–0.6 m, indicated an increase in the frequency of pores with greater diameter. This suggests a structural improvement caused by rupturing restrictive layers in CX and PV (Table 1). The DM soil tillage system is aggressive and is able to turn over/mix the entire 0–0.6 m layer. The main effect of deep tillage is observed in the macropores (>80 µm) [79,81], also known as structural pores [82], as observed herein by the mentioned displacement of the curves to the right. This is beneficial, both agronomically and environmentally [61], as it improves soil drainage and aeration, positively affecting root growth while making soils more resilient to erosional processes [11,78,83].
At 0.4–0.6 m, the displacement of the curve in CX by the DM system is directly linked to the depth of tillage. DM, which presented most frequent pore diameter of 231 µm, reached 0.6 m depth, whereas SB only reached 0.45 m, resulting in a value of 216 µm. It appears that the performance of SB and DM did not cause a sufficient change in pore diameter in PV. Its natural densification at 0.12 m (Table 1) must have hampered the performance of management systems at 0.4–0.6 m. The natural densification found in the subsurface in Ultisols is a prominent property of this soil class [84,85,86]. The consequences are the increase in Bd and the mechanical resistance of soils.
Values of Sd lower or equal to 1 mean that the pores have similar size, whereas values greater than 1 indicate variation in the size of the pores [50]. In CX, higher Sd values for the DM system at 0.2–0.4 m indicated an increase in the variation of pore diameter, improving their distribution and increasing pore diameter compared to MT. In contrast, PV presented a reduction in Sd values at this depth for the DM system compared to MT. That is, the variation of pore diameter decreased, showing that DM homogenized porosity and increased the diameter of pores, corroborating the values of d.mode, d.mean, and d.median. In LV, no tillage system was able to change pore distribution, confirming the high stability of granular structure [21,76,87]. Although treatments showed differences in d.mean and pore size for LV, the Sd value did not change (Figure 5L).
Predominant pore sizes can be measured by skewness. Positive values indicate the predominance of large pores, negative values indicate the predominance of small pores, and zero indicates a log normal distribution [50]. Here, all studied soil classes showed predominance of very small pores, with skewness <−3 [88]. Differences between treatments were observed only at depth 0.2–0.4 m, which was most affected by tillage systems, especially DM. It is known that tillage tends to increase the number of large pores [11,19,89]. However, in tilled soils, the reduction in pore size between aggregates is not uncommon [90]. Especially in clayey soils such as those studied herein, which may explain the negative values of skewness.
4.2. Deep Tillage and Limitations of Soil Classes
As mentioned, CX and PV are soil classes that exhibit natural densification of subsurface horizons (Bw and Bt, respectively) (Table 1), physical conditions unfavorable to plant development, particularly for perennial crops, since soils are only tilled once when crops are established. If the dense soil barrier is not properly ruptured, plants will permanently suffer the consequences. This is often neglected when devising tillage strategies, but the results showed that these soil classes indeed respond differently to tillage practices (Figure 6).
Soil thickness, silt content, and clay accumulation are the main limiting factors for Ultisols and Inceptisols in Brazil. In CX, the greater silt content and block structure in the Bw horizon favor natural densification [47], resulting in low soil porosity. These physical restrictions could be observed in the studied CX: its silt content almost doubled at the 0–0.05 m layer, favoring the packing of particles and increasing Bd (Table 1). Its reduced solum thickness was also noteworthy (Table 1). In Ultisols (PV), clay accumulates in the subsurface (Bt horizon), making them prone to natural densification. Values above the Bdc restrict root growth and, therefore, decrease plant yield [71]. This could be observed in PV at depths 0.2–0.4 and 0.4–0.6 m, where Bd was near the critical value.
Contrasting with CX and PV, LV has a very small and stable granular structure throughout its profile, favoring high porosity [48] and lower bulk density compared to CX and PV, explaining higher values of AC, Pmac, and Sgi, and lower values of RFC and Bd (Figure 6). However, similar to PV, Bd values were close to the critical value at 0.4–0.6 m, despite its granular structure. In this case, the rearrangement of the very small structure outweighed the beneficial effect of having homogeneous soil texture (not having clay accumulation). This clearly indicates the need to consider the soil class when choosing a tillage system. Additionally, [91] emphasized that these critical values come from investigations on annual crops (such as wheat, maize, soybean, etc.), and there is little information about perennial crops, such as atemoya.
Furthermore, LV has large pores and very small pores, in which water is both rapidly drained (large pores) and very strongly retained (small pores), greatly reducing water availability to plants [85,92,93]. There are practically no mesopores [94]. The resulting low water availability to plants explains the low RFC values for LV observed in this study [21,95]. At the surface of LV (0–0.2 m), tillage systems led to a large increase in structural pores, due to its granular structure, hindering water retaining capacity (Figure 6B,C). Therefore, the hypothesis of this study was confirmed, considering that LV responded differently to management systems compared to the other studied soils.
The results confirmed the effectiveness of the DM system in breaking the naturally dense soil layers of PV and CX, favoring water infiltration and plant rooting. This could be observed in studied soils by the increase in Pmac and reduction in Bd, especially in the SB and DM treatments (deep tillage systems) (Figure 5). Similar results were also found by [19,21,96,97,98]. Ref. [19] reported that in the presence of soil layers that restricted root growth, especially compacted layers, deep tillage increased crop yield by 20% compared to other tested tillage methods. The increase in available water favors transpiration and water flow in plants, and also improves nutrient uptake [99], especially by mass flow, as showed by PAW correlations with plant development parameters (Figure 7).
The DM tillage system greatly affected Pmac values. Studies performed by [100] showed that in intensive tillage (plowing), structural pores predominated (pores > 200 μm), whereas in the no-tillage system, there was predominance of textural porosity (pores < 12 μm). Deep tillage reduces the mechanical impedance of soils [101], thereby increasing the density, diameter, and length of plant roots [13]. The increase in Pmac caused by DM enhances soil AC [102], since these pores are directly related to oxygen supply to roots [103]. Increasing Pmac also improves drainage, reducing the risks of water erosion [104], especially for PV and CX, which in the study region occur on slopes of 12% to 45% and on slopes > 45%, respectively [105].
As aforementioned, the depth 0–0.2 m was highly affected by tillage systems and plant cover. However, some systems did not improve soil conditions at 0.2–0.4 m and 0.4–0.6 m. For instance, at 0.2–0.4 m, little or no effect was observed from MT and CT. At 0.4–0.6 m, MT, CT, and SB did not improve AC significantly, as it presented values lower than 0.1 cm3.cm−3, which may compromise plant yield [61,106]. Yet, in terms of Pmac values, no tillage system indicated compaction or consolidation, regardless of soil class [69,70]. Pmac values were all within the optimal range, which suggests that the critical limits of AC are not adequate to evaluate the effect of tillage systems in the studied soil classes, especially of deep tillage. Both AC and Pmac are capacity properties that define a potential or generalized condition, not defining the entire aeration process, which has a spatial-temporal dynamic [2,107]. This implies accuracy limitations of the capacity indicators.
4.3. Deep Tillage Applied to Sustainable and Productive Crop Management
Prolonged high productivity in intense agricultural systems is deeply connected with sustainable practices. Intense agriculture without due care negatively impacts long-term productivity [108,109]. Naturally, following what was exposed in former sections, choosing the adequate tillage system is essential to guarantee a sustainable and productive crop system [110].
For instance, the structural loosening driven by management practices is crucial for CX and PV, as they are common classes in Brazil. Their high-density layer of pedogenetic origin behaves similar to a compacted layer (from human activity) and increases the risk of water erosion [111,112], water infiltration restrictions [85], and limit the development of crops by restricting root growth [113].
Deep soil tillage in pre-planting, associated with other management practices, such brachiaria grass between rows, makes it possible for a larger volume of soil to be explored by roots in soils that have compacted or densified layers, or soils that are shallow or have low permeability [19,23,24]. Consequently, deep tillage improves root development at depth and reduces water stress [96,100,114]. Subsoiling was performed by [115] between the rows of a 14-year-old orange orchard and led to a reduction in bulk density and resistance to penetration, along with an increase in microporosity. These improvements in soil physical quality resulted in an increase of 31% in the weight of fruit produced. In this study, since there were no differences between the tillage systems in the surface layer (Figure 6), it was not possible to identify correlations that could act as robust indicators of the initial growth of atemoya plants.
Thus, as observed by [11], deep tillage increased the number of large pores, i.e., increased empty spaces in soil. More empty spaces led to better water and air flows, favoring the development of the root system in coffee [21,95], a common perennial crop in Brazil. This dynamic may bring mid- to long-term benefits to atemoya and other perennial plants (orchards and eucalyptus, for example), which encourages future studies.
Studies on the duration of the effects of physical–hydraulic changes stemming from deep tillage (greater than 0.3 m depth) and their implications on the longevity and yield of perennial crops are rare, but should be encouraged, as long-term soil management practices knowingly affect soil properties [116,117,118]. Ref. [11] reported improvements in soil physical quality at depth one year after establishment of coffee plants, and highlighted significant increases in aeration capacity and water availability. The authors used tillage systems similar to those studied here in a Typic Dystrustepts, also similar to the CX of this study. Similarly, [119] detected that the positive effects of deep tillage in a Luvisol in Belgium remained 2 years after tillage.
Therefore, the effectiveness of tillage systems was highly dependent on inherent properties of the studied soil classes. Taking soil class into account is needed to achieve a mor productive and sustainable system. The most noteworthy factor that affected tillage results was the subsurface horizon of CX and PV. These had denser underlying layers due to their block structure and natural densification, which could be perceived even at 0–0.2 m. These two classes benefited more from deep tillage than LV. The main point was that CX and PV did not respond equally to tillage treatments. Although most of quality indicators did not show differences, PCA and Sgi clearly showed that the granular structure of LV responded differently to tillage systems compared to CX and PV, corroborating the main hypothesis of this study (Figure 6E,J,O and Figure 8).
5. Conclusions
Soil classes responded differently to tillage systems. Soil classes responded differently to soil tillage systems. DM was most effective in soils with densified layers (Inceptisol and Ultisol). Effects were less expressive in the studied Oxisol. Comparing the least aggressive tillage system (MT) and deep tillage (DM), Pmac increased by more than 100% in the studied Ultisol, but by less than 20% in the Oxisol. The choice of optimal tillage strategies should consider soil-specific properties, especially at greater depths, to guarantee more productive and sustainable crop systems.
Deep tillage was the system that most improved soil physical quality, providing greater structural relief. The highest values for bulk density (Bd) were observed for MT (1.47 g cm−3), and the lowest for DM (1.21 g cm−3). The studied Inceptisol and Ultisol, which presented natural physical restrictions (densified layers), showed better response to deep tillage. The effect of the treatments was less expressive in the studied Oxisol, due to its small size, granular structure, and high stability.
The physical indicators of soil quality that better explained data variability were relative field capacity (RFC, 97%), aeration capacity (AC, 95%), macroporosity (Pmac, 95%), the S index (Sgi) and bulk density (Bd, 81%). The results showed that the soil class has important implications for the effect of the management system, especially when assessing the effect of management in greater soil depths. Therefore, deciding the optimal tillage strategies must involve the soil class properties, especially to greater depths, in order to guarantee a more sustainable and productive agricultural system.
Author Contributions
Conceptualization: R.P.A., B.M.S.; Data curation, formal analysis, and investigation: R.P.A., L.d.C.M.d.S., F.A.C.P., B.M.S.; Funding acquisition and resources: B.M.S.; Writing—original draft preparation: R.P.A., B.M.S.; Writing—review and editing: L.d.C.M.d.S., F.A.C.P., P.M.P., L.A.S.P., M.M., N.C., B.M.S. All authors have read and agreed to the published version of the manuscript.
Funding
This research was funded by the National Council for Scientific and Technological Development (CNPq), Coordination for the Improvement of Higher Education Personnel (CAPES), Minas Gerais State Agency for Research and Development (FAPEMIG), and Embrapa.
Institutional Review Board Statement
Not applicable.
Informed Consent Statement
Not applicable.
Data Availability Statement
Data will be made available upon reasonable request.
Acknowledgments
The authors are grateful for the support of the Soil Science Department (DCS) of the Federal University of Lavras (UFLA). They also thank Geraldo César de Oliveira for partnership and contributions, Sérgio Henrique Godinho Silva for the classification of studied soils, Júlio de Sousa Bueno Filho and the technical team of the Fruit Farming sector of the Department of Agriculture (DAG) of UFLA, and Luiz O. Pagotto, Laura B.B. Melo, and Erika A. Silva for assistance in setting up and conducting the experiment. Bruno M. Silva and Nilton Curi are grateful to the CNPq for research productivity fellowships.
Conflicts of Interest
The authors declare no conflict of interest.
References
- Angst, G.; Mueller, K.E.; Kögel-Knabner, I.; Freeman, K.H.; Mueller, C.W. Aggregation controls the stability of lignin and lipids in clay-sized particulate and mineral associated organic matter. Biogeochemistry 2017, 132, 307–324. [Google Scholar] [CrossRef]
- Rabot, E.; Wiesmeier, M.; Schlüter, S.; Vogel, H.J. Soil structure as an indicator of soil functions: A review. Geoderma 2018, 314, 122–137. [Google Scholar] [CrossRef]
- Smith, C.W.; Johnston, M.A.; Lorentz, S. Assessing the compaction susceptibility of South African forestry soils. I. The effect of soil type, water content and applied pressure on uni-axial compaction. Soil Tillage Res. 1997, 41, 53–73. [Google Scholar] [CrossRef]
- Hermawan, B.; Cameron, K.C. Structural changes in a silt loam under long-term conventional or minimum tillage. Soil Tillage Res. 1993, 26, 139–150. [Google Scholar] [CrossRef]
- Blanco-Canqui, H.; Ruis, S.J. No-tillage and soil physical environment. Geoderma 2018, 326, 164–200. [Google Scholar] [CrossRef]
- Singh, H.; Northup, B.K.; Rice, C.W.; Prasad, P.V.V. Biochar applications influence soil physical and chemical properties, microbial diversity, and crop productivity: A meta-analysis. Biochar 2022, 4, 8. [Google Scholar] [CrossRef]
- Özbolat, O.; Sánchez-Navarro, V.; Zornoza, R.; Egea-Cortines, M.; Cuartero, J.; Ros, M.; Pascual, J.A.; Boix-Fayos, C.; Almagro, M.; de Vente, J.; et al. Long-term adoption of reduced tillage and green manure improves soil physicochemical properties and increases the abundance of beneficial bacteria in a Mediterranean rainfed almond orchard. Geoderma 2023, 429, 116218. [Google Scholar] [CrossRef]
- Daly, E.J.; Kim, K.; Hernandez-Ramirez, G.; Klimchuk, K. The response of soil physical quality parameters to a perennial grain crop. Agric. Ecosyst. Environ. 2023, 343, 108265. [Google Scholar] [CrossRef]
- Carter, M.R. Microbial biomass as an index for tillage-induced changes in soil biological properties. Soil Tillage Res. 1986, 7, 29–40. [Google Scholar] [CrossRef]
- Reichert, J.M.; Morales, C.A.S.; de Bastos, F.; Sampietro, J.A.; Cavalli, J.P.; Araújo, E.F.; Srinivasan, R. Tillage recommendation for commercial forest production: Should tillage be based on soil penetrability, bulk density or more complex, integrative properties? Geoderma Reg. 2021, 25, e00381. [Google Scholar] [CrossRef]
- Barbosa, S.M.; Silva, B.M.; de Oliveira, G.C.; Benevenute, P.A.N.; Silva, R.F.; Curi, N.; da Silva Moretti, B.; Silva, S.H.G.; Norton, L.D.; Pereira, V.M. Deep furrow and additional liming for coffee cultivation under first year in a naturally dense inceptisol. Geoderma 2020, 357, 113934. [Google Scholar] [CrossRef]
- Singh, K.; Choudhary, O.P.; Singh, H.P.; Singh, A.; Mishra, S.K. Sub-soiling improves productivity and economic returns of cotton-wheat cropping system. Soil Tillage Res. 2019, 189, 131–139. [Google Scholar] [CrossRef]
- Dal Ferro, N.; Sartori, L.; Simonetti, G.; Berti, A.; Morari, F. Soil macro- and microstructure as affected by different tillage systems and their effects on maize root growth. Soil Tillage Res. 2014, 140, 55–65. [Google Scholar] [CrossRef]
- Secco, D.; Reinert, D.J.; Reichert, J.M.; da Silva, V.R. Atributos físicos e rendimento de grãos de trigo, soja e milho em dois Latossolos compactados e escarificados. Ciênc. Rural 2009, 39, 58–64. [Google Scholar] [CrossRef]
- Wang, L.; Guo, H.; Wang, L.; Cheng, D. Suitable tillage depth promotes maize yields by changing soil physical and chemical properties in a 3-year experiment in the North China Plain. Sustainability 2022, 14, 15134. [Google Scholar] [CrossRef]
- Lima, C.C.; Maria, I.C.; Silva Júnnyor, W.G.S.; Figueiredo, G.C.; Dechen, S.C.F.; Bolonhezi, D. ROOT parameters of sugarcane and soil compaction indicators under deep strip tillage and conventional tillage. Sci. Rep. 2022, 12, 18537. [Google Scholar] [CrossRef]
- Kautz, T.; Amelung, W.; Ewert, F.; Gaiser, T.; Horn, R.; Jahn, R.; Javaux, M.; Kemna, A.; Kuzyakov, Y.; Munch, J.-C.; et al. Nutrient acquisition from arable subsoils in temperate climates: A review. Soil Biol. Biochem. 2013, 57, 1003–1022. [Google Scholar] [CrossRef]
- Wiesmeier, M.; Hübner, R.; Barthold, F.; Spörlein, P.; Geuß, U.; Hangen, E.; Reischl, A.; Schilling, B.; von Lützow, M.; Kögel-Knabner, I. Amount, distribution and driving factors of soil organic carbon and nitrogen in cropland and grassland soils of southeast Germany (Bavaria). Agric. Ecosyst. Environ. 2013, 176, 39–52. [Google Scholar] [CrossRef]
- Schneider, F.; Don, A.; Hennings, I.; Schmittmann, O.; Seidel, S.J. The effect of deep tillage on crop yield—What do we really know? Soil Tillage Res. 2017, 174, 193–204. [Google Scholar] [CrossRef]
- Kirkegaard, J.A.; Lilley, J.M.; Howe, G.N.; Graham, J.M.; Kirkegaard, J.A.; Lilley, J.M.; Howe, G.N.; Graham, J.M. Impact of subsoil water use on wheat yield. Aust. J. Agric. Res. 2007, 58, 303–315. [Google Scholar] [CrossRef]
- Silva, B.M.; Oliveira, G.C.; Serafim, M.E.; Silva, É.A.; Ferreira, M.M.; Norton, L.D.; Curi, N. Critical soil moisture range for a coffee crop in an oxidic latosol as affected by soil management. Soil Tillage Res. 2015, 154, 103–113. [Google Scholar] [CrossRef]
- Scanlan, C.A.; Davies, S.L. Soil mixing and redistribution by strategic deep tillage in a sandy soil. Soil Tillage Res. 2019, 185, 139–145. [Google Scholar] [CrossRef]
- Serafim, M.E.; Oliveira, G.C.; Oliveira, A.S.; Lima, J.M.; Guimarães, P.T.G.; Costa, J.C. Sistema conservacionista e de manejo intensivo do solo no cultivo de cafeeiros na região do Alto São Francisco, MG: Um estudo de caso. Biosci. J. 2011, 27, 964–977. [Google Scholar]
- Serafim, M.E.; de Oliveira, G.C.; Vitorino, A.C.T.; Silva, B.M.; Carducci, C.E. Qualidade física e intervalo hídrico ótimo em Latossolo e Cambissolo, cultivados com cafeeiro, sob manejo conservacionista do solo. Rev. Bras. Ciênc. Solo 2013, 37, 733–742. [Google Scholar] [CrossRef]
- Henry, C.G.; Sarzi Sartori, G.M.; Gaspar, J.P.; Marchesan, E.; Hirsh, S.M.; Horton, A.P.; Espinoza, L.; James, H. Deep tillage and gypsum amendments on fully, deficit irrigated, and dryland soybean. Agron. J. 2018, 110, 737–748. [Google Scholar] [CrossRef]
- Gong, J.; Zheng, Z.; Zheng, B.; Liu, Y.; Hu, R.; Gong, J.; Li, S.; Tian, L.; Tian, X.; Li, J.; et al. Deep tillage reduces the dependence of tobacco (Nicotiana tabacum L.) on arbuscular mycorrhizal fungi and promotes the growth of tobacco in dryland farming. Can. J. Microbiol. 2022, 68, 203–213. [Google Scholar] [CrossRef]
- Campos, M.; Rossato, O.B.; Marasca, I.; Martello, J.M.; Siqueira, G.F.; Garcia, C.P.; Rossetto, R.; Calonego, J.C.; Cantarella, H.; Crusciol, C.A.C. Deep tilling and localized liming improve soil chemical fertility and sugarcane yield in clayey soils. Soil Tillage Res. 2022, 222, 105425. [Google Scholar] [CrossRef]
- Shukla, S.K.; Yadav, R.L.; Gupta, R.; Singh, A.K.; Awasthi, S.K.; Gaur, A. Deep tillage, soil moisture regime, and optimizing n nutrition for sustaining soil health and sugarcane yield in subtropical India. Commun. Soil Sci. Plant Anal. 2018, 49, 444–462. [Google Scholar] [CrossRef]
- Garcia, C.P. Efeitos do Preparo Profundo do Solo e da Calagem na Compactação do Solo e na Produtividade da Cana-de-açúcar. Master’s thesis, State University of São Paulo, São Paulo, Brazil, 2018. [Google Scholar]
- Marasca, I.; Lemos, S.V.; Silva, R.B.; Guerra, S.P.S.; Lanças, K.P. Soil compaction curve of an Oxisol under sugarcane planted after in-row deep tillage. Rev. Bras. Ciênc. Solo 2015, 39, 1490–1497. [Google Scholar] [CrossRef]
- Scarpare, F.V.; van Lier, Q.d.J.; Camargo, L.; Pires, R.C.M.; Ruiz-Corrêa, S.T.; Bezerra, A.H.F.; Gava, G.J.C.; Dias, C.T.S. Tillage effects on soil physical condition and root growth associated with sugarcane water availability. Soil Tillage Res. 2019, 187, 110–118. [Google Scholar] [CrossRef]
- Lee, J.; Choi, M.; Choi, N.; Kim, G.; Lee, Y.; Bae, H.; Na, C. The effects of planting date and tillage practice on growth and yield of maize and soybean in rotation with winter onion. Agronomy 2022, 12, 2125. [Google Scholar] [CrossRef]
- Lipiec, J.; Hatano, R. Quantification of compaction effects on soil physical properties and crop growth. Geoderma 2003, 116, 107–136. [Google Scholar] [CrossRef]
- Imhoff, S.; Silva, A.P.; Fallow, D. Susceptibility to compaction, load support capacity, and soil compressibility of Hapludox. Soil Sci. Soc. Am. J. 2004, 68, 17–24. [Google Scholar] [CrossRef]
- Nhantumbo, A.B.J.C.; Cambule, A.H. Bulk density by Proctor test as a function of texture for agricultural soils in Maputo province of Mozambique. Soil Tillage Res. 2006, 87, 231–239. [Google Scholar] [CrossRef]
- Keller, T.; Håkansson, I. Estimation of reference bulk density from soil particle size distribution and soil organic matter content. Geoderma 2010, 154, 398–406. [Google Scholar] [CrossRef]
- Suzuki, L.E.A.S.; Reichert, J.M.; Reinert, D.J. Degree of compactness, soil physical properties and yield of soybean in six soils under no-tillage. Soil Res. 2013, 51, 311. [Google Scholar] [CrossRef]
- Keisuke, M.S.; Lima, H.V.; de Oliveira, P.D.; Rodrigues, S. Critical soil bulk density for soybean growth in Oxisols. Int. Agrophysics 2015, 29, 441–447. [Google Scholar] [CrossRef][Green Version]
- Pott, L.P.; Amado, T.J.C.; Leal, O.A.; Ciampitti, I.A. Mitigation of soil compaction for boosting crop productivity at varying yield environments in southern Brazil. Eur. J. Soil Sci. 2019, 71, 1157–1172. [Google Scholar] [CrossRef]
- Etana, A.; Holm, L.; Rydberg, T.; Keller, T. Soil and crop responses to controlled traffic farming in reduced tillage and no-till: Some experiences from field experiments and on-farm studies in Sweden. Acta Agric. Scand. Sect. B—Soil Plant Sci. 2020, 70, 333–340. [Google Scholar] [CrossRef]
- Alvares, C.A.; Stape, J.L.; Sentelhas, P.C.; Moraes Gonçalves, J.L.; Sparovek, G. Köppen’s climate classification map for Brazil. Meteorol. Z. 2013, 22, 711–728. [Google Scholar] [CrossRef]
- INMET—Instituto Nacional de Meteorologia. Climate Data. Available online: https://portal.inmet.gov.br/ (accessed on 25 November 2022).
- Curi, N.; Silva, S.H.G.; Poggere, G.C.; Menezes, M.D. Mapeamento de Solos e Magnetismo no Campus da UFLA Como Traçadores Ambientais; UFLA: Lavras, MG, Brazil, 2017; ISBN 978-85-8127-052-4. [Google Scholar]
- Soil Survey Staff. Keys to Soil Taxonomy, 12th ed.; USDA-NRCS: Washington, DC, USA, 2014. [Google Scholar]
- Santos, H.G.; Jacomine, P.K.T.; Anjos, L.H.C.; Oliveira, V.Á.; Lumbreras, J.F.; Coelho, M.R.; Almeida, J.A.; Araújo Filho, J.C.; Oliveira, J.B.; Cunha, T.J.F. Sistema Brasileiro de Classificação de Solos, 5th ed.; Embrapa: Brasília, DF, Brazil, 2018; ISBN 978-85-7035-800-4. [Google Scholar]
- Sawe, B.E. USDA Soil Taxonomy: Soil Orders and Their Major Characteristics. Available online: https://www.worldatlas.com/articles/usda-soil-taxonomy-soil-orders-and-their-major-characteristics.html (accessed on 25 November 2022).
- Pereira, T.T.C.; Ker, J.C.; Schaefer, C.E.G.R.; de Barros, N.F.; Neves, J.C.L.; Almeida, C.C. Gênese de Latossolos e Cambissolos desenvolvidos de rochas pelíticas do grupo Bambuí—Minas Gerais. Rev. Bras. Ciênc. Solo 2010, 34, 1283–1295. [Google Scholar] [CrossRef]
- Ferreira, M.M.; Fernandes, B.; Curi, N. Influência da mineralogia da fração argila nas propriedades físicas de Latossolos da região sudeste do Brasil. Rev. Bras. Ciênc. Solo 1999, 23, 515–524. [Google Scholar] [CrossRef]
- Teixeira, P.C.; Donagemma, G.K.; Fontana, A.; Teixeira, W.G. Manual de Métodos de Análise de Solo, 3rd ed.; Embrapa Solos: Brasília, DF, Brazil, 2017. [Google Scholar]
- Reynolds, W.D.; Drury, C.F.; Tan, C.S.; Fox, C.A.; Yang, X.M. Use of indicators and pore volume-function characteristics to quantify soil physical quality. Geoderma 2009, 152, 252–263. [Google Scholar] [CrossRef]
- Mafes. BigMix AS-2, Preparador de Solo. Available online: http://mafes.com.br/big_mix.html (accessed on 25 November 2022).
- Rozane, D.E.; Natale, W. Calagem, adubação e nutrição mineral de Anonáceas. Rev. Bras. Frutic. 2014, 36, 166–175. [Google Scholar] [CrossRef][Green Version]
- Klute, A. Water retention: Laboratory methods. In SSSA Book Series; Klute, A., Ed.; Soil Science Society of America, American Society of Agronomy: Madison, WI, USA, 2018; pp. 635–662. ISBN 978-0-89118-864-3. [Google Scholar]
- van Genuchten, M.T. A Closed-form Equation for Predicting the Hydraulic Conductivity of Unsaturated Soils. Soil Sci. Soc. Am. J. 1980, 44, 892–898. [Google Scholar] [CrossRef]
- Mualem, Y. A new model for predicting the hydraulic conductivity of unsaturated porous media. Water Resour. Res. 1976, 12, 513–522. [Google Scholar] [CrossRef]
- Van Genuchten, M.T.; Leij, F.J.; Yates, S.R. The RETC Code for Quantifying the Hydraulic Functions of Unsaturated Soils; Robert, S., Kerr Environmental Research Laboratory, Office of Research and Development, Eds.; U.S. Environmental Protection Agency: Washington, DC, USA, 1992. [Google Scholar]
- Dexter, A.R. Soil physical quality. Part I. Theory, effects of soil texture, density, and organic matter, and effects on root growth. Geoderma 2004, 120, 201–214. [Google Scholar] [CrossRef]
- Asgarzadeh, H.; Mosaddeghi, M.R.; Mahboubi, A.A.; Nosrati, A.; Dexter, A.R. Integral energy of conventional available water, least limiting water range and integral water capacity for better characterization of water availability and soil physical quality. Geoderma 2011, 166, 34–42. [Google Scholar] [CrossRef]
- Andrews, S.S.; Mitchell, J.P.; Mancinelli, R.; Karlen, D.L.; Hartz, T.K.; Horwath, W.R.; Pettygrove, G.S.; Scow, K.M.; Munk, D.S. On-farm assessment of soil quality in California’s Central Valley. Agron. J. 2002, 94, 12–23. [Google Scholar] [CrossRef]
- Dunteman, G. Principal Components Analysis; Sage: Newbury Park, CA, USA, 2022. [Google Scholar]
- White, R.E. Principles and Practice of Soil Science: The Soil as a Natural Resource, 4th ed.; Blackwell Publishing: Malden, MA, USA, 2006; ISBN 978-0-632-06455-7. [Google Scholar]
- Doran, J.W.; Mielke, L.N.; Power, J.F. Microbial activity as regulated by soil water-filled pore space. In Proceedings of the Transactions 14th International Congress of Soil Science, Kyoto, Japan, 12–19 August 1990; Volume 3, pp. 94–99. [Google Scholar]
- Linn, D.M.; Doran, J.W. Effect of water-filled pore space on carbon dioxide and nitrous oxide production in tilled and nontilled soils. Soil Sci. Soc. Am. J. 1984, 48, 1267–1272. [Google Scholar] [CrossRef]
- Skopp, J.; Jawson, M.D.; Doran, J.W. Steady-state aerobic microbial activity as a function of soil water content. Soil Sci. Soc. Am. J. 1990, 54, 1619–1625. [Google Scholar] [CrossRef]
- Peele, T.C. Relation of percolation rates through saturated soil cores to volume of pores drained in 15 and 30 minutes under 60 centimeters tension. Soil Sci. Soc. Am. J. 1950, 14, 359–361. [Google Scholar] [CrossRef]
- Grohmann, F. Distribuição e tamanho de poros em três tipos de solos do Estado de São Paulo. Bragantia 1960, 19, 319–328. [Google Scholar] [CrossRef]
- Dexter, A.R.; Czyż, E.A.; Richard, G.; Reszkowska, A. A user-friendly water retention function that takes account of the textural and structural pore spaces in soil. Geoderma 2008, 143, 243–253. [Google Scholar] [CrossRef]
- Reynolds, W.D.; Drury, C.F.; Yang, X.M.; Tan, C.S. Optimal soil physical quality inferred through structural regression and parameter interactions. Geoderma 2008, 146, 466–474. [Google Scholar] [CrossRef]
- Drewry, J.J.; Cameron, K.C.; Buchan, G.D. Effect of simulated dairy cow treading on soil physical properties and ryegrass pasture yield. N. Z. J. Agric. Res. 2001, 44, 181–190. [Google Scholar] [CrossRef]
- Drewry, J.J.; Paton, R.J.; Drewry, J.J.; Paton, R.J. Soil physical quality under cattle grazing of a winter-fed brassica crop. Soil Res. 2005, 43, 525–531. [Google Scholar] [CrossRef]
- Reichert, J.M.; Suzuki, L.E.A.S.; Reinert, D.J.; Horn, R.; Håkansson, I. Reference bulk density and critical degree-of-compactness for no-till crop production in subtropical highly weathered soils. Soil Tillage Res. 2009, 102, 242–254. [Google Scholar] [CrossRef]
- Andrade, R.d.S.; Stone, L.F. Índice S como indicador da qualidade física de solos do cerrado brasileiro. Rev. Bras. Eng. Agríc. E Ambient. 2009, 13, 382–388. [Google Scholar] [CrossRef]
- R Core Team. R: A Language and Environment for Statistical Computing; R Foundation for Statistical Computing: Vienna, Austria, 2022; Available online: https://www.r-project.org (accessed on 25 November 2022).
- Pagliai, M. Soil porosity aspects. Int. Agrophysics 1988, 4, 215–232. [Google Scholar]
- Silva, B.M.; Oliveira, G.C.; Serafim, M.E.; Silva, É.A.; de Oliveira, L.M. Índice s no diagnóstico da qualidade estrutural de Latossolo muito argiloso sob manejo intensivo. Biosci. J. 2012, 28, 338–345. [Google Scholar]
- Silva, É.A.; Geraldo, C.d.O.; Carla, E.C.; José, M.d.L.; Laura, B.B.d.M.; Pedro, A.N.B. Stability of soil aggregates in Latosols and Cambisols via standard method and sonification. Afr. J. Agric. Res. 2016, 11, 3894–3903. [Google Scholar] [CrossRef]
- Azevedo, R.P.; Corinto, L.M.; Peixoto, D.S.; Figueiredo, T.; Silveira, G.C.D.; Peche, P.M.; Pio, L.A.S.; Pagliari, P.H.; Curi, N.; Silva, B.M. Deep tillage strategies in perennial crop installation: Structural changes in contrasting soil classes. Plants 2022, 11, 2255. [Google Scholar] [CrossRef] [PubMed]
- Carducci, C.E.; Oliveira, G.C.; Curi, N.; Heck, R.J.; Rossoni, D.F.; Carvalho, T.S.; Costa, A.L. Gypsum effects on the spatial distribution of coffee roots and the pores system in oxidic Brazilian Latosol. Soil Tillage Res. 2015, 145, 171–180. [Google Scholar] [CrossRef]
- Fleck, A.G.; Marchesan, E.; Schlosser, J.F.; de Oliveira, D.S.; Prochnow, M.H.; Soares, C.F.; Herzog, D. Soil deep tillage performed before soybean cultivation on the rice cultivation in the following harvest. Ciênc. Rural 2023, 53, e20210621. [Google Scholar] [CrossRef]
- Rocha, O.C.; Ramos, M.L.G.; Veiga, A.D.; Guerra, A.F.; Bartholo, G.F.; Rodrigues, G.C.; Silva, J.E. Chemical and hydrophysical attributes of an Oxisol under coffee intercropped with brachiaria in the Cerrado. Pesqui. Agropecuária Bras. 2016, 51, 1476–1483. [Google Scholar] [CrossRef]
- Brewer, R. Fabric and Mineral Analysis of Soils; John Wiley: Hooboken, NJ, USA, 1964. [Google Scholar]
- Dexter, A.R.; Richard, G. Tillage of soils in relation to their bi-modal pore size distributions. Soil Tillage Res. 2009, 103, 113–118. [Google Scholar] [CrossRef]
- Valentine, T.A.; Hallett, P.D.; Binnie, K.; Young, M.W.; Squire, G.R.; Hawes, C.; Bengough, A.G. Soil strength and macropore volume limit root elongation rates in many UK agricultural soils. Ann. Bot. 2012, 110, 259–270. [Google Scholar] [CrossRef]
- Gonçalves, M.G.M.; Ker, J.C.; de Oliveira, F.S.; Ramos, L.O.S.; Pacheco, A.A.; Curi, N. Lateral loss of clay in the genesis of Luvisols in the Semi-Arid Depression of the Jequitinhonha Valley, Minas Gerais—Brazil. Ciênc. E Agrotecnologia 2019, 43, e0182. [Google Scholar] [CrossRef]
- Oliveira, G.C.; Silva, B.M.; Carducci, C.E.; Silva, S.H.G.; Serafim, M.E.; Barbosa, S.M.; Silva, E.A.; Melo, L.B.B.; Benevenute, P.A.N. Melhoria físico-hídrica do ambiente radicular do cafeeiro em condições de sequeiro e implicações no uso da água. In Tópicos em Ciência do Solo; Severiano, E.C., Moraes, M.F., Paula, A.M., Eds.; Sociedade Brasileira de Ciência do Solo (SBCS): Viçosa, MG, Brazil, 2019; pp. 70–140. [Google Scholar]
- Busscher, W.J.; Edwards, J.H.; Vepraskas, M.J.; Karlen, D.L. Residual effects of slit tillage and subsoiling in a hardpan soil. Soil Tillage Res. 1995, 35, 115–123. [Google Scholar] [CrossRef]
- Batista, A.M.; Libardi, P.L.; Giarola, N.F.B. Evaluation of the soil aggregation induced by the plant roots in an Oxisol by turbidimetry and water percolation. Rhizosphere 2020, 16, 100265. [Google Scholar] [CrossRef]
- Blott, S.J.; Pye, K. GRADISTAT: A grain size distribution and statistics package for the analysis of unconsolidated sediments. Earth Surf. Process. Landf. 2001, 26, 1237–1248. [Google Scholar] [CrossRef]
- Peixoto, D.S.; da Silva, L.d.C.M.; de Melo, L.B.B.; Azevedo, R.P.; Araújo, B.C.L.; de Carvalho, T.S.; Moreira, S.G.; Curi, N.; Silva, B.M. Occasional tillage in no-tillage systems: A global meta-analysis. Sci. Total Environ. 2020, 745, 140887. [Google Scholar] [CrossRef] [PubMed]
- Li, X.; Zhang, L.M. Characterization of dual-structure pore-size distribution of soil. Can. Geotech. J. 2009, 46, 129–141. [Google Scholar] [CrossRef]
- França, J.S.; Reichert, J.M.; Holthusen, D.; Rodrigues, M.F.; Araújo, E.F. Subsoiling and mechanical hole-drilling tillage effects on soil physical properties and initial growth of eucalyptus after eucalyptus on steeplands. Soil Tillage Res. 2021, 207, 104860. [Google Scholar] [CrossRef]
- Oliveira, V.A.; Jacomine, P.T.K.; Couto, E.G. Solos do Bioma Cerrado. In Pedologia: Solos dos Biomas Brasileiros; Curi, N., Ker, J.C., Novais, R.F., Vidal-Torrado, P., Schaefer, C.E.G.R., Eds.; Sociedade Brasileira de Ciência do Solo: Viçosa, MG, Brazil, 2017; pp. 117–226. [Google Scholar]
- Skorupa, A.L.A.; Tassinari, D.; Silva, S.H.G.; Poggere, G.C.; Zinn, Y.L.; Curi, N. Xanthic and Rhodic Acrudoxes under Cerrado vegetation: Differential internal drainage and covarying micromorphological properties. Ciênc. E Agrotecnologia 2016, 40, 443–453. [Google Scholar] [CrossRef]
- Resende, M.; Curi, N.; Rezende, S.B.; Corrêa, G.F.; Ker, J.C. Pedologia: Base para Distinção de Ambientes, 6th ed.; UFLA: Lavras, MG, Brazil, 2014. [Google Scholar]
- Carducci, C.E.; de Oliveira, G.C.; Severiano, E.d.C.; Zeviani, W.M. Modelagem da curva de retenção de água de Latossolos utilizando a Equação Duplo Van Genuchten. Rev. Bras. Ciênc. Solo 2011, 35, 77–86. [Google Scholar] [CrossRef]
- Querejeta, J.I.; Roldán, A.; Albaladejo, J.; Castillo, V. Soil water availability improved by site preparation in a Pinus halepensis afforestation under semiarid climate. For. Ecol. Manag. 2001, 149, 115–128. [Google Scholar] [CrossRef]
- Cai, H.; Ma, W.; Zhang, X.; Ping, J.; Yan, X.; Liu, J.; Yuan, J.; Wang, L.; Ren, J. Effect of subsoil tillage depth on nutrient accumulation, root distribution, and grain yield in spring maize. Crop J. 2014, 2, 297–307. [Google Scholar] [CrossRef]
- Ramadhan, M.N. Yield and yield components of maize and soil physical properties as affected by tillage practices and organic mulching. Saudi J. Biol. Sci. 2021, 28, 7152–7159. [Google Scholar] [CrossRef]
- Zhang, X.; Liu, Z.; Shao, X.; Kong, Y.; Lyu, Y.; Wang, Y. Deep tillage improves the grain yield and nitrogen use efficiency of maize (Zea mays L.) under a wide–narrow row alternative system in Northeast China. Int. J. Plant Prod. 2022, 16, 63–76. [Google Scholar] [CrossRef]
- Lipiec, J.; Kuś, J.; Słowińska-Jurkiewicz, A.; Nosalewicz, A. Soil porosity and water infiltration as influenced by tillage methods. Soil Tillage Res. 2006, 89, 210–220. [Google Scholar] [CrossRef]
- Lipiec, J.; Horn, R.; Pietrusiewicz, J.; Siczek, A. Effects of soil compaction on root elongation and anatomy of different cereal plant species. Soil Tillage Res. 2012, 121, 74–81. [Google Scholar] [CrossRef]
- Thomasson, A.J. Towards an objective classification of soil structure. J. Soil Sci. 1978, 29, 38–46. [Google Scholar] [CrossRef]
- Grable, A.R.; Siemer, E.G. Effects of bulk density, aggregate size, and soil water suction on oxygen diffusion, redox potentials, and elongation of corn roots. Soil Sci. Soc. Am. J. 1968, 32, 180–186. [Google Scholar] [CrossRef]
- Mentges, M.I.; Reichert, J.M.; da Rosa, D.P.; Vieira, D.A.; da Rosa, V.T.; Reinert, D.J. Propriedades físico-hídricas do solo e demanda energética de haste escarificadora em Argissolo compactado. Pesqui. Agropecuária Bras. 2010, 45, 315–321. [Google Scholar] [CrossRef][Green Version]
- Lacerda, M.P.C.; Andrade, H.; Quéméneur, J.J.G. Micropedologia da alteração em perfis de solos com B textural na região de Lavras, Minas Gerais. Rev. Bras. Ciênc. Solo 2000, 24, 829–841. [Google Scholar] [CrossRef]
- Watanabe, S.H.; Tormena, C.A.; Araújo, M.A.; Vidigal Filho, P.S.; Pintro, J.C.; Costa, A.C.S.; Muniz, A.S. Propriedades físicas de um Latossolo Vermelho Distrófico influenciadas por sistemas de preparo do solo utilizados para implantação da cultura da mandioca. Acta Sci. Agron. 2008, 24, 1255. [Google Scholar] [CrossRef]
- Horn, R.; Kutilek, M. The intensity–capacity concept—How far is it possible to predict intensity values with capacity parameters. Soil Tillage Res. 2009, 103, 1–3. [Google Scholar] [CrossRef]
- Janusauskaite, D.; Kadziene, G. Influence of different intensities of tillage on physiological characteristics and productivity of crop-rotation plants. Plants 2022, 11, 3107. [Google Scholar] [CrossRef]
- Zhang, S.; Huang, G.; Zhang, Y.; Lv, X.; Wan, K.; Liang, J.; Feng, Y.; Dao, J.; Wu, S.; Zhang, L.; et al. Sustained productivity and agronomic potential of perennial rice. Nat. Sustain. 2022, 1–11. [Google Scholar] [CrossRef]
- Li, L.; Guan, J.; Chen, S.; Zhang, X. Intermittent deep tillage on improving soil physical properties and crop performance in an intensive cropping system. Agronomy 2022, 12, 688. [Google Scholar] [CrossRef]
- Gao, W.; Hodgkinson, L.; Jin, K.; Watts, C.W.; Ashton, R.W.; Shen, J.; Ren, T.; Dodd, I.C.; Binley, A.; Phillips, A.L.; et al. Deep roots and soil structure: Rooting depth. Plant Cell Environ. 2016, 39, 1662–1668. [Google Scholar] [CrossRef] [PubMed]
- Souza, L.d.S.; Souza, L.D.; Paiva, A.d.Q.; Rodrigues, A.C.V.; Ribeiro, L.d.S. Distribuição do sistema radicular de citros em uma toposseqüência de solos de tabuleiro costeiro do Estado da Bahia. Rev. Bras. Ciênc. Solo 2008, 32, 503–513. [Google Scholar] [CrossRef][Green Version]
- Bengough, A.G.; McKenzie, B.M.; Hallett, P.D.; Valentine, T.A. Root elongation, water stress, and mechanical impedance: A review of limiting stresses and beneficial root tip traits. J. Exp. Bot. 2011, 62, 59–68. [Google Scholar] [CrossRef]
- Santos, W.J.R.; Silva, B.M.; Oliveira, G.C.; Volpato, M.M.L.; Lima, J.M.; Curi, N.; Marques, J.J. Soil moisture in the root zone and its relation to plant vigor assessed by remote sensing at management scale. Geoderma 2014, 221–222, 91–95. [Google Scholar] [CrossRef]
- Medeiros, J.C.; Figueiredo, G.C.; Mafra, Á.L.; Rosa, J.D.; Yoon, S.W. Deep subsoiling of a subsurface-compacted typical hapludult under citrus orchard. Rev. Bras. Ciênc. Solo 2013, 37, 911–919. [Google Scholar] [CrossRef]
- Xie, B.; Chen, Y.; Cheng, C.; Ma, R.; Zhao, D.; Li, Z.; Li, Y.; An, X.; Yang, X. Long-term soil management practices influence the rhizosphere microbial community structure and bacterial function of hilly apple orchard soil. Appl. Soil Ecol. 2022, 180, 104627. [Google Scholar] [CrossRef]
- Shumba, A.; Chikowo, R.; Corbeels, M.; Six, J.; Thierfelder, C.; Cardinael, R. Long-term tillage, residue management and crop rotation impacts on N2O and CH4 emissions from two contrasting soils in sub-humid Zimbabwe. Agric. Ecosyst. Environ. 2023, 341, 108207. [Google Scholar] [CrossRef]
- Piccoli, I.; Seehusen, T.; Bussell, J.; Vizitu, O.; Calciu, I.; Berti, A.; Börjesson, G.; Kirchmann, H.; Kätterer, T.; Sartori, F.; et al. Opportunities for mitigating soil compaction in Europe—Case studies from the soilcare project using soil-improving cropping systems. Land 2022, 11, 223. [Google Scholar] [CrossRef]
- Ren, L.; Cornelis, W.M.; Ruysschaert, G.; De Pue, J.; Lootens, P.; D’Hose, T. Quantifying the impact of induced topsoil and historical subsoil compaction as well as the persistence of subsoiling. Geoderma 2022, 424, 116024. [Google Scholar] [CrossRef]


Disclaimer/Publisher’s Note: The statements, opinions and data contained in all publications are solely those of the individual author(s) and contributor(s) and not of MDPI and/or the editor(s). MDPI and/or the editor(s) disclaim responsibility for any injury to people or property resulting from any ideas, methods, instructions or products referred to in the content. |
© 2022 by the authors. Licensee MDPI, Basel, Switzerland. This article is an open access article distributed under the terms and conditions of the Creative Commons Attribution (CC BY) license (https://creativecommons.org/licenses/by/4.0/).