Article

Effect of Farm Size on Sustainability Dimensions: Case of Durum Wheat in Northern Tunisia

1
National Institute of Agronomic Research of Tunisia (LER, INRAT), University of Carthage, Carthage 1054, Tunisia
2
National Research Institute for Rural Engineering Water & Forestry (INRGREF), University of Carthage, Carthage 1054, Tunisia
3
Higher Agronomic Institute of Chott Meriem, University of Sousse, B.P. n° 47, Sousse 4042, Tunisia
*
Author to whom correspondence should be addressed.
Sustainability 2023, 15(1), 779; https://doi.org/10.3390/su15010779
Submission received: 3 August 2022 / Revised: 14 October 2022 / Accepted: 12 December 2022 / Published: 31 December 2022

Abstract

:
The sustainability analysis of wheat farms is increasingly becoming interesting for the scientific community in order to help propose a production model ensuring food security and sustainability of agricultural production. This work aims to assess cereal farms’ sustainability in Northern Tunisia via analyzing the effect of farm size on sustainability dimensions. Toward this aim, the Farm Sustainability Indicators (IDEA) method and statistical tests (ANOVA, LSD) were used for the analysis of the obtained data from a representative sample consisting of 200 farms—located in the governorates of Beja, Jendouba and Bizerte—with different sizes (<5 ha; 5–20 ha and more than 20 ha). The IDEA method is built from three indicators of sustainability (environmental, social and economic) in agriculture. The results showed a very high variability in the sustainability scores of durum wheat farms. In fact, the scores relating to each sustainability dimension vary according to the farm size. Overall, the results highlight that small farms are the most economically vulnerable despite being friendly to the environment. However, large farms were relatively more viable, but less environmentally friendly.

1. Introduction

In Tunisia, the production of cereals faces multiple challenges. Cereals are considered staple foods in Tunisians’ diet, providing 52% of total calories and 53% of total protein. According to National Institute of Statistics (INS) data from 2020, Tunisians are major cereal product consumers with a per capita consumption of 174 kg/year [1]. The cereal policy designed and followed since independence has evolved from a state volunteerism, targeting the intensification and modernization of the agricultural production to best control the sector, to a distributive economy, in favor of consumers, and finally, to a “protectionist liberalism” in which the control of the sector is largely managed by the state. It is widely recognized that food security is strongly linked to the development of the cereal sector as far as it represents a basic and a strategic agricultural product.
The cereal sector is by far the largest contributor of the agricultural sector. Cereal cultivation totals nearly 33% of the useful agricultural area (UAA) and comprises around 248,500 farms (50% of the total number of farms), in which barley is grown in 11,542 farms larger than 50 ha (5% of farms, holding 40% of the land) while farms smaller than 10 ha represent only 63% of the total workforce [2]. Cereal production contributes an average of 13% to the agricultural added value and supplies materials to several other agricultural and industrial sectors. It is a major source of feed for livestock through its products, byproducts and sub-products and feeds various processing chain such as flour and semolina mills.
Additionally, this sector has a key role in strengthening the stability of rural communities by preserving agricultural employment. Cereal farming provides 2.5 million working days annually, or 9% of total agricultural employment in Tunisia [3].
Cereals production is also important for crop rotation and helps protect more than 1000 thousand hectares against erosion during the growing cycle, which is spread over 7 months, consequently protecting the watersheds compared to fallow, particularly under increasing pressure on natural resources such as soil and water, often leading to the resilience of various ecosystems [4]. However, the income from cereal farming is dependent on the world market and characterized by an increasing price volatility and fluctuating supply (as a result of climate change), political and economic upheavals in the country and expanding demand for population growth and food transition caused by changing consumer habits. Therefore, it is important to assess the sustainability of cereal farms in order to ensure national food security by reducing the food balance deficit (30% in 2021) and cereal deficit (43% in 2021) by implementing suitable strategies and shifting from productive to sustainable cereal production models.
Measuring the sustainability of farms using different indicators is a key tool for shaping suitable strategies and assessing their consequent impact [5]. In most used methods, the evaluation criteria at the farm level should be in agreement with the three specific sustainability dimensions reported by [6]: being sustainable means economically viable, socially equitable and ecologically reproducible.
Various methods and indicators were previously proposed for measuring and assessing the sustainability of farms. At least sixty indicator-based sustainability measurement methods have been developed [7]. Previously, Moller et al. (2014) estimated the sustainability of cereal farms using the Agricultural Production Systems Simulator Model (APSIM) [8]. Calabresse et al., in 2016, compared potato and wheat production systems using only two dimensions of economic and environmental sustainability in Switzerland [9]. In agriculture, this triptych has sometimes evolved into a four-dimensional version: viability, livability, reproducibility and transmissibility. According to Feschet et al. (2014), several French multi-criteria evaluation methods applied to agricultural systems have been the subject of an in-depth analysis [10]. Recently, Refs. [11,12,13] showed significant diversity in methods based on sustainability indicators. Among these, the IDEA method [14,15,16] is actually one of the widely used sustainability assessment methods in the European Union [17]. Attia et al. (2021) evaluated and compared the sustainability of small-sized dairy cattle farms belonging to three farming systems (rainfed, irrigated and mixed) located in Northern Tunisia [18].
Various researchers analyzed the sustainability of wheat crop production [17,19,20,21,22,23,24,25,26]. However, the effect of the farm size has not been considered so far. Nevertheless, recently, Fallahinjed et al. (2022) studied the effect of farm size on sustainability of wheat production in Iran using the emergy approach [25]. The authors noticed higher yield/unit area using less renewable environmental resources produced in large-sized farms compared to small- and medium-sized farms. Previously, the focus of the research was mainly concentrated on the effect of farm size on the technical efficiency; however, few have analyzed the effect of farm size on cereal crop sustainability [27,28]. The diagnosis of cereal farms targets the analysis and identification of the causes of the dysfunction of this sector and helps design solutions and shapes suitable strategies against the main constraints hampering farm performance at the technical, social, economic and environmental levels.
In Tunisia, sustainability has previously been the subject of several works of agricultural research. M’hamdi et al. (2009) assessed the sustainability of dairy farms [29]. Lajimi et Ben Nacer (2009) compared the sustainability of organic and conventional oil-producing farms [30]. Bouzaida et al. (2019) assessed the sustainability of irrigated farms in arid Tunisian areas [31]. Ben Abdallah et al. (2020) assessed the environmental sustainability of oil olive cultivation [32]. Attia et al. (2022) assessed and compared the sustainability of small-sized dairy farms for cattle farming in the North of Tunisia [33]. However, to our knowledge, no studies dealing with cereal sector, specifically durum wheat in Northern Tunisia using in-depth statistical analyses, were conducted. In order to fill this gap, we have contributed to answering the following research question: Does farm size affect the sustainability of durum wheat production?
Although the effect of farm size has been largely assessed in different agricultural systems, the determination of the sustainability of durum wheat farms under sub-humid climatic conditions (the most favorable areas for cereal crops) using the Farm Sustainability Indicators (IDEA) method has not been previously undertaken. Therefore, different hypotheses were proposed as follows:
H1: 
The farm size affects the total sustainability score similarly;
H2: 
The three sustainability dimensions are affected differently by the farm size;
H3: 
The small-sized farms are economically sustainable.

2. Methodology

2.1. Method for Assessment of Farms’ Sustainability (IDEA)

The IDEA method was used to estimate the sustainability of cereal farms under the sub-humid climatic conditions of Tunisia. This method was designed and optimized to serve as a decision-making tool. The used data were provided voluntarily and anonymously by the interested parties [33]. Indicators generally provide an overview on dependent variables that are more difficult to access. They also serve as a benchmark for making a decision [34].
Initially, the IDEA method was proposed as an educational tool suitable for agricultural education and farmers to introduce the concept of measurable sustainable farming. Since then, its use has gradually expanded to other purposes such as research, support for change and advice for agricultural development. Indeed, this method was revised twice in 2003, and then again in 2008. The IDEA Scientific Committee conducted a research work which thoroughly renewed its conceptual framework, evaluative grids and indicators, culminating in the IDEA version4 (IDEAv4) method [7]. The main advantage of the IDEA method is its sensitivity, allowing us to observe differences in sustainability not only between different-sized farms but also within the same farm size and production system [35].

2.2. Identification of Sustainability Indicators

The IDEA method is based on several indicators covering the three dimensions of sustainability: economic, environmental and social. This method assigns a determinate score to each indicator. The total value of sustainability dimensions is the cumulative value of indicator scores and has a maximum value of 100 points.
Total   sustainability   ( Farm   j )   = k = 1 3 d i m e n s i o n k i = 1 n s c o r e s i
where: k is the dimension of sustainability;
  • i is score of indicators;
  • j is the number of the farm.

2.2.1. Economic Sustainability Indicators

The economic sustainability scale is composed of 8 indicators. Table 1 defines these indicators, their calculation and their maximum value. The reported indicators were selected on the basis of a literature review and also take into account our commodity case study (cereal). The total sum value of the scores is 33 points.

2.2.2. Social Sustainability Indicators

The social sustainability scale consists of seven indicators. Table 2 defines these indicators, their calculation and their maximum value. The maximum total value for social sustainability dimension is 33 points.

2.2.3. Environmental Sustainability Indicators
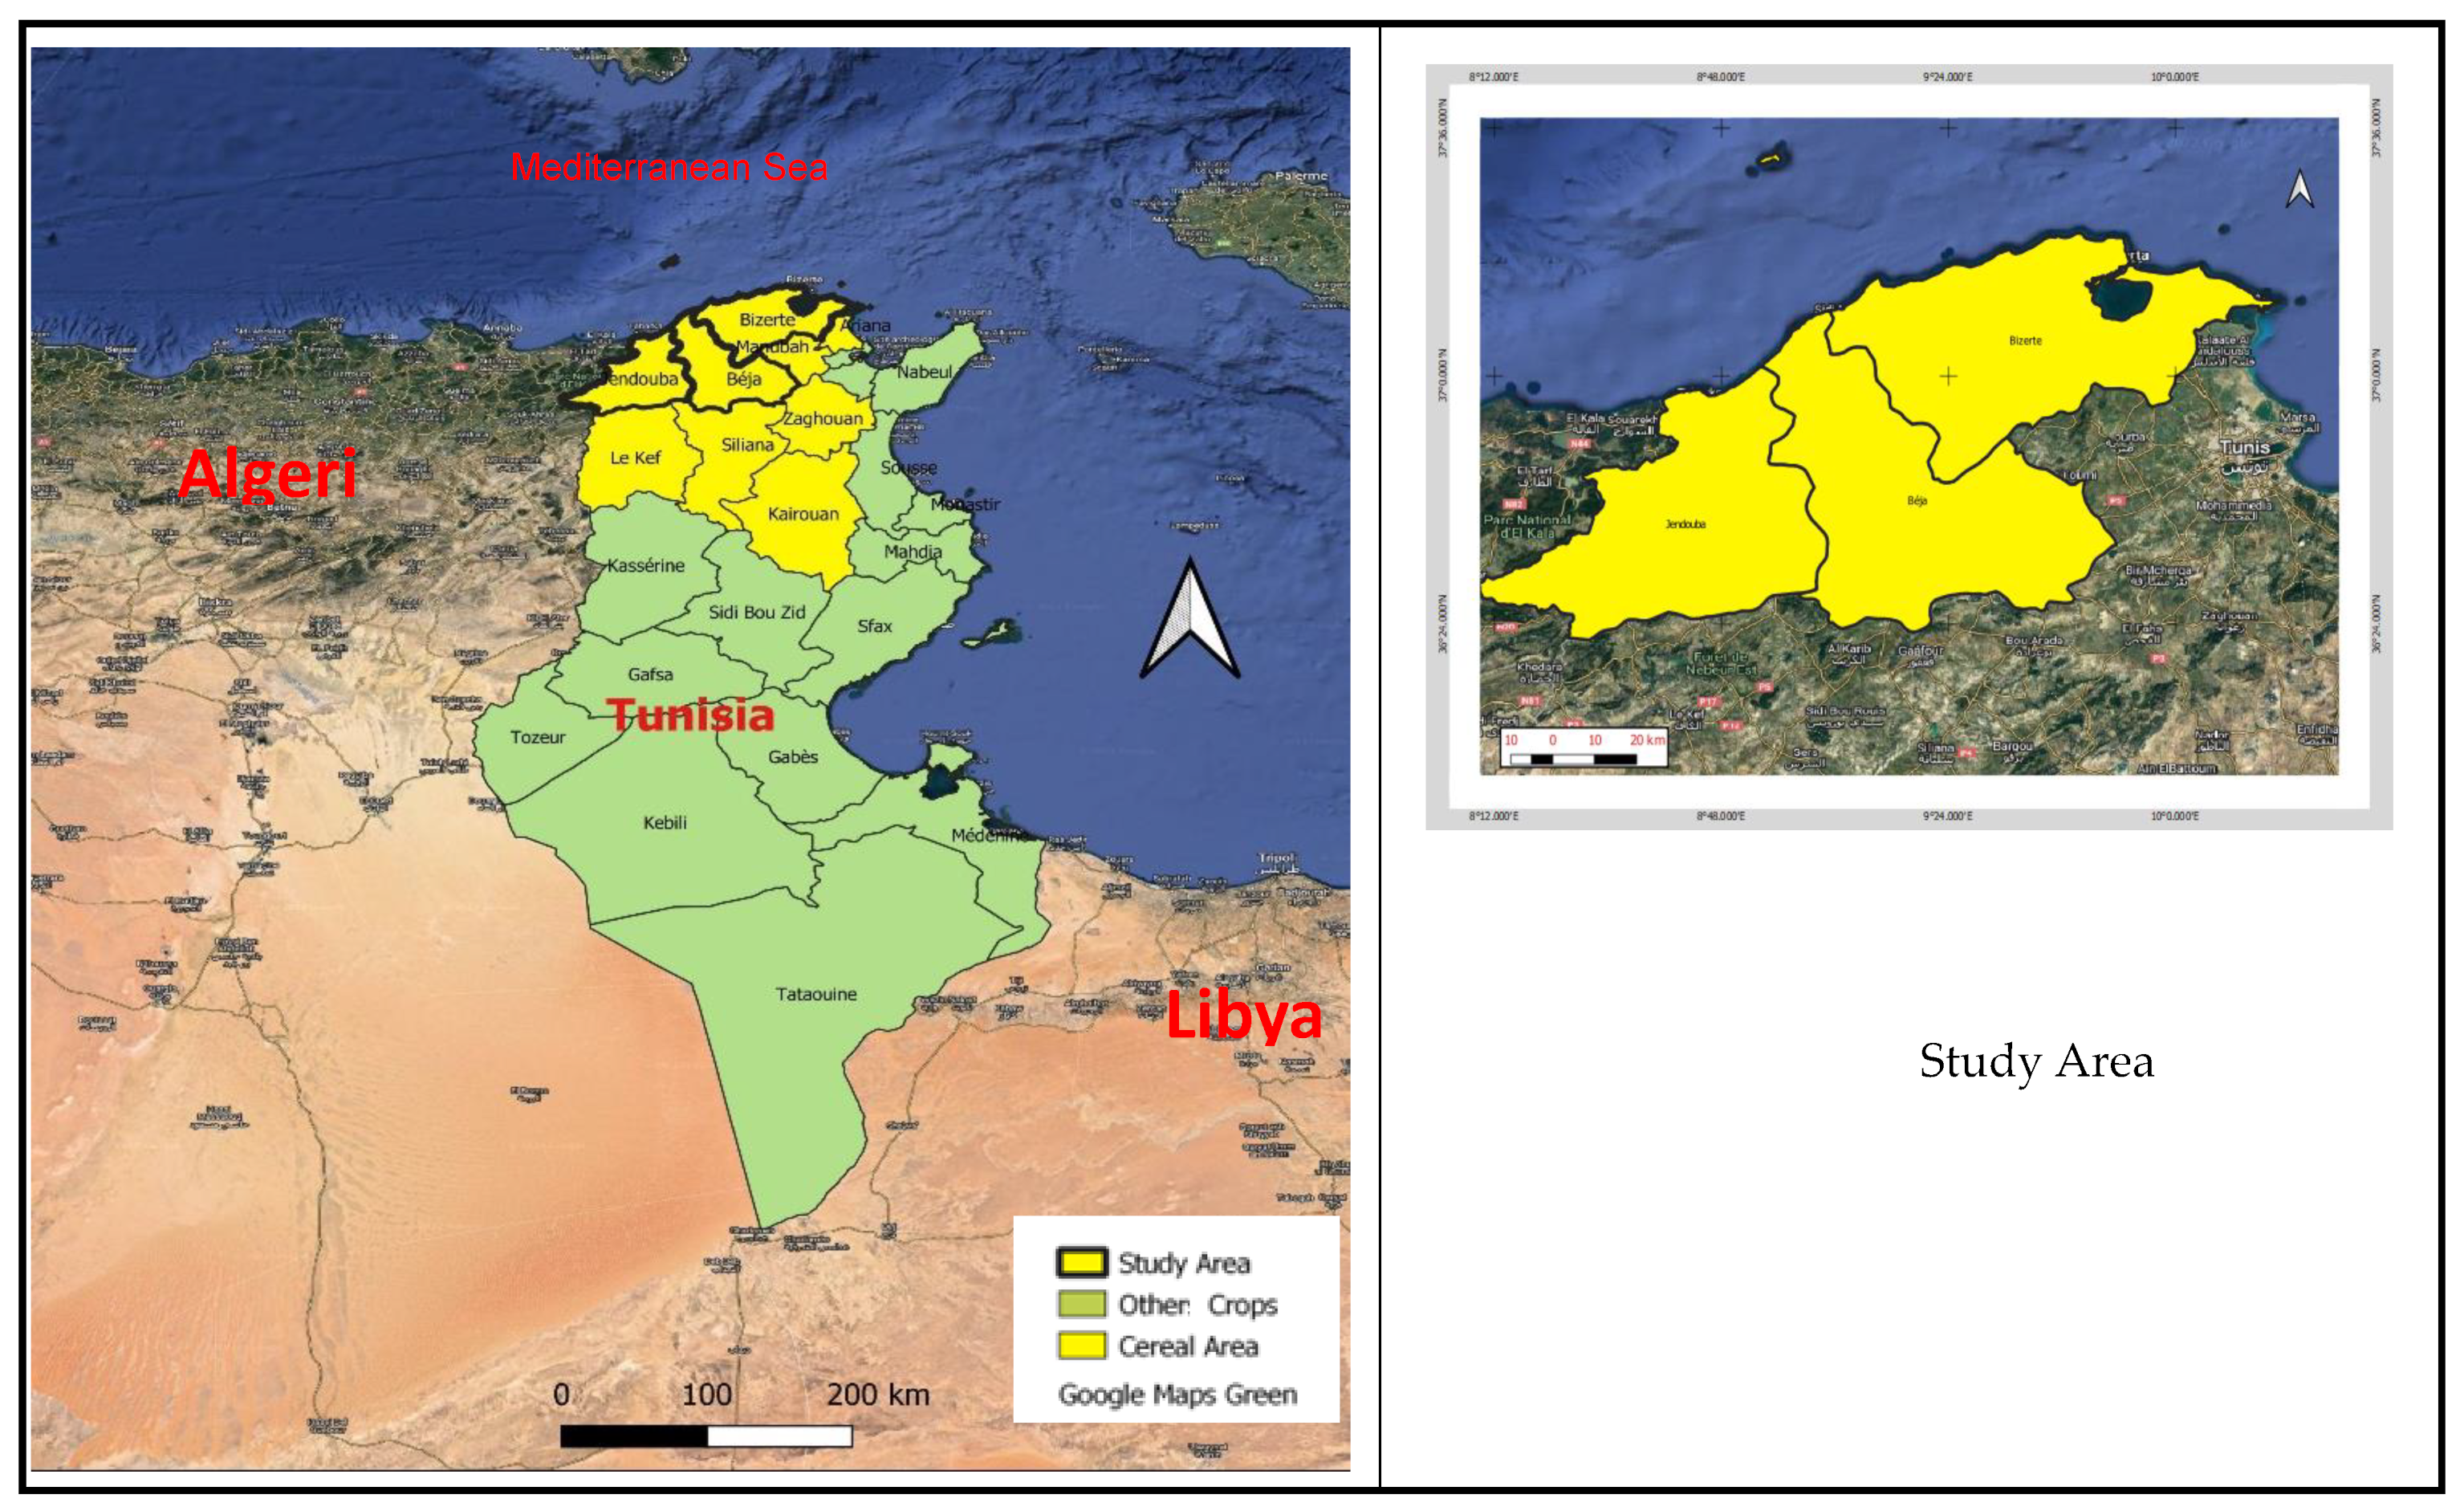
The environmental scale involves 9 indicators. Table 3 defines these indicators, their calculation and their maximum value. The total sum value of the scores of the environmental sustainability scale is 33 points.

2.3. Study Area

The technical and socio-economic diagnosis concerned the three main cereal governorates of the country in terms of durum wheat production. The three governorates (Beja, Bizerte and Jendouba) are located in the sub-humid zone of the country, the most favorable zone for cereal production, particularly durum wheat (Figure 1). This area is characterized by rainfall between 500 and 700 mm/year.
In terms of area, these regions account for 13% of UAA; cereal farming occupies nearly 50% of the arable area. Durum wheat is grown to take up 70% of the cereal area. The three regions account for 46% of Tunisia’s durum wheat production (Table 4). It is also noted that it is the oldest area used for the cultivation of wheat.
In this work, a questionnaire survey was carried out among 200 cereal farms in 2020 in the three governorates of Beja, Jendouba and Bizerte. The surveyed farmers were selected according to the size and the type of farms. This is a stratified sampling spread over the three regions and stratum of durum wheat area (0–5 ha; 5–20 ha; and more than 20 ha). The choice was made with the heads of the Regional Agricultural Development Commissions (CRDA) in order to have an equal distribution between the different strata and regions. However, given the difficult conditions encountered during the course of the survey, we reduced the sample to 200 durum wheat producers, taking into account the size of the farms and their production.

3. Results

3.1. Assessment of Sustainability Dimensions by Farm Size

All farms that were surveyed in the three different sub-humid regions produce cereals. The obtained results from the IDEA method reveal that the overall sustainability of farms is, on average, 61.37. The total score is 61, 59 and 64 points, respectively, for farm sizes of 0.1–5 ha, 10–20 ha and >20 ha (Table 5). These results show a very high variability in sustainability scores for the surveyed farms. The total sustainability of cereal farms is low and ranges from 30 to 80.
Regarding these scores by dimensions, the lowest scores were recorded in the economic sustainability dimension. The average scores for social, environmental and economic sustainability were 22, 23 and 15, respectively. These scores varied from 12 to 38, from 14 to 61, and from 0 to 30 for social, environmental and economic sustainability, respectively (Table 5).

3.2. Economic Sustainability

The economic sustainability is the lowest compared to other scales. This is confirmed for all categories of farms.
Economic sustainability is shown in Figure 2. The IDEA method has shown that the sensitivity of cereal farms to aid is medium. In addition, the majority of indicators related to the surveyed cereal farms, namely economic efficiency, financial autonomy, capital efficiency and labor compensation, are average. However, the two indicators that pose challenges for economic sustainability are diversity and trade vulnerability. This is normal since the production of cereals is an activity administered by the cereals board, which is the only operator in the national market.
In terms of economic sustainability, large farms were the most successful (Figure 2) and economically efficient, with greater capital efficiency and more flexible financial autonomy than small- and medium-sized farms. It should be noted that small-sized farms with an area of less than 5 ha are more economically viable than medium-sized farms (5 to 20 ha).

3.3. Social Sustainability

Social sustainability is more respected in the group of large farms due to additional means to open up to their social environment. Likewise, these farms have a significant employability capacity and high staffing rates.
For social sustainability, the axis of the land footprint is the most respected. Indeed, the land-use rate in these regions is 100%. On the other hand, the other variables, represented by occupational openness, workforce, socio-economic viability and transmissibility axis and territorial anchoring, are weak.
For the environmental sustainability, shown in Figure 3, cereals do not cause a problem regarding global warming similar to any other agricultural activity. Thus, this activity, although it is mechanized [35], does not affect energy dependence. However, the mineral balance indicators, the herbicide and other pesticides use index, soil and water conservation work (SWC), biodiversity and rotation are poorly respected.

3.4. Environmental Sustainability

Figure 4 highlights the environmental sustainability scale by farm size. The environmental sustainability is more respected in small farms than in large ones. They are the most protective against biodiversity and limit the use of pesticides. This could be explained by the lack of financial capacity to buy the required amount of very expensive pesticide input [36].

3.5. Multiple Comparison of Sustainability and Farm Size

In order to test the effect of farm size on the different dimensions of sustainability, the multiple comparison LSD test was used. This test showed that the difference in social sustainability is significant between the large-farm group (more than 20 ha) and the other two groups (<5 ha and 5–20 ha). For environmental sustainability, the difference is only statistically significant (at 5%) between large- (more than 20 ha) and small-sized farms (<5 ha). On the other hand, the difference in economic sustainability is statistically significant at 10% between the small-, medium- and large-farm groups (Table 6).

4. Discussions

The knowledge of the relationship between sustainability and farm size is essential for the development and implementation of suitable agricultural strategies and policies in Tunisia, especially regarding strategic crops such as wheat [35,37].
Our study of the relationship between the sustainability of wheat production and the size of farms aims to highlight the effect of farm size on sustainability and to put in place a targeted strategy for sustainable development in accordance with economic, environmental and social components. The results of this work showed that the durability scores ranged from 59% to 64%, which is in agreement with the study of [18,30,32], who previously estimated the sustainability of Tunisian farms.
The results obtained show a great variability in the scores of sustainability according to the size of farms. In fact, the relationship between scores of sustainability of durum wheat production and farm size was confirmed. Therefore, our three study hypotheses are accepted.
Total sustainability of durum wheat in Northern Tunisia ranged from 54 to 64%. This is similar to that of Italy, where durum wheat is the most cultivated cereal [19]. In both Mediterranean countries, durum wheat is essential in the diet, being the basis for the processing of different products such as pasta, couscous, bulgur and bread. Furthermore, the level of sustainability of Iranian wheat is similar to those of Italian and Tunisian wheat [30,36,38,39].
Our results also showed that the lowest scores were noticed at the economic scale in agreement with the results of [18], who showed that the rainfed system prompted average performances of the three dimensions and that the lowest scores are observed at economic scale. The results also showed that the relationship between farm size is significant regarding the three dimensions of sustainability. However, [18] results showed that the socio-territorial scale was the limiting factor for all systems and that the irrigated system exhibited the lowest scores of environmental and social scales, compared to others, but it recorded the highest score for the economic dimension. The mixed system exhibited the highest environmental and social scores but also the lowest score regarding the economic scale. Finally, the rainfed system showed medium performances for the three sustainability scales.
The social sustainability scores were higher than the economic scores. This result is in concordance with the studies conducted by Attia et al. (2022) [18]. It is justified by the education level of farmers in Tunisia [29].
The economic aspect and, in particular, the profitability of wheat production and sustainable agriculture are highly criticized in the literature [27]. In Tunisia, the aspects to be improved are mainly related to institutional and political orientations to support cereal-based systems and make them sustainable. Thus, the sustainability of wheat production can be achieved by adjusting agricultural behavior to more sustainable practices and by modulating the policies of decision makers. In fact, improving the incomes of wheat producers could be a priority through direct aid [32] and/or through the liberalization of wheat prices [35], which must be adjusted at least to international market prices.
The results showed that there was no difference between the three farm sizes on the economic scale, which was different from that of M’Hamdi et al. (2009), who found that the economic scale presented significant variability between dairy farms [29]. However, market diversification and commercial vulnerability, which are two components of the economic scale that assesses the efficiency of the grain market, were nil. This is explained by the state policy which monopolizes the durum wheat market.
The IDEA method can be adapted in different case studies. Moreover, advanced statistical methods can be used to improve the robustness of the obtained results.
Despite the significance of the obtained results, this study presents also some limitations. First, the IDEA method is based on subjective indicators and improved methods could be considered for better estimation of these indicators. Additionally, the data should be collected and analyzed using multiple analytical methods rather than a single method. Finally, these results are limited to a sub-humid climate condition and should be extended to cover this behavior in other regions under different climatic conditions.

5. Conclusions

This work presents the assessment results of the sustainability of durum wheat farms in the different sub-humid regions of Northern Tunisia based on cereal-producing farms’ surveys assessed following the IDEA method.
This study confirmed the hypothesis of the global sustainability of durum wheat production in northern Tunisia. The results obtained showed a great variability in the scores of sustainability according to the size of the exploitation. Large farms are generally more sustainable than the other two groups. Indeed, the scores relating to each sustainability dimension (social, environmental and economic) varied according to farm size. However, the hypothesis regarding the relationship between farm size and sustainability was confirmed. Therefore, targeting specific interventions for each category of farm according to the failing indicators is of great importance.
According to the assessment of economic sustainability scores (commercial vulnerability, market diversification), the government should be releasing the wheat prices and markets, especially of durum wheat, in order to improve these scores. In addition, based on the lowest score of economic autonomy, reducing credit constraints is also suggested regardless of the farm size.
Encouraging farmers to join farmers’ associations and scaling up extension services are also suggested, especially to small farms, to strengthening the social scale of sustainability.
Finally, from an environmental sustainability perspective, the use of pesticides should be carefully considered, especially in large-sized farms. In this regard, to improve environmental sustainability, the promotion of precision agriculture, crop rotation and implementation of best practices and soil conservation are crucial and highly recommended.

Author Contributions

Conceptualization, A.C.; Methodology, C.T.; Formal analysis, Z.R. All authors have read and agreed to the published version of the manuscript.

Funding

This research was funded by European Union Horizon 2020 program under FOODLAND project.

Acknowledgments

We thank the anonymous reviewers for their careful reading and their constructive comments on an earlier version of this paper. We acknowledge helpful funding from the European Union Horizon 2020 program under FOODLAND project.

Conflicts of Interest

The authors declare no conflict of interest.

References

  1. National Institute of Statistics (INS), Tunisia. Annual Statistical Repport. 2020. Available online: http://www.ins.tn/ar/publication (accessed on 19 June 2022).
  2. Ministry of Agriculture, Water Resources and Fisheries, Tunisia. Annual Statistical Report. 2020. Available online: https://www.onagri.nat.tn/statistiques (accessed on 6 June 2020).
  3. Khaldi, R.; Saaidia, B. Analyse de la filière céréalière en Tunisie et identification des principaux points de dysfonctionnement à l’origine des pertes. Projet Réduction des pertes et gaspillage alimentaires à travers le développement des chaînes de valeur pour la sécurité alimentaire en Egypte et en Tunisie GCP/RNE/004/ITA.FAO. 2018. Available online: http://www.onagri.nat.tn/uploads/Etudes/RapportIVF.pdf (accessed on 6 June 2020).
  4. Toufa, D.A.; Woldeamanuel, T.; Hailec, F. Smallholder farmers’ vulnerability and adaptation to climate change induced case of Northern Ethiopia highlands. J. Agric. Food Res. 2022, 8, 100312. [Google Scholar]
  5. Landais, E. Agriculture durable: Les fondements d’un nouveau contrat social ? Courr. Environ. 1998, 33, 5–22. [Google Scholar]
  6. Barbier, J.M.; Lopez-Ridaura, S. Évaluation de la durabilité des systèmes de production agricoles: Limites des démarches normatives et voies d’amélioration. In Actes du Colloque ISDA, Innovation et Développement Durable Dans L’agriculture et L’agroalimentaire; CIRAD-INRA-SupAgro: Montpellier, France, 2010. [Google Scholar]
  7. Zahm, F.; Alonso Ugaglia, A.; Barbier, J.-M.; Boureau, H.; De l’homme, B.; Gafsi, M.; Gasselin, P.; Girard, S.; Guichard, L.; Loyce, C.; et al. Évaluer la durabilité des exploitations agricoles. La méthode IDEAv4, un cadre conceptuel combinant dimensions et propriétés de la durabilité. Cah. Agric. 2019, 28, 5. [Google Scholar] [CrossRef] [Green Version]
  8. Moeller, C.; Sauerborn, J.; Voil, P.; Manschadi, A.M.; Pala, M.; Meink, H. Assessing the sustainability of wheat-based cropping systems using simulation modelling: Sustainability. Sustain. Sci. 2014, 9, 1–16. [Google Scholar] [CrossRef] [Green Version]
  9. Calabrese, C.; Breitenmoser, S.; Simon Spycher, S.; Bau, R.; Mouran, P. Sustainability Assessment of Plant Protection Strategies in Swiss Winter Wheat and Potato Production. Agriculture 2016, 6, 3. [Google Scholar] [CrossRef] [Green Version]
  10. Feschet, P.; Bockstaller, C. Méthodes d’évaluation multicritère des systèmes agricoles et ACV sociale, quelle complémentarité? INRA, UMR LAE 4th SocSem—social-lca.cirad.fr, 2014, 18 Thema Nancy-Colmar (France). Available online: https://agritrop.cirad.fr/579180/ (accessed on 6 June 2020).
  11. Schader, C.; Grenz, J.; Meier, M.S.; Stolze, M. Scope and precision of sustainability assessment approaches to food systems. Ecol. Soc. 2014, 19, 42. [Google Scholar] [CrossRef]
  12. Lairez, J.; Feschet, P.; Aubin, J.; Bockstaller, C.; Bouvarel, I. Évaluer la durabilité en agriculture. Guide pour l’analyse multicritère des productions animales et végétales. 2015. Available online: https://www.quae.com/extract/2747 (accessed on 6 June 2020).
  13. De Olde, E.M.; Oudshoorn, F.W.; Sørensen, C.A.; Bokkers, E.A.; Boer, I.J. Assessing sustainability at farm-level: Lessons learned from a comparison of tools in practice. Ecol. Indic. 2016, 66, 391–404. [Google Scholar] [CrossRef]
  14. Vilain, L.; Boisset, K.; Girardin, P.; Guillaumin, A.; Mouchet, C.; Viaux, P.; Zahm, F. La méthode IDEA: Indicateurs de Durabilité des Exploitations Agricoles: Guide d’utilisation, 3ème éd, 2008, Dijon: Educagri Editions, Available online: https://hal.archives-ouvertes.fr/hal-02590517/ (accessed on 6 June 2020).
  15. Zahm, F.; Viaux, P.; Vilain, L.; Girardin, P.; Mouchet, C. Assessing farm sustainability with the IDEA method –From the concept of agriculture sustainability to case studies on farms. Sustain. Dev. 2008, 16, 271–281. [Google Scholar] [CrossRef]
  16. Biret, C.; Buttard, C.; Farny, M.; Lisbona, D.; Janekarnkij, P.; Barbier, J.M.; Chambon, B. Assessing sustainability of different forms of farm organization: Adaptation of IDEA method to rubber family farms in Thailand. Biotechnol. Agron. Soc. Environ. 2019, 23, 14. [Google Scholar]
  17. Coppola, F.; Haugaard-Nielsen, H.; Bastianoni, S.; Østergård, H. Sustainability assessment of wheat production using emergy. In Proceedings of the 2nd Conference of the International Society of Organic Agriculture Research ISOFAR, Modena, Italy, 16–20 June 2008. [Google Scholar]
  18. Attia, K.; Darej, C.; M’Hamdi, N.; Zahm, F.; Moujahed, N. Sustainability Assessment of Small Dairy Farms from the Main Cattle Farming Systems in the North of Tunisia. Newmedit. 2022. Available online: https://newmedit.iamb.it/2021/09/28/sustainability-assessment-of-small-dairy-farms-from-the-main-cattle-farming-systems-in-the-north-of-tunisia/ (accessed on 5 May 2022).
  19. Veisi, H.; Arezo, T.; Jafar, K.; Abdol Majid Maddavi, D.; Reza, D. Emergy evaluation of the performance and sustainability of three agricultural systems: Case of winter wheat, grain corn and spring forage corn in Dezful at khozestan province. Iran. J. Agroecol. 2017, 6, 139–151. [Google Scholar]
  20. Houshyar, E.; Wu, X.; Chen, G. Sustainability of wheat and maize production in the warm climate of southwestern Iran: An emergy analysis. J. Clean. Prod. 2018, 172, 2246–2255. [Google Scholar] [CrossRef]
  21. Amiri, Z.; Asgharipour, M.R.; Campbell, D.E.; Armin, M. A sustainability analysis of two rapeseed farming ecosystems in Khorramabad, Iran, based on emergy and economic analyses. J. Clean. Prod. 2019, 226, 1051–1066. [Google Scholar] [CrossRef] [PubMed]
  22. Liu, W.; Wang, J.; Sun, L.; Wang, T.; Li, C.; Chen, B. Sustainability evaluation of soybean-corn rotation systems in the loess plateau region of Shaanxi, China. J. Clean. Prod. 2019, 210, 1229–1237. [Google Scholar] [CrossRef]
  23. Zhao, H.; Zhai, X.; Guo, L.; Liu, K.; Huang, D.; Yang, Y.; Li, J.; Xie, S.; Zhang, C.; Tang, S. Assessing the efficiency and sustainability of wheat production systems in different climate zones in China using emergy analysis. J. Clean. Prod. 2019, 235, 724–732. [Google Scholar] [CrossRef]
  24. Yasini, H.; Ghanbari, S.A.; Asgharipour, M.R.; Seyedabadi, E. Evaluation of sustainability in wheat, onion and garlic cropping systems by joint use of emergy and economic accounting. J. Agric. Sci. Sustain. Product 2020, 30, 269–288. [Google Scholar]
  25. Fallahinejad, S.; Armin, M.; Asgharipour, M.R. The effect of farm size on the sustainability of wheat production using emergy approach. Curr. Res. Environ. Sustain. 2022, 4, 100161. [Google Scholar] [CrossRef]
  26. Bux, C.; Lombardi, M.; Varese, E.; Amicarelli, V. Economic and Environmental Assessment of Conventional versus Organic Durum Wheat Production in Southern Italy. Sustainability 2022, 14, 9143. [Google Scholar] [CrossRef]
  27. Rached, Z.; Chebil, A.; Khaldi, R. Effet de la taille sur l’efficacité technique des exploitations céréalières en Tunisie: Cas de la Région Subhumide. New Medit 2018, XVII, 81–96. [Google Scholar] [CrossRef]
  28. Bachta, M.S.; Chebil, A. Efficacité technique des exploitations céréalières de la plaine du Sers-Tunisie1. New Medit 2002, 2, 41–45. [Google Scholar]
  29. M’Hamdi, N.; Aloulou, R.; Hedhly, M.; Ben Hamouda, M. Évaluation de la durabilité des exploitations laitières tunisiennes par la méthode IDEA. Biotechnol. Agron. Soc. Environ. 2009, 13, 221–228. [Google Scholar]
  30. Laajimi, A.; Ben Nasr, J. Appréciation et comparaison de la durabilité des exploitations agricoles biologiques et conventionnelles en Tunisie: Cas de l’oléiculture dans la région de Sfax. New Medit 2009, 8, 10–19. [Google Scholar]
  31. Bouzaida, M.A.; et Doukali, H. Évaluation de la durabilité des exploitations agricoles irriguées en zones arides tunisiennes par la méthode IDEA: Cas de la région de Zarzis. New Medit 2019, 89–104. [Google Scholar] [CrossRef]
  32. Ben Abdallah, S.; Elfkih, S.; Suárez-Rey, E.M.; Parra-López, C.; Romero-Gámez, M. Evaluation of the environmental sustainability in the olive growing systems in Tunisia. J. Clean. Prod. 2021, 282, 124526. [Google Scholar] [CrossRef]
  33. Briquel, V.; Vilain, L.; Bourdais, J.-L.; Girardin, P.; Mouchet, C.; Viaux, P. La méthode IDEA (indicateurs de durabilité des exploitations agricoles): Une démarche pédagogique. Sci. Eaux Territ. 2001, 25, 29–39. [Google Scholar]
  34. Gras, R.; Benoit, M.; Deffontaines, J.-P.; Duru, M.; Lafarge, M.; Langlet, A.; Osty, P.-L. Le fait technique en agronomie-Activité agricole, concepts et méthodes d’étude, 1989, INRA–Editions L’Harmattan. Available online: https://www.persee.fr/doc/geo_0003-4010_1990_num_99_556_21009_t1_0732_0000_1 (accessed on 6 June 2020).
  35. Rached, Z.; Chebil, A.; Khaldi, R. Economic, Allovcative and Technical Efficiency of Cereals Farms in Tunisia Case of Durum Wheat in Sub-Humid Region. 2020, 71. Available online: www.jnsciences.orgE-ISSN2286 (accessed on 5 May 2022).
  36. Viaux, P. Une Troisième Voie en Grande Culture: Environnement, Qualité, Rentabilité; Editions Agridécisions: Paris, France, 1999; p. 211. [Google Scholar]
  37. Waas, T.; Hugé, J.; Block, T.; Wright, T.; Francisco Benitez-Capistros, F.B.; Aviel Verbruggen, A. Sustainability Assessment and Indicators: Tools in a Decision-Making Strategy for Sustainable Development. Sustainability 2014, 6, 5512–5534. [Google Scholar] [CrossRef] [Green Version]
  38. Lin, X.; Zeyuan, Q.; Liangzhi, Y.; Yang, K. A Macro Perspective on the Relationship between Farm Size and Agrochemicals Use in China. Sustainability 2020, 12, 9299. [Google Scholar] [CrossRef]
  39. Tedone, L.; Ali, S.A.; De Mastro, G. Optimization of Nitrogen in Durum Wheat in the Mediterranean Climate: The Agronomical Aspect and Greenhouse Gas (GHG) Emissions. In Nitrogen in Agriculture—Updates; Amanullah, A., Fahad, S., Eds.; IntechOpen: London, UK, 2019. [Google Scholar]
Figure 1. Map of Tunisia.
Sustainability 15 00779 g001
Figure 2. Scores of economic sustainability components for different-sized durum wheat farms.
Sustainability 15 00779 g002
Figure 3. Scores of social sustainability components for different-sized durum wheat farms.
Sustainability 15 00779 g003
Figure 4. Scores of environmental sustainability components of durum wheat for different-sized farms.
Sustainability 15 00779 g004
Table 1. Economic Sustainability Indicators.
IndicatorFormulaModalityScore
Economic efficiencyValue added/Products of activity<20%–>60%0–5
Economic autonomyGlobal Gross Margin/Product of Activity<55%–>75%0–5
Financial autonomy(Total non-land annuities)/Consolidated gross operating surplus>65%–<25%0–5
Capital efficiencySocial Income/Operating Capital<5%–>25%0–5
Work remunerationSocial Results/(Added Value—subsidy)<30%–>70%0–5
Commercial vulnerabilitySpecialization Rate—Gross Product of Main Production/ (Product Activity—Aids)>80%–<650–5
Diversification
opportunities
The most important customer/Proceeds from the business>70%–<60%0–5
Sensitivity to government subsidiesSubsidies/Social Results60–5
Total economic dimension value 33
Table 2. Social Sustainability Indicators.
IndicatorFormulaModalityScore
ViabilityQuality of life 0–5
Viability
Professional opening
and social
Professional and social opennessOpenness0–3
Training approachProfessional training = 1, training = 2, exchange group = 30–3
Participation in agricultural working lifeCUMA, OPA, farmers’ Union)0–3
Possibility to work in mutual aidNumber of public
visits
0–3
Participation in territorial social life%0–3
Work efficiencyDisposable income/family assets
Per annual hours of work
% of net hourly
<0.4 Agricultural Minimum Wage (AMW) hours- >2 AMW hours0–5
Viability Socio-economicSocial income/UTH5 Levels0–5
TransmissibilityCapital operating
(off land)/UTH
5 Levels0–5
Territorial anchorageTransformation 1 = yes, 0 = no0–1
Direct sale1 = yes, 0 = no0–1
Tourist or social reception1 =yes, 0 = no0–1
Open to the territory: hosting schools, agricultural groups, cultural events, etc.1 = yes, 0 = no0–1
Development and maintenance of built heritage1 = yes, 0 = no0–1
Social return Social result/ha 5 Levels5
Foodprint
Land
Total Area Mobilized/UAA>140%–100%5
Total social dimension Value 33
Available income—EBITDA—annuities—short-term financial expenses; Guaranteed agricultural minimum wage (SMAG) is 13 dinars 736 millimes per day or 4284 DT/year (1302 euros/year).
Table 3. Environmental Sustainability Indicators.
IndicatorFormulaModalityScore
Mineral Balance
or disagree
Nitrogen units
per ha of UAA
>100 uN/ha–<20 uN/ha0–5
Degree of pollution induced by the amount of herbicide (IFT)Quantity of herbicides used/ha>= 1-00–5
>= 1-0
IFT Pesticides, outside HerbicidesIFT exploitation excluding herbicides, % of the Reference>= 1-05
>= 1-0
BiodiversityPresence of intercultural bands in cereal preserving biodiversity
Presence of untreated honey crops
Mechanical destruction of natural plants
Creation and maintenance of hedges without chemical weeders
Use for hedgerows of local or rare or endangered species
No GMO cultivation or purchase of GMO food
Preservation and maintenance of wetlands
1 = yes, no = 00–1
1 = yes, no = 00–1
1 = yes, no = 00–1
1 = yes, no = 00–1
1 = yes, no = 00–1
1 = yes, no = 00–1
1 = yes, no = 00–1
Soil and water conservationSoil conservation
Water conservation
1 = yes, no = 00–1
1 = yes, no = 00–1
Soil management% Area
ground/UAA
>10%, 0.1 to 2.5%0–5
Soil management: rotation% of the same
annual culture
into the surface
>30%, 15 to 20%0–5
Energy dependenceTotal fossil fuels. (EQF)/ha UAA>600 EQF–<200 EQF0–5
Net contribution warming
up climatic
Total Equivalent (Teq) C02/ha UAA>5.5 TeqCO2/ha–1.5 to 2.5 TeqCO2/ha0–5
Value of total environmental dimension 33
Table 4. Distribution of cereal areas and farmers.
BejaBizerteJendouba Tunisia
UAA (1000 ha)2582151684884
% UAA/T. Tunisia5.3%4.4%3.4%100%
Cereal area (1000 ha)14492821610
% Cereal area/UAA56%43%49%33%
Durum wheat (1000 ha)93.164.660.6858
% Durum wheat/Total Cereal65%70%74%53%
Total farmers 21,20021,74024,960515,850
% Cereal farmers 4.1%4.2%4.8%100%
MARH, 2019.
Table 5. Farm sustainability scores by size.
Sustainability/SizeNAverageStandard
Deviation
Total Sustainability *<5 ha8460.8614.54
5–20 ha6459.3716.60
More than 20 ha5664.4116.80
Total20461.3715.89
Social Sustainability<5 ha8420.825.02
5–20 ha6421.675.87
More than 20 ha5625.706.23
Total20422.435.98
Environmental Sustainability<5 ha8424.574.72
5–20 ha6423.627.25
More than 20 ha5621.667.56
Total20423.486.51
Economic sustainability<5 ha8415.469.23
5–20 ha6414.088.91
More than 20 ha5617.057.83
Total20415.478.80
* Total sustainability is calculated as the sum of the average of the three dimensions scores.
Table 6. Multiple comparison of sustainability pillars and farm size LSD test.
Dependent Variable/Size Difference in Means (I–J)
Total Sustainability<5 ha5–20 ha1.48
More than 20 ha−3.55
5–20 haMore than 20 ha−5.04 *
Social Sustainability<5 ha5–20 ha−0.85
More than 20 ha−4.88 **
5–20 haMore than 20 ha−4.03 **
Environmental Sustainability<5 ha5–20 ha0.95
More than 20 ha2.91 **
5–20 haMore than 20 ha1.96
Economic Sustainability<5 ha5–20 ha1.39
More than 20 ha−1.59
5–20 haMore than 20 ha−2.98 *
* The difference is significant at level 0.10. ** The difference is significant at level 0.05.
Disclaimer/Publisher’s Note: The statements, opinions and data contained in all publications are solely those of the individual author(s) and contributor(s) and not of MDPI and/or the editor(s). MDPI and/or the editor(s) disclaim responsibility for any injury to people or property resulting from any ideas, methods, instructions or products referred to in the content.

