Article

Agricultural Carbon Emissions Embodied in China’s Foreign Trade and Its Driving Factors

Institute of Agricultural Economics and Development, Chinese Academy of Agricultural Sciences, Beijing 100081, China
*
Author to whom correspondence should be addressed.
Sustainability 2023, 15(1), 787; https://doi.org/10.3390/su15010787
Submission received: 11 September 2022 / Revised: 16 December 2022 / Accepted: 16 December 2022 / Published: 1 January 2023

Abstract

:
Since the development of global trade, the involvement of agriculture in globalization has been increasing. Globalization and trade have led to the separation of production and consumption, triggering a worldwide relocation of agricultural carbon emissions (ACE). By linking a global ACE database to a global multi-regional input-output (MRIO) model, this paper calculates the ACE embodied in China’s foreign trade. Moreover, by using the Logarithmic Mean Divisia Index (LMDI) decomposition method, it analyzes the impacts of embodied ACE intensity, trade scale, industrial structure, economic development and consumption levels, and population on China’s ACE. We found that the impact of globalization on China’s ACE is gradually increasing. China has shifted from a net ACE exporter (the net export volume in 1961 was 13.52 million tons) to a net ACE importer (the net import volume in 2016 was 40.35 million tons). By investigating the underlying mechanisms, we found that the dominant factor was the inhibitory effect of the decline in the embodied ACE intensity of China, contributing 73% to the increase in net import volume, followed by the expansion of trade and the decline in the proportion of agricultural output value in GDP, with contribution rates of 17 and 10%, respectively.

1. Introduction

With the worsening global climate, actions need to be taken in all sectors of the economy, including agriculture, to reduce greenhouse gas (GHG) emissions. Global agricultural GHG emissions increased from 3.26 billion tons (In this paper, all greenhouse gases concerned are converted into carbon dioxide equivalents for statistical purposes.) in 1961 to 5.96 billion tons in 2019 [1], accounting for approximately 13% of the total global GHG emissions [2], while agriculture only contributed 4% to global GDP in 2019 [3], representing an industry with high emission intensity. Thus, agriculture is an important, indispensable economic sector for the Intergovernmental Panel on Climate Change (IPCC) in order to achieve its goal of a 1.5 °C global temperature rise, whether in terms of total volume or emission intensity.
Economic globalization has divided labor and the global supply chain in an increasingly complex way [4,5]. International trade has played an essential role in commodity exchange and economic development, but it also causes unexpected environmental problems. The geographic separation of production and consumption allows a country to reduce its CO2 emissions by importing carbon-intensive products, which causes carbon displacement [6]. In the previous 60 years, the integration of agriculture into globalization has also gradually increased [7,8]. The global agricultural product trade value in 2020 reached $1549 billion [9] compared to $34.3 billion in 1961, a 45-fold increase. As the basic industry for the construction and development of the national economy, agriculture can not only guarantee the basic food demand but also provide a large number of raw materials and development momentums for other industries. Meanwhile, as the integration of agriculture into globalization increases, agricultural products will not only become involved in global trade in the form of food but also enter into global trade in the form of non-food. This means both food and non-food trade will affect ACE patterns.
Some studies have discussed the impact of domestic factors such as economic growth, population size, fertilizer inputs, and energy consumption on indigenous carbon emissions [10,11]. Furthermore, many scholars have explored the impacts of globalization and trade on GHG emissions. For example, Deng et al., calculated the embodied carbon emissions in China’s foreign trade from 2006 to 2015. They found that in China, as a net exporter of carbon emissions, the carbon emissions embodied in exports were much higher than those embodied in imports from the rest of the world [12]. Hu et al., drew similar conclusions by establishing an MRIO model of China and G7 countries: from 2000 to 2014, China’s main carbon emissions exporters were the USA (5825.67 million tons), Japan (3170.36 million tons), and Germany (1409.93 million tons) [13]. Wu et al., calculated the carbon emissions embodied in China-Japan trade from 2000 to 2009 by adopting the input-output method. The calculation showed that carbon emissions embodied in China-imported products reached a peak of 162 million tons in 2006, while the carbon emissions embodied in Japan-imported products peaked at 370 million tons in 2007 [14]. Yu et al., calculated and decomposed embodied carbon emissions in China-South Korea trade from 2000 to 2010, concluding that South Korea’s textile and leather, chemical manufacturing, and metal manufacturing industries are net importers of carbon emissions [15]. Li found in his study that, from 2006 to 2015, the export of China’s manufacturing products led to an increase in domestic carbon emissions and the proportion of carbon emissions embodied in exported products generated from production in domestic manufacturing increased from 6.12 to 11.67% [16]. Peters et al., established a trade-related global carbon dioxide emissions database that covered 113 countries and 57 economic sectors from 1990 to 2008. They found that carbon emissions from the production of traded products and services increased from 4.3 billion tons of CO2 in 1990 (20% of global emissions) to 7.8 billion tons of CO2 (26% of global emissions) in 2008. Among them, the net carbon emissions displaced from developing countries to developed countries increased from 400 million tons of CO2 in 1990 to 1.6 billion tons of CO2 in 2008 [17]. By quantifying the CH4 and N2O footprints of 181 economies and 20 regions of the world in 2012, Tian et al., found that 36.4 and 24.8% of global CH4 and N2O emissions, respectively, in 2012 were related to international trade [18]. Wang et al., found that China was a net exporter of embodied carbon emissions from 1990 to 2010. Their study indicated that China’s main net export destinations of carbon intensive products are developed areas such as North America and Europe, while China‘s main net import sources are developing areas such as Africa and Southeast Asia [19]. Huang et al., investigated the inter-sectoral linkage and external trade of embodied carbon emissions in China based on input-output tables during 1997–2015. The results also indicated that China is a net exporter of embodied carbon emissions [20].
However, compared with the analyses of the impact of trade on industry-wide carbon emissions or carbon emissions in the manufacturing industry, there have been relatively few studies about the impact of trade on global ACE. Currently, only Zhao et al., combined the 2012 global input-output table with ACE and found that the global net displacement of agricultural GHG that year was 868.9 million tons [21]. By using the 2014 WIOD table, Han et al., obtained the displacement of CH4 and N2O among 42 major economies in the world and found that the total agricultural GHG emissions displaced through trade among these countries were 622.4 million tons [22]. Shrestha et al., examined carbon emissions embodied in forest products trade through an MRIO model. They found that carbon emissions embodied in the international trade of forest products are approximately 25% of total emissions from production activities [23].
In 2019, China’s agricultural GHG emissions reached 663 million tons, an increase of 2.21 times compared to 1961, accounting for approximately 11.13% of global AGHG emissions and ranking second in the world. In the meantime, China’s integration into globalization is also strengthening. In 2016, China’s imports and exports increased by 1255 times compared with 1961, with its growth rate much higher than that of global trade (127 times) [3]. Moreover, China’s agricultural trade is witnessing sustained expansion. In 2020, the scale of China’s agricultural trade reached $212.67 billion, an increase of 230 times compared to 1961. Among them, the imports rose from $672 million in 1961 to $158.12 billion in 2020, an increase of approximately 235 times; the exports rose from $256 million in 1961 to $54.55 billion in 2020, an increase of approximately 213 times (see Figure 1). Thus, what degree of impact will economic globalization have on China’s ACE? In addition, what are the driving factors behind it? Currently, there has been no specific study from the whole industrial chain perspective.
In terms of the factors that drive embodied carbon emissions in trade, many studies have analyzed the impacts of trade on the carbon emissions of the whole industry. For example, by using the LMDI decomposition method, Tan and Chen analyzed five types of effects influencing the total embodied carbon emissions exported from China to the EU. They found that the expansion of export trade was positively correlated with the growth of embodied carbon emissions, while the upgrading of energy structure and production technology was negatively correlated with the growth of embodied carbon emissions [24]. Based on the BRICS carbon emissions panel data from 1987 to 2017, and in combination with the IPAT equation and the LMDI model, Wang et al., found that economic intensity and population are the main positive driving factors for carbon emissions, while energy intensity produces an inhibitory effect on carbon emissions [25]. By applying the input–output analysis and structural decomposition analysis methods, Pan et al., studied the driving forces of changes in embodied carbon dioxide emissions in China’s foreign trade from 2007 to 2012 and found that the decline in embodied carbon emissions was mainly due to the decrease in the emission intensity of carbon produced [26]. Cenjie et al., used an MRIO table provided by WIOD to calculate the global value chain participation and the embodied carbon emission intensity of 42 different countries for the period between 2000 and 2014. The results show that global value chain participation has a significant negative impact on the embodied carbon emission intensity [27]. Currently, there has been no specific analysis of the impacting factors for embodied ACE in trade.
The main goals of this study are to: (1) obtain the embodied ACE in trade with 188 countries in 1961, 1970, 1980, 1990, 2000, 2010, and 2016 by combining the carbon emissions data of the Food and Agriculture Organization of the United Nations (FAO) with the global input–output data of Eora; (2) analyze the impacts of embodied ACE intensity, trade scale, industrial structure, economic development and consumption levels, and population on China’s embodied ACE of the import and export products and services by the LMDI decomposition method, filling the gap in the analysis of implied agricultural carbon emission drivers.

2. Materials and Methods

2.1. Environmental Extended Multi-Regional Input-Output Model

The MRIO model reflects the trade relationship between regions, while the environmental extended MRIO model is now used as a major tool to measure the environmental impacts of international trade from the perspective of consumers [28,29,30]. The basic relationship in the environmental extended MRIO model can be expressed as follows:
x i r = s = 1 m j = 1 n a i , j r , s x j s + s = 1 m y i r , s
x 1 x 2 x m = a 1 , 1 a 1 , 2 a 1 , m a 2 , 1 a 2 , 2 a 2 , m a m , 1 a m , 1 a m , m x 1 x 2 x m + m s = 1 m y 1 , s s = 1 m y 2 , s s = 1 m y m , s
where m represents the number of countries (regions); n represents the number of industries or products by a country (region); x i r represents the total output of product i in country (region) r ; a i , j r , s is the direct consumption coefficient, representing the quantity of product i in country (region) r consumed in the production of each unit of product j in country (region) s ; x j s is the output value of industrial sector j in region s ; and y i r , s is the final consumption of product i in country (region) r by country (region) s . The links between regions can be expressed in the form of a matrix (2).
The above content is expressed as follows in the form of matrixes:
X = A X + Y
X represents the total output ( x i r ) matrix; A represents the direct consumption coefficient ( a i , j r , s ) matrix; and Y represents the final demand ( y i r , s ) matrix. Equation (3) can thus be rewritten as follows:
X = I A 1 Y
where I A 1 is a complete consumption coefficient matrix or a Leontief inverse matrix. The complete consumption coefficient refers to the complete consumption of product i in the production of unit final product j . Complete consumption means the sum of all direct consumption and various types of indirect consumption, which can be used to measure the output of local products and products from all sectors in other parts of the world due to consumption in a country. It reveals the internal connections between sectors (products) in each country (region).
Label the agricultural CO2 emissions intensity as vector C , then, diag C is the diagonal matrix of C , while diag( Y ) is the diagonal matrix of Y . The flow matrix F   for ACE is eventually expressed as follows:
F = diag C × I A 1 × diag Y
This matrix calculates carbon emissions from the perspective of consumers or the domestic and foreign ACE due to consumption in a country (region). Thus, it is also known as the consumption-based carbon emissions calculation matrix. In addition, tracking each supply chain in the matrix can realize embodied ACE in each supply chain.
The simplified carbon emissions input-output table is shown in Figure 2:
Taking region A in Figure 2 as an example, then, in terms of rows,   c A , A , c A , B , and c A , C are carbon emissions from all products (or services, the same as below) produced in region A . Where c A , A means carbon emissions from all products produced and consumed in region A , c A , B and c A , C are carbon emissions from all products produced in region A and consumed in regions B and C , respectively. In terms of columns, c A , A , c B , A , and c C , A are carbon emissions from all products consumed in region A , with c B , A and c C , A being carbon emissions from all products produced in regions B and C , respectively, and consumed in region A . In Figure 2, F represents the carbon emissions generated by each region, with   F T the transpose matrix of F . Thus, the net carbon emissions displacement matrix TF between different sectors in different countries can be obtained as follows:
T F = F F T
Using ACE produced in a region minus the ACE consumed in this region, we can obtain the net exported ACE of the region. A positive net export volume means that the ACE caused by production in this region are larger than the ACE caused by consumption, indicating that the country is a net exporter of ACE. In addition, a negative net export volume means that the ACE caused by consumption are larger than the ACE caused by production, indicating that the country is a net importer of ACE.

2.2. Logarithmic Mean Divisia Index Decomposition Method

The LMDI decomposition method is used to explore the impacting factors for ACE embodied in China’s foreign trade. The LMDI is a more complete decomposition method than the SDA decomposition method, as it has no residuals and effectively avoids the pseudo-regression problem. The method is operational and adaptable, allows for effective analysis of overall indicators, has a flexible decomposition structure, and has the advantage of allowing for the presence of zero values in the data [31,32]. In combination with the characteristics of agricultural production and the above literature review [24,33], this paper uses embodied ACE per unit of the imported (exported) product to characterize the embodied ACE intensity, the proportion of agricultural product imports (exports) in domestic agricultural output value to characterize the agricultural trade scale (PAI (PAE)), the ratio of agricultural output value to GDP (RAG) to characterize the industrial structure, GDP per capita (GPC) to characterize the levels of economic development and consumption, and population to characterize the abundance of human resources and consumption demand. The LMDI decomposition method is used to analyze the contribution of the above factors to embodied agricultural carbon emissions in China’s imports (exports). The specific decomposition formulas are expressed as follows:
C i m = C i m M i m × M i m G D P a × G D P a G D P × G D P P × P = α i m · β i m · γ · G D P ¯ · P
C e x = C e x M e x × M e x G D P a × G D P a G D P × G D P P × P = α e x · β e x · γ · G D P ¯ · P
where C i m and C e x represent the ACE embodied in imported (exported) products and services, respectively; M i m and M e x represent the imports (exports) of China’s agricultural trade, respectively; G D P a represents China’s total agricultural output value; G D P represents the gross domestic product (GDP); and P represents the total population of China.
α i m and α e x represent embodied ACE per unit of the imported (exported) product, measured in kilograms per dollar; β i m and β e x represent China’s PAI and PAE, measured in percent; γ represents the RAG, measured in percent; G D P ¯ represents GPC, measured in dollars; and P represents the total population, measured in units of 10 million.
Changes in embodied ACE in imported (exported) products during the base period and the reporting period are expressed as follows:
C i m = C i m t C i m 0 = C α i m + C β i m + C γ i m + C G D P ¯ i m + C P i m
C e x = C e x t C e x 0 = C α e x + C β e x + C γ e x + C G D P ¯ e x + C P e x
According to the LMDI decomposition method,
C α = i , j C i , j t C i , j 0 ln C i , j t C i , j 0 · l n α t α 0
C β = i , j C i , j t C i , j 0 ln C i , j t C i , j 0 · l n β t β 0
C γ = i , j C i , j t C i , j 0 ln C i , j t C i , j 0 · l n γ t γ 0
C G D P ¯ = i , j C i , j t C i , j 0 ln C i , j t C i , j 0 · l n G D P ¯ t G D P ¯ 0
C P = i , j C i , j t C i , j 0 ln C i , j t C i , j 0 · l n P t P 0
C α i m , C α e x , C β i m , C β e x , C γ i m , C γ e x , C G D P ¯ i m , C G D P ¯ e x , C P i m , and C P e x represent the contributions to changes in embodied ACE in each unit of China’s imported (exported) product, the PAI (PAE), the RAG, GPC, and the total population to changes in the import (export) volume of embodied ACE in China’s foreign trade.

2.3. Data Sources

The data used in this research are divided into the following four categories:
  • Global MRIO table. The Eora global input–output database is used in this paper [34,35]. The Eora global supply chain database consists of an MRIO model that provides a time series of high-resolution input-output tables with matching environmental and social satellite accounts. Compared with models such as WIOD and GTAP, the Eora database enjoys the advantages of covering more years (including global input-output data from 1990 to 2017) and including more regional objects (covering 188 countries (regions), a more detailed division of industry), etc., Given the stable global trade on the whole before 1990, and taking into account data availability, the input-output tables for the years 1961, 1970, and 1980 are calculated using the 1990 data.
  • Carbon emissions data. The ACE data used in this research are all sourced from the FAO database [1]. Specifically, the calculated ACE include enteric fermentation, manure management, rice cultivation, synthetic fertilizers, manure applied to soil, manure left on pasture, crop residues, burning-crop residues, drained organic soils, and savanna fires.
  • Global agricultural trade value. The agricultural trade value data contained in this research are from the FAO database.
  • The GDP of China’s primary industry, GDP, and population are all sourced from the World Bank database [3].

3. Results

3.1. Embodied ACE in China’s Foreign Trade

From 1961 to 2016, China’s domestic ACE showed an upward trend, from 299.78 million tons to 700.93 million tons, with an average annual growth rate of 2.43% (Table 1). During this period, the import and export volume of ACE in trade also continued to increase. Embodied ACE in China’s imported products increased from 4.67 million tons in 1961 to 71.33 million tons in 2016, with the proportion of carbon emissions from domestic agricultural production increasing from 1.56 to 10.18%. Domestic ACE caused by exports increased from 18.19 million tons in 1961 to 30.98 million tons in 2016 and the proportion of domestic carbon emissions decreased from 6.07 to 4.42%. Over the 55-year period, China’s embodied ACE from imports (an increase of 15 times) grew much faster than that from exports (an increase of only 70%), resulting in China changing from a net exporter of embodied ACE (13.52 Mt of net exported ACE in 1961) to a net importer (40.35 Mt of net imported ACE in 2016). However, due to the high self-sufficiency of agricultural products in China, the vast majority (93.93 to 95.58%) of China’s ACE came from domestic demand, with the net imported ACE accounting for a small proportion of domestic ACE (approximately 5.76% in 2016).
In 2016, China’s embodied ACE were mainly exported to developed countries, such as the USA, South Korea, Japan, and Germany, as well as countries with relatively close geographical relations such as Indonesia. These ACE mainly related to the food processing, manufacturing, construction, and public service industries in these countries (Table 2a). Among them, ACE exported to the USA, South Korea, Indonesia, Malaysia, and Russia (the former Soviet Union) increased significantly compared with 1961, from 1,707,900, 1,141,500, 210,200, 233,500, and 400 tons to 3,744,500, 2,738,100, 1,044,700, 876,100, and 846,900 tons, respectively. China’s embodied ACE was mainly imported from Australia, Myanmar, the USA, Ethiopia, and Thailand, mostly due to China’s demand in the food processing, manufacturing, and construction industries (see Table 2b).

3.2. Analysis of Impacting Factors for Embodied ACE in China’s Foreign Trade

The contributions of embodied ACE in China’s unit imported (exported) product, the PAI (PAE), the RAG, GPC, and the total population to changes in ACE import (export) volume are calculated according to Equations (7) and (8).
Overall, from 1961 to 2016, the decline in embodied ACE per unit of imported product and the reduction in the RAG played a part in reducing the import volume of embodied ACE, reducing China’s embodied ACE import volume by 92.40 and 48.38 million tons in aggregation. The increase in both the PAI and GPC and population growth played a role in promoting the import of embodied ACE. Among them, the increase in GPC produced the largest impact, resulting in a cumulative increase of 156.35 million tons in China’s embodied ACE import volume, followed by the increase in the PAI (contributing to an increase of 40.14 million tons), with the population growth producing the smallest impact (contributing to an increase of 10.94 million tons). Similar to imports, the decline in embodied ACE per unit of exported product and the reduction in the RAG led to a cumulative decrease of 149.94 and 56.59 million tons in China’s embodied ACE export volume, respectively. Increases in the PAE, GPC, and total population promoted the increase in China’s embodied ACE export volume. The increase in GPC produced the greatest impact, contributing to an increase of 169.90 million tons, followed by the increase in the PAE (contributing to an increase of 27.28 million tons) and population growth (contributing to an increase of 22.14 million tons).

3.2.1. Embodied ACE Intensity

From 1961 to 2016, the decline in embodied ACE per unit of exported product in China (by a factor of 112) was far greater than that of the imported product (by a factor of 10). In 1961, the embodied ACE per unit of exported product was 71.06 kg/$, approximately 10 times the embodied ACE per unit of imported product. In 2016, the embodied ACE per unit of exported product decreased by a factor of 112, to 0.63 kg/$. By contrast, the embodied ACE per unit of imported product decreased by a factor of 10, to 0.68 kg/$, indicating that the level of green development in China’s agriculture sector is rising rapidly. Studies have shown that in recent years China has actively implemented measures to improve the quality of arable land, increase crop yield per unit, promote the reduction of agricultural chemical inputs and the comprehensive use of crop straw, and other measures to curb the deterioration of agricultural resources and the environment. The level of green agricultural development has been effectively improved [36,37,38]. The rapid decline in embodied ACE per unit of exported product is a vital factor in China’s transition from a net exporter to a net importer in terms of ACE. From 1961 to 2016, the reduction in embodied ACE per unit of exports in China led to a reduction of 149.94 million tons of exported ACE, while that per unit of imports led to a reduction of 92.40 million tons of imported ACE. This is equivalent to a net increase of 57.54 million tons in imported carbon emissions in China over 55 years.
In terms of the marginal contribution, due to the increase in agricultural product trade value, the contribution of the decline in embodied ACE per unit of the imported (exported) product to the decline in the imported ACE has increased significantly. For example, as ACE per unit of imported and exported products decreased by 1 kg/$, embodied ACE per unit of imported and exported products decreased by 0.61 and 0.49 million tons from 1961 to 1970, and by 85.42 and 40.04 million tons, respectively, from 2010 to 2016 (Table 3).
It was found that China’s embodied ACE per unit of imported product differs very little from those of developed countries, but there is much room for reducing the embodied ACE per unit of exported product. In 2016, the embodied ACE intensity in China’s export of agricultural products was approximately 0.63 kg/$, while that of South Korea and Japan was only 0.08 and 0.14 kg/$, respectively (Figure 3). It is worth mentioning that embodied ACE per unit of imported product in developed countries were generally higher than those of exported product (for example, South Korea, where the former was 13 times the latter), which is also an important reason why developed countries are generally net importers of carbon emissions (Figure 4).

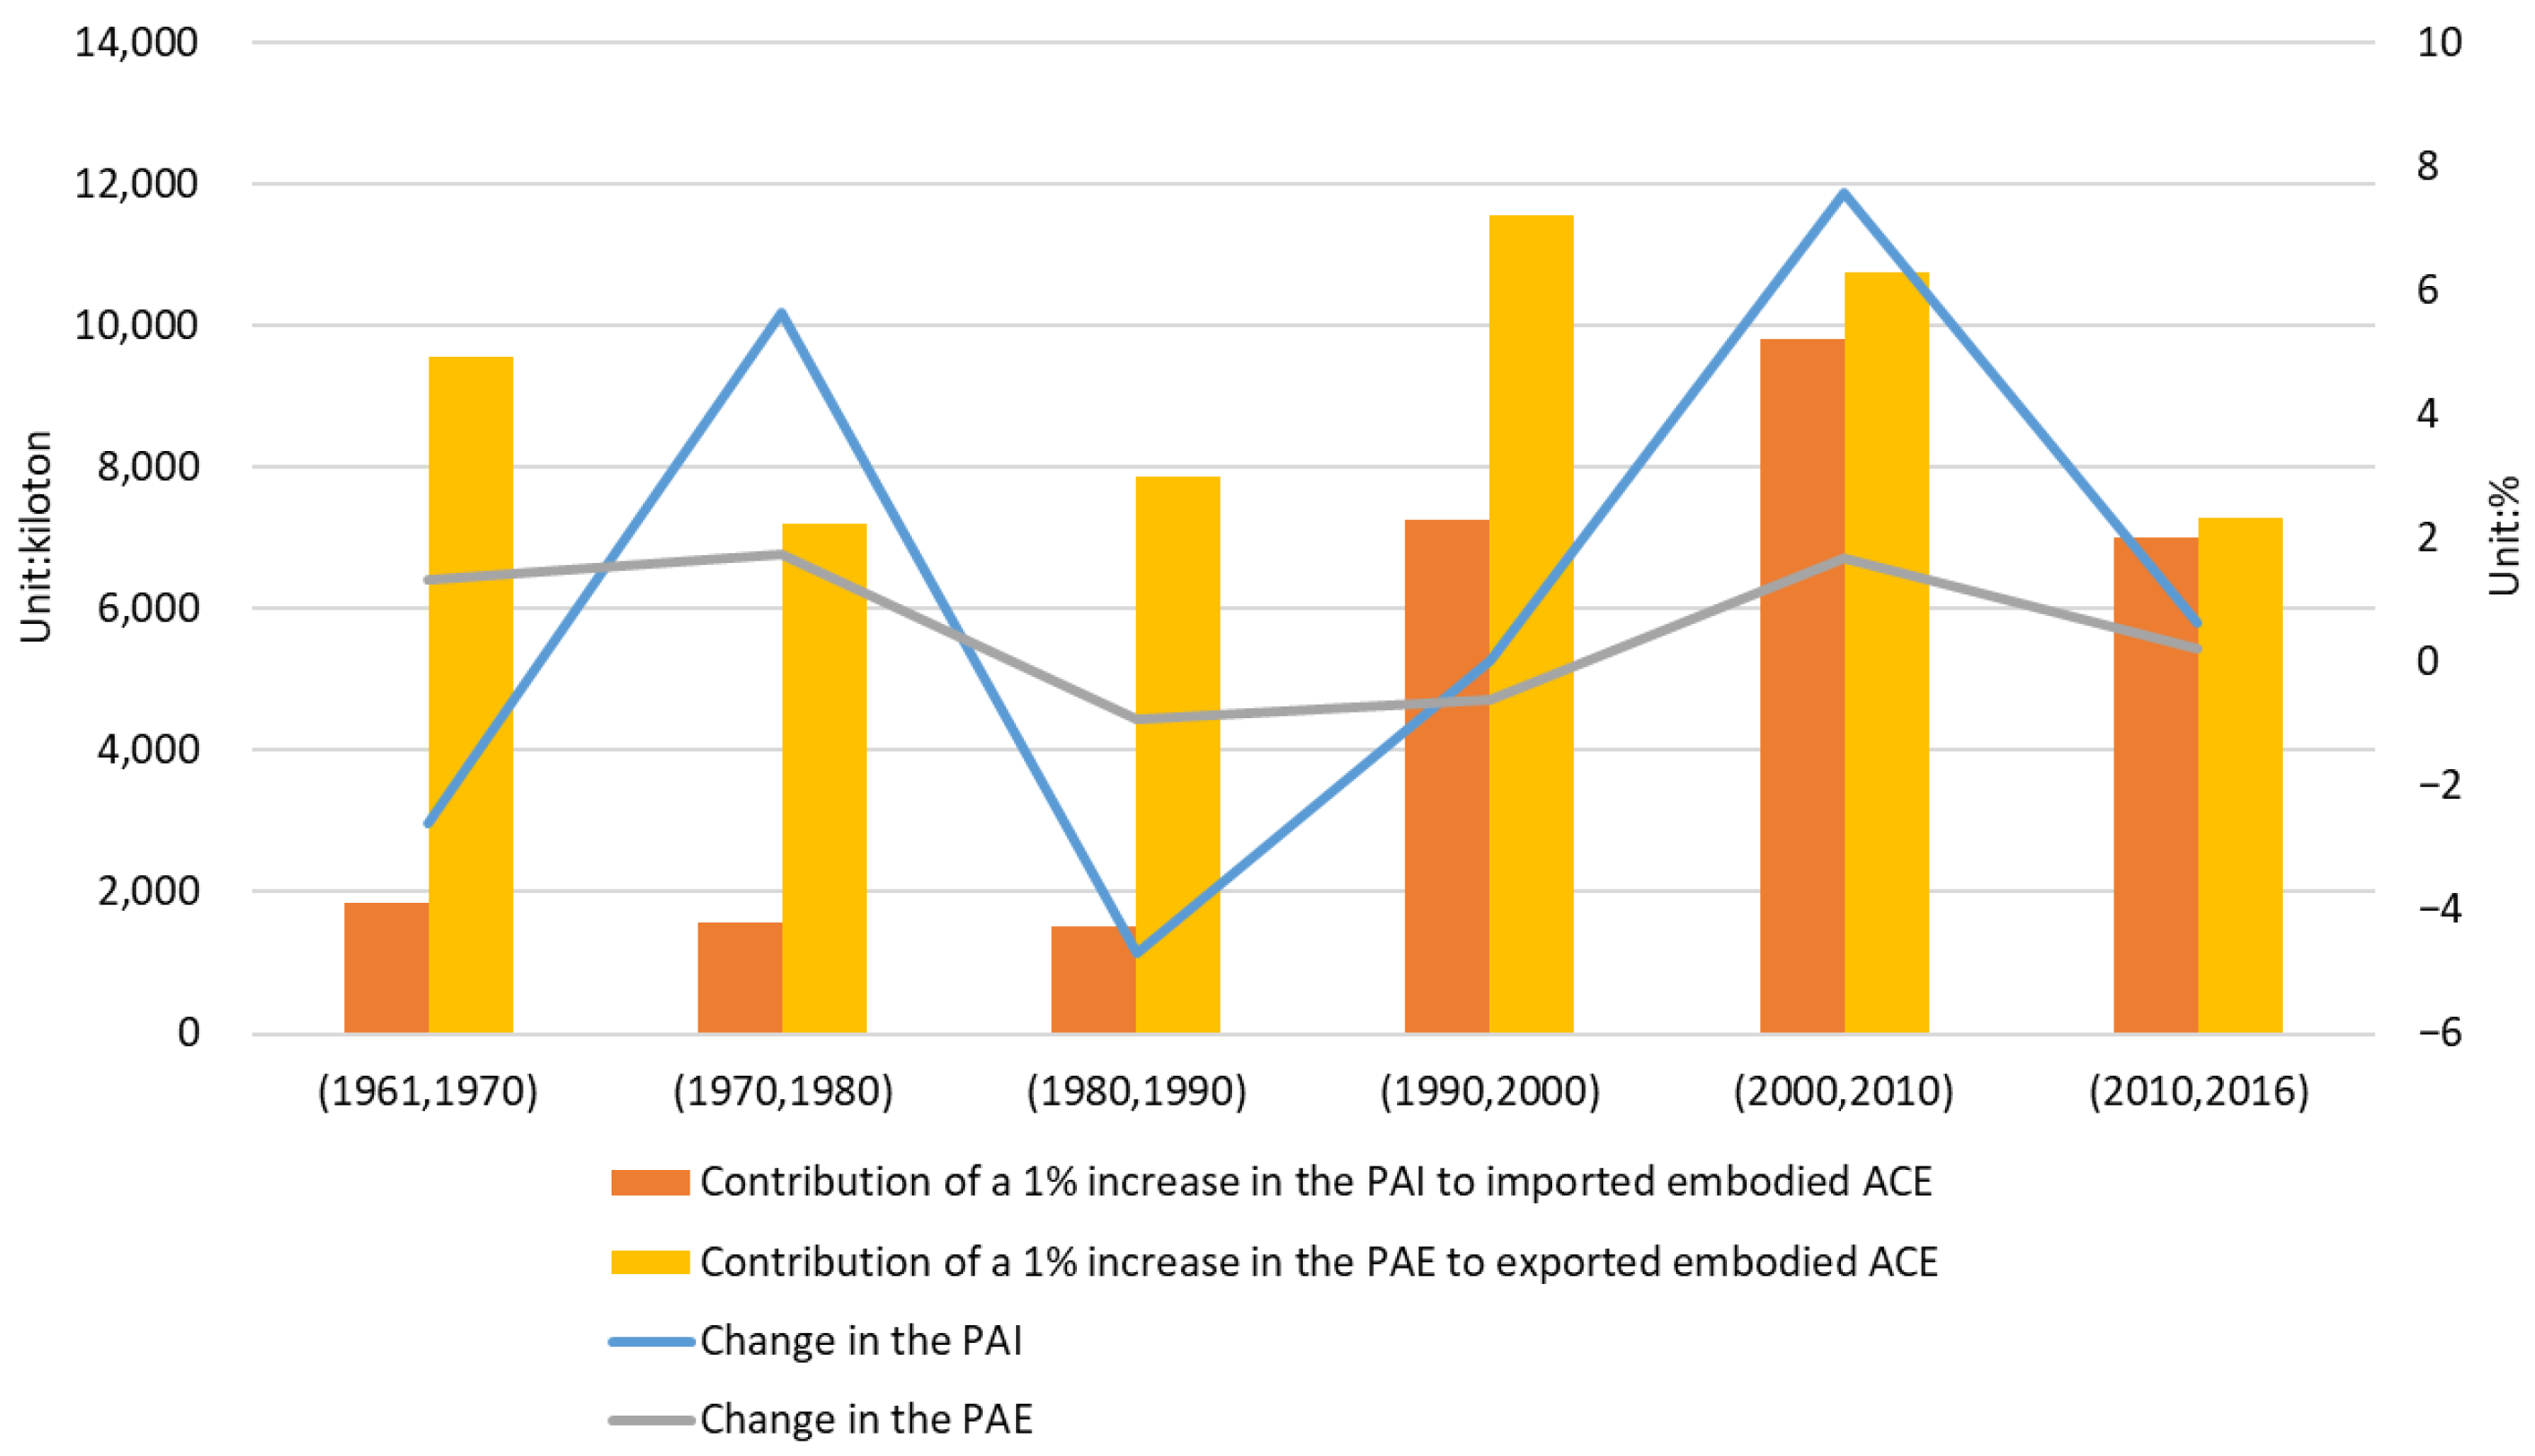
3.2.2. Agricultural Product Trade Scale

From 1961 to 2016, imports and exports of agricultural products in China increased by 213 and 235 times, respectively. In 1961, China’s agricultural imports and exports were $672 million and $256 million, respectively, while in 2016, China’s agricultural imports and exports had increased to $158.12 billion and $54.55 billion, respectively. China has also developed from an agricultural trade net exporter to an agricultural trade net importer. With the expansion of the agricultural trade scale, embodied ACE in trade increased accordingly. The analysis results also showed that a higher PAI in total domestic agricultural output value means a larger import volume of embodied ACE. During the same period, the PAI in China increased from 3.75 to 11.55% and the cumulative increase in the import volume of embodied ACE in foreign trade was 40.14 million tons (Table 4). This means that for every 1% increase in the PAI, the import volume of embodied ACE in China’s foreign trade increased by 5.15 million tons. Likewise, a higher PAE means a larger export volume of embodied ACE. During this period, the PAE in China increased from 1.43 to 5.41% and the cumulative increase in the export volume of embodied ACE in foreign trade was 27.28 million tons (Figure 5). This means that for every 1% increase in the PAE, the export volume of embodied ACE in China’s foreign trade increased by 6.85 million tons. However, on the whole, the expansion of agricultural trade, and particularly the scale of agricultural imports, resulted in a net increase of 12.86 million tons of ACE.

3.2.3. Industrial Structure

Industrial structure upgrading is one of the most effective ways to facilitate the economy’s green transformation [39]. This paper uses the RAG as an indicator of China’s industrial structure. It is generally accepted that a country with a lower RAG has a relatively superior economic development and a higher level of industrial structure. From 1961 to 2016, China’s RAG decreased from 35.79% to 8.06% (Figure 6); the reduction in the RAG also inhibits both the import and export of embodied ACE, but its inhibitory effect on the export of embodied ACE was larger than that on the import. It was also found in Dong et al.’s study that the proportion of China’s agricultural value added has been negatively correlated with carbon emissions since 2000 [40]. In terms of total volume, the decrease of RAG caused a decrease in the import volume and export volume of embodied ACE of 48.38 and 56.59 million tons, respectively (Table 5). Thus, during the previous 55 years, the overall decline in the RAG has promoted an increase in the net import volume of embodied ACE. In terms of intensity, for every 1% decrease in the RAG, the export volume and import volume of embodied ACE in China’s foreign trade decreased by 2.04 and 1.74 million tons, respectively. This indicates that for every 1% decrease in the RAG, the net import volume will increase by 0.30 million tons.
It was found that some countries with a small RAG value, such as Japan, the USA, Germany, the UK, and Israel, are almost all net importers of embodied ACE, with their agricultural output value in 2016 having a share of 1.12, 0.94, 0.70, 0.57, and 1.24%, respectively. By contrast, China’s agricultural output value had a share of 8.06% in 2016, with a large gap from that of developed countries.

3.2.4. Economic Development and Consumption Levels

The increase in GPC reflects the economic development level and per capita consumption level of a country. The improvement in economic development level promotes the production and export of products and the improvement in consumption level increases the consumer demand for products and facilitates import. Our research also demonstrates that the increase in GPC promotes both the import and export of embodied ACE. However, in general, the increase in GPC in the previous 55 years has produced a bigger role in promoting the export of embodied ACE. See Table 6, China’s GPC increased from $75.61 in 1961 to $8068.03 in 2016, contributing 156.35 million tons to the increase in embodied ACE import volume. This means for each $1 increase in GPC, the import volume of embodied ACE in China’s foreign trade increased by 19,600 tons. In the meantime, the increase in China’s GPC increased the export volume of embodied ACE in foreign trade by approximately 169.90 million tons. This means that for every $1 increase in GPC, the export volume of embodied ACE in China’s foreign trade increased by approximately 21,300 tons. Overall, the increase in GPC has increased the net export volume of China’s embodied ACE by 13.55 million tons during the past 55 years.
Additionally, it was found that the marginal contribution of the increase in GPC to the increase in the import and export volume of embodied ACE is increasing, and with a faster decrease in the marginal contribution to the increase in the export volume. Before 2000, the marginal impact of GPC on China’s embodied ACE export was larger than that of the import when the GPC did not exceed $955 (Figure 7). For instance, from 1961 to 1970, an increase of $1 in GPC resulted in the import of 55 kilotons of embodied ACE and its contribution to the increase in the export volume was as high as 228 kilotons. Let us consider one more example. From 2010 to 2016, an increase of $1 in GPC added to the import volume by 12 kilotons but to the export volume of embodied ACE by only 5 kilotons. In the meantime, we found that countries with high GPC, such as Japan, the USA, Germany, the UK, and Israel, are net importers of embodied ACE. We suspect that GPC and the net export volume of embodied ACE have an inverted U-shaped relationship. This means that in the early stage of low GPC, the increase in GPC has a bigger role in promoting production and exports than in promoting consumption to increase the net export volume of ACE. However, when GPC is higher than a certain critical value, consumer demand will be upgraded and the promoting effect of GPC on the increase in consumer demand will be greater. At this stage, the increase in GPC will promote the net import of embodied ACE.

3.2.5. The Abundance of Human Resources and Consumption Demand

The population represents the abundance of human resources and the scale of consumer demand in a country. The abundance of human resources will stimulate the development of agricultural production and then export, while the increase in population will also stimulate the continuous growth of consumer demand and then promote import. Our research also confirms that population growth boosts both import and export of embodied ACE, though with a larger role in boosting export than in boosting import. From 1961 to 2016, the Chinese population increased from 662.07 million to 1392.32 million. The increase in population has contributed to an increase in imported and exported embodied ACE in China’s foreign trade by 10.94 and 22.14 million tons, respectively (Table 7). Overall, over the past 55 years, population growth has contributed to an increase in China’s net exported embodied ACE by 11.20 million tons.
Also, we found that the marginal impact of population growth on the import volume of embodied ACE is increasing rapidly (Figure 8). For example, from 1961 to 1970, the imported embodied ACE due to an increase of 10 million in the population increased by 68.54 kilotons. From 2010 to 2016, the increase in imported embodied ACE caused by an increase of 10 million in the population reached 537 kilotons. However, the increase in the population produced a small marginal impact on embodied ACE and the increase in the imported embodied ACE due to a population increase of 10 million was approximately in the range of 263 to 330 kilotons. Before 2000, the increase in population produced a larger marginal impact on the export of embodied ACE than on the import of the same; however, after 2000, the increase in population produced a larger marginal impact on the import of embodied ACE than on the export of the same. This indicates the abundance of human resources played a dominant role in promoting agricultural production and export during this period, and after 2000, the marginal impact of population growth on the import of embodied ACE was greater than that on the export. This indicates that during this period, the increase in consumer demand resulting from the increase in population played a dominant role in promoting export.
Some studies have shown that before 1980, population growth was the dominant factor affecting China’s resources and environment, while after 1980, the improvement in consumption level became a dominant factor [41]. Similar conclusions were drawn in this research. GPC had a greater impact on the displacement of embodied ACE in China’s foreign trade than the population.

4. Conclusions and Implications

Based on the input–output data of Eora and the carbon emissions data of the Food and Agriculture Organization of the United Nations (FAO), the embodied agricultural carbon emissions (ACE) data of 188 countries (regions) in 1961, 1970, 1980, 1990, 2000, 2010, and 2016 are calculated through the multi-regional input-output (MRIO) model in this paper. The Logarithmic Mean Divisia Index (LMDI) decomposition method is used to decompose the driving factors of the import (export) volume of embodied ACE in China’s foreign trade. It is found that the embodied ACE intensity, trade scale, industrial structure, economic development and consumption levels, and population have an impact on the import and export of embodied ACE.
Considering the trade-triggered imports of ACE, from 1961 to 2016, the decline in ACE embodied in per unit of imported product and the reduction in the ratio of agricultural output value to GDP (RAG) led to a cumulative decrease in China’s embodied ACE, by 92.40 and 48.38 million tons, respectively, with the contribution rates being 65.63 and 34.37%, respectively. The increase in GDP per capita (GPC), the agricultural trade scale (PAI) characterized by the proportion of agricultural product imports (exports) in domestic agricultural output value, and the population led to a cumulative increase of imported embodied ACE in China, by 156.35, 40.14, and 10.94 million tons, respectively, with the contribution rates being 75.38, 19.35, and 5.27%, respectively. For ACE export, the decline in embodied ACE per unit of exported product and the reduction in the RAG resulted in a cumulative reduction in China’s exported embodied ACE by 149.94 and 56.59 million tons, respectively, with the contribution rates being 72.6 and 27.4%, respectively. The increase in GPC, the agricultural trade scale (PAE) characterized by the proportion of agricultural product imports (exports) in domestic agricultural output value, and population led to a cumulative increase in the embodied ACE export volume of China, by 169.9, 27.28, and 22.14 million tons, respectively, with the contribution rates being 77.47, 12.44, and 10.09%.
In general, the decline of the embodied ACE intensity in China, the increase in trade scale, and the reduction in the proportion of agricultural added value have promoted the net import of embodied ACE, while the increase in GPC and population have promoted the net export of embodied ACE. We found that the main driver of China’s ACE shifting from net exports to net imports is the significant decline in embodied ACE per unit of exported products resulting from the increased level of green development in Chinese agriculture. From 1961 to 2016, China’s embodied ACE per unit of agricultural exports fell from 71.06 kg to 0.63 kg, a 111-fold decrease, while embodied ACE per unit of product imports fell from 6.95 kg to 0.68 kg, a mere 9-fold decrease. This resulted in a faster decline in ACE exports than imports, with China’s ACE exports decreasing by 149.94 million tons from 1961 to 2016 due to the decline of the embodied ACE intensity in China, while imports decreased by only 92.40 million tons due to the decline of the embodied ACE intensity in importing countries, resulting in an increase in China’s ACE net imports of 57.54 million tons, contributing 73.20% to the net import increase. While the increase in the scale of agricultural trade led to an increase of only 12.86 million tons in the net import volume of China’s embodied ACE, the decrease in the proportion of agricultural added value resulted in a decrease of 8.21 million tons in the net import volume of China’s embodied ACE.
Moreover, we found that the increase in GPC and the increase in population promotes both the import and export of ACE. However, during the past 55 years, the two have played larger roles in promoting the export of ACE rather than the import. As a result, the net export volume of ACE increased by 13.54 and 11.19 million tons, respectively. Nevertheless, we found that after 2000, as GPC increased to more than $1000, the improvement of people’s living standards played a role in promoting a consumer demand increase rather than in promoting production and export. Therefore, the increase in GPC promotes the net import of ACE.
Our research shows that reducing the embodied ACE intensity and enhancing green development in agriculture can effectively reduce trade’s environmental impact. At the production stage, we should continue to improve and innovate low-carbon development technologies for agricultural products, improve the quality of arable land, increase the unit yield of crops, promote the reduction of agricultural chemical inputs, advance the comprehensive use of crop straw, apply biological carbon sequestration technologies, facilitate the combination of planting and breeding, and encourage the development of organic agriculture [42]. In trade and consumption, green procurement, improving the green certification system for agricultural products [43], building a carbon labeling system, and regulating carbon emission standards for traded agricultural products are all effective means for reducing trade’s environmental impact. China has made a considerable effort to develop green trade, such as the “14th Five-Year Plan for the High-Quality Development of Foreign Trade” issued by the Ministry of Commerce of China in November 2021, which proposes to “build a green trade system” and emphasizes “Vigorously develop trade in high quality, high technology, and high value-added green and low-carbon products. Strictly manage the export of high energy-consuming and high emission products”.
Our findings also show that China’s embodied ACE are closely linked to processed foods, manufacturing, architecture, and public services. Therefore, reducing embodied ACE cannot be achieved by the agricultural production sector or agricultural trade alone, but requires the concerted efforts of the whole industry, all producers, and consumers.

Author Contributions

Data analysis, R.S.; writing—original draft preparation; R.S.; writing—manuscript completion, J.L., K.N.; writing—review and editing, J.L. and K.N. All authors have read and agreed to the published version of the manuscript.

Funding

This work was funded by the Fundamental Research Funds for Central Public Welfare Research Institutes (Y2022ZK03), the National Natural Science Foundation of China (72104239), and the Chinese Academy of Agricultural Sciences Science and Technology Innovation Project (ASTIP-IAED-2022-04).

Institutional Review Board Statement

Not applicable.

Informed Consent Statement

Not applicable.

Data Availability Statement

Not applicable.

Conflicts of Interest

The authors declare no conflict of interest.

Abbreviations

ACEagricultural carbon emissions
FAOthe Food and Agriculture Organization of the United Nations
MRIOmulti-regional input–output model
LMDIthe Logarithmic Mean Divisia Index (LMDI) decomposition method
GHGgreenhouse gas
PAIthe proportion of agricultural product imports (exports) in domestic agricultural output value to characterize agricultural trade scale
PAEthe proportion of agricultural product exports (imports) in domestic agricultural output value to characterize agricultural trade scale
RAGthe ratio of agricultural output value to GDP
GPCGDP per capita
WIODWorld Input-Output Database
GTAPGlobal Trade Analysis Project

References

  1. FAO. FAOSTAT Climate Change, Emissions, Emissions Totals. 2021. Available online: http://www.fao.org/faostat/en/#data/GT (accessed on 10 September 2022).
  2. Hatab, A.A.; Bustamante, M.; Clark, H.; Havlík, P.; House, J.; Mbow, C.; Ninan, K.N.; Popp, A.; Roe, S.; Sohngen, B.; et al. WG III contribution to the Sixth Assessment Report: Chapter 7: Agriculture, Forestry and Other Land Uses (AFOLU). Available online: https://www.ipcc.ch/report/ar6/wg3/downloads/report/IPCC_AR6_WGIII_Chapter_07.pdf (accessed on 10 September 2022).
  3. World Bank. World Development Indicators 2017; World Bank: Washington, DC, USA, 2017. [Google Scholar]
  4. Jin, J.; Dai, X.; Zhang, E.Z. The Path for China’s Industry Upgrading under Global Factors Division. China Ind. Econ. 2013, 11, 57–69. [Google Scholar]
  5. Xu, K.N.; Chen, J. International production networks and the new international division of labor. Int. Econ. Rev. 2007, 6, 38–41. [Google Scholar]
  6. Peters, G.P.; Hertwich, E.G. CO2 Embodied in international trade with implications for global climate policy. Environ. Sci. Technol. 2008, 42, 1401–1407. [Google Scholar] [CrossRef] [Green Version]
  7. Zhou, H.B.; Shen, Z.Z. Agricultural Factors in the Process of Globalization before the 20th Century: From Geographical Discovery to Industrial Revolution. Agric. Hist. China 2018, 37, 60–74. [Google Scholar]
  8. Liu, Y.S.; Wu, C.J.; Lu, Q. Orientation and Tactics for 21st Century Sustainable Agriculture and Rural Development in China. Sci. Geogr. Sin. 2002, 22, 385–389. [Google Scholar]
  9. FAO. FAOSTAT Trade, Crops and Livestock Products. 2021. Available online: https://www.fao.org/faostat/en/#data/TCL (accessed on 10 September 2022).
  10. Khan, Z.A.; Koondhar, M.A.; Tiantong, M.; Khan, A.; Nurgazina, Z.; Tianjun, L.; Fengwang, M. Do chemical fertilizers, area under greenhouses, and renewable energies drive agricultural economic growth owing the targets of carbon neutrality in China? Energy Econ. 2022, 115, 106397. [Google Scholar] [CrossRef]
  11. Nurgazina, Z.; Guo, Q.B.; Ali, U.; Kartal, M.T.; Ullah, A.; Khan, Z.A. Retesting the Influences on CO2 Emissions in China: Evidence From Dynamic ARDL Approach. Front. Environ. Sci. 2022, 10, 868740. [Google Scholar] [CrossRef]
  12. Deng, G.; Lu, F.; Yue, X. Research on China’s embodied carbon import and export trade from the perspective of value-added trade. PLoS ONE 2021, 16, e258902. [Google Scholar] [CrossRef]
  13. Hu, Y.; Wu, W. Spatiotemporal Variation and Driving Factors of Embodied Carbon in China-G7 Trade. Sustainability 2022, 14, 7478. [Google Scholar] [CrossRef]
  14. Wu, R.; Geng, Y.; Dong, H.; Fujita, T.; Tian, X. Changes of CO2 emissions embodied in China–Japan trade: Drivers and implications. J. Clean. Prod. 2016, 112, 4151–4158. [Google Scholar] [CrossRef]
  15. Yu, Y.; Chen, F. Research on carbon emissions embodied in trade between China and South Korea. Atmos. Pollut. Res. 2017, 8, 56–63. [Google Scholar] [CrossRef]
  16. Li, J.F. Implied Carbon Measurement of China’s Manufacturing Industry Based on MRIO Model. Stat. Decis. 2017, 19, 157–160. [Google Scholar]
  17. Peters, G.P.; Minx, J.C.; Weber, C.L.; Edenhofer, O. Growth in emission transfers via international trade from 1990 to 2008. Proc. Natl. Acad. Sci. USA 2011, 108, 8903–8908. [Google Scholar] [CrossRef] [Green Version]
  18. Tian, W.; Wu, X.; Zhao, X.; Ma, R.; Zhang, B. Quantifying global CH4 and N2O footprints. J. Environ. Manag. 2019, 251, 109566. [Google Scholar] [CrossRef]
  19. Wang, Q.; Ge, S. Carbon footprint and water footprint in China: Similarities and differences. Sci. Total Environ. 2020, 739, 140070. [Google Scholar] [CrossRef]
  20. Huang, H.; Li, X.; Cao, L.; Jia, D.; Zhang, J.; Wang, C.; Han, Y. Inter-Sectoral Linkage and External Trade Analysis for Virtual Water and Embodied Carbon Emissions in China. Water 2018, 10, 1164. [Google Scholar] [CrossRef] [Green Version]
  21. Zhao, X.; Wu, X.; Guan, C.; Ma, R.; Nielsen, C.P.; Zhang, B. Linking Agricultural GHG Emissions to Global Trade Network. Earth’s Future 2020, 8, e01361. [Google Scholar] [CrossRef] [Green Version]
  22. Han, M.; Zhang, B.; Zhang, Y.; Guan, C. Agricultural CH4 and N2O emissions of major economies: Consumption-vs. production-based perspectives. J. Clean. Prod. 2019, 210, 276–286. [Google Scholar] [CrossRef]
  23. Shrestha, P.; Sun, C. Carbon Emission Flow and Transfer through International Trade of Forest Products. Forest Sci. 2019, 65, 439–451. [Google Scholar] [CrossRef]
  24. Tan, J.; Chen, M. Measurement and analysis of implied carbon in China-EU trade based on a multi-regional input-output model. Economist 2015, 2, 72–81. [Google Scholar]
  25. Wang, J.; Li, Z.G.; Gu, J. Decoupling analysis between energy consumption and economic growth in BRICS countries: Based on Tapio decoupling and LMDI model analysis. World Reg. Stud. 2021, 30, 501–508. [Google Scholar]
  26. Pan, W.; Pan, W.; Shi, Y.; Liu, S.; He, B.; Hu, C.; Tu, H.; Xiong, J.; Yu, D. China’s inter-regional carbon emissions: An input-output analysis under considering national economic strategy. J. Clean. Prod. 2018, 197, 794–803. [Google Scholar] [CrossRef]
  27. Liu, C.; Zhao, G. Can global value chain participation affect embodied carbon emission intensity? J. Clean. Prod. 2021, 287, 125069. [Google Scholar] [CrossRef]
  28. Yan, Y.F.; Zhao, Z.X.; Wang, R. China’s Emission Responsibility and Trade-embodied Emissions: A MRIO Approach. World Econ. Stud. 2013, 6, 54–58. [Google Scholar]
  29. Peng, S.J.; Zhang, W.C.; Sun, C.W. China’s Production-based and Consumption-based Carbon Emissions and Their Determinants. Econ. Res. J. 2015, 50, 168–182. [Google Scholar]
  30. Peng, S.J.; Zhang, W.C.; Wei, R. National Carbon Emission Responsibility. Econ. Res. J. 2016, 51, 137–150. [Google Scholar]
  31. Su, B.; Ang, B.W. Structural decomposition analysis applied to energy and emissions: Some methodological developments. Energ. Econ. 2012, 34, 177–188. [Google Scholar] [CrossRef]
  32. Liu, X.; Wang, Y. Analysis of the drivers of carbon emissions in China’s manufacturing sector based on LMDI decomposition. Stat. Decis. 2022, 38, 60–63. [Google Scholar] [CrossRef]
  33. Wang, Y.; Wei, B.Y.; Fang, X.Q.; He, X.B.; Yang, H.M. Using LMDI Method in Decomposition Analysis of Carbon Emissions Embodied in China’s International Trade. China Popul. Resour. Environ. 2011, 21, 141–146. [Google Scholar]
  34. Lenzen, M.; Moran, D.; Kanemoto, K.; Moran, D. Building Eora: A Global Multi-Region Input-Output Database at High Country and Sector Resolution. Econ. Syst. Res. 2013, 25, 20–49. [Google Scholar] [CrossRef]
  35. Lenzen, M.; Kanemoto, K.; Moran, D.; Geschke, A. Mapping the Structure of the World Economy. Environ. Sci. Technol. 2012, 46, 8374–8381. [Google Scholar] [CrossRef] [PubMed]
  36. Liu, Y.; Sun, D.; Wang, H.; Wang, X.; Yu, G.; Zhao, X. An evaluation of China’s agricultural green production: 1978–2017. J. Clean. Prod. 2020, 243, 118483. [Google Scholar] [CrossRef]
  37. Liu, Y.; Feng, C. What drives the fluctuations of “green” productivity in China’s agricultural sector? A weighted Russell directional distance approach. Resour. Conserv. Recycl. 2019, 147, 201–213. [Google Scholar] [CrossRef]
  38. Wang, L.; Li, L.; Cheng, K.; Pan, G. Comprehensive evaluation of environmental footprints of regional crop production: A case study of Chizhou City, China. Ecol. Econ. 2019, 164, 106360. [Google Scholar] [CrossRef]
  39. Du, K.; Cheng, Y.; Yao, X. Environmental regulation, green technology innovation, and industrial structure upgrading: The road to the green transformation of Chinese cities. Energy Econ. 2021, 98, 105247. [Google Scholar] [CrossRef]
  40. Dong, B.; Ma, X.; Zhang, Z.; Zhang, H.; Chen, R.; Song, Y.; Shen, M.; Xiang, R. Carbon emissions, the industrial structure and economic growth: Evidence from heterogeneous industries in China. Environ. Pollut. 2020, 262, 114322. [Google Scholar] [CrossRef]
  41. Wu, W.H.; Niu, S.W. A Comparative Study on the Impact of Population Growth and Consumption Increase on China’s. Chin. J. Popul. Sci. 2009, 2, 66–73. [Google Scholar]
  42. Knapp, S.; van der Heijden, M.G.A. A global meta-analysis of yield stability in organic and conservation agriculture. Nat. Commun. 2018, 9, 3632. [Google Scholar] [CrossRef] [Green Version]
  43. Li, X.; Xia, X.; Ren, J. Can the Participation in Quality Certification of Agricultural Products Drive the Green Production Transition? Int. J. Environ. Res. Public Health 2022, 19, 10910. [Google Scholar] [CrossRef]
Figure 1. Basic situation of agricultural product trade in China.
Sustainability 15 00787 g001
Figure 2. Schematic diagram of the structure of the MRIO model for carbon emissions.
Sustainability 15 00787 g002
Figure 3. Contribution of the embodied ACE intensity to the import and export of embodied ACE.
Sustainability 15 00787 g003
Figure 4. Imported (exported) embodied ACE intensity of some countries: (a) in 1961; (b) in 2016.
Sustainability 15 00787 g004
Figure 5. Contribution of agricultural product trade scale to the import and export of embodied ACE.
Sustainability 15 00787 g005
Figure 6. Contribution of industrial structure to the import and export of embodied ACE.
Sustainability 15 00787 g006
Figure 7. Contribution of increase in GPC to the import and export of embodied ACE.
Sustainability 15 00787 g007
Figure 8. Contribution of the population to the import and export of embodied ACE.
Sustainability 15 00787 g008
Table 1. Embodied ACE in China’s foreign trade.
YearChina’s ACEEmbodied Imported ACE Embodied Exported ACEEmbodied Net Imported ACE
1961299.784.6718.19−13.52
1970400.905.5424.33−18.79
1980490.136.2729.75−23.47
1990602.917.5436.59−29.05
2000688.1237.7243.13−5.41
2010698.2575.4541.5033.95
2016700.9371.3330.9840.35
Note: The data in the table are measured in million tons.
Table 2. (a) Major recipient nations of China’s exported ACE in 2016. (b) Major source nations of China’s imported ACE in 2016.
CountryMain Related Industries
(a)
USAManufacturing (30.7%), government services (18.7%), processed foods (12.1%), architecture (11.9%), medical services (6.1%)
South KoreaAgricultural products (33.7%), processed foods (24.4%),
manufacturing (20%), catering services (9.1%)
JapanCatering services (28.9%), processed foods (20.4%), agricultural products and production (14%), medical services (10.1%)
GermanyManufacturing (26.3%), agricultural products (22.3%), public
services (17.1%), transport (8.1%), transit trade (8.1%)
IndonesiaProcessed foods (45.2%), manufacturing (21.2%), architecture (11%), transport (6.2%)
(b)
AustraliaManufacturing (41.4%), processed foods (15.1%), architecture (10.6%), public services (9%)
MyanmarArchitecture (35.7%), processed foods (16.4%), agriculture (15.1%), manufacturing (14.4%)
USAProcessed foods (23.8%), architecture (19.9%), manufacturing (17.4%), agriculture (14.5%), residents’ recreation consumption (9.4%)
EthiopiaArchitecture (44.3%), manufacturing (20.8%), public services (11.5%), industry (8.2%)
ThailandArchitecture (39.8%), manufacturing (18.8%), public services (10.7%), processed foods (9.5%), agriculture (7.8%)
Table 3. Contribution of the embodied ACE intensity to the import and export of embodied ACE.
YearChange in
Embodied ACE per Unit of
Imported Product (kg/$)
Contribution of the Change of Embodied ACE in Imported
Products to
Imported
Embodied ACE (Kiloton)
Contribution of 1 kg Increase in Embodied ACE per Unit of
Imported Product to Imported
Embodied ACE (Kiloton)
Change in
Embodied ACE per Unit of
Exported Product (kg/$)
Contribution of the Change of Embodied ACE in Exported
Products to
Exported
Embodied ACE (Kiloton)
Contribution of 1 kg Increase in Embodied ACE per Unit of
Exported Product to Exported
Embodied ACE (Kiloton)
1961–19702.821733.04614.82−47.08−22,935.46487.15
1970–1980−8.67−12,869.441484.55−15.85−29,131.761838.49
1980–19900.271488.855599.41−3.60−19,281.485362.32
1990–20002.4419,181.767870.32−0.95−9292.199824.94
2000–2010−2.74−69,360.9325,306.96−2.36−45,330.3419,186.54
2010–2016−0.38−32,576.1085,419.52−0.60−23,968.2540,042.99
1961–2016−6.27−92,402.8114,739.24−70.43−149,939.492128.94
Table 4. Contribution of trade scale to the import and export of embodied ACE.
YearChange in the PAI (%)Contribution of the PAI to Imported Embodied ACE (Kiloton) Contribution of a 1% Increase in the PAI to Imported Embodied ACE (Kiloton)Change in the PAE (%)Contribution of the PAE to Exported Embodied ACE
(Kiloton)
Contribution of a 1% Increase in the PAE to Exported Embodied ACE (Kiloton)
1961–1970−1.99−3856.941938.161.7216,680.849698.16
1970–19808.2910,279.131239.943.3119,346.325844.81
1980–1990−4.31−3850.38893.361.958714.244468.84
1990–2000−0.17−558.453285.00−1.65−8701.045273.36
2000–20106.9243,904.796344.62−0.81−5422.346694.25
2010–2016−0.95−5778.266082.38−0.53−3337.596297.34
1961–20167.7940,139.895152.753.9927,280.426837.20
Table 5. Contribution of industrial structure to the import and export of embodied ACE.
YearChange in the RAG (%)Contribution of the Decline in the RAG to
Imported
Embodied ACE (Kiloton)
Contribution of 1% Decline in the RAG to
Imported
Embodied ACE (Kiloton/%)
Contribution of the Decline in the RAG to
Exported
Embodied ACE (Kiloton)
Contribution of 1% Decline in the RAG to
Exported
Embodied ACE (Kiloton)
Contribution of the Decline in the RAG to Net Imported
Embodied ACE (Kiloton)
Contribution of a 1% Decrease in the RAG to Net Imported Embodied ACE (Kiloton)
1961–1970−1.00−143.74−143.74−596.06−596.06452.32452.32
1970–1980−5.16−947.17−183.56−4329.14−838.983381.97655.42
1980–1990−3.05−747.65−245.13−3589.15−1176.772841.50931.64
1990–2000−11.91−11,135.32−934.96−23,627.61−1983.8512,492.291048.89
2000–2010−5.35−24,682.14−4613.48−19,187.76−3586.50−5494.38−1026.99
2010–2016−1.27−10,722.24−8442.71−5258.53−4140.57−5463.71−4302.13
1961–2016−27.74−48,378.26−1743.99−56,588.25−2039.958209.99296.0
Table 6. Contribution of increase in GPC to the import and export of embodied ACE.
YearChange in GPC ($)Contribution of the Change in GPC to
Imported
Embodied ACE (Kiloton)
Contribution of $1 Increase in GPC to
Imported
Embodied ACE (Kiloton)
Contribution of the Change in GPC to
Exported
Embodied ACE (Kiloton)
Contribution of $1 Increase in GPC to
Exported
Embodied ACE (Kiloton)
Contribution of the Change in GPC to Net Imported
Embodied ACE (Kiloton)
Contribution of $1 Increase in GPC to Net Imported
Embodied ACE (Kiloton)
1961–197035.971981.5755.098217.35228.45−6235.78−173.36
1970–198082.083250.6039.6014,857.10181.01−11,606.50−141.40
1980–1990121.963362.7327.5716,143.04132.36−12,780.31−104.79
1990–2000640.1320,766.9632.4444,064.6168.84−23,297.65−36.40
2000–20103583.8384,798.2923.6665,921.7318.3918,876.565.27
2010–20163528.4542,192.7811.9620,692.705.8621,500.086.09
1961–20167992.42156,352.9319.56169,896.5321.26−13,543.60−1.69
Table 7. Contribution of the population to the import and export of embodied ACE.
YearPopulation Growth
(10 Million
Persons)
Contribution of Population Growth to
Imported
Embodied ACE (Kiloton)
Marginal Contribution of Every 10
Million
Increase in Population to Imported
Embodied ACE (Kiloton)
Contribution of the Population Growth to
Exported
Embodied ACE (Kiloton)
Marginal
Contribution of Every 10
Million
Increase in Population to Exported Embodied ACE (Kiloton)
Contribution of Population to Net Imported Embodied ACE (Kiloton)Contribution of Every 10
Million Increase in
Population to Net Imported Embodied ACE (Kiloton)
1961–197016.791150.4368.524770.71284.14−3620.22−215.62
1970–198015.711022.2865.074672.43297.42−3650.15−232.35
1980–199015.631011.8864.744857.60310.79−3845.72−246.05
1990–200012.411931.44155.644098.25330.24−2166.81−174.60
2000–20107.353067.21417.312384.43324.41682.7892.90
2010–20165.142760.36537.041353.77263.381406.59273.66
1961–201673.0310,943.66149.8522,137.19303.12−11,193.53−153.27
Disclaimer/Publisher’s Note: The statements, opinions and data contained in all publications are solely those of the individual author(s) and contributor(s) and not of MDPI and/or the editor(s). MDPI and/or the editor(s) disclaim responsibility for any injury to people or property resulting from any ideas, methods, instructions or products referred to in the content.

