Article

Smart Building Management System (SBMS) for Commercial Buildings—Key Attributes and Usage Intentions from Building Professionals’ Perspective

1
Department of Electrical and Electronic Engineering, The University of Hong Kong, Hong Kong, China
2
Faculty of Business, Macao Polytechnic University, Macao, China
3
Keele Business School, Keele University, Staffordshire ST5 5AA, UK
*
Author to whom correspondence should be addressed.
Sustainability 2023, 15(1), 80; https://doi.org/10.3390/su15010080
Submission received: 22 November 2022 / Revised: 16 December 2022 / Accepted: 18 December 2022 / Published: 21 December 2022

Abstract

:
Smart buildings conserve energy and create a responsive, comfortable, and productive indoor environment for users and occupants. As a crucial component of smart buildings, smart building management system (SBMS) should provide a wide range of functions and bring about the intended benefits upon successful deployment. This paper identifies salient SBMS attributes and explores key factors influencing building professionals’ intention to use the system in commercial buildings. Responses were collected from 327 Hong Kong building professionals. Data were analyzed by exploratory factor analysis and structural equation modeling based on the refined Unified Theory of Acceptance and Use of Technology (UTAUT). Exploratory factor analysis shows that intelligent building operations and safety and recovery readiness are two dimensions of SBMS emerged. Specifically, intelligent building operations include intelligent and optimal scheduling of building systems, monitor and control of building facilities, having an intelligent and interactive interface, and enabling alarm settings and automatic notifications, showing the importance on the application of electrical engineering in smart building management. Structural equation model (SEM) results indicate that facilitating conditions affect habit, hedonic motivation, social influence, performance expectancy and effort expectancy. Additionally, habit, hedonic motivation and effort expectancy significantly affect building professionals’ intention to use SBMS. Practical implications of SBMS attributes for energy management and the ways in which SBMS is encouraged to be used by building professionals are given.

1. Introduction

Commercial buildings consume a large portion of energy in many countries and cities. According to the most recent energy review report published by the U.S. Energy Information Administration [1], the U.S. commercial sector consumed over 5114 Terawatt-hour (TWh) of energy in 2021, increasing 65 percent from 1980 and related to building mostly. Commercial buildings consumed around 18 percent of all energy use in the U.S. in 2021 by estimation [1]. In China, the total floor area of commercial buildings and public facilities reached 14 billion m2 in 2020 approximately [2]. China’s commercial buildings and public facilities consumed 2817 TWh of energy in 2016, which increased 150 percent from 2007 [2]. In highly urbanized city like Hong Kong, commercial activities are crucial to its longtime economic prosperity. Hong Kong’s commercial sector consumed 31.8 TWh of energy in 2020, taking up 42 percent of the total energy consumption in Hong Kong [3]. Again, most energy consumption in this sector comes from commercial buildings and public facilities [3]. In fact, the commercial sector consumes over 60 percent of Hong Kong’s total electricity, in which heating, ventilation, and air conditioning systems in commercial buildings are the largest consumers [3]. To et al. [4,5] assessed the fuel life cycle of electricity consumption in Hong Kong, and reported that a kilowatt-hour electricity consumption would produce 0.702 to 0.792 kg of CO2-equivalent with an average of 0.759 kg, depending on the energy mix in power generation of the particular year [5]. As the commercial sector consumed 28.4 TWh of electricity in 2020 [3], the city produced 21.6 million tons of CO2-equivalent indirectly. In addition, many commercial buildings in Hong Kong such as hotels and shopping malls are equipped with gas-fired and oil-fired commercial boilers, hot water heaters, and commercial clothes dryers that produce greenhouse gases and other air pollutants such as particulate matter and sulfur dioxide directly [6,7]. Ramesh et al. [8] reviewed studies on building life-cycle energy usage, and reported that energy use in building operations contributes to 80 to 90 percent of a building’s life-cycle energy.
“Making a building intelligent” or smart building has attracted continued interests in sustainability research over the past two decades [9,10,11,12,13]. Smart building is a common and essential component of smart cities [14,15,16]. Yet, the definition of smart building varies, depending on technological progress and stakeholder perspectives. Buckman et al. [10] reviewed the historical development of smart buildings, and concluded that smart building is a building that integrates intelligent building systems, building materials, building design and construction into a holistic building system to meet and exceed stakeholder expectations such as energy efficiency, longevity, user satisfaction, as well as comfort. Central to a smart building is a smart building management system (SBMS) that can integrate and coordinate a wide range of building systems to predict and accommodate stakeholder needs, as implied in Buckman et al.’s study [10]. To ensure the smartness and sustainability in smart buildings, this study explores salient attributes of SBMS and the intentions of building professionals to use SBMS in commercial buildings. More specifically, the study addresses the following research questions: Firstly, what are the essential attributes and dimensions of SBMS? Additionally, secondly, what are the organizational and individual factors that contribute to the intentions of building professionals to use SBMS? The study’s findings should contribute to the characterization of SBMS from building operation’s (including electrical engineering’s) perspective. Additionally, the identification of key factors and mechanism for driving building professionals to adopt SBMS should shed light on how to promote building professionals including electrical engineers to use SBMS in commercial buildings. The study also tests the applicability of a refined model of the Unified Theory of Acceptance and Use of Technology in the smart building context.

2. Literature Review and Hypothesis Development

2.1. Smart Building Management System (SBMS) Attributes

The Chartered Institution of Building Services Engineers [17] defined a building management system (BMS) as a computer-based platform that links building systems together. Its primary function is to control, monitor, optimize, and report conditions of different building systems at a single point. Building systems normally include (i) heating, ventilation, and air-conditioning systems, (ii) pumping systems, (iii) fire and safety systems, (iv) power and energy systems, (v) lighting systems, (vi) elevators and lifts, (vii) telecommunications systems, (viii) public address and alarm systems, and (ix) security and surveillance systems. Upon effective BMS installation and operation, stakeholders may enjoy various benefits [17]. For example, owner(s) of the building can enjoy higher rental value; occupants and users may reduce energy consumption, control lightning better, experience greater comfort, and increase productivity. Facility managers and engineers may exercise remote monitoring and control, receive alarm notifications, conduct fault diagnosis, and computerize maintenance scheduling and documentation [17].
Kumara et al. [18] investigated whether and how BMS can contribute to a sustainable built environment. They conducted a comprehensive literature review and identified some core attributes of BMS. These attributes include starting/stopping building systems optimally, enabling the monitoring and control of building facilities, supporting optimal equipment time scheduling, enabling alarm settings and automatic notification, and ensuring building safety. Kumara et al. [18] invited a small group of building professionals (25 of them) to take part in a questionnaire survey. They reported that participants ranked real time monitoring as the most important attribute of BMS, followed by trend analysis, and alarm reporting. Minoli et al. [19] reviewed the development of the Internet of Things (IoT) and how to intergrate IoT into smart buildings. Specifically, Minoli et al. [19] suggested that a SBMS enables building operators and users to control energy management and comfort level optimally. In addition, an IoT-ready SBMS can manage other functions such as surveillance, access, and fire detection. The system should also be accessible and operational remotely [19]. Chew et al. [13] evaluated the 5G implementation in Singapore. They suggested that 5G would facilitate smart energy, maintenance, indoor comfort, space utilization, and security management in buildings. Therefore, the Singaporean government actively supports industries and higher education institutions to conduct research on and provide training of integrating 5G into smart building and facility management [13]. Gunatilaka et al. [20] proposed a scoring system to assess smartness level of commercial buildings in Sri Lanka. Based on opinions from 35 building experts, Gunatilaka et al. [20] identified that automation is considered as the most important criterion, followed by communication and data sharing. Furthermore, Eini et al. [16] indicated that SBMS is a real-time management system controlling different aspects of smart buildings such as security, safety, indoor conditions, and user comfort. They also presented design requirements, performance specifications, and operating constraints for each smart building subsystem and suggested that machine learning with model-based control approaches can optimize the functionality and performance of smart buildings. All in all, SBMS as a smartness-enabling technology should contribute to sustainability [10,11,12,13,14,15,16,18,19,20].

2.2. A Refined Model of the Unified Theory of Acceptance and Use of Technology

2.2.1. The Acceptance and Use of Technology

Technology acceptance has been investigated extensively in the information systems and management literature [21,22,23,24,25]. By adapting the Theory of Reasoned Action [26] to the information systems context, Davis et al. [21] proposed the theoretical framework—Technology Acceptance Model (TAM) to predict people’s acceptance of computer technologies. TAM posits that two types of personal beliefs, namely perceived ease of use and perceived usefulness, affect their intention to use the technology. Perceived ease of use measures the extent to which people believe that the use of technology is free from difficulty; perceived usefulness measures the extent to which people believe the use of technology enhances their job performance. Davis et al. [21] suggested that perceived ease of use affects perceived usefulness while these two beliefs together affect people’s attitude towards using the technology. Additionally, perceived usefulness and attitude towards using the technology affect their intention to use the technology. However, their empirical results showed that the mediating role of people’s attitude became much less significant, when people gained more information and experience in the technology. In 1990s, many studies applied TAM, Theory of Reasoned Action, Theory of Planned Behavior, Social Cognitive Theory, Innovation Diffusion Theory, or their syntheses to explore people’s acceptance of information and communications technologies [27,28,29,30]. In 2003, Venkatesh et al. [31] reviewed the theoretical bases and empirical results of different technology acceptance and use models, and proposed a synthesized approach—the Unified Theory of Acceptance and Use of Technology (UTAUT), in which facilitating condition, social influence, effort expectancy (analogous to perceived ease of use), and performance expectancy (analogous to perceived usefulness) affect people’s intention to use the technology, leading to their use behavior. In Venkatesh et al.’s study [31], facilitating conditions measure the extent to which people believe organizations would provide resources to support the adoption of technology. Social influence measures the extent to which people perceive that important others believe they should use the technology. Venkatesh et al. [31] argued that effort expectancy fully mediates the effect of facilitating conditions on people’s intention; insignificant direct effect of facilitating condition on people’s intention supported their hypotheses empirically [31,32]. Subsequently, Venkatesh et al. [33] explored the use of UTAUT in the consumer context. They proposed UTAUT2 that incorporates three additional constructs namely hedonic motivation, habit, and price value influencing people’s intention to use the technology. They define hedonic motivation as the degree of fun or pleasure derived from adopting the technology. Habit measures the extent to which people believe the technology use behavior to be automatic. Price value characterizes people’s cognitive tradeoffs between perceived benefits and the costs for using the technology.
Owusu Kwateng et al. [34] investigated health professionals’ adoption and use of health information systems from a UTAUT2 perspective. They found that hedonic motivation, habit, and performance expectancy predicted health professionals’ intention to use health information systems. Specifically, hedonic motivation is one of the significant factors that influencing people’s intention to use new technologies, in particular among those tech-savvy young professionals [35]. Schukat and Heise [36] applied the extended UTAUT to investigate what motivates farmers to adopt smart products in Germany. They found that hedonic motivation was the most significant predictor of farmers’ intention to use smart products while price value did not have a significant effect on farmers’ usage intention. In the context of workplace technology use, price value can be excluded because organizations bear the cost of buying or subscribing to the technology. Thus, the study predicts building professionals’ intention to use SBMS with UTAUT2 and hypothesizes that:
Hypothesis 1 (H1). 
Effort expectancy positively affects user intention.
Hypothesis 2 (H2). 
Performance expectancy positively affects user intention.
Hypothesis 3 (H3). 
Social influence positively affects user intention.
Hypothesis 4 (H4). 
Facilitating condition positively affects user intention.
Hypothesis 5 (H5). 
Hedonic motivation positively affects user intention.
Hypothesis 6 (H6). 
Habit positively affects user intention.

2.2.2. Effort Expectancy and Performance Expectancy

Davis et al. [21] studied the relationship between perceived effort required to use a technology, i.e., effort expectancy and perceived usefulness in terms of expected performance gains. They found that perceived ease of use has a persistent influence on perceived usefulness (or performance expectancy) across time in their empirical study. In addition, the relationship between perceived ease of use (i.e., effort expectancy) and perceived usefulness (i.e., performance expectancy) was well-established in numerous studies [37,38,39]. Following the reasoning of Chen and Chang [38], the study hypothesizes that:
Hypothesis 7 (H7). 
Effort expectancy positively affects performance expectancy.

2.2.3. Role of Facilitating Condition

Effort expectancy plays a crucial role in influencing people’s acceptance of a technology directly and/or indirectly [21,32]. When people find the technology too difficult to master, lower usage of the technology is expected [40]. Venkatesh [32] identified the following determinants of effort expectancy: (i) playfulness, (ii) anxiety, (iii) computer self-efficacy (internal control) and (iv) facilitating condition (external control). Venkatesh [32] also found that facilitating condition (external control) affects effort expectancy significantly, which influences computer self-efficacy (internal control) in turn. Reyes-Menedez et al.’s [41] recent investigation on search engine usage for sustainable water management in Spain further reported that facilitating conditions significantly influence effort expectancy and habit. In the context of workplace technology use, facilitating condition would have direct effect on employees’ general beliefs and perceptions. Therefore, the study hypothesizes that:
Hypothesis 8 (H8). 
Facilitating condition positively affects effort expectancy.
Hypothesis 9 (H9). 
Facilitating condition positively affects performance expectancy.
Hypothesis 10 (H10). 
Facilitating condition positively affects social influence.
Hypothesis 11 (H11). 
Facilitating condition positively affects hedonic motivation.
Hypothesis 12 (H12). 
Facilitating condition positively affects habit.
Figure 1 illustrates the theoretical model of the study, and indicates how facilitating condition may affect building professionals’ intention directly and indirectly, through other employees’ beliefs and perceptions.

3. Methods

The study was a cross-sectional questionnaire survey. It aimed at soliciting responses from building professionals about the importance of SMBS features and perceptions of organizational and personal factors that might influence their intention to use SMBS in commercial buildings. Factor analyses and structural equation modeling were conducted. In what follows, sample and data collection, the instrument used, and data analysis procedure are presented.

3.1. Sample and Data Collection

In Hong Kong, building professionals involve in the design, procurement, installation, operation, upgrade, and maintenance of building systems. They work for building owners and developers, constructers, engineering consultancies, building contractors, building system suppliers, system integrators, and facilities managers. Therefore, the study targeted them as respondents. To reach as many building professionals as possible, 77 postgraduate engineering students in a part-time master’s program were invited to participate in a questionnaire survey. Each student was asked to forward 10 copies of questionnaire to his/her professional colleagues and friends in the building-related industries. This chain referral sampling or snowball sampling approach is particularly useful for exploratory studies [42]. In recent years, chain referral sampling has been utilized extensively to study sustainability and environmental issues [43,44,45].
Adhering to Helsinki’s ethical principles, respondents were informed the purpose of the survey and assured their anonymity and confidentiality of the collected data. Moreover, respondents could withdraw from the voluntary survey, at any time point. In total 847 copies of questionnaire were distributed. Over a two-and-a-half-month period, 362 responses were returned, among which 21 sets contained missing data and 14 respondents were neither designers nor users of BMS in commercial buildings. The effective sample size reduced to 327, yielding a final response rate of 38.6 percent. The response rate was similar to the ones reported in other studies in Hong Kong [11,43]. Additionally, the questionnaire had 35 Likert-scale items and Hair et al. [46] suggested that response per item should be 5 or more. Thus, the study’s sample size deemed to be appropriate because its response per item was 9.34 (=327/35).

3.2. Instrument

A 35-item self-administered questionnaire was developed. It includes three sections. Items of the questionnaire were adapted from the extant literature [16,17,18,19,33] to ensure content validity. The first section comprises 12 items. The items cover important attributes of smart BMS for commercial buildings such as a SBMS should “provide intelligent and optimal start/stop of building systems” and “monitor and control building facilities.” They were adapted from CIBSE Guide H—Building Control Systems [17], and the BMS literature [16,18,19]. The 12 items are shown in Appendix A. The second section includes 23 items covering 7 constructs of the refined UTAUT2 namely effort expectancy, performance expectancy, social influence, facilitating condition, hedonic motivation, habit, and user intention (see Figure 1). These 23 items were adapted from the Venkatesh et al.’s study [33], as shown in Appendix B. Respondents were asked to rate all 35 items on a 5-point Likert scale with 1 = strongly disagree and 5 = strongly agree. The third section comprised 7 questions collecting respondents’ demographic information including gender, age group, education, occupation, position, and working experience, as well as their role in designing/using BMS. The draft questionnaire was pilot tested with three engineering faculty members and seven postgraduate students that were not included in the main survey. They commented that the questionnaire was clear and easy to follow. They could complete the questionnaire within 15 min.

3.3. Data Analysis Procedure

The collected data were analyzed with IBM SPSS 26.0. Respondent characteristics were characterized by descriptive statistics. The importance of SBMS attributes was revealed by the means, standard deviations, and whether the mean scores were statistically significantly higher than the midpoint of 3.0 on the 5-point Likert scale. The core dimensions of SBMS attributes were identified by exploratory factor analysis (EFA). EFA is useful to reveal underlying dimensions of the topic of interest [46], i.e., SBMS in the present study. To identify the direct and indirect effects of facilitating condition on building professional’s intention to use SBMS, confirmatory factor analysis (CFA) and structural equation modeling (SEM) using IBM SPSS Amos 26.0 with maximum likelihood estimation were used. CFA ascertained the factor structure of the refined UTAUT2 and the validity of the selected constructs shown in Figure 1. SEM tested the effects of facilitating condition and other constructs on building professionals’ intention to use SBMS.

4. Results

Among the 327 respondents, 267 were males and 60 were females. Most respondents (230) belonged to the age group 20–29 and 58 respondents aged 30 to 39. A total of 152 respondents obtained a bachelor’s degree while 106 respondents attained master’s level or above. Most respondents (210) worked as designers and consultants and 48 respondents worked for constructers and contractors. A total of 157 respondents worked as junior or assistant engineers and 95 respondents worked as engineers or equivalent. Numbers of respondents experienced less than 1 year, 1 to 2 years, and 2 to 4 years, respectively are about the same. A total of 249 respondents considered themselves as users of BMS. A total of 31 respondents indicated themselves as designers of BMS only and 47 respondents identified themselves as both designers and users. Table 1 shows the demographic information of the respondents.

4.1. Dimensions of SBMS

Appendix A shows the descriptive statistics of the 12 SBMS attribute items for commercial buildings. Respondents considered the ability to “monitor and control building facilities” to be the most important attribute (mean = 4.24; SD = 0.765). The second most important attribute is to “enable alarm settings and automatic notifications” (mean = 4.17; SD = 0.807) while the third most important attribute is to “provide intelligent and optimal start/stop of building systems” (mean = 4.14; SD = 0.777). On the other hand, respondents considered the ability to “adopt open communication protocols” to be the least important attribute (mean = 3.83; SD = 0.896).
One-sample t-tests were conducted to examine whether the mean scores of SBMS attributes were significantly higher than the mid-point, i.e., 3.0 on the 5-point Likert scale. Results of t-tests revealed that all mean scores were significantly higher than 3.0 (p < 0.001). Independent-sample t-tests were performed to investigate whether gender had an effect on responses. Among the 12 SBMS attributes, female respondents agreed with the items more than male respondents in general but significant differences between the mean scores of female and male respondents in only four items (p < 0.05) were found as shown in Appendix A.
EFA was performed with IBM SPSS 26.0. Results showed a Kaiser–Meyer–Olkin (KMO) score of 0.901 and passed Bartlett’s test of sphericity with strong significance (χ2 = 1303.7, df = 66, p < 0.001), confirming the suitability of the collected data for factor analysis. The number of factors was determined using the eigenvalue-greater-than-one method. Additionally, one item with communalities less than 0.4 and two items with cross-loadings (difference ≤ 0.20) were removed iteratively. These three items were “adopt open communication protocols”, “enable trending and data analytics”, and “enable building occupants to make adjustments.” Nine items remained and the two factors emerged, accounting for 56.6% of the total variance. The first factor was named as “intelligent building operations” and the second factor was “safety & recovery readiness.” Table 2 presents factor loadings of items, eigenvalues, percentage of variance explained, and the Cronbach’s alpha values. The Cronbach’s alpha values of intelligent building operations (0.83) and safety and recovery readiness (0.65) indicated the reliability of the two dimensions to be good and acceptable, respectively [44].

4.2. Structural Equation Modeling

To identify whether and how effort expectancy, performance expectancy, social influence, facilitating condition, hedonic motivation, and habit affect building professionals’ intention to use SBMS in commercial buildings are related, CFA and SEM were conducted. The measurement and structural models were assessed using the following two absolute and two incremental fit indices: the normed chi-square (χ2/df), the root mean square error of approximation (RMSEA), the Tucker–Lewis index (TLI), and the comparative fit index (CFI). The criterion values of χ2/df ≤ 3.0, RMSEA ≤ 0.08, TLI ≥ 0.90, and CFI ≥ 0.90 were adopted [46]. As gender might have an effect on building professionals’ intention to use the technology, a series of independent sample t-tests was performed on the 23 Likert-scale items (see Appendix B) adapted from UTAUT2. The independent sample t-tests showed no significant difference between responses from male and female respondents in 22 items, except the third item of facilitating condition in which female respondents (mean = 3.85; SD = 0.755) had a significant higher level of agreement than male respondents (mean = 3.58; SD = 0.907). The third item of facilitating condition reads “smart BMS is compatible with other technologies we currently use in the organization”.

4.3. Confirmatory Factor Analysis

The seven-factor measurement model comprising effort expectancy, performance expectancy, social influence, facilitating condition, hedonic motivation, habit, and intention to use SBMS produced the following fit indices: χ2/df = 1.66 (χ2 = 347.7; df = 209; p < 0.001), RMSEA = 0.05, TLI = 0.96, and CFI = 0.97, meeting all criteria for acceptable fit. The seven-factor measurement model was then compared with alterative models as shown in Table 3. The difference in the chi-square value between the seven-factor model and all other models was significant (Δχ2 = 378.0, Δdf = 6, p < 0.001), suggesting that the seven-factor measurement model fits the collected data much better than all alternative models.
Appendix B showed factor loadings of items. Composite reliabilities of the seven constructs ranged from 0.76 to 0.89, supporting the constructs’ reliability. The average variance extracted (AVE) values ranged from 0.51 to 0.74, suggesting an adequate convergent validity [47]. Table 4 shows the descriptive statistics, composite reliabilities, AVE values, inter-construct correlations, and the square root of AVEs. As the square roots of AVE of each construct were greater than correlations between the construct and all other constructs, discriminant validity was assured [47].

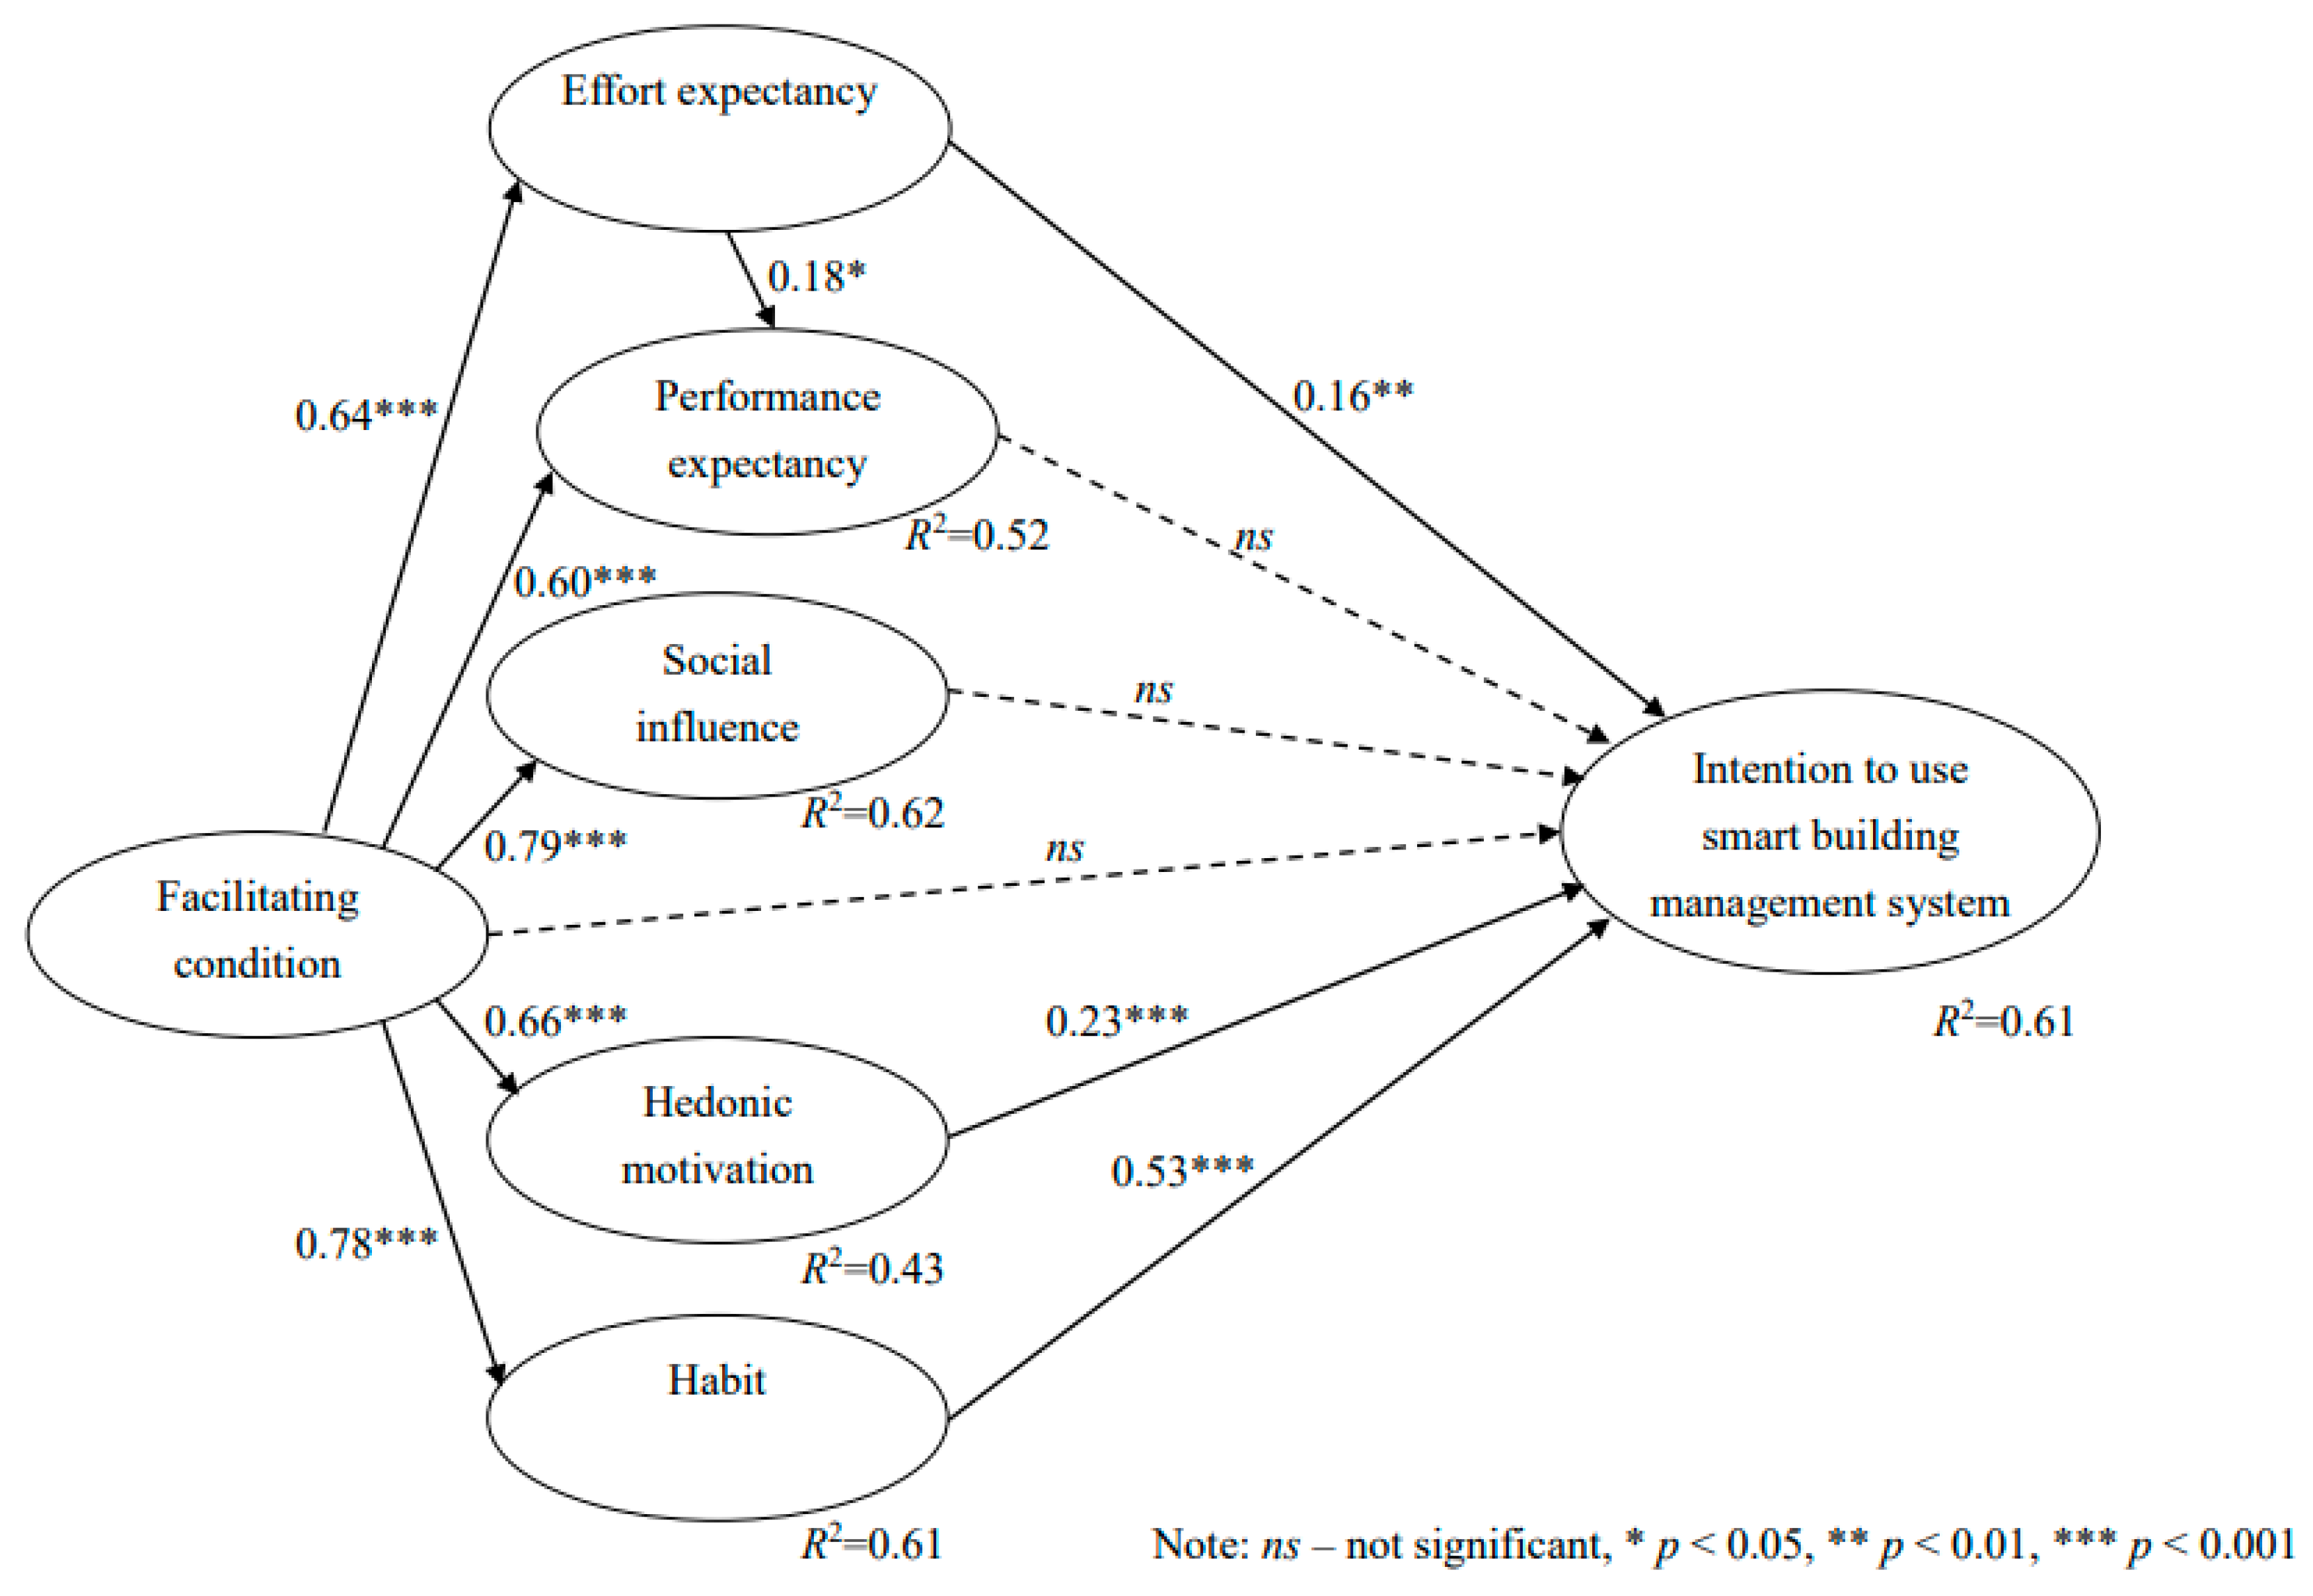
4.4. Structural Equation Modeling Results

The structural model shown in Figure 1 was evaluated with IBM SPSS Amos 26.0 specifying maximum likelihood estimation. Results showed that χ2/df = 1.89 (χ2 = 412.6; df = 218; p < 0.001), RMSEA = 0.05, TLI = 0.95, and CFI = 0.95, meeting all criteria for an acceptable fit. However, the calculated standardized estimates showed that the relationships between performance expectancy and intention (β = 0.05, p = 0.55), between social influence and intention (β = 0.08, p = 0.43), and between facilitating condition and intention (β = 0.00, p = 0.99), were all insignificant. After eliminating these three paths iteratively, a parsimonious structural model was obtained. The final structural model produced the following fit indices: χ2/df = 1.88 (χ2 = 414.7; df = 221; p < 0.001), RMSEA = 0.05, TLI = 0.95, and CFI = 0.95, meeting all criteria for an acceptable fit. The standardized estimates of the significant paths and the coefficients of determination (R2) were depicted in Figure 2. The R2 value of building professionals’ intention to use SBMS was 0.61, indicating that changes in habit, hedonic motivation, effort expectancy, and facilitating condition explain 61 percent of variance in the intention construct.

5. Discussion

Respondents indicated that SBMS should facilitate them to operate, manage, monitor, and control various building systems and keep them informed about the status of operations through automatic notifications, implied by the top three important attributes that they have agreement upon. On the other hand, they identified the ability to adopt open communication protocol(s) as the least important attribute, probably due to concerns of data privacy and protection. Kitchin and Dodge [48] indicated that smart technologies on the one hand counter and manage uncertainty and risks effectively through the efficient deployment of services, but on the other hand expose users to insecurity and vulnerability. They suggested mitigating the insecurity issues by adopting a preventative approach to security and other system management measures.
In answering the first research question, an EFA was performed that identified two emerging dimensions of SBMS attributes for commercial buildings, “intelligent building operations” and “safety and recovery readiness”. These dimensions are important because all buildings including commercial buildings can be smart as humans, but they will get old and fail, too. Intelligent building operations are crucial, as the smartness of a building is experienced and evaluated by its users; adaptive human–machine interfaces should hence be deployed, to cater for the different needs of diverse users. In addition, safety and recovery readiness emerges as an important dimension of SBMS, ensuring business continuity for building owners, occupants, and users in commercial buildings. This dimension becomes particularly relevant, when disasters such as pandemics hit a community while business activities have to be carried out in commercial buildings [49].
In answering the second research question, the refined UTAUT2 was adopted to explore what motivates building professionals to adopt SBMS in commercial buildings. SEM results revealed that facilitating condition impacts effort expectancy, performance expectancy, social influence, hedonic motivation, and habit strongly, significantly, and directly with beta coefficients ≥ 0.60 and p-values < 0.001, but it does not associate with the intention construct significantly and directly. Moreover, there is a strong, significant, and direct effect of habit on building professional’ intention to use SBMS (β = 0.53, p < 0.001). Hedonic motivation directly affects building professionals’ intention to use the system moderately (β = 0.23, p < 0.001) while a weak, significant, and direct effect of effort expectancy on building professionals’ intention to use the system exists (β = 0.16, p < 0.01). However, when the direct and indirect effects are considered together, facilitating condition has the greatest effect (0.67 = 0.78 × 0.53 + 0.66 × 0.23 + 0.64 × 0.16) on building professionals’ intention to use the system in commercial buildings.
Surprisingly, performance expectancy and social influence did not influence building professionals’ intention to use the system significantly. The absence of performance expectancy effect probably resulted from the perception that using SBMS is not a rewarding activity on top of their existing work, similar to the findings of a study on the use of building information modeling in the United Kingdom [50]. As for social influence, it could result from the background of our building professional respondents who hold either a bachelor’s or master’s degree. Comparing with other people without technical backgrounds, our respondents tended to act upon their own beliefs instead of being influenced by others in their social environments, similar to reports from Singapore [51].

5.1. Practical and Managerial Implications

The findings on the three most important attributes (i.e., “monitor and control building facilities”, “enable alarm settings and automatic notifications”, and “provide intelligent and optimal start/stop of building systems”) imply their foremost and fundamental roles in a SBMS in commercial buildings. Therefore, building professionals, particularly electrical engineers, should pay extra attention to ensure the adequacy and recency of these attributes when designing and renewing their SBMS. In addition, the study’s findings showed the least importance of the ability to adopt open communication protocol(s) as a SBMS attribute. As open communication protocols center the communication and integration between devices or systems, respondents’ underestimation of the needs for current smart building systems to integrate with other smart systems (e.g., smart power systems, smart disaster warning systems) at city- or country-level in future may plausibly explain the study’s findings, which implies that building professionals including electrical engineers should develop a long-term perspective for future integration and expansion capacity of their SBMS. Lee et al. [52] explored the use of a shared energy storage system for multiple smart buildings equipped with photovoltaic systems using federated reinforcement learning. They showed that the total energy consumption of heating, ventilation, and air conditioning in smart buildings could be reduced by around 28% and electricity cost could be cut by around 19.6% [52]. Additionally, Lourenço et al. [53] demonstrated that with the use of key enabling technologies such as building-integrated photovoltaic, earth tubes, and intelligent automatic system control, it is possible to significantly reduce heating energy consumption by 22% in a yearly basis. With respect to the identification of two SBMS attribute categories for commercial buildings namely “intelligent building operations” and “safety & recovery readiness”, they pointed to the purpose of cultivating SBMS attributes at the conceptual level. Building professionals can evaluate whether their BMS are “smart” enough in terms of “intelligent building operations” and “safety and recovery”, drawing on the above insights.
Additionally, the study’s findings identifying factors and mechanisms contributing to intention to use SBMS offer certain practical and managerial implications. In order to encourage building professionals to have higher intention to use SBMS in commercial buildings, organizations must provide favorable facilitative conditions, i.e., enough resources, support, and training to employees. In addition, organizations should develop employees’ habit to use SBMS, so that they would use the system autonomously. Organizations can locate office space in buildings with a SBMS, and provide incentives for employees to use SBMS more frequently. Moreover, application developers should incorporate special features making the system funny and enjoyable to use (i.e., introducing hedonic motivation), because many building professionals today are Gen Zers who have been exposed to the online environment for years and grown up using their mobile devices to play games, read news, search information, and communicate with friends. Application developers should design SBMS which requires minimal effort to download, update, and use. User expectation for rapid download, painless learning process and immediate application of an app has already become a norm. Additional effort and system complexity can deter people from adopting a however useful technology [54].

5.2. Limitations and Future Research

Limitations of the study include the cross-sectional design which captured respondent perceptions of SBMS attributes and how they perceived factors influencing their intention to use SBMS at the time of survey. Future research can set up a longitudinal design to reveal changes in the opinions and perceptions of building professionals over time. Second, postgraduate engineering students in a part-time master’s program in Hong Kong and their professional colleagues and friends in building-related industries made up the study’s sample, researchers and practitioners should generalize the study’s findings in other contexts with cautions. It is suggested that the study can be replicated with a random sample in the building-related industries. Third, common method variance could exist in the data theoretically. Therefore, Harman’s single factor test was performed as a post hoc statistical test. The 23 items of the refined UTAUT2 did not form a single factor in an EFA. Moreover, the first factor did not account for the majority of total variance in the unrotated factor solution, implying minimal common method variance. Nevertheless, to further rule out possible common method variance, future research should adopt procedural remedies such as introducing data sources other than respondents reporting their own perceptions.

6. Conclusions

Smart buildings are building blocks of urban sustainability and SBMS is one of the emerging technologies making commercial buildings smart. Sampling 327 building professionals in Hong Kong, the study identified two dimensions of SBMS attributes: intelligent building operations and safety and recovery readiness. Specifically, intelligent building operations include automated and optimal start/stop, monitoring, controlling, and schedule building systems with intelligent and interactive interfaces, implying the importance of electrical and control engineering in smart building management. Additionally, the study identified factors influencing building professionals’ intention to use SBMS in commercial buildings based on the refined UTAUT2, among which facilitating condition affect building professionals’ intention to use the system mostly, through other factors. Habit, hedonic motivation and effort expectancy also affect building professionals’ intention to use the system significantly and directly. Based on the above findings, the study offered several important practical and managerial implications for building professionals including electrical engineers and their organizations to design and develop more effective SBMS in commercial buildings.

Author Contributions

Conceptualization, K.H.L. and W.M.T.; methodology, K.H.L. and W.M.T.; formal analysis, W.M.T.; investigation, K.H.L.; data curation, W.M.T.; writing—original draft preparation, K.H.L., W.M.T. and P.K.C.L.; writing—review and editing, K.H.L., W.M.T. and P.K.C.L.; funding acquisition, K.H.L. All authors have read and agreed to the published version of the manuscript.

Funding

The APC was funded by the University of Hong Kong.

Institutional Review Board Statement

The study was conducted in accordance with the Declaration of Helsinki.

Informed Consent Statement

Informed consent was obtained from all subjects involved in the study.

Data Availability Statement

Data are available upon request.

Conflicts of Interest

The authors declare no conflict of interest.

Appendix A

Table A1. Smart building management system attributes (means and standard deviation).
Total (N = 327)Male (N = 267)Female (N = 60)Gender Difference
(p < 0.05)
AttributeMeanSDMeanSDMeanSD
-
A smart building management system should…
-
provide intelligent & optimal start/stop of building systems
4.140.7774.090.7734.370.758Yes
-
monitor and control building facilities
4.240.7654.190.7654.420.753Yes
-
provide optimal equipment time scheduling
4.080.8304.060.8374.200.798No
-
enable alarm settings and automatic notifications
4.170.8074.120.7984.420.809Yes
-
support maintenance processes
3.980.9133.960.9174.070.899No
-
enable disaster management and automatic recovery
3.870.8783.830.8534.030.974No
-
ensure building safety
4.070.8934.010.8764.330.933Yes
-
have an intelligent and interactive interface
4.080.7734.060.7684.180.792No
-
adopt open communication protocols
3.830.8963.820.8803.900.969No
-
be expandable for Internet of Things (IoTs)
4.020.8933.990.9054.200.819No
-
enable trending and data analysis
4.020.9053.980.9014.180.911No
-
enable building users to make adjustments
3.910.8963.870.8944.120.885No
Note: Items rated on a 5-point Likert scale, ranging from 1 = strongly disagree to 5 = strongly agree.

Appendix B

Table A2. Measurement items (BMS stands for building management system).
ConstructItemFactor Loading *
Effort expectancy- Learning how to use smart BMS is easy for me.0.76
- My interaction with smart BMS is clear and understandable.0.81
- I find smart BMS easy to use.0.79
- It is easy for me to become skillful at using smart BMS.0.79
Performance expectancy- I find smart BMS useful in my daily life.0.73
- Using smart BMS increases my chances of achieving results that are important to me.0.78
- Using smart BMS helps me accomplish things more quickly.0.63
Social influence- People who are important to me think that I should use smart BMS.0.75
- People (i.e., managers) who influence my behavior think that I should use smart BMS.0.80
- People (i.e., professional peers) whose opinions I value think that I should us smart BMS.0.76
Facilitating condition- I have the resources necessary (from the organization) to use smart BMS.0.82
- I have the knowledge necessary (including training) to use smart BMS.0.74
- Smart BMS is compatible with other technologies we currently use in the organization.0.71
- I can get help from others in the organization when I have difficulties using smart BMS.0.56
Hedonic motivation- Using smart BMS is fun.0.83
- Using smart BMS is enjoyable.0.91
- Using smart BMS is entertaining.0.84
Habit- The use of smart BMS has become a habit for me.0.83
- I must use smart BMS.0.84
- Using smart BMS has become natural to me.0.89
Intention to use smart BMS- I intend to continue using smart BMS in the future.0.76
- I will always try to use smart BMS in my work life.0.80
- I plan to continue to use smart BMS frequently.0.84
Note: * Factor loadings were obtained for confirmatory factor analysis.

References

  1. U.S. EIA. Monthly Energy Review—October 2022; U.S. Energy Information Administration (EIA), U.S. Department of Energy: Washington, DC, USA, 2020. [Google Scholar]
  2. Hu, S.; Zhang, Y.; Yang, Z.; Jiang, Y. Challenges and opportunities for carbon neutrality in China’s building sector—Modelling and data. Build. Simul. 2022, 15, 1899–1921. [Google Scholar] [CrossRef]
  3. HKEMSD. Hong Kong Energy End-Use Data 2022; Hong Kong Electrical & Mechanical Services Department (HKEMSD): Hong Kong, China, 2022. [Google Scholar]
  4. To, W.M.; Lai, T.M.; Lo, W.C.; Lam, K.H.; Chung, W.L. The growth pattern and fuel life cycle analysis of the electricity consumption of Hong Kong. Environ. Pollut. 2012, 165, 1–10. [Google Scholar] [CrossRef] [PubMed]
  5. To, W.M.; Lee, P.K.C. GHG emissions from electricity consumption: A case study of Hong Kong from 2002 to 2015 and trends to 2030. J. Clean. Prod. 2017, 165, 589–598. [Google Scholar] [CrossRef]
  6. To, W.M.; Yu, T.W.; Lai, T.M.; Li, S.P. Characterization of commercial clothes dryers based on energy-efficiency analysis. Int. J. Cloth. Sci. Technol. 2007, 19, 277–290. [Google Scholar] [CrossRef]
  7. To, W.M.; Hung, H.K.; Chung, W.L. Energy, economic, and environmental performance of commercial water heating systems. J. Fac. Manag. 2014, 12, 353–367. [Google Scholar]
  8. Ramesh, T.; Prakash, R.; Shukla, K.K. Life cycle energy analysis of buildings: An overview. Energ. Build. 2010, 42, 1592–1600. [Google Scholar] [CrossRef]
  9. Dounis, A.I.; Caraiscos, C. Advanced control systems engineering for energy and comfort management in a building environment—A review. Renew. Sust. Energ. Rev. 2009, 13, 1246–1261. [Google Scholar] [CrossRef]
  10. Buckman, A.H.; Mayfield, M.; Beck, S.B. What is a smart building? Smart Sust. Built Environ. 2014, 3, 92–109. [Google Scholar] [CrossRef] [Green Version]
  11. To, W.M.; Lee, P.K.C.; Lam, K.H. Building professionals’ intention to use smart and sustainable building technologies—An empirical study. PLoS ONE 2018, 13, e0201625. [Google Scholar] [CrossRef] [Green Version]
  12. Li, Z.; Zhang, J.; Li, M.; Huang, J.; Wang, X. A review of smart design based on interactive experience in building systems. Sustainability 2020, 12, 6760. [Google Scholar] [CrossRef]
  13. Chew, M.Y.L.; Teo, E.A.L.; Shah, K.W.; Kumar, V.; Hussein, G.F. Evaluating the roadmap of 5G technology implementation for smart building and facilities management in Singapore. Sustainability 2020, 12, 10259. [Google Scholar] [CrossRef]
  14. Albino, V.; Berardi, U.; Dangelico, R.M. Smart cities: Definitions, dimension, performance, and initiative. J. Urban Technol. 2015, 22, 3–21. [Google Scholar] [CrossRef]
  15. To, W.M.; Lai, L.S.L.; Lam, K.H.; Chung, A.W.L. Perceived importance of smart and sustainable building features from the users’ perspective. Smart Cities 2018, 1, 163–175. [Google Scholar] [CrossRef] [Green Version]
  16. Eini, R.; Linkous, L.; Zohrabi, N.; Abdelwahed, S. Smart building management system: Performance specifications and design requirements. J. Build. Eng. 2021, 39, 102222. [Google Scholar] [CrossRef]
  17. CIBSE. CIBSE Guide H—Building Control Systems; The Chartered Institution of Building Services Engineers (CIBSE): London, UK, 2009. [Google Scholar]
  18. Kumara, W.H.C.D.; Waidyasekara, K.G.A.S.; Weerasinghe, R.P.N.P. Building management system for sustainable built environment in Sri Lanka. Built Environ. Proj. Asset Manag. 2016, 6, 302–316. [Google Scholar] [CrossRef]
  19. Minoli, D.; Sohraby, K.; Occhiogrosso, B. IoT considerations, requirements, and architectures for smart buildings—Energy optimization and next-generation building management systems. IEEE Internet Things J. 2017, 4, 269–283. [Google Scholar] [CrossRef]
  20. Gunatilaka, R.N.; Abdeen, F.N.; Sepasgozar, S.M.E. Developing a scoring system to evaluate the level of smartness in commercial buildings: A case of Sri Lanka. Buildings 2021, 11, 644. [Google Scholar] [CrossRef]
  21. Davis, F.D.; Bagozzi, R.P.; Warshaw, P.R. User acceptance of computer technology: A comparison of two theoretical models. Manag. Sci. 1989, 35, 982–1003. [Google Scholar] [CrossRef] [Green Version]
  22. de Souza Dias, D. Managers’ motivation for using information technology. Ind. Manag. Data Syst. 1998, 98, 338–342. [Google Scholar] [CrossRef]
  23. Mun, Y.Y.; Jackson, J.D.; Park, J.S.; Probst, J.C. Understanding information technology acceptance by individual professionals: Toward an integrative view. Inform. Manag. 2006, 43, 350–363. [Google Scholar]
  24. Marangunić, N.; Granić, A. Technology acceptance model: A literature review from 1986 to 2013. Univers. Access Inf. 2015, 14, 81–95. [Google Scholar] [CrossRef]
  25. Balakrishnan, J.; Dwivedi, Y.K.; Hughes, L.; Boy, F. Enablers and inhibitors of AI-powered voice assistants: A dual-factor approach by integrating the status quo bias and technology acceptance model. Inform. Syst. Front. 2021, 1–22. [Google Scholar] [CrossRef]
  26. Fishbein, M.; Ajzen, I. Belief, Attitude, Intention and Behavior: An Introduction to Theory and Research; Addison-Wesley: Reading, MA, USA, 1975. [Google Scholar]
  27. Taylor, S.; Todd, P.A. Understanding information technology usage: A test of competing models. Inform. Syst. Res. 1995, 6, 144–176. [Google Scholar] [CrossRef]
  28. Igbaria, M.; Iivari, J. The effects of self-efficacy on computer usage. Omega-Int. J. Manag. Sci. 1995, 23, 587–605. [Google Scholar] [CrossRef]
  29. Moore, G.C.; Benbasat, I. Integrating diffusion of innovations and theory of reasoned action models to predict utilization of information technology by end-users. In Diffusion and Adoption of Information Technology; Kautz, K., Pries-Heje, J., Eds.; Springer: Boston, MA, USA, 1996; pp. 132–146. [Google Scholar]
  30. Compeau, D.; Higgins, C.A.; Huff, S. Social cognitive theory and individual reactions to computing technology: A longitudinal study. MIS Quart. 1999, 23, 145–158. [Google Scholar] [CrossRef]
  31. Venkatesh, V.; Morris, M.G.; Davos, G.B.; Davis, F.D. User acceptance of information technology: Toward a unified view. MIS Quart. 2003, 27, 425–478. [Google Scholar] [CrossRef] [Green Version]
  32. Venkatesh, V. Determinants of perceived ease of use: Integrating control, intrinsic motivation, and emotion into the technology acceptance model. Inform. Syst. Res. 2000, 11, 342–365. [Google Scholar] [CrossRef] [Green Version]
  33. Venkatesh, V.; Thong, J.Y.; Xu, X. Consumer acceptance and use of information technology: Extending the Unified Theory of Acceptance and Use of Technology. MIS Quart. 2012, 36, 157–178. [Google Scholar] [CrossRef] [Green Version]
  34. Owusu Kwateng, K.; Appiah, C.; Atiemo, K.A.O. Adoption of health information systems: Health professionals’ perspective. Int. J. Healthc. Manag. 2021, 14, 517–533. [Google Scholar] [CrossRef]
  35. Halassi, S.; Semeijn, J.; Kiratli, N. From consumer to prosumer: A supply chain revolution in 3D printing. Int. J. Phys. Distrib. Log. Manag. 2019, 49, 200–216. [Google Scholar] [CrossRef]
  36. Schukat, S.; Heise, H. Towards an understanding of the behavioral intentions and actual use of smart products among German farmers. Sustainability 2021, 13, 6666. [Google Scholar] [CrossRef]
  37. Chang, C.C.; Yan, C.F.; Tseng, J.S. Perceived convenience in an extended Technology Acceptance Model: Mobile technology and English learning for college students. Australas. J. Edu. Technol. 2012, 28, 809–826. [Google Scholar] [CrossRef]
  38. Chen, K.Y.; Chang, M.L. User acceptance of ‘near field communication’ mobile phone service: An investigation based on the ‘Unified Theory of Acceptance and Use of Technology’ model. Serv. Ind. J. 2013, 33, 609–623. [Google Scholar] [CrossRef]
  39. To, W.M.; Tang, M.N.F. Computer-based course evaluation: An extended Technology Acceptance Model. Educ. Stud. 2019, 45, 131–144. [Google Scholar] [CrossRef]
  40. Venkatesh, V. Creating favorable user perceptions: Exploring the role of intrinsic motivation. MIS Quart. 1999, 23, 239–260. [Google Scholar] [CrossRef] [Green Version]
  41. Reyes-Menendez, A.; Saura, J.R.; Palos-Sanchez, P.R.; Alvarez-Garcia, J. Understanding user behavioral intention to adopt a search engine that promotes sustainable water management. Symmetry 2018, 10, 584. [Google Scholar] [CrossRef] [Green Version]
  42. Biernacki, P.; Waldorf, D. Snowball sampling: Problems and techniques of chain referral sampling. Sociol. Method. Res. 1981, 10, 141–163. [Google Scholar] [CrossRef]
  43. To, W.M.; Lam, K.H.; Lai, T.M. Importance-performance ratings for environmental practices among Hong Kong professional-level employees. J. Clean. Prod. 2015, 108, 699–706. [Google Scholar] [CrossRef]
  44. Jiang, Y.; Huang, G.; Fisher, B. Air quality, human behavior and urban park visit: A case study in Beijing. J. Clean. Prod. 2019, 240, 118000. [Google Scholar] [CrossRef]
  45. Goh, I.Z.; Matthew, N.K. Residents’ willingness to pay for a carbon tax. Sustainability. 2021, 13, 10118. [Google Scholar] [CrossRef]
  46. Hair, J.F., Jr.; Black, W.C.; Babin, B.J.; Anderson, R.E. Multivariate Data Analysis, 7th ed.; Prentice Hall: Englewood Cliffs, NJ, USA, 2010. [Google Scholar]
  47. Fornell, C.; Larcker, D.F. Evaluating structural equation models with unobservable variables and measurement error. J. Mark. Res. 1981, 18, 39–50. [Google Scholar] [CrossRef]
  48. Kitchin, R.; Dodge, M. The (in)security of smart cities: Vulnerabilities, risks, mitigation, and prevention. J. Urban Technol. 2019, 26, 47–65. [Google Scholar] [CrossRef]
  49. Ramezani, J.; Cmarinha-Matos, L.M. Approaches for resilience and antifragility in collaborative business ecosystems. Technol. Forecast. Soc. 2020, 151, 119846. [Google Scholar] [CrossRef]
  50. Howard, R.; Restrepo, L.; Chang, C.Y. Addressing individual perceptions: An application of the Unified Theory of Acceptance and Use of Technology to building information modeling. Int. J. Proj. Manag. 2017, 35, 107–120. [Google Scholar] [CrossRef]
  51. Gerrard, P.; Cunningham, J.B. Singapore’s undergraduates: How they choose which bank to patronize. Int. J. Bank Mark. 2001, 19, 104–114. [Google Scholar] [CrossRef]
  52. Lee, S.; Xie, L.; Choi, D.-H. Privacy-preserving energy management of a shared energy storage system for smart buildings: A federated deep reinforcement learning approach. Sensors 2021, 21, 4898. [Google Scholar] [CrossRef] [PubMed]
  53. Lourenço, J.M.; Aelenei, L.; Facão, J.; Gonçalves, H.; Aelenei, D.; Pina, J.M. The use of key enabling technologies in the nearly zero energy buildings monitoring, control and intelligent management. Energies 2021, 14, 5524. [Google Scholar] [CrossRef]
  54. Morris, A.; Zuo, J.; Wang, Y.; Wang, J. Readiness for sustainable community: A case study of green star communities. J. Clean. Prod. 2018, 173, 308–317. [Google Scholar] [CrossRef]
Figure 1. Theoretical model of the study.
Sustainability 15 00080 g001
Figure 2. Final structural model.
Sustainability 15 00080 g002
Table 1. Demographic information of respondents (N = 327).
VariableClassFrequencyPercent
GenderMale26781.7
Female6018.3
Age group20–2923070.3
30–395817.7
40–49226.7
50 or above175.3
EducationHigh school5918.0
Bachelor’s degree15246.5
Master’s or above10632.4
Others103.1
ProfessionDesign and consulting21064.2
Construction and contracting4814.7
IT and computer268.0
Facilities management268.0
Others175.2
PositionJunior/assistant engineer14745.0
Engineer or equivalent9529.1
Senior engineer or equivalent298.8
Manager/executive engineer268.0
Others309.1
Working experience<1 year6921.1
1 to <2 years6820.8
2 to <4 years6921.1
4 to <8 years5516.8
8 years or more6620.2
Role in BMSDesigner319.5
User24976.1
Designer and user4714.4
Table 2. Exploratory factor analysis (N = 327).
AttributeFactor 1Factor 2
A smart building management system should
-
provide intelligent and optimal start/stop of building systems
0.820.09
-
monitor and control building facilities
0.800.07
-
have an intelligent and interactive interface
0.680.24
-
enable alarm settings and automatic notifications
0.670.34
-
provide optimal equipment time scheduling
0.630.30
-
be expandable for Internet of Things (IoTs)
0.620.23
-
enable disaster management and automatic recovery
0.080.82
-
support maintenance processes
0.310.70
-
ensure building safety.
0.220.69
Eigenvalue3.961.14
Variance explained (in %)34.921.7
Cumulative variance explained (in %)34.956.6
Cronbach alpha0.830.65
Notes: (i) Principal component analysis with varimax rotation was employed; (ii) The three items “adopt open communication protocols”, “enable trending and data analytics”, and “enable building users to make adjustments” were dropped due to low communalities and high cross-loadings.
Table 3. Fit indices for the seven-factor model and alternative models.
ModelRMSEATLICFIχ2dfχ2/dfΔχ2Δdf
Seven-factor model0.050.960.97347.72091.66--
Six-factor model (i)0.090.860.88725.72153.38378.06
Five-factor model (ii)0.100.810.84899.52204.09551.811
Three-factor model (iii)0.120.710.741304.82275.75957.118
One-factor model0.130.650.681556.32306.771208.621
Notes: (i) Hedonic motivation and habit formed a single factor in the six-factor model; (ii) hedonic motivation and habit formed a single factor and effort expectancy and performance expectancy formed another single factor in the five-factor model; (iii) hedonic motivation, habit, social influence, effort expectancy and performance expectancy formed a single factor in the three-factor model.
Table 4. Descriptive statistics, composite reliabilities (CR), average variance extracted (AVE) values, and correlations.
ConstructMean (SD)CRAVEEEPESIFCHMHBINT
EE3.652 (0.738)0.870.620.789
PE3.794 (0.673)0.760.510.5590.715
SI3.555 (0.739)0.820.600.5330.6350.773
FC3.540 (0.707)0.800.510.5410.6020.6800.711
HM3.614 (0.825)0.890.740.4880.5440.5320.5330.860
HB3.261 (0.942)0.890.730.5340.5570.6880.6620.5870.854
INT3.682 (0.769)0.840.640.5420.5420.6030.5800.6060.7400.802
Notes: EE—Effort Expectancy, PE—Performance Expectancy, SI—Social Influence, FC—Facilitating Condition, HM—Hedonic Motivation, HB—Habit, INT—Intention to use smart BMS; (ii) The diagonal elements in bold and italics were the square roots of AVE values.
Disclaimer/Publisher’s Note: The statements, opinions and data contained in all publications are solely those of the individual author(s) and contributor(s) and not of MDPI and/or the editor(s). MDPI and/or the editor(s) disclaim responsibility for any injury to people or property resulting from any ideas, methods, instructions or products referred to in the content.

