Article

A Spatial Water Footprint Assessment of Recycled Cotton T-Shirts: Case of Local Impacts in Selected China Provinces

1
School of Fashion Design & Engineering, Zhejiang Sci-Tech University, Hangzhou 310018, China
2
College of Textile Science and Engineering (International Institute of Silk), Zhejiang Sci-Tech University, Hangzhou 310018, China
3
Academy of Humanities and Social Sciences, Zhejiang Gongshang University, Hangzhou 310018, China
4
Green and Low-Carbon Technology and Industrialization of Modern Logistics, Zhejiang Engineering Research Center, Wenzhou 325100, China
5
Zhejiang Provincial Innovation Center of Advanced Textile Technology, Shaoxing 312000, China
*
Author to whom correspondence should be addressed.
Sustainability 2023, 15(1), 817; https://doi.org/10.3390/su15010817
Submission received: 7 November 2022 / Revised: 4 December 2022 / Accepted: 30 December 2022 / Published: 2 January 2023
(This article belongs to the Special Issue Sustainability in Textiles)

Abstract

:
In global trade, the manufacture and consumption of cotton textile products are intervening in the hydrological cycle. To address the relationship between the product system and the unsustainable use of local water resources, a spatial water footprint assessment is needed. This study presents a spatial water footprint method that was demonstrated in the case of domestically produced cotton T-shirts in three recycle scenarios. The results showed that the water scarcity footprint of conventional T-shirt, eco T-shirt, recycled T-shirt is 2.45 H2O eq, 1.74 H2O eq, 8 × 10⁻² H2O eq, respectively, and the water-eutrophication footprint of conventional T-shirt, eco T-shirt, recycled T-shirt is 1.18 × 10⁻² PDF·m2·yr−1, 9.47 × 10⁻³ PDF·m2·yr−1, 4.04 × 10⁻³ PDF·m2·yr−1, respectively. Two interesting results have been found. Firstly, the hydrosphere has been affected by manufacture and consumption; thus any choice made by manufacturers and consumers may lead to an impact on the water resource in a region that is far from the location. Secondly, the effect of water footprint reduction will be more apparent in places with severe water stress. The spatial water footprint offers a transparent result of each phase’s potential contribution to the local environment and could make a quantitative comparison between product stages, products, and local impacts. Thus, spatial water footprint will be a critical component in the sustainability management improvement of the supply chain.

1. Introduction

Cotton textile has been shown to intervene in the global water cycle massively through international trade [1]. Pakistan, China, Uzbekistan, and India are the largest exporters of blue water because of the high water consumption in the cotton agriculture stage. In the twenty-five members of the European Union (EU25), 84% of the EU’s cotton-related water footprint lies outside the EU, which heavily depends on the water resources of India, China, and Pakistan [2]. China is the largest cotton-cultivation country, accounting for approximately one-quarter of global cotton-lint production [3]. In China, the textile industry is an important sector, which directly employs more than 8.67 million workers and has developed 35 thousand enterprises [4]. According to the data of the National Bureau of Statistics of China, domestic textile enterprises contributed more than USD 963 billion in revenue and USD 124 billion in export in 2016 [4].
The agricultural sector for the production of food and fiber requires accounts for 86% of global freshwater consumption. Furthermore, the textile industry produces a large volume of water consumption and water pollutant emissions, which is also recognized as one of the priorities for the implementation of cleaner production [5]. Cotton textile products, from the life cycle perspective, compared with other man-made textiles like polyester, have a more complex and multi-tiered chain that consists of three major processes (i.e., cultivation; textile production; use stage). These processes also include many sub-processes, such as planting, irrigation, spinning, dyeing, and washing. Thus, an array of concerns in terms of water has been raised associated with cotton cultivation and textile production, as well as different consumer behaviors, because water is indispensable in those phases. In 2021, Xinjiang’s cotton output was 5.129 million tons, accounting for 89.5% of the national output [6]. The planting area was 2506.1 hectares, accounting for 82.8% of the national planting area. Because the land type of Xinjiang is semidesert, it poses high pressure to the water resource of the planting region [7]. A report prepared by Sphera (Sphera Solutions) revealed that water consumption per tonne of seed cotton production: conventional cotton 1.71 × 10⁶ kg; organic cotton, 1.88 × 10⁶ kg, Better Cotton 1.75 × 10⁶ kg [8]. Liu et al. [7] revealed that 79.1% of the contribution to the water depletion is attributable to cotton cultivation, wherein irrigation water, compound fertilizer, and pesticides are the dominant contributors. In the textile production phase, wet processes (e.g., sizing, desizing, scouring and bleaching, dyeing, finishing) require a large amount of freshwater, and the wastewater emission from those processes is highly polluted. Tremendous artificial chemicals are input during dyeing and finishing, such as dyes, wetting agents, and softeners, are emitted into the nature environment with wastewater flow and have made researchers consider their toxici impact on ecosystems and human beings [9]. Different consumer behaviors (e.g., lifetime span, frequency of use, and washing habits) have been indicated, leading to different environmental results. A significant difference in consumer habits between regions is evident when laundering jeans [10]. U.S. consumers use more water, and Chinese users wash more frequently. This difference depends on culture, habits, technology, and washing machine standards; however, in general, handwashing saves water and is a more environmentally friendly way [11].
“Sustainability development aims to satisfy the current needs without compromising the future generation’s needs” [12]. The cleaner production concept is adopted and flourishes in the manufacturing sector, which integrates the continuous application of preventive environmental strategies to processes, products, and services aiming to increase efficiency and minimize the risks to people and the environment [13]. Many sustainable strategies are being taken in the textile sector to develop cleaner products, and more and more companies are undertaking initiatives to gain a better understanding of the environmental performance of their products [14]. The sustainability of textiles can involve eco-friendly material selection, environmentally friendly manufacturing processes, green supply chains, and ethical consumers [15]. Selecting raw materials or substances that are sustainable or processed through sustainable process routes is an effective way to reduce consumption and emissions. For example, organic cotton is considered a good alternative to original cotton, which is planted without insects and fertilizer usage [16]. Furthermore, technical improvement also plays an important role in clean production. Various identified methods in the textile industry are ozone bleaching, enzyme pretreatment, micelle dyeing [17], ozone fading [18], and the hydro-jet technology in denim [19]. Systematically literature review has shown that generally, the reuse or recycling of textiles can significantly reduce environmental impact. except in some circumstances wherein very low replacement rates and the long distance of transport will eliminate the benefits [20]. It was shown that recycling or reuse has the potential to cause certain types of environmental impacts mainly in terms of climate change and acidification because energy and electricity are consumed in this process [21,22]. The main obstacle of the textile recycle market is the low quality of the resultant material, which leads to low strength and short fiber length and thereby the low spinnability of the recycled fiber. This mainly depends on the quality of the waste and the processing technology [23].
Water footprint is a method that effectively measures the environmental burden related to water, which was introduced by Hoekstra et al. in 2002. For the earlier studies of water footprint, they simply quantified the sum of the volume of water usage [24,25], and then they incorporated the dilution of water volume to quantify the impacts of pollution [26,27,28]. However, voluminal accounting provides incomplete information without information on local ecosystem conditions. To overcome this limitation, a water stress index (WSI) was proposed by Pfister et al. [29] to access the extent of water scarcity in each region [30]. To better assess water scarcity, the WULACA group and UNEP/SETAC Life Cycle Initiative in a joint effort proposed available water remaining (AWARE), a generic blue-water scarcity indicator, representing the water availability of each area in the watershed [31]. The ISO 14046 standard for water footprint was developed in 2014, lining with using life cycle assessment (LCA) principles [32], which offer guidelines and principles to conduct an LCA-based water footprint assessment that incorporates two dimensions, i.e., water scarcity and water degradation. For many impact categories, the impact of a given elementary flow depends on where the flow occurs [33]. The LCA method is evolving to incorporate spatial characterization factors (CFs) [34,35] to indicate environment heterogeneity, and an over-reaching LCA method that is globally regionalized was developed, such as IMPACT World+ [36] and LC-IMPACT [37].
The LCA-based water footprint, particularly the water-scarcity footprint, has been calculated for a wide range of products, including primary aluminum [38], oil [39], potato [40], and milk [41]. However, the improved regionalized method on water quality impact (e.g., water acidification, water eutrophication) has not been applied to water footprints as they are presently calculated [42,43]. At present, most LCA studies of cotton products do measure water consumption and water pollutant impact, but they remain the simple summation of different types of water volume (i.e., blue, green) and a general potential impact assessment without a spatial difference [11,44,45,46,47]. Moreover, most existing water footprint assessments are conducted with a country, continent WSI, and water degradation footprint is conducted with general CFs, this presents the risk of misleading consumers. Firstly, for large countries with heterogeneous ecosystems like China, country WSI provides little insight into local water-scarcity levels, so it is unable to be used in the domestic products’ water footprint assessment. However, the high resolution of CFs at the level of 0.5° × 0.5° will lead to difficulties because the specific location is always difficult to identify. As such, the CFs and WSI aggregated in the province as resulted in this study are easy to use and without the loss of the characteristic of the local level. Secondly, general CFs for the water-degradation footprint will mislead consumers because of the confusion on whether a product with a low water footprint is better. Actually, it depends on where it occurs. The published literature remains a gap in the comprehensive and spatial water-footprint assessment of cotton textile products. It can only provide limited information about the environmental performance of cotton textile products and has the potential to mislead producers and consumers because of the confusion regarding whether a product with a lower water footprint is better than others. Actually, this depends on where it occurs.
In this study, we focused on giving a spatial water-footprint assessment of a recycled cotton T-shirt in China, with a resolution at the province level. In this way, it could be used for identifying the impact of cotton T-shirt production on the local environment, as well as provide a more comprehensive and detailed understanding of the environmental burden of products. While WSI has been widely applied, the water-degradation footprint in the textile industry continues to remain generally assessed without geographic boundaries. With the usage of WSI, the incorporated regionalized CFs in water degradation could result in a comparison between different stages and products of different regions. The environmental performance of three different recycling scenarios during the fiber production phase was compared to evaluate the benefits taken from recycling. Moreover, combined with spatial water-footprint assessment, it could provide a better understanding of how the local conditions influences the results of environmental performance, which could inform the policy-makers and investors on how to enact their strategies.

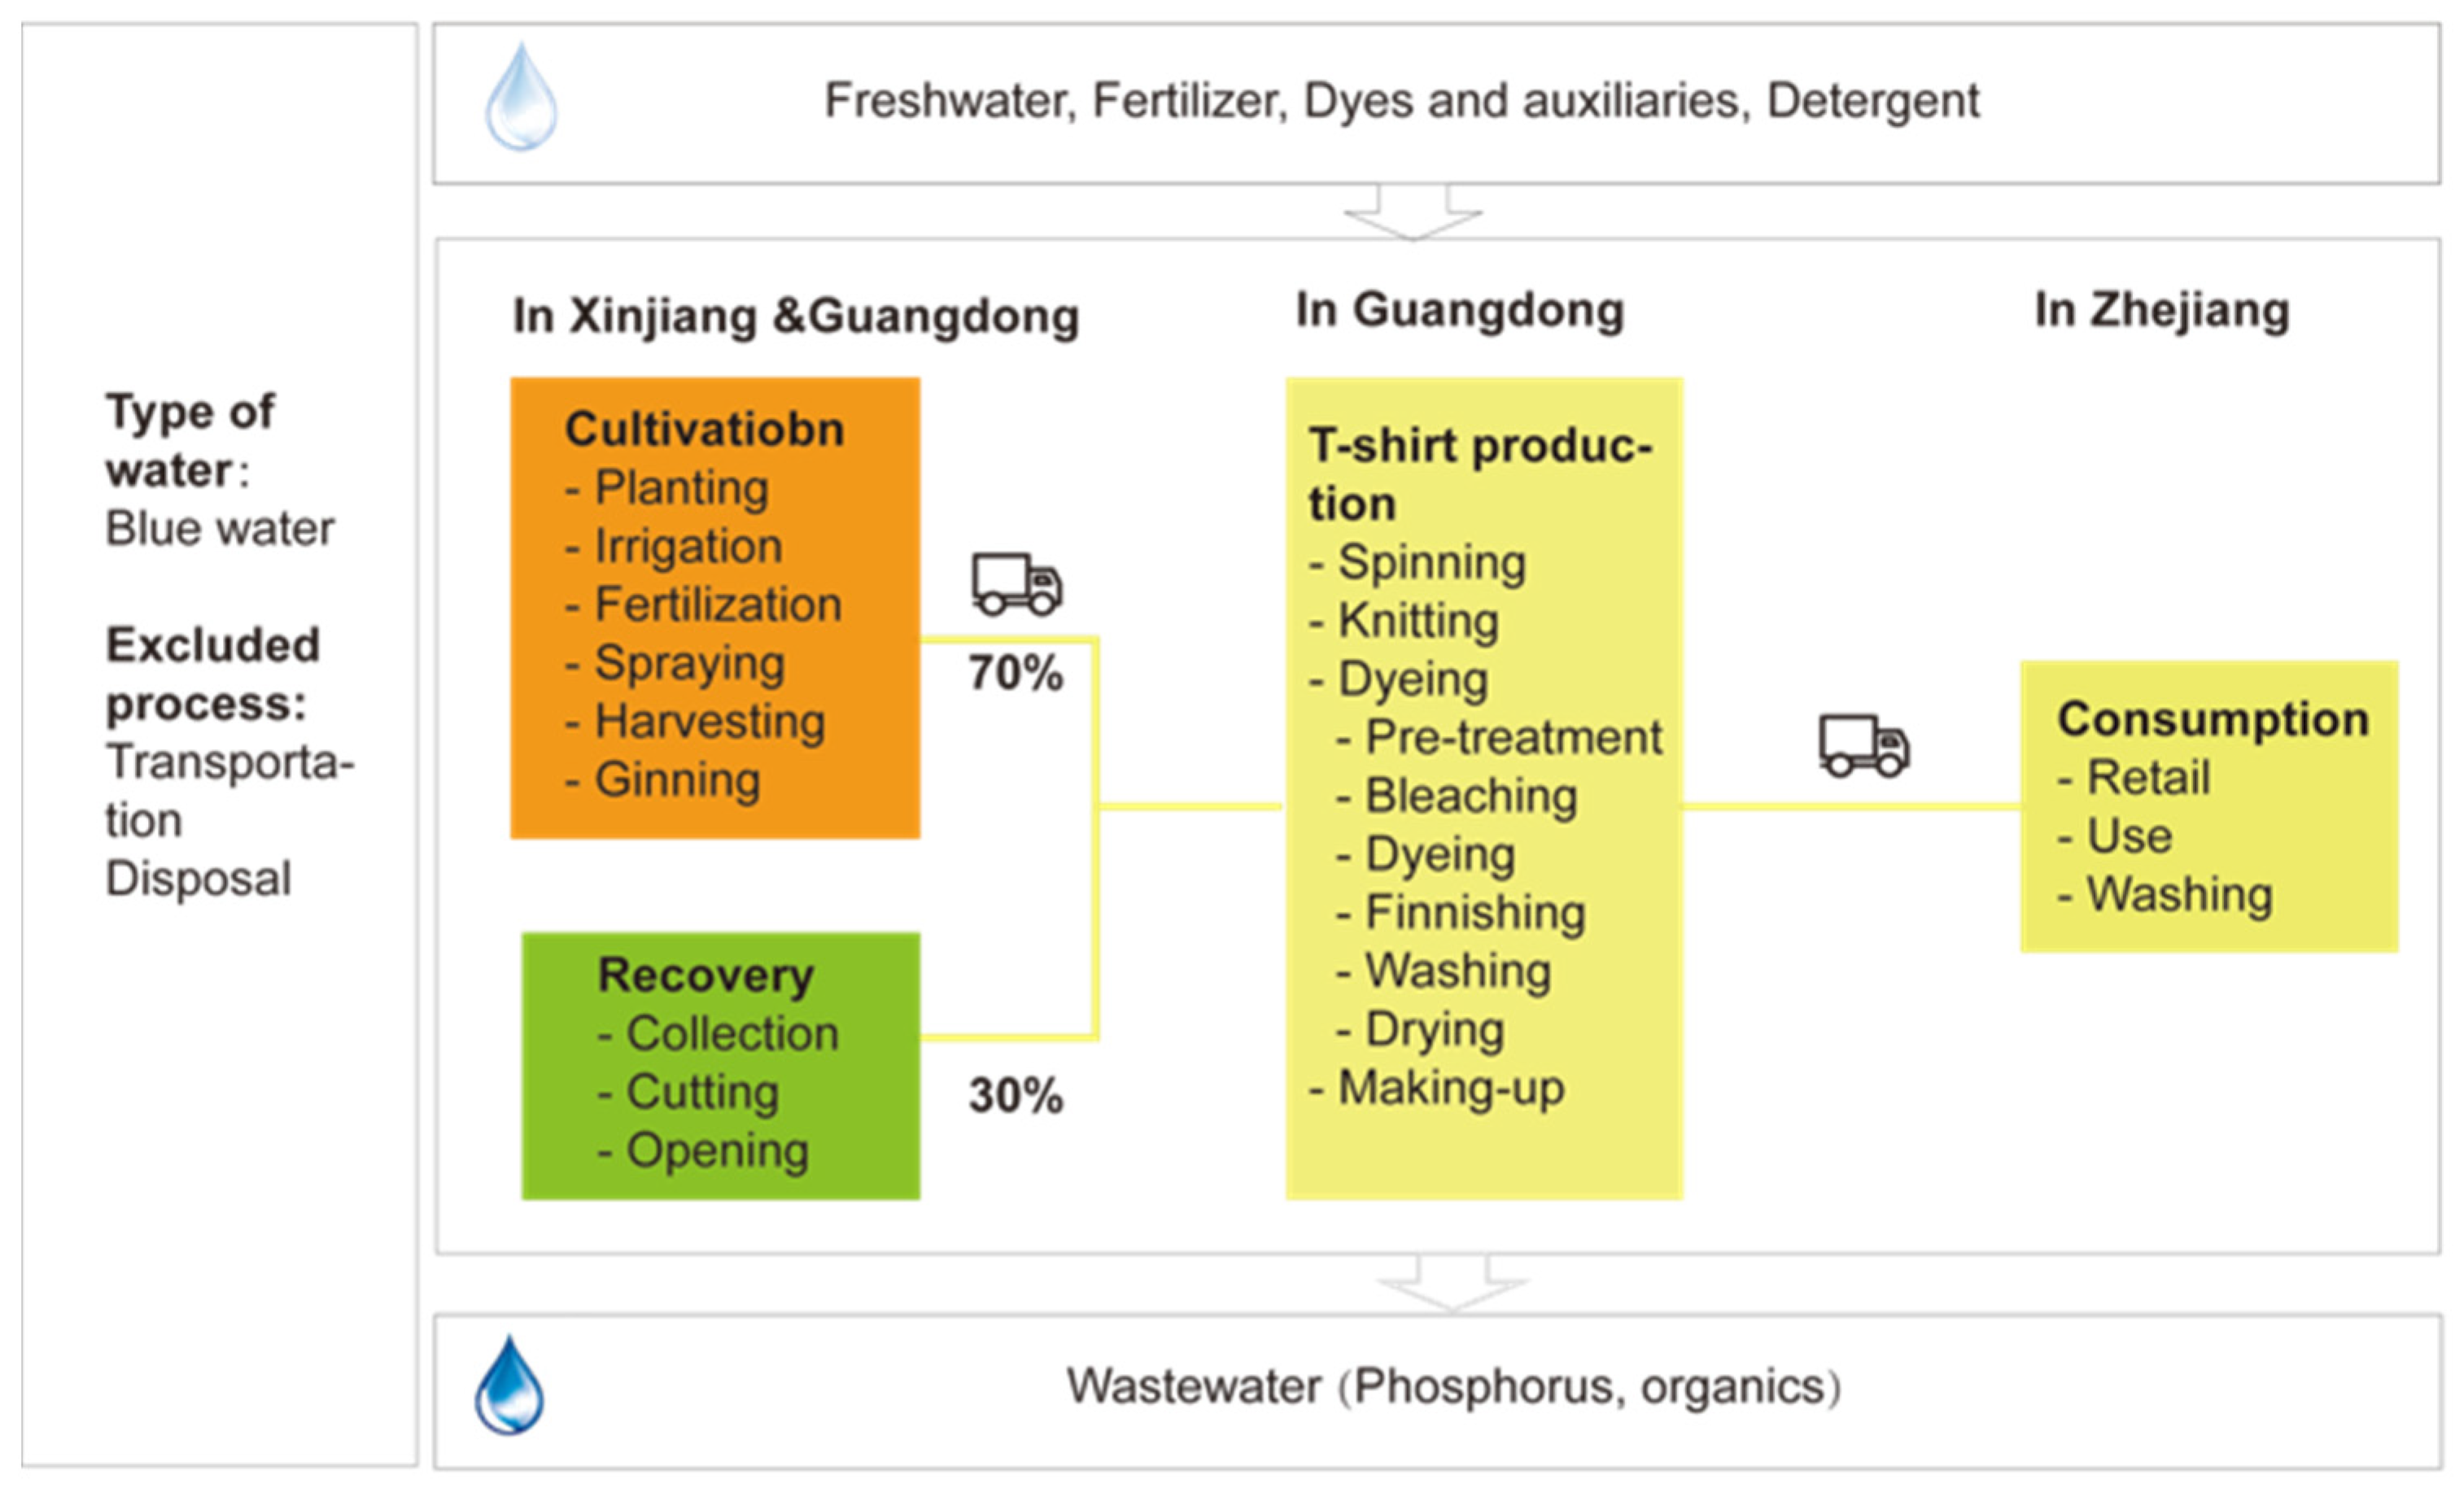
2. Materials and Methods

Our study mainly analyzes the spatial water footprint of a piece of 100% cotton T-shirt with a weight of 180 g. The water footprint of the cotton T-shirt was estimated from the cultivation to the use stage, and the phases of disposal and transportation were excluded from the system boundary of this analysis, as there is no direct water consumption for these phases. Figure 1 details the type of water included, phases, and locations in the life cycle chain of the T-shirt assessed in this study. Three different recycling scenarios during fiber production were assessed and compared (i.e., no recycling, 30% recycling, and 100% recycling).

2.1. Data Collection

Primary production data was collected by field investigations on a representative mill in China, including the loss rate of each phase, water input, and wastewater emission. In this mill, cotton fiber recycling is a way to recycle the rag cuttings in the cutting process and the lost fiber in the spinning process in the same production chain. Those processes both contribute to a high loss rate between 20% to 30%. Rag cuttings are shredded and then mixed with the collected lost fiber. After that, they are mixed with original fiber in the composition and spinning phases. As mentioned before, recycling will lead to low quality and spinnability. Therefore, mixing with original fiber is always conducted to improve the quality of recycled cotton products.
Statistical data from this enterprise was allocated according to the production of semi-finished products or finished products. The blue water utilized as irrigation in the cotton cultivation phase was obtained from a crop water-footprint study reported by Xuan et al. [48]. Blue water required for cotton growth was calculated in 13 regions of Xinjiang with the Penman equation and CROPWAT software. Results show that 1 kg of seed cotton requires 4.82 m3 water containing green and blue water. Fertilizer application was allocated according to the annual cotton-lint production that was obtained from the Xinjiang Statistical Yearbook [49]. The phosphorus loss rate through runoff and leaching was obtained from field experiments developed by the First China Pollution Source Census (CPSC) [50], wherein 372 field tests were conducted to assess fertilizer runoff and the leaching process for different cropping systems [51]. The phosphorus loss rate of runoff and leaching caused by fertilizer application for cotton cultivation in this study was searched by region: northwest arid and semi-arid plain, flat land, and drylands, and crop system: mono-cropping systems. Tap water consumption and wastewater emission in the use phase were taken from a questionnaire survey of Chinese consumers, conducted by Zhang et al. [11].

2.2. Water-Scarcity Footprint

The water-scarcity footprint is a metric that describes the impact of human activity on water scarcity in a locality [40]. It was revised from the water footprint, which crudely sums more than one form of water consumption (blue, green, and gray water), by incorporating water stress CFs to address the regional nature difference of water scarcity [30]. For example, the impact of water consumed in a region of water abundance is incomparable to that of water consumed where it is scarce. The impact of the water consumption of one piece of T-shirt was denoted as WSF and was assessed as follows:
WSF = i = n i = 1 WC i , r WSI r WSI average
where WSF is the water-scarcity footprint (kg H2O eq); WC i , r (water consumption kg H2O) is the water consumed in phase i in region r. WSI r is the average water stress index of region r. WSI average is the global average water stress index (WSI).
A water stress CF, namely, the WSI, was developed by Pfister et al. [29] based on a withdrawal-to-availability ratio. WSI is available in a global geographical coverage dataset at a spatial resolution of 0.5° × 0.5°. In this study, the average WSI of each region ( WSI r ) was calculated at a provincial level in China, weighted by the area of each province ( Area i ) according to Equation (2), and performed in ArcGis. Because, a national WSI would be less representative and provide little insight into local water-scarcity levels, especially for a large country with heterogeneous ecosystems like China, but a WSI with a high resolution will lead to difficulty, since the exact location is always difficult to identify. The province is the basic administrative unit in China, which is easily identified during the collection of water inventory. The results of WSI are shown in Figure 2.
WSI r = i = n i = 1 WSI i · Area i , r Area r
where WSI r is the WSI of province r, WSI i is the WSI of location i in province r, Area i . r is the area of location i in province r (m2), Area r is the area of province r (m2), and n is the number of locations in province i.
In this study, green-water consumption is not included because it does not contribute to local water scarcity, as it is only accessible through access to land occupation and does not directly influence the water flows needed by ecosystems and human beings [52].

2.3. Freshwater-Eutrophication Footprint
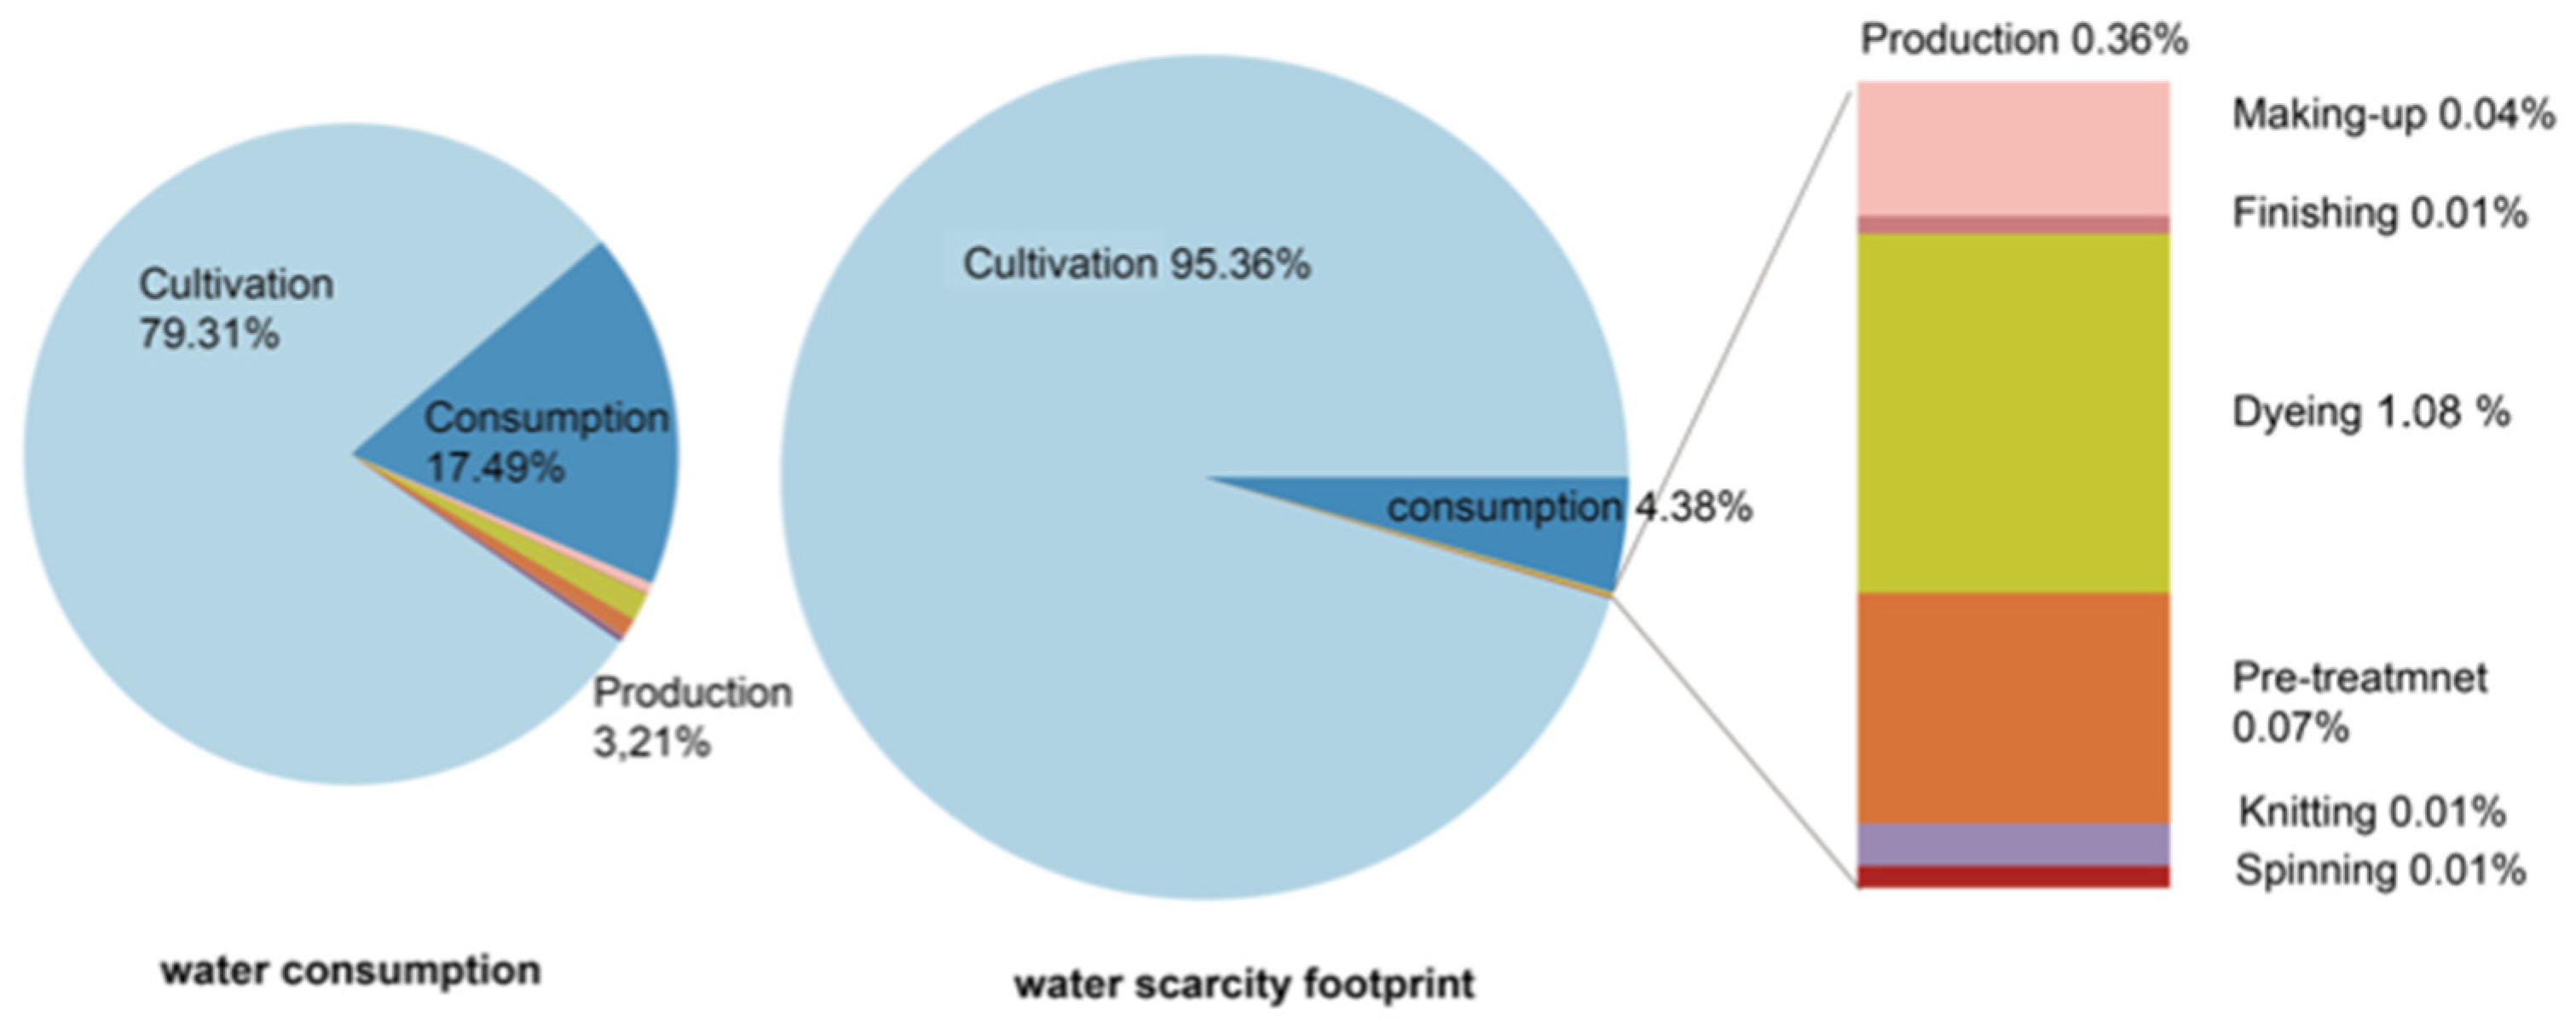
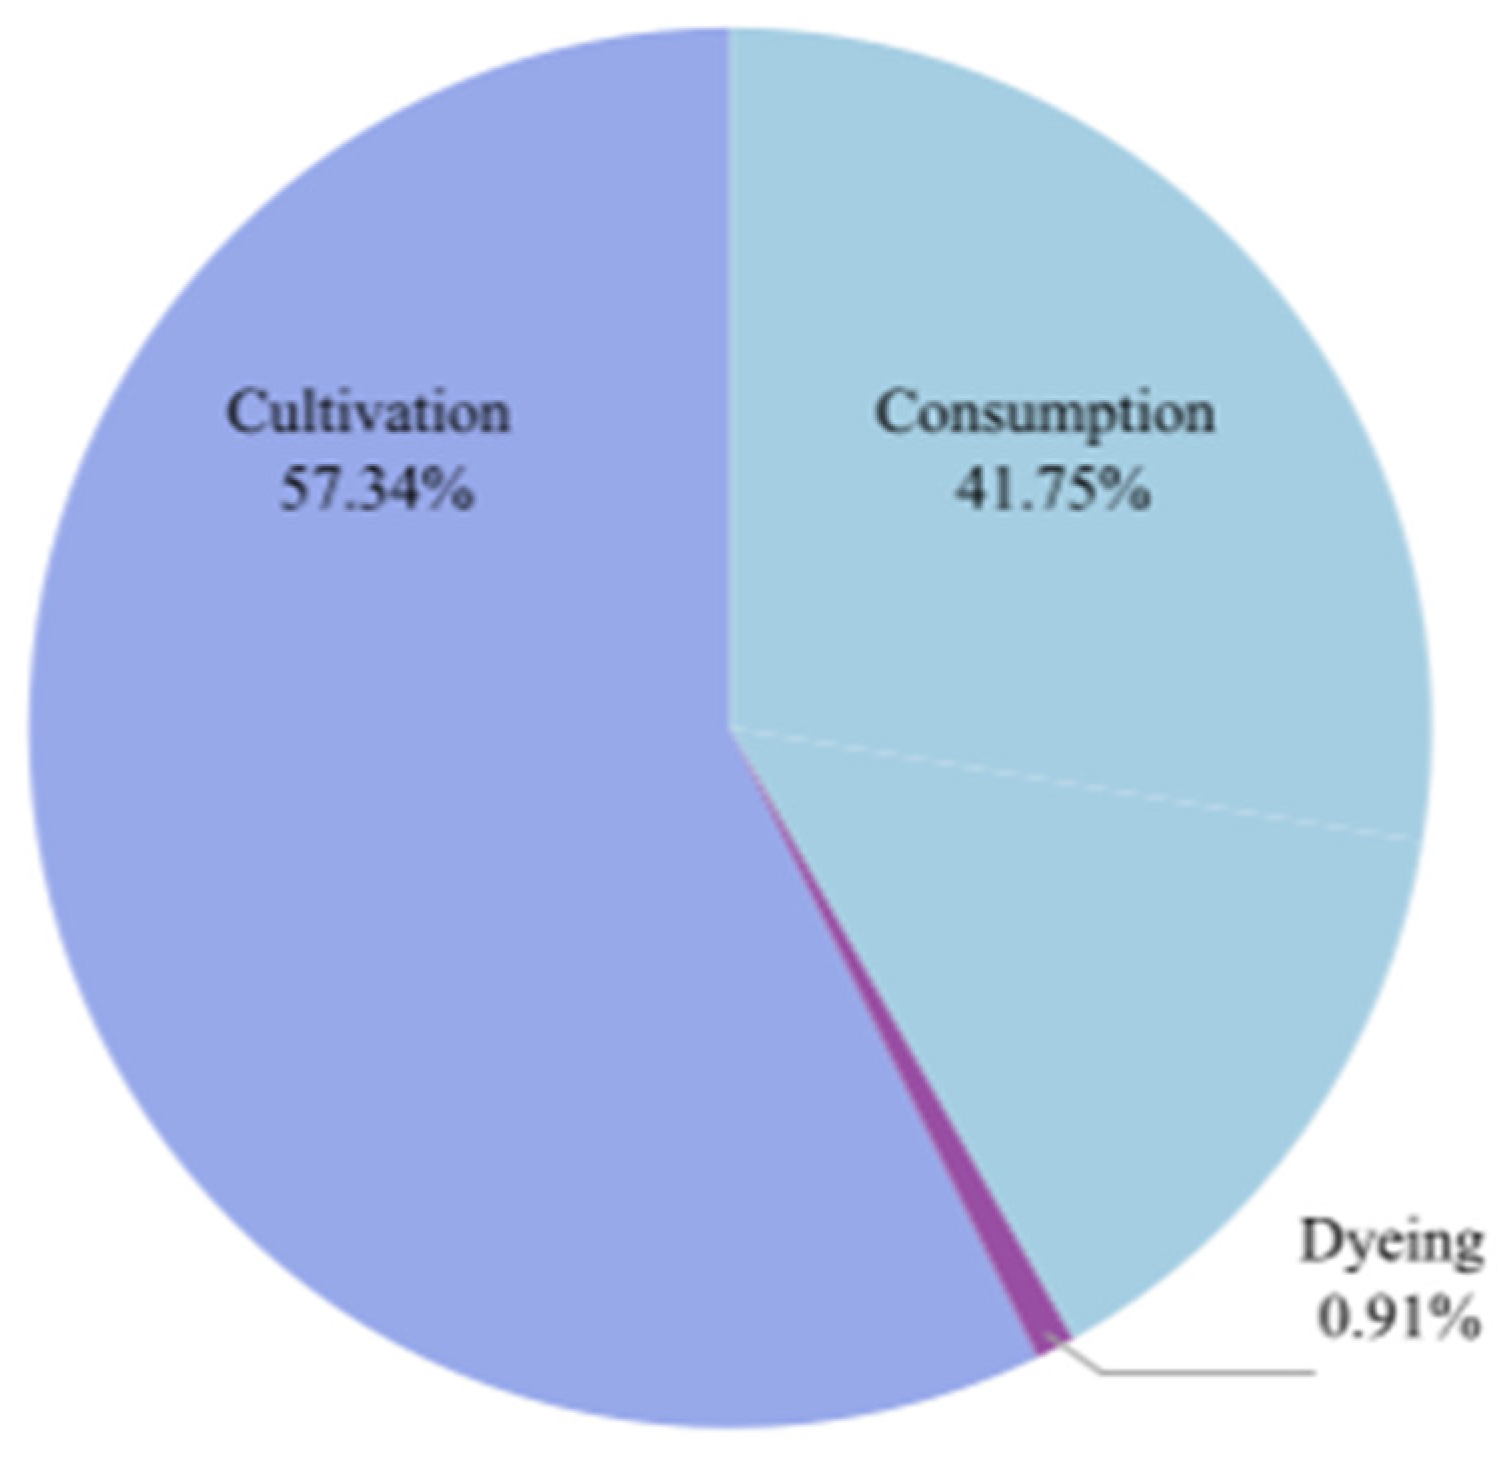
The freshwater-eutrophication footprint quantifies the water eutrophication potential caused by a piece of cotton T-shirt throughout its life cycle. It was assessed by applying the Impact World+ characterization model [36,53]. The freshwater-eutrophication footprint was denoted as WEF and assessed as follows:
WEF = M P -water · CF p
where WEF is water-eutrophication footprint (PDF·m2·yr), and Mp-water is the phosphorus emissions to water that potentially lead to water eutrophication (kg); CFp (characterization factor) relates the emissions of phosphorus with species diversity (PDF·m2·yr·kg−1 P) to address the eutrophication potential.
CF is defined by FF (fate fact, yr), which represents the P transported fraction from source to receptor and the persistence of P in the receptor [53], and by EF (effect factor, PDF·m2·kg−1 PO43− eq ), which reflects the potential decrease in relative species richness due to P in a freshwater system [54] and was calculated as Equation (4) In this study, the CF of each region (CFp) was calculated at the province-level and weighted by the population of each region, as Equation (5).
CF = FF × EF  
CF r = i = n i = 1 CF i , r × Pop i , r Pop r
where CF is the characterization factor of water eutrophication, EF is the fate factor (yr), EF is the effect factor (PDF·m2·kg−1 P), CFr is the CF of province r (PDF·m2·yr·kg−1 P), CFi,r is the CF of location i in province r (PDF·m2·yr·kg−1 P), Popr is the population of location i in province r, and another is the population of province r.

3. Results

Water Inventory Analysis

The consumption water of one cotton T-shirt is 1.35 t H2O. For each phase’s contribution, shown in Figure 3, the cotton cultivation phase made a substantial contribution to the overall water consumption (79.31%), which was mainly utilized for irrigation during the cotton-growing season. Data of detailed water consumption were shown in Table 1. Cotton in Xinjiang is entirely irrigated, which poses high stress to local groundwater and underground water [16]. Compared with other crops, cotton requires more water during its growth stage, 1.7 times that of soybean, 3.5 times that of corn, and 2.2 times that of wheat, according to the global averages [27] (see Table 2). This indicates that cotton is a water-intensive crop, although the irrigation water of cotton varies from different plant regions depending on the climate, land type, and farming practices. High irrigation demand occurs in regions where evaporation is high and the effective rainfall is low, as in Turkey, Pakistan, and Uzbekistan, all of which are global main cotton-production countries. This means that effective rainfall in this location will not meet the water demand for cotton growth and may result in low yields. However, the climate of USA, Brazil, and China will be more appropriate for cotton growth, with low water demands of 2249 t, 2621 t, and 2018 t H2O per tons of seed cotton, respectively; moreover, the proportions of green water account for 74.5%, 98.2%, and 62% of the total water demand, respectively, in these countries [1] (see Table 2). These reference data are the average of 1997–2001 and show an apparent difference between countries. However, the water demands of cotton are also largely different between China’s main cotton production region and the rate of green water varies from 2.3% to nearly 100% [55]. According to this study, the green-water rate in Xinjiang was very low at 6.97%, but the total water demand was 1.92~2.16 t H2O per tons of seed cotton grown in Xinjiang, depending on the loss rate during ginning, which is near the national average. Xinjiang is an arid or semi-arid area with high evapotranspiration (ETo) and low annual precipitation, making it the largest cotton-production region in China. The increase in cotton production and high-irrigation-water demand have derived flood irrigation and drip irrigation combinations for the majority of croplands in this region [56]. Regardless of the absolute difference in the water demand between different regions, high irrigation demand has been unwillingly seen in countries by governments, cooperatives, and farmers, indicating a high cost per unit of cotton production and water-resources-management input.
Except for the extreme difference in the cultivation phase, the water inventory of the three recycle scenarios is the same. Take eco T-shirt as an example, the dyeing process contributed 75.28% of the water volume of the textile manufacturing process and led to 0.02 kg of COD emission. Apparently, it is the main contributor of the water footprint in the textile production phase, of which the wastewater also contains high organic pollutants from the chemical inputs like dyes and softeners. In this study, it is assumed that the T-shirt was used in summer, washed once every 2 days, and used continuously for 3 months, so the T-shirt was washed 45 times throughout the whole life cycle and 0.24 t water was consumed per wash. The phosphorus and COD were emitted from the detergent.
Conventional, eco, and recycling T-shirt scenarios have been evaluated and compared in terms of their water-scarcity footprint and water eutrophication. The results distributed by the life cycle stages of the T-shirt and locations are shown in Figure 4. The water-scarcity footprint of conventional, eco, and recycling T-shirts was 2.45 t H2O eq, 1.74 t H2O eq, and 0.08 t H2O eq, respectively. The water-eutrophication footprint of conventional, eco, and recycling T-shirts was 1.18·10−2 PDF·m2·yr−1, 9.47·10−3 PDF·m2·yr−1, and 4.04·10−3 PDF·m2·yr−1, respectively (see Table 3).
Apparently, the cotton-cultivation process has the highest water-scarcity footprint (2.37 t H2O eq) and water-eutrophication footprint (7.76·10−3 PDF·m2·yr−1), and the water footprint from the textile production process and use stages are less significant, suggesting that the high water footprint in this phase was the biggest and also typical problem of nature textile products. The most dramatic decrease in water scarcity and water eutrophication was observed when switching from conventional to eco and recycling T-shirts (up to 29% and 97% for WSF and 20% and 66% for WEF, respectively), mostly because of the partial removal of the cultivation phase in the fiber production process. This suggests that the removal of the cultivation phase in this study was the most effective way to reduce the water footprint due to the overwhelming water footprint in this phase. For the textile production and use stage, the contribution of different recycling scenarios was the same. Apparently, the dyeing process is the main origin of the water footprint of the textile production phase (74.37%); the wastewater contains high organic pollutants from the chemical inputs, like dyes and softeners. The use phase was another water-intensive process due to the daily washing.
For the water-scarcity footprint, an apparent difference could be found in that the contribution of each phase to the overall water scarcity was changed when compared to the volumetric water footprint (See Figure 3). The overall water-scarcity footprint of an eco T-shirt is 1.74 t H2O eq (see Table 4). The water-scarcity footprint of the cotton cultivation, production, and consumption phases are 1.66 t H2O eq, 4.43·10−3 t H2O eq, and 7.64·10−2 t H2O eq, respectively, and occur in Xinjiang, Guangdong, and Zhejiang (see Figure 4), respectively. Regardless of the high water consumption in the cultivation phase, the high WSI in Xinjiang highlights the plant phase contribution to water resources impact, leading to an increase from 79.39% to 95.37%.
Lower water stress in Guangdong Province has benefited the manufacturing sector. The WSI of Guangdong province is 0.065, lower than 65% of provinces in China, as shown in Figure 2. The WSI values of the major textile-production industrial regions in China were 0.668 for Jiangsu, 0.194 for Zhejiang, and 0.948 for Hebei. It can be concluded that Guangdong province is an appropriate production location in terms of its sufficient water resource. As such, the potential T-shirt production phase contributions to water scarcity through water consumption are very small. The water-scarcity footprint of the use stage was 7.62·10−2 t H2O eq, accounting for 4.38% of the total WSF. Low water stress contributes to decreasing in the use stage from 13.11% to 4.38%.
The WSI in Xinjiang is 1.5 times that of the world average WSI, nearly 15 times that of Guangdong Province related to production and 4.8 times that of Zhejiang Province where the use stage is located. Although, the water usage occurring where WSI is high will pose more pressure on the water resource and lead to a high water-scarcity footprint for a product, which rarely appears in an eco-label or sustainability report of product for companies. On the contrary, manufacturers also could benefit from a high WSI, when water-saving strategies are conducted and effect successfully in this region. High WSI will also highlight the effect of water-saving action and present superiority when compared with the same water-saving measures occurring in other regions with low WSI.
The water-eutrophication footprint is 9.47·10−3 PDF·m2·yr for the entire life cycle of an eco T-shirt. The water-eutrophication footprints of cotton cultivation (occurring in Xinjiang), dyeing (occurring in Guangdong), and consumption (occurring in Zhejiang) are 5.43·10−3 PDF·m2·yr−1, 8.64·10−5 PDF·m2·yr−1, and 3.95·10−3 PDF·m2·yr−1 (see Figure 5). The cotton-cultivation phase contributes 57.34% of the water-eutrophication footprint (see Figure 6). Pollutant potentially leads to water eutrophication because the excessive nutrients emitted to lakes and rivers from phosphorus-containing fertilizer applied for cotton growth are rarely treated before leaving the soil system through runoff and leaching. The dyeing phase in production accounts for a minor proportion of 0.91% because the dyes and chemicals are put in this process and because a high content of organic mass emissions flows through the wastewater. If effluents are treated before their emission to lakes or rivers under government standards, a 93% water eutrophication-footprint reduction could be achieved in this mill. Another important water eutrophication hotspot was observed in the use phase. The consumer-use phase accounts for 41.75% of the water-eutrophication footprint, 14.10% for COD, and 27.64% for P emissions in water due to detergent input during washing. When looking into the CFs of the water-eutrophication footprint (see Table 5), high CFs were observed in Zhejiang province, followed by Xinjiang and Guangdong. Although being less important in the total water-eutrophication footprint, textile production benefited from the low CFs in Guangdong, suggesting that Guangdong was also suitable for production in terms of water eutrophication impact. When compared to the CF of China and globally, the three locations all have lower CFs of water eutrophication, making the environmental performance of the products much more competitive. As same as the interesting finding of WSI, companies are unwilling to use a high level of CFs in their supply chain, but they also can benefit from reducing the CFs of their present supply chain to show their efforts in cleaner production.
Overall, from the perspective of consumers, the consumption of a cotton T-shirt in Zhejiang province has a water footprint that occurs outside Zhejiang (95.62% for the water-scarcity footprint and 58.25% for the water-eutrophication footprint respectively). The strategy made by the manufacturer also influences the water resource far from its location. Those indicated that producers and consumers are strongly intervening in the water cycle of regions far from their local environment.

4. Discussion

To improve the sustainability of products and give transparent information about the product’s environmental performance, a spatial water footprint was required to make the impact on the location transparent. In this study, a spatial water-footprint method containing the water-scarcity footprint and water-eutrophication footprint was illustrated. The superiority of the spatial water footprint was demonstrated in the case study of the water-footprint reports of cotton T-shirts in three recycling scenarios.

4.1. Advantages of a Spatial Water-Footprint Method

One of the most important features of the spatial water footprint is that it provides a comprehensive and regionalized water-footprint result whose impact is distributed to each occurring location. It quantifies the degree of the intervention in the hydrosphere, caused by manufacture and consumption. In this study, the whole life cycle of a cotton T-shirt has impacts related to water in Xinjiang, Guangdong, and Zhejiang provinces and all impacts to those regions can be identified in the spatial water-footprint results (see Figure 4 and Figure 5). As such, it could provide a transparent, meaningful, and comprehensive basis for the eco labeling of products to make consumers more aware of the impacts of their purchasing decisions, and thereby consumers should take responsibility for the appropriation of the water resources that may be far from the consumers’ location. Those actions could drive the popularity of sustainable products and thereby reversely drive the manufacturing sector’s cleaner production. The local government should be informed as to which extent their water resource has been deprived by the production of products and how severe the production has put stress on water resources in terms of volume and quality. Therefore, a spatial water footprint also can serve as a significant and effective basis for policy-making for local water resource management.
Another significant advantage is that it enables the comparison between different stages of a product’s life cycle. The use of WSI and spatial CFs that distinguish the ecosystem heterogeneity, providing a normalization process for water footprint assessment, enables the comparison between life cycle stages occurring in different locations. A few companies, such as Nike [57], have adopted the life cycle concept to optimize their suppliers, which inevitably requires a comparison between the environmental performances of cotton textile products from different suppliers. Since they all have a global supply chain and the suppliers are distributed in many regions, the spatial water footprint enables an effective comparison of the environmental performance of the suppliers to optimize their global supply network. For example, in this study, the WSI values of the major textile production industrial regions in China were 0.668 for Jiangsu, 0.194 for Zhejiang, 0.0625 for Guangdong, and 0.948 for Hebei. As such, the supplier in Guangdong is a prior choice. Companies also can benefit from the use of a spatial water-footprint assessment, when showing their efforts in improving the sustainability of their products, especially occurring where the water resource is severely stressed.

4.2. Advantages of Recycling Scenarios

Recycling in fiber production has been found to contribute to a significant water-footprint reduction due to the removal of the cotton-cultivation phase. A piece of a recycling T-shirt (100% recycling) contributes a 96.71% reduction in the water-scarcity footprint and a 65.76% reduction in the water-eutrophication footprint compared with the conventional T-shirt. For the eco T-shirt, it can reduce 29.01% of the water-scarcity and 19.73% of the water-eutrophication footprint. Recycling in this phase could be viewed as highly effective.
To date, the main obstacle for the market for recycled cotton is the lower quality of the resultant products. The quality of recycling could be evaluated from the recycled fiber length, the spinnability of recycled cotton fibers, and the properties of the resultant yarns. It depends on the fabric structure, tightness, and previous finishing treatments. Most recycling from post-consumer textile waste will lead to lower quality because the fibers are reduced by wear and laundry, and also the dyed fabric will lead to a higher ratio of short fiber. In this study, the waste from recycling was from rag cuttings in the cutting process and lost fiber in the spinning process. In this way, the recycled fiber shows a higher quality than that recycled from post-consumer textile waste and avoids extra impacts from collecting, sorting, and transportation, as the collected waste textile is always from different communities. However, there is a concern that energy used for collecting the lost fiber in the spinning process and for cutting and shredding the rag cuttings may increase impacts in other impact categories. A study reported that the impact of the cutting/shredding in the recycling of 1 kg cotton yarn produced 0.214 kg CO2 eq for global warming potential (GWP), 0.00025 (kg SO2 eq ) for acidification potential (AP) and 0.00021 kg PO43− eq for eutrophication potential (EP) [21]. Compared with the overall impact caused by a piece of a cotton T-shirt, the cutting/shredding only contributes 0.76% for GWP, 0.1% for AP, and 0.24% for EP [11]. Therefore, there almost is no need to concern about the extra impact caused by the recycling process.

5. Conclusions

Cotton textile production and consumption, as introduced in this report, intervene in the water cycle in multiple regions throughout the value chain. In this study, a spatial water-footprint method, for the first time, covered water scarcity and water degradation, which could provide a comprehensive result. Under an absolutely spatial water-footprint assessment, the performance of sustainable strategies was compared, aiming to discover the most effective way to reduce the environmental burden related to water. The result shows that, when different processing stages of a garment product are distributed in different regions, the spatial water-footprint method can effectively calculate the water-footprint value of the garment product. It reveals that recycled cotton fibers should serve as a highly effective way to reduce environmental impact and as a substitute for virgin cotton fibers. Spatial water footprint also showed efficiency in eco-label, policy making, and company’s strategy. First, by making the relationship between the phase, regions, and impacts transparent, all the impacts caused by products to each location at the province-level could be identified in the water-footprint results. Secondly, it could make a meaningful comparison of the water-scarcity footprint and the water-degradation footprint between products, phases, and regions, as the water footprint is normalized according to the local stress and ecosystem features of each region. Therefore, a spatial water footprint could serve as a basis for company decisions to improve the sustainability of their products, optimize their suppliers, and report their product’s superiority. For consumers, they will be more aware of their purchase choice and take initiatives to reduce environmental burden. One priority for further study should be developing spatial CFs for water toxicity as many artificial chemicals have been input and emitted to wastewater, which will result in damage to the local ecosystem and residents. As the same as CFs of water eutrophication, the CFs of water toxicity also have regionalized features. An uncomprehensive category has the potential to leave out some environmental burdens and thus mislead consumers and manufacturers.

Author Contributions

Conceptualization, formal analysis, methodology, writing—original draft, S.C.; writing—data curation, F.C.; writing—review and editing, L.Z.; writing—review and editing, Q.L.; writing—review and editing, X.W.; writing—review and editing, L.W. All authors have read and agreed to the published version of the manuscript.

Funding

The authors are grateful to the General Project of Humanities and Social Sciences Research of the Ministry of Education of China (21YJCZH160), Soft Science Research Project of Zhejiang Provincial Innovation Center of Advanced Textile Technology (ZX2022002R), Science Foundation of Zhejiang Sci-Tech University (ZSTU) under Grant (22202009-Y), Soft Science Research Project of Zhejiang Province (2022C25030), and Ouhai District Science and Technology Plan (G20210201) for providing funding supports to this research.

Institutional Review Board Statement

Not applicable.

Informed Consent Statement

Not applicable.

Data Availability Statement

Not applicable.

Acknowledgments

The authors acknowledges anonymous reviewers for their feedback, which certainly improved the clarity and quality of this paper.

Conflicts of Interest

The authors declare no conflict of interest.

References

  1. Chapagain, A.; Hoekstra, A.Y.; Savenije, H.H.G.; Gautam, R. The water footprint of cotton consumption. In Value of Water Research Report Series No. 18; Unesco-IHE Institute for Water Education: Delft, The Netherlands, 2005. [Google Scholar]
  2. Chapagain, A.K.; Hoekstra, A.Y.; Savenije, H.H.G.; Gautam, R. The water footprint of cotton consumption: An assessment of the impact of worldwide consumption of cotton products on the water resources in the cotton producing countries. Ecol. Econ. 2006, 60, 186–203. [Google Scholar] [CrossRef]
  3. FAO (FAOSTAT). FAOSTAT Database. 2014. Available online: http://www.fao.org/faostat/en/#data/RF (accessed on 1 November 2022).
  4. NBSC (National Bureau of Statistics of China). China Industry Statistics Yearbook; Chinese Statistics Press: Beijing, China, 2017. (In Chinese) [Google Scholar]
  5. Ghazinoory, S. Cleaner production in Iran: Necessities and priorities. J. Clean. Prod. 2005, 13, 755–762. [Google Scholar] [CrossRef]
  6. National Bureau of Statistics of China. Available online: https://data.stats.gov.cn/easyquery.htm?cn=E0103&zb=A0D0Q&reg=650000&sj=2021 (accessed on 1 November 2022).
  7. Liu, Y.; Huang, H.; Zhu, L.; Zhang, C.; Ren, F.; Liu, Z. Could the recycled yarns substitute for the virgin cotton yarns: A comparative LCA. Int. J. Life Cycle Assess. 2020, 25, 2050–2062. [Google Scholar] [CrossRef]
  8. Laudes Foundation. Life Cycle Assessment of Cotton Cultivation Systems—Better Cotton, Conventional Cotton, and Organic Cotton. 2018. Available online: https://www.laudesfoundation.org/en/resources/4332environmentallcareportjune19.pdf (accessed on 1 November 2022).
  9. Roos, S.; Peters, G.M. Three methods for strategic product toxicity assessment—The case of the cotton T-shirt. Int. J. Life Cycle Assess. 2015, 20, 903–912. [Google Scholar]
  10. Levi Strauss & CO, 2015. The Life Cycle of a Jeans. Available online: https://www.levistrauss.com/wp-content/uploads/2015/03/Full-LCA-Results-Deck-FINAL.pdf (accessed on 1 November 2022).
  11. Zhang, Y.; Liu, X.; Xiao, R. Life cycle assessment of cotton T-shirts in China. Int. J. Life Cycle Assess. 2015, 20, 994–1004. [Google Scholar] [CrossRef]
  12. Keeble, J.J.; Topiol, S.; Berkeley, S. Using indicators to measure sustainability performance at a corporate and project level. J. Bus. Ethics 2003, 44, 149–158. [Google Scholar] [CrossRef]
  13. Alkaya, E.; Demirer, G.N. Sectoral assessment of the Turkish textile industry for the diffusion of sustainable production approach. J. Text. Inst. 2014, 106, 1212–1225. [Google Scholar] [CrossRef]
  14. Rajkishore, N.; Tarun, P.; Long, T.N. Sustainability in fashion and textiles: A survey from developing country. In Sustainable Technologies for Fashion and Textiles; Rajkishore, N., Ed.; Woodhead Publishing: Sawston, UK, 2020; pp. 3–30. [Google Scholar]
  15. Shen, B.; Zheng, J.H.; Chow, P.S.; Chow, K.Y. Perception of fashion sustainability in online community. J. Text. Inst. 2014, 105, 971–979. [Google Scholar] [CrossRef]
  16. Bevilacqua, M.; Ciarapica, F.E.; Mazzuto, G.; Paciarotti, C. Environmental analysis of a cotton yarn supply chain. J. Clean. Prod. 2014, 82, 154–165. [Google Scholar] [CrossRef]
  17. Xie, K.; Cheng, F.; Zhao, W.; Xu, L. Micelle dyeing with low liquor ratio for reactive dyes using dialkyl maleic acid ester surfactants. J. Clean. Prod. 2011, 19, 332–336. [Google Scholar] [CrossRef]
  18. Kan, C.W.; Cheung, H.F.; Chan, Q. A study of plasma-induced ozone treatment on the colour fading of dyed cotton. J. Clean. Prod. 2016, 112, 3514–3524. [Google Scholar] [CrossRef]
  19. Hussain, T.; Wahab, A. A critical review of the current water conservation practices in textile wet processing. J. Clean. Prod. 2018, 198, 806–819. [Google Scholar] [CrossRef]
  20. Sandin, G.; Peters, G.M. Environmental impact of textile reuse and recycling—A review. J. Clean. Prod. 2018, 184, 353–365. [Google Scholar] [CrossRef]
  21. Esteve-Turrillas, F.A.; de la Guardia, M. Environmental impact of Recover cotton in textile industry. Resour. Conserv. Recyc. 2017, 116, 107–115. [Google Scholar] [CrossRef]
  22. Farrant, L.; Olsen, S.I.; Wangel, A. Environmental benefits from reusing clothes. Int. J. Life Cycle Assess. 2010, 15, 726–736. [Google Scholar] [CrossRef]
  23. Ütebay, B.; Çelik, P.; Çay, A. Effects of cotton textile waste properties on recycled fibre quality. J. Clean. Prod. 2019, 222, 29–35. [Google Scholar] [CrossRef]
  24. Chapagain, A.K.; Hoekstra, A.Y. The water footprint of coffee and tea consumption in The Netherlands. Ecol. Econ. 2007, 64, 109–118. [Google Scholar] [CrossRef]
  25. Gerbens-Leenes, W.; Hoekstra, A.Y.; van der Meer, T.H. The water footprint of bioenergy. Proc. Natl. Acad. Sci. USA 2009, 106, 10219–10223. [Google Scholar] [CrossRef] [Green Version]
  26. Hoekstra, A.Y.; Chapagain, A.K.; Aldaya, M.M.; Mekonnen, M.M. The Water Footprint Assessment Manual: Setting the Global Standard; Earthscan: London, UK, 2011; Available online: https://waterfootprint.org/en/resources/publications/water-footprint-assessment-manual/ (accessed on 1 November 2022).
  27. Mekonnen, M.M.; Hoekstra, A.Y. The green, blue and grey water footprint of crops and derived crop products. Hydrol. Earth Syst. Sci. 2011, 15, 1577–1600. Available online: http://hdl.handle.net/10535/7177 (accessed on 1 November 2022). [CrossRef] [Green Version]
  28. Mekonnen, M.M.; Hoekstra, A.Y. A global assessment of the water footprint of farm animal products. Ecosystems 2012, 15, 401–415. [Google Scholar] [CrossRef] [Green Version]
  29. Pfister, S.; Koehler, A.; Hellweg, S. Assessing the environmental impacts of freshwater consumption in LCA. Environ. Sci. Technol. 2009, 43, 4098–4104. [Google Scholar] [CrossRef] [PubMed]
  30. Ridoutt, B.G.; Pfister, S. A revised approach to water footprinting to make transparent the impacts of consumption and production on global freshwater scarcity. Glob. Environ. Chang. 2010, 20, 113–120. [Google Scholar] [CrossRef]
  31. Boulay, A.M.; Bare, J.; De Camillis, C.; Döll, P.; Gassert, F.; Gerten, D.; Humbert, S.; Inaba, A.; Itsubo, N.; Lemoine, Y.; et al. Consensus building on the development of a stress-based indicator for LCA-based impact assessment of water consumption: Outcome of the expert workshops. Int. J. Life Cycle Assess. 2015, 20, 577–583. [Google Scholar] [CrossRef]
  32. ISO 14046:2014; Environmental Management—Water Footprint—Principles, Requirements and Guidelines. International Standard Organization: Geneva, Switzerland, 2014. Available online: https://www.iso.org/standard/43263.html (accessed on 1 November 2022).
  33. Mutel, C.; Liao, X.; Patouillard, L.; Bare, J.; Fantke, P.; Frischknecht, R.; Hauschild, M.; Jolliet, O.; Maia de Souza, D.; Laurent, A.; et al. Overview and recommendations for regionalized life cycle impact assessment. J. Life Cycle Assess. 2018, 24, 856–865. [Google Scholar] [CrossRef] [PubMed] [Green Version]
  34. Roy, P.O.; Azevedo, L.B.; Margni, M.; van Zelm, R.; Deschênes, L.; Huijbregts, M.A. Characterization factors for terrestrial acidification at the global scale: A systematic analysis of spatial variability and uncertainty. Sci. Total Environ. 2014, 500, 270–276. [Google Scholar] [CrossRef]
  35. Azevedo, L.B.; Henderson, A.D.; van Zelm, R.; Jolliet, O.; Huijbregts, M.A. Assessing the Importance of Spatial Variability versus Model Choices in Life Cycle Impact Assessment: The Case of Freshwater Eutrophication in Europe. Environ. Sci. Technol. 2013, 47, 3565–13570. [Google Scholar] [CrossRef]
  36. Bulle, C.; Margni, M.; Patouillard, L.; Boulay, A.M.; Bourgault, G.; De Bruille, V.; Cao, V.; Hauschild, M.; Henderson, A.; Humbert, S.; et al. IMPACT World+: A globally regionalized life cycle impact assessment method. Int. J. Life Cycle Assess. 2019, 24, 1653–1674. [Google Scholar] [CrossRef] [Green Version]
  37. Verones, F.; Hellweg, S.; Azevedo, L.; Chaudhary, A.; Cosme, N.; Fantke, P.; Goedkoop, M.; Hauschild, M.; Laurent, A.; Mutel, C.; et al. LC-IMPACT Version 0.5—A Spatially Differentiated Life Cycle Impact Assessment Approach. 2016. Available online: http://www.lc-impact.eu (accessed on 1 November 2022).
  38. Buxmann, K.; Koehler, A.; Thylmann, D. Water scarcity footprint of primary aluminium. Int. J. Life Cycle Assess. 2016, 21, 1605–1615. [Google Scholar] [CrossRef] [Green Version]
  39. Caldeira, C.; Quinteiro, P.; Castanheira, E.; Boulay, A.M.; Dias, A.C.; Arroja, L.; Freire, F. Water footprint profile of crop-based vegetable oils and waste cooking oil: Comparing two water scarcity footprint methods. J. Clean. Prod. 2018, 195, 1190–1202. [Google Scholar] [CrossRef]
  40. Hess, T.M.; Lennard, A.T.; Daccache, A. Comparing local and global water scarcity information in determining the water scarcity footprint of potato cultivation in Great Britain. J. Clean. Prod. 2015, 87, 666–674. [Google Scholar] [CrossRef]
  41. Ridoutt, B.; Hodges, D. From ISO14046 to water footprint labeling: A case study of indicators applied to milk production in south-eastern Australia. Sci. Total Environ. 2017, 599–600, 14–19. [Google Scholar] [CrossRef] [PubMed]
  42. Borsato, E.; Giubilato, E.; Zabeo, A.; Lamastra, L.; Criscione, P.; Tarolli, P.; Marinello, F.; Pizzol, L. Comparison of Water-focused Life Cycle Assessment and Water Footprint Assessment: The case of an Italian wine. Sci. Total Environ. 2019, 666, 1220–1231. [Google Scholar] [CrossRef] [PubMed]
  43. Zonderland-Thomassen, M.A.; Lieffering, M.; Ledgard, S.F. Water footprint of beef cattle and sheep produced in New Zealand: Water scarcity and eutrophication impacts. J. Clean. Prod. 2014, 73, 253–262. [Google Scholar] [CrossRef]
  44. Baydar, G.; Ciliz, N.; Mammdadov, A. Life cycle assessment of cotton textile products in Turkey. Resour. Conserv. Recyc. 2015, 104, 213–223. [Google Scholar] [CrossRef]
  45. CmiA, 2014, Life Cycle Assessment (LCA) of Cotton Made in Africa (CimA). PE International AG, Afriva. Available online: https://cottonmadeinafrica.org/wp-content/uploads/2020/03/Life-Cycle-Assessment-CmiA-2014.pdf (accessed on 1 November 2022).
  46. Cotton Inc. (Cotton Incorporated). The life Cycle Inventory & Life Cycle Assessment of Cotton Fibrt & Fabric. Cotton Foundation, America. 2016. Available online: https://cottoncultivated.cottoninc.com/wp-content/uploads/2017/01/2016-LCA-Executive-Summary.pdf (accessed on 1 November 2022).
  47. Textile Exchange. The Life Cycle Assessment (LCA) of Organic Cotton Fiber. Textile Exchange, America. 2014. Available online: https://store.textileexchange.org/wp-content/uploads/woocommerce_uploads/2019/04/LCA_of_Organic_Cotton-Fiber-Full_Report.pdf (accessed on 1 November 2022).
  48. Xuan, J.W.; Zheng, J.H.; Liu, Z.H. Calculation and analysis on water footprint of main crops in Xinjiang. Agric. Res. Arid Areas 2014, 32, 196–201. [Google Scholar]
  49. SBXUAR (Statistic Bureau of Xinjiang Uygur Autonomous Region). Xinjiang Statistics Yearbook; Chinese Statistics Press: Beijing, China, 2012. (In Chinese) [Google Scholar]
  50. CMEP (Chinese Ministry of Environmental Protection). Dataset for the First China Pollution Source Census; Chinese Environmental Science Press: Beijing, China, 2011. (In Chinese) [Google Scholar]
  51. Huang, J.; Xu, C.C.; Ridoutt, B.G.; Wang, X.C.; Ren, P.A. Nitrogen and phosphorus losses and eutrophication potential associated with fertilizer application to cropland in China. J. Clean. Prod. J. 2017, 159, 171–179. [Google Scholar] [CrossRef]
  52. Scherer, L.; Pfister, S. Global biodiversity loss by freshwater consumption and eutrophication from Swiss food consumption. Environ. Sci. Technol. 2016, 50, 7019–7028. [Google Scholar] [CrossRef]
  53. Helmes, R.J.K.; Huijbregts, M.A.J.; Henderson, A.D.; Jolliet, O. Spatially explicit fate factors of phosphorous emissions to freshwater at the global scale. Int. J. Life Cycle Assess. 2012, 17, 646–654. [Google Scholar] [CrossRef] [Green Version]
  54. Tirado-Seco, P. Development of Damage Functions for Aquatic Eutrophication in Life Cycle Assessment; Université de Genève: Geneva, Switzerland, 2005. [Google Scholar]
  55. Luo, L.P.; Liu, X.J. Regional differences on typical crop water requirement and water footprint in China from a production perspective. Water Sav. Irrig. 2020, 1, 88–94. [Google Scholar]
  56. Günther, J.; Thevs, N.; Gusovius, H.J.; Sigmund, I.; Brückner, T.; Beckmann, V.; Abdusalik, N. Carbon and phosphorus footprint of the cotton production in Xinjiang, China, in comparison to an alternative fibre (Apocynum) from Central Asia. J. Clean. Prod. 2017, 148, 490–497. [Google Scholar] [CrossRef]
  57. Nike, 2018. FY 2018 Impact Report. Available online: https://s3-us-west-2.amazonaws.com/purpose-cms-production01/wp-content/uploads/2019/05/16054840/FY18-Nike-Impact-Report_Final2.pdf (accessed on 1 November 2022).
Figure 1. System boundary of the life cycle of a cotton T-shirt.
Sustainability 15 00817 g001
Figure 2. WSI in China at a provincial level.
Sustainability 15 00817 g002
Figure 3. Water consumption and water-scarcity footprint of a piece of eco T-shirt (180 g).
Sustainability 15 00817 g003
Figure 4. Water-scarcity footprint of cotton cultivation, production, and consumption phases for three kinds of cotton T-shirts.
Sustainability 15 00817 g004
Figure 5. Water-eutrophication footprint of cotton cultivation, production, and consumption phases for three kinds of cotton T-shirts.
Sustainability 15 00817 g005
Figure 6. Water-eutrophication footprint of one piece of eco cotton T-shirt.
Sustainability 15 00817 g006
Table 1. Water inventory of one piece of eco T-shirt.
PhaseLocationPhaseWater Consumption
(t H2O)
Total Phosphorus
(kg)
COD
(kg)
Fiber productionXinjiangCultivation1.070.25 × 10−2
Ginning1.19 × 10−3
T-shirt ProductionGuangdongSpinning1.71 × 10−3
Knitting2.20 × 10−3
Pre-papering1.21 × 10−3
Dyeing1.88 × 10−2 0.25 × 10⁻¹
Finishing9.30 × 10−4
Making-up7.02 × 10−3
ConsumptionZhejiangUse (45washes)0.241.1 × 10−30.78 × 10⁻¹
Function unit: 1 piece of eco T-shirt (180 g)
Table 2. Comparison of water demand for crops in the cultivation phase.
CropAreaBlue Water (t)Green Water (t)Total (t)Source
Seed cottonGlobal130622823588Mekonnen and Hoekstra et al., 2011 [28]
soybeanGlobal7020302107
cornGlobal819471028
Seed cottonBrazil4625752621Chapagain et al., 2006 [1]
China76012582018
Pakistan386010544914
Turkey28122883100
USA57616732249
Uzbekistan4377834460
Functional unit: 1 ton of crop
Table 3. Comparison of three recycling scenarios.
TypeRecycling T-Shirt
(100% Recycling)
Eco T-Shirt
(30% Recycling)
Conventional T-Shirt
(No Recycling)
Water scarcity
(t H2O eq)
8.07 × 10−21.742.45
Water eutrophication
(PDF·m2·yr)
4.04 × 10−39.47 × 10−31.18 × 10⁻²
Table 4. Result of water-scarcity and water-eutrophication footprints for one piece of eco T-shirt.
PhaseLocationPhaseWater Consumption
(t H2O)
Water Scarcity Footprint
(t H2O)
Water-Eutrophication Footprint
(PDF·m2·yr−1)
Fiber productionXinjiangCultivation1.071.665.43 × 10−3
Ginning1.19 × 10−31.85 × 10⁻³
T-shirt ProductionGuangdongSpinning1.71 × 10−31.78 × 10⁻⁴
Knitting2.20 × 10−32.29 × 10⁻⁴
Pre-papering1.21 × 10−31.25 × 10⁻³
Dyeing1.88 × 10−21.95 × 10−38.64 × 10−5
Finishing9.30 × 10−49.65 × 10⁻⁵
Making-up7.02 × 10−37.29 × 10⁻⁴
ConsumptionZhejiangUse (45 washes)0.247.63 × 10−23.95 × 10⁻³
Function unit: 1 piece of eco T-shirt (180 g)
Table 5. WSI and CFs for water eutrophication.
LocationWSIWater Eutrophication CF for CODWater Eutrophication CF for P
Xinjiang0.93180.015472.1523
Guangdong0.06250.00350.4853
Zhejiang0.19420.01722.3917
China *0.480.02313.2179
Global *0.6020.079711.0869
* Source: WSI is from Pfister et al., 2009; Water eutrophication CF is from Bulle et al., 2019.
Disclaimer/Publisher’s Note: The statements, opinions and data contained in all publications are solely those of the individual author(s) and contributor(s) and not of MDPI and/or the editor(s). MDPI and/or the editor(s) disclaim responsibility for any injury to people or property resulting from any ideas, methods, instructions or products referred to in the content.

