Article

Numerical Study on Influence of Wall Thermal Effect on Thermal Impact of Gas Explosion

School of Resource, Environment and Safety Engineering, Hunan University of Science and Technology, Xiangtan 411201, China
*
Author to whom correspondence should be addressed.
Sustainability 2023, 15(10), 7792; https://doi.org/10.3390/su15107792
Submission received: 23 March 2023 / Revised: 21 April 2023 / Accepted: 5 May 2023 / Published: 10 May 2023
(This article belongs to the Special Issue Mining Risk and Safety Management)

Abstract

:
A gas explosion can impact the roadway and cause serious damage. The thermal effect of the roadway wall is an important factor affecting the gas explosion and its impact. In view of the shortcomings of existing research studies, a basic numerical model of a pipe is established under the thermal impact effect of a gas explosion based on LS-DYNA software. The thermal conductivity coefficients of the pipe wall are set as 15, 30, 45 and 60 W/(m·K), respectively. Five measuring points A–E are set on the inner wall of the pipe, and four measuring points F-I are set in the air region. The equivalent stress distribution of the pipe wall, the pressure and displacement of each measuring point and the time history curve of shock wave velocity at the measuring point in the air region are numerically simulated under the impact of a gas explosion with different thermal effects. The research results show that the stress concentration phenomenon is more obvious and the equivalent stress distribution is more uneven, and the gas explosion intensity is greater when the pipe wall is approximately adiabatic. With an increase in the thermal conductivity coefficient, the amount of thermal dissipation through the pipe wall increases, the pressure peak value of each measuring point of the pipe wall decreases as a whole, and the radial displacement value of the arranged measuring points presents a smaller trend. With an increase in the thermal conductivity coefficient of the pipe wall, the thermal dissipation of the pipe wall increases, so the subsequent energy that drives the shock wave decreases, the impact degree on the pipe wall also decreases, and at the same time, in the pipe with a high thermal conductivity coefficient, the gas explosion energy involved in expansion work is lower, and thus the explosion intensity reduces. The shock wave velocity at a location farther away from the explosion source after a gas explosion also decreases. The research results have important practical significance for improving the theory of the wall thermal effect and the level of gas explosion prevention in confined spaces.

1. Introduction

The thermal release from a gas explosion in a pipe can be divided into four parts: (1) thermal dissipation through the pipe wall formed by thermal convection and radiation; (2) thermal transference to the unburned gas ahead through thermal conduction, diffusion and radiation; (3) explosion wave energy and kinetic energy formed by expansion work; and (4) loss energy during transmission [1,2]. Since the wall thermal loss is an important factor affecting a gas explosion and its impact, many scholars have studied the influence of the wall thermal effect on gas explosions and obtained corresponding research results [3,4]. In 1815, David first invented the gas lamp. The metal mesh of the lamp acts as a flame arrester, and the air can freely pass through the mesh screen to maintain combustion. However, these metal mesh holes can prevent the flame from spreading through the mesh screen. Once the gas explosion occurs inside the lamp, the metal mesh can quickly consume the energy generated by the gas explosion, resulting in the explosion extinguishment inside the lamp. In China, in 2004, Professor Lin Baiquan et al. first experimentally tested the influence of the wall thermal effect on the propagation characteristics of gas explosions from the perspective of the energy change characteristics of the explosion wave [2]. The research results lay a foundation for the study of the thermal effect of a pipe wall. Jiang Bingyou installed insulating materials on the inner wall of the experimental steel pipe to replace the semi-insulating pipe [5]. The research found that the better the thermal conductivity of the pipe, the lower the flame velocity and explosion overpressure. Yan et al. numerically analyzed the influence of different wall materials on the gas combustion characteristics and found that reducing the wall thermal conductivity can significantly increase the temperature of the reaction zone [6]. Lee et al. investigated the effects of inner wall materials and the wall thickness on the flame stability of the micro-combustor [7]. The results showed that a combustor with lower thermal conductivity has a higher internal temperature. Norton and Vlachos numerically simulated the thermal conductivity effects of wall materials and external thermal loss [8]. The results showed that wall thermal conductivity is very important. Wang et al. found that the vessel wall causes thermal loss and reduces the maximum explosion pressure [9]. In addition, increasing the turbulence degree of combustible gas in the container can weaken the wall thermal effect and reduce the thermal loss through the container wall [10,11]. Wan et al. numerically simulated the effect of wall thermal conductivity on combustion efficiency. Their research results showed that the influence of thermal conductivity on the thermal recirculation effect is important [12]. Jiang et al. found that a porous wall can enhance the flame stability of a miniature combustor due to the reduction in the thermal loss amount and the preheating effect of a fresh mixture [13]. Zhang Bo et al. carried out a gas explosion experiment with a spherical container and found that a larger wall contact area causes more wall thermal loss and reduces the gas explosion intensity [14]. Campbell numerically studied a thermal explosion in a spherical reactor and found that the wall thermal loss can change the thermal transmission rate of the reaction region to the external environment [15]. It is well known that thermal conduction in the solid wall plays a vital role in the combustion performance of micro-combustors [16]; therefore, Jia et al. numerically investigated the different equivalence ratios and inlet velocities of premixed gas in a new porous medium burner with two sections and double decks [17]. The influence of the wall thermal effect on a gas explosion and its propagation was theoretically analyzed from the point of view of the thermal transmission and reaction process in the literature [1]. The experimental results verified the significant influence of wall thermal loss on gas explosion intensity. In fact, the places where gas explosion accidents often occur have poor thermal conductivity (such as the wall of an underground roadway), so the thermal loss of the wall is lower.
Generally, scholars test and study gas explosions in the roadway by using the experiment pipe system, and the experiment pipe is often a steel pipe with a high pressure value and large wall thickness [18]. The good thermal conductivity of steel pipes and the higher thermal capacity (due to the larger wall thickness) will make the wall thermal loss more obvious [19,20]. So there is a certain difference between the experimental results of gas explosions in the laboratory and the actual situation. At the same time, it is difficult to obtain quantitatively the effect of the wall thermal effect on gas explosion intensity and reproduce its influence process in an experimental study. Therefore, this paper numerically simulates the influence of the wall thermal effect on a gas explosion and its thermal impact during a gas explosion. The research results have important practical significance for improving the theory of the wall thermal effect and enhancing the level of gas explosion prevention in confined spaces.

2. Numerical Simulation

2.1. Basic Control Equations

The main algorithm of the ANSYS/LS-DYNA program is the Lagrangian description increment method [21]; that is, the particle coordinate at the initial time is taken as X i   ( i = 1 , 2 , 3 ) , and at any time t, the particle coordinate is x i   ( i = 1 , 2 , 3 ) .
x i = x i ( X i , t ) i j = 1 , 2 , 3
When t = 0, the initial condition is as follows:
x i ( x j , 0 ) = X i
x ˙ ( x j , 0 ) = V i ( x j , 0 )
where, V i is initial velocity.
(1)
Momentum equation
σ i j , j + ρ f i = ρ x ¨ i
where, σ i j is Cauchy, f i is volume force per unit mass, and x ¨ i is accelerated velocity.
(2)
Mass conservation equation
ρ V = ρ 0
where, ρ is current mass density, ρ 0 is initial mass density, V   =   | F i j | is relative volume, and F i j   =   x i x j is a deformation gradient.
(3)
Energy equation
E ˙ = V S i j ε ˙ i j ( p + q ) V ˙
where, V is current configuration volume, ε ˙ i j is a strain rate tensor, and   q is bulk viscous resistance. The representation of deviatoric stress S i j and pressure p is as follows:
S i j = σ i j + ( p + q ) σ i j
p = 1 3 σ k k q

2.2. Physical Model

There are two simulation approaches: the gas-filling method and the TNT equivalent method [22]. According to the previous research results and analysis of this paper based on two methods, the TNT equivalent method is adopted to simulate a gas explosion in the pipe with different thermal conductivities. For pipe materials, the nonlinear plastic material model *MAT-ELASTIC-PLASTIC-THERMAL model is selected this time, which can define the temperature-dependent material coefficient. Some material parameters can be found in the literature [22,23].
According to the axial symmetry of the established pipe model, the gas explosion model in a 1/2 pipe is established for analysis and research. The non-node method of fluid and solid is adopted to establish the mode [24]. The pipe is set with a length of 5 m, a radius of 0.5 m and a wall thickness of 0.2 m. The filling length of TNT equivalent gas–air mixture in the pipe is 2.5 m. The cell mesh size is set to 2 mm this time. In order to analyze the transient thermal stress change and wall response of the pipe under the action of a gas explosion, some reasonable assumptions are made on the pipe model as follows: (1) Only a thermal source of a gas explosion exists in the pipe. (2) The pipe thickness is evenly distributed and stable along the circumference and axial direction. (3) The pipe material is an isotropic and uniform elastic body, and the influence of other factors on the stress of the pipe is ignored. (4) The initial temperature is assumed to be room temperature, and initial pressure is assumed to be one standard atmospheric pressure. (5) There is no thermal flow input on the inner wall of the pipe. (6) The detailed process of the chemical reaction is ignored. (7) The model is closed at one end and open at the other end without reflecting boundary conditions.
The established model and the meshed model are shown in Figure 1.
In order to simulate the gas explosion in the pipe under different thermal conduction conditions, several groups of representative measuring points are selected this time, namely, five measuring points (A, B, C, D, E) on the inner wall of the pipe and four measuring points (F, G, H, I) in the air region inside the pipe. The measuring points are arranged from the closed end of the pipe to the open end of the pipe, and the layout of the measuring points is as shown in Figure 2.

3. Analysis and Discussion of Simulation Results

After a gas explosion occurs, the heat generated by the gas explosion is transferred by means of thermal conduction, thermal convection and thermal radiation. After the pipe wall is subjected to thermal load, the thermal stress field inside the pipe changes. Based on the model in Figure 1, in this paper, a study on numerical simulation is carried out by changing the thermal conductivity coefficients of the pipe wall. As we know, the thermal conductivity increases with an increase in temperature, but below 600 °C, the thermal conductivity coefficients of various types of steels is essentially in the range of 15–60 W/(m·K). Therefore, the thermal conductivity coefficients of the pipe wall surface set this time are respectively 15, 30, 45 and 60 W/(m·K). The gas concentration is 9.5%.

3.1. Equivalent Stress Distribution of Pipe under Thermal Impact Effect of Gas Explosion

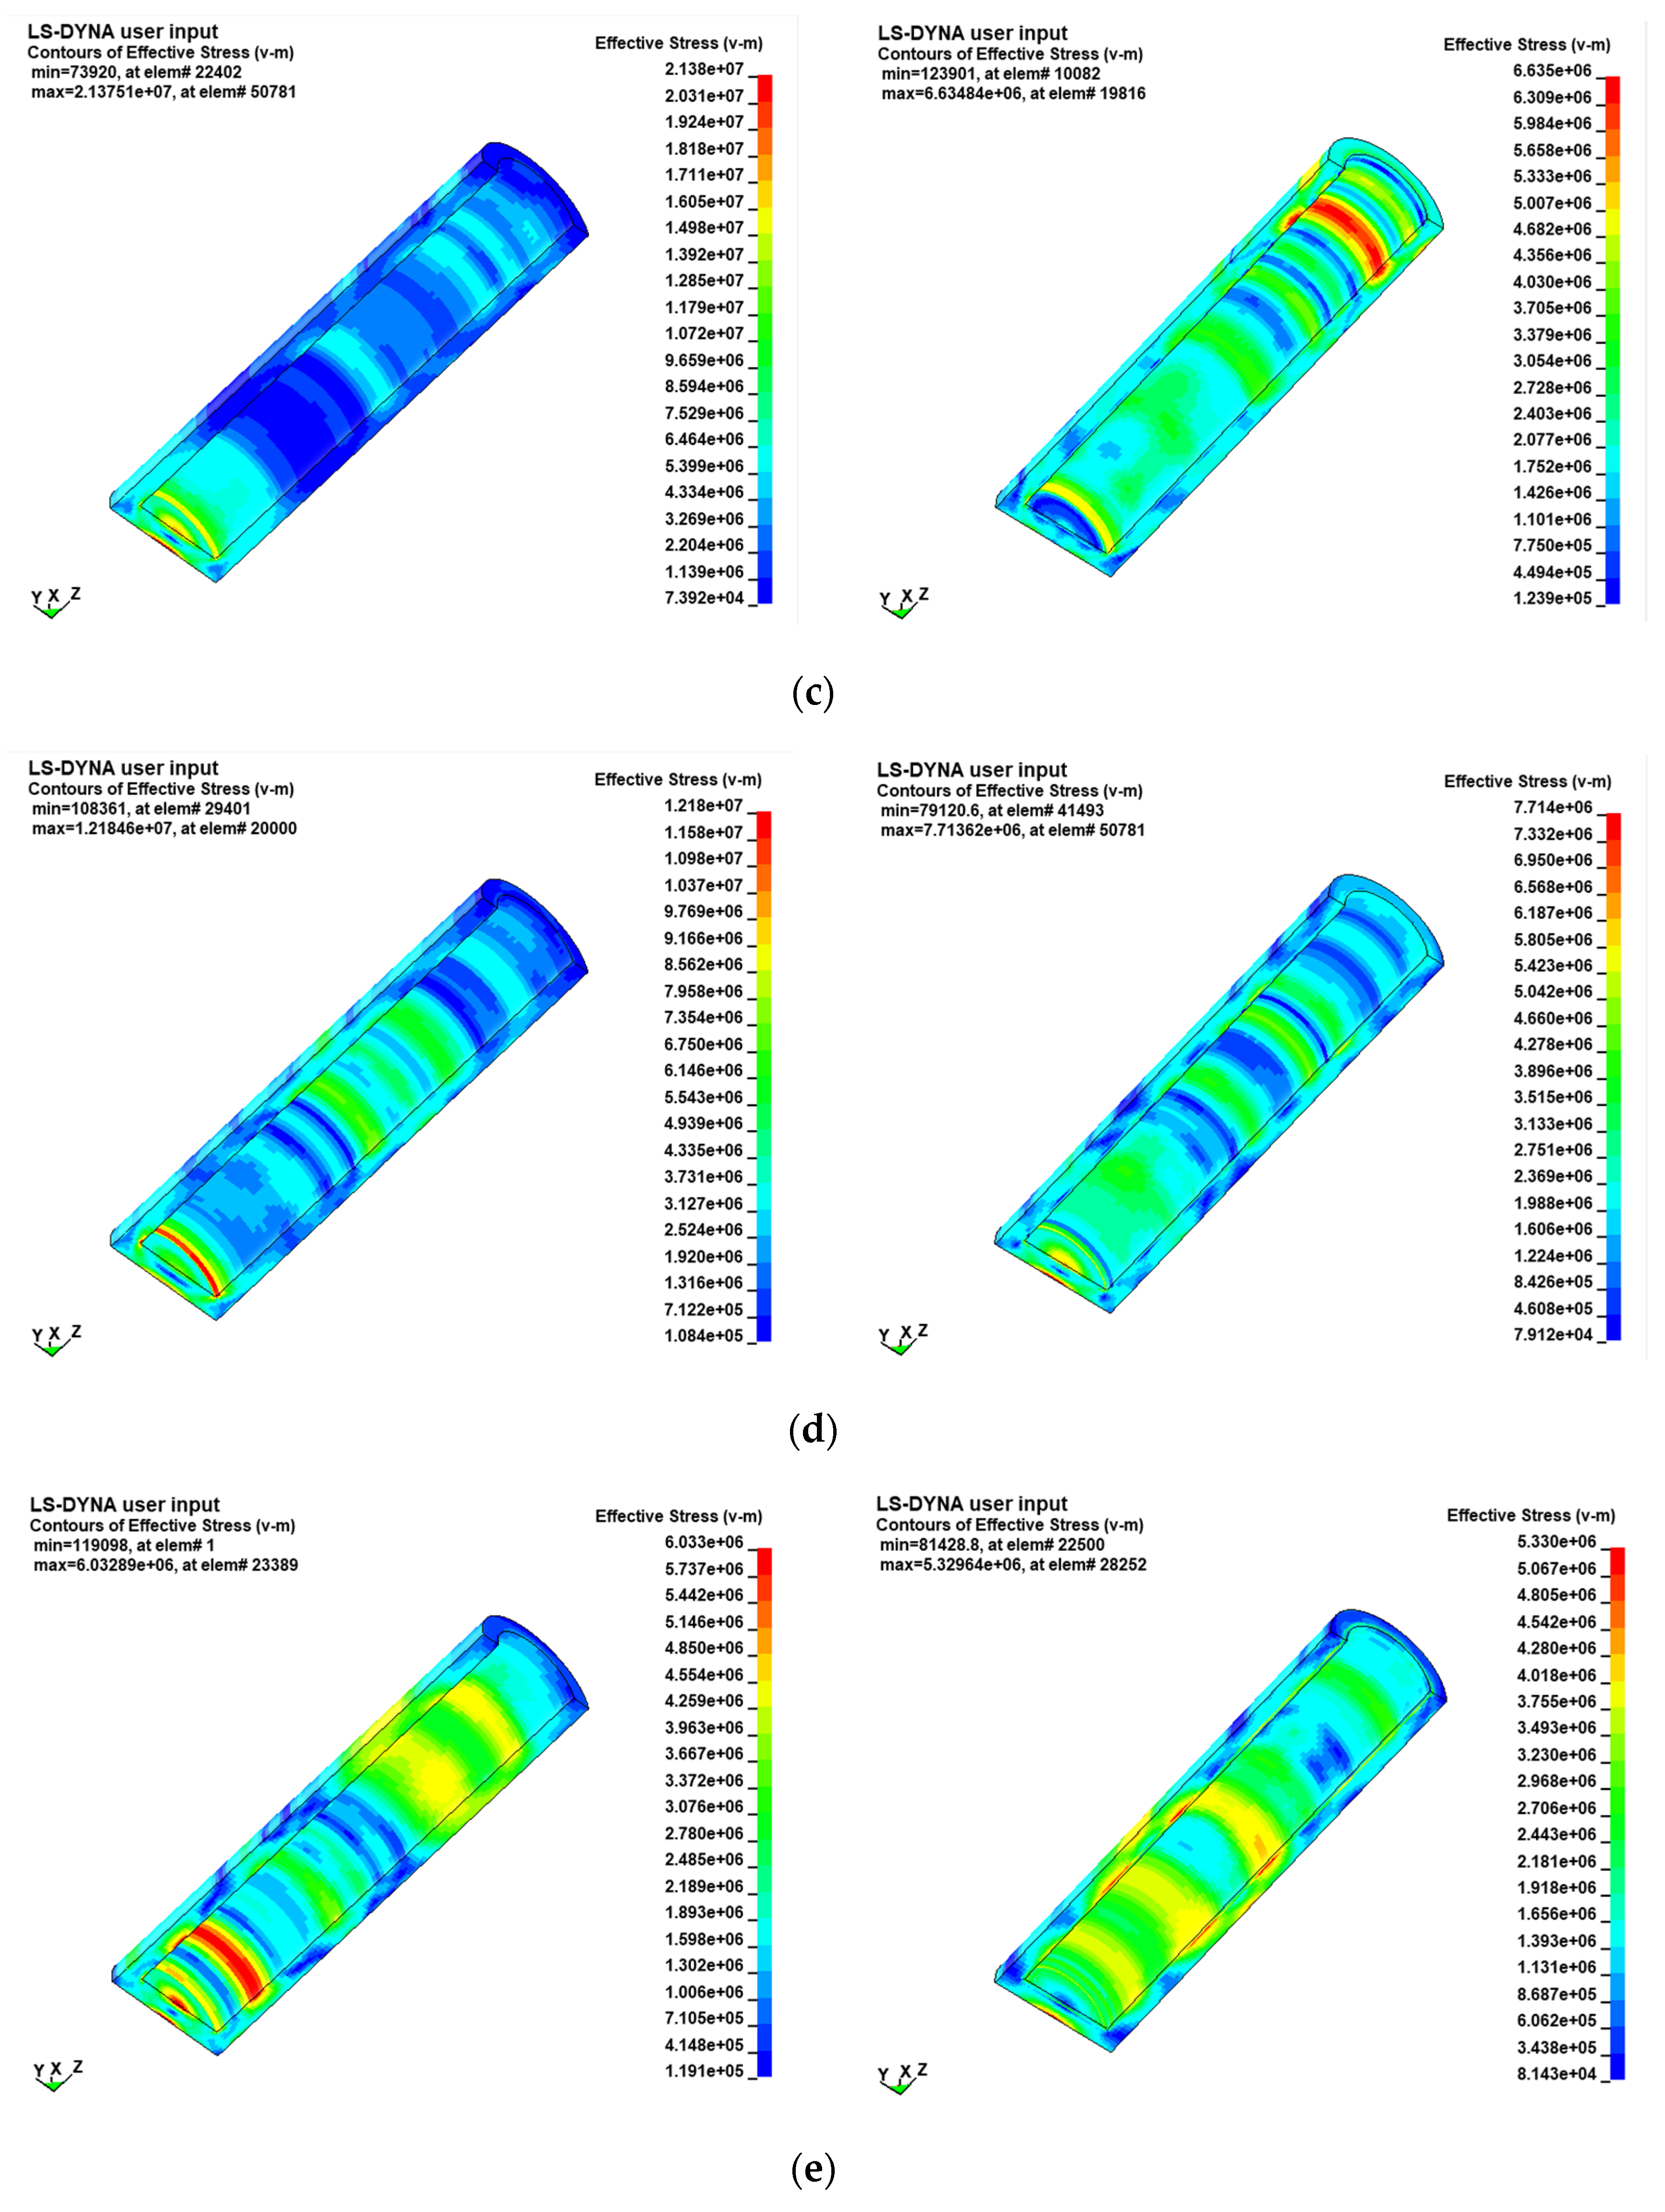
By setting the thermal conductivity coefficients of the pipe wall as zero to achieve a pipe model with approximate thermal insulation of the pipe wall, and setting the thermal conductivity coefficients of the pipe wall as 45 W/(m·K), the numerical simulation obtains an equivalent stress distribution nephogram of the pipe wall after the gas explosion in the pipe, as shown in Figure 3. To facilitate the analysis, the left figure shows approximate thermal insulation, and the right figure shows a pipe with thermal conductivity coefficients of 45 W/(m·K).
As can be seen from Figure 3, due to the gas accumulation at the closed end of the pipe, the explosion immediately impacts the region near the explosion source after the gas is ignited, and the interaction between the explosion products and the pipe occurs. The pipe undergoes deformation after being subjected to impact loads, but the elastic-plastic properties of the pipe (metal material properties) cause an interaction in the internal structures of the pipe to prevent the deformation of the pipe, resulting in yield rebound and equivalent stress generation. At 0.001 s, since the gas explosion has not yet spread to the vicinity of the open end of the pipe, the equivalent stress peaks under both conditions appear in the vicinity of the explosion source. At this time, the difference between the two stress peaks is small. From the equivalent stress nephogram at the time of 0.01 s to 0.05 s, it can be seen that due to the concentration of explosion energy at the junction of the closed end of the pipe, the junction is simultaneously subjected to loads in the Z and XY directions, so the peak value of the equivalent stress of the pipe generally occurs on the wall surface of the closed end of the pipe. At the same time, under the approximately insulated condition of the pipe wall, the peak stress of the pipe is greater than the peak value under the condition with the thermal conductivity coefficients of 45 W/(m·K). It can also be seen that when the pipe wall is under approximately adiabatic conditions, the phenomenon of stress concentration is more obvious, and the equivalent stress distribution is relatively uneven. This phenomenon occurs on both the outer and inner walls of the pipe. For the equivalent stress distribution of the pipe with a thermal conductivity coefficient of 45 W/(m·K), although the peak value of the equivalent stress is small, the equivalent stress distribution of the pipe under the impact load of the gas explosion is more uniform. The reason for the different response phenomena on the pipe wall under the two conditions is that at the initial stage of the gas explosion, shock wave loads and thermal impact effects generated by the reaction are first loaded onto the inner wall of the pipe. Due to the short time, the pipe wall surface under both conditions cannot dissipate the thermal impact load in a timely manner, resulting in a relative consistent equivalent stress distribution and stress peak at 0.001 s. Subsequently, the pipe wall with a thermal conductivity coefficient of 45 W/(m·K) begins to dissipate heat radially along the pipe through thermal conduction, convection and radiation. A portion of the energy generated by the gas explosion is dissipated through the pipe wall, resulting in energy consumption and conversion. When the pipe wall is approximately insulated, the thermal impact effect generated by the gas explosion is difficult to dissipate through the thermal dissipation of the pipe wall but continues to participate in the expansion and work of the explosion products, resulting in greater explosion intensity. The pipe wall is more severely impacted, and the reflection and propagation of shock waves in the pipe are more complex, subsequently resulting in relatively uneven stress concentration and distribution. The above simulation results show that an approximately adiabatic pipe is more intensively impacted by gas explosions, and the damage degree of the pipe is also serious. The same conclusion can also be found in the experimental results [1,2].

3.2. Wall Response of Measuring Points under Different Thermal Conductivity Coefficients

3.2.1. Pressure and Analysis on Pipe Wall at Measuring Points

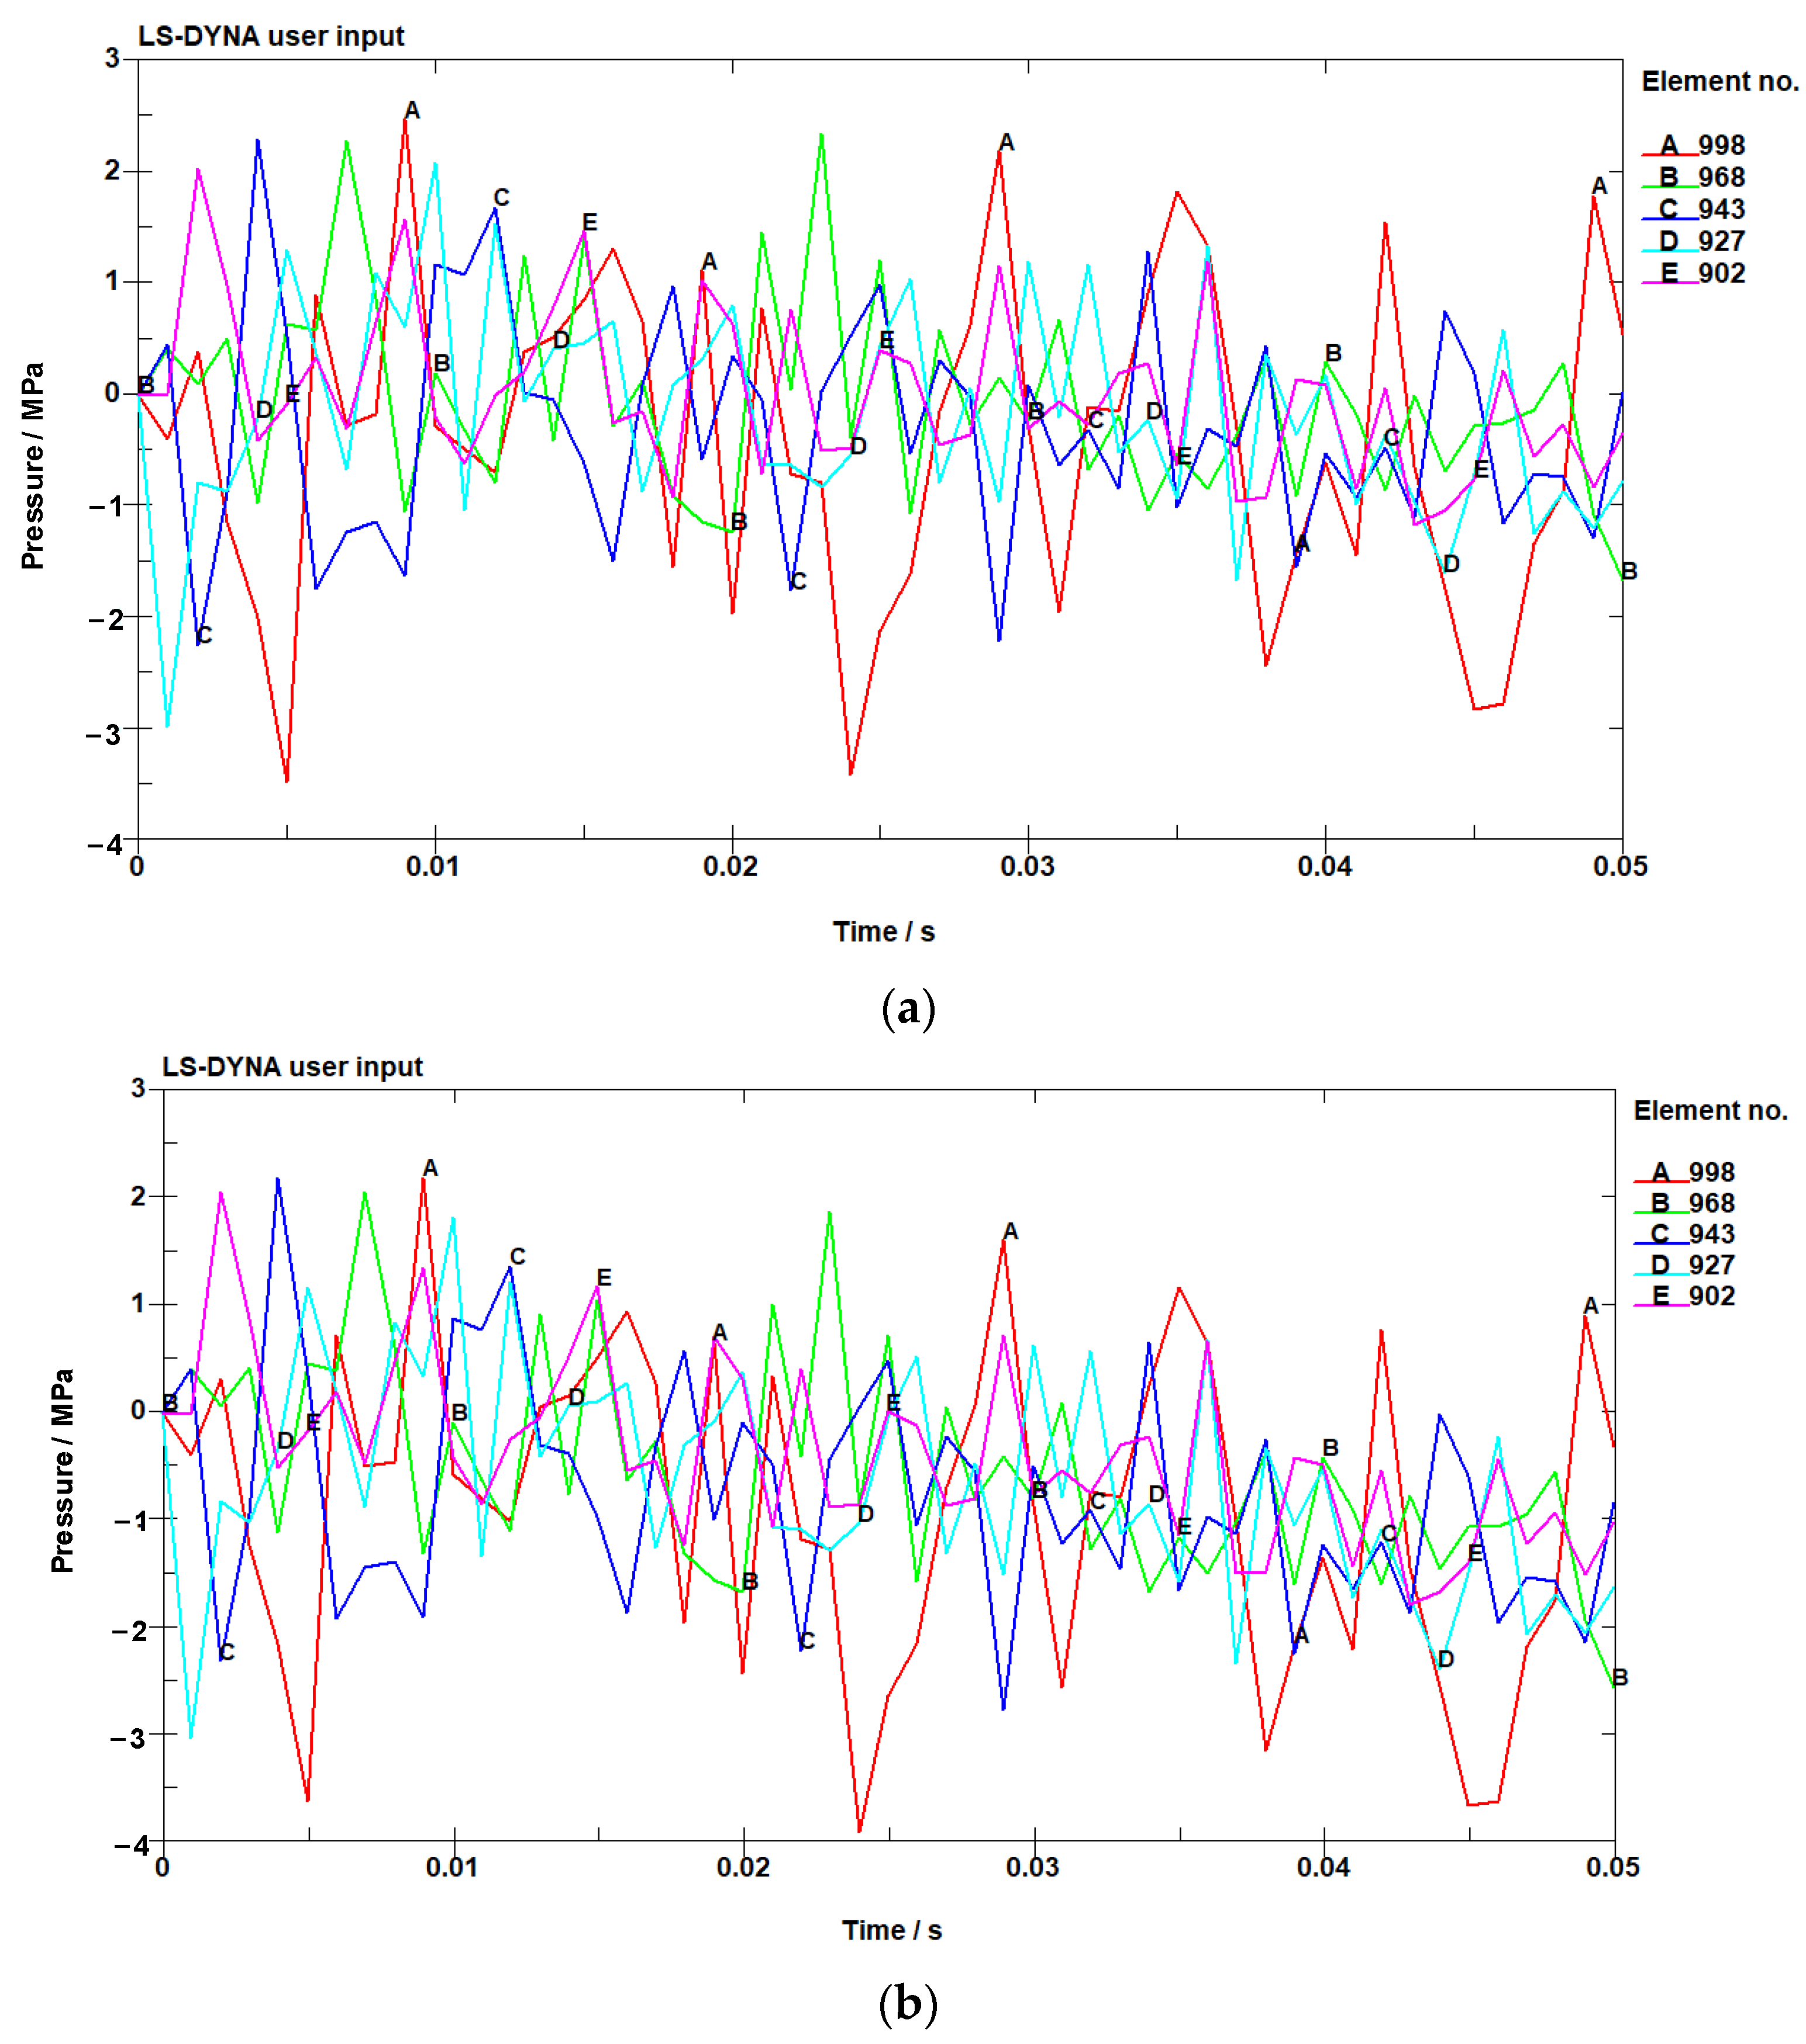
According to the layout of the measuring points in Figure 2, five measuring points A–E are set on the inner wall of the pipe, and four measuring points F-I are set in the air region. Both groups of measuring points are arranged along the direction from the closed end to the open end of the pipe. Figure 4 shows the pressure response curve of the pipe wall under different thermal conductivity coefficients within 0.05 s of the gas explosion process.
As can be clearly seen from Figure 4, due to the irregular reflection of the shock wave on the pipe wall, the pressure curve at the measuring point on the pipe wall is not a relatively smooth curve but an oscillation curve. As the reaction continues, the overall change in pressure at each measuring point essentially presents a trend of first increasing and then decreasing. In the conditions of four thermal conductivity coefficients, the variation trend of the pressure curve at the measuring points on the pipe wall surface is approximately the same. The closer the measuring point is to the location of the explosion source, the higher the pressure peak value is, and the pressure peak values of the measuring points along the pipe opening direction decrease in order. As can be seen from Figure 4, when the thermal conductivity coefficient is 15 W/(m·K), after a gas explosion occurs in the pipe, the pressure curve at the pipe measuring point has the largest variation amplitude. With an increase in the thermal conductivity coefficient, the variation amplitude of the pressure curve at the measuring point decreases. When the thermal conductivity coefficient is 60 W/(m·K), the pressure curve at the measuring point changes the most slowly. From Figure 4, the pressure peaks at various measuring points on the wall surface with different thermal conductivity coefficients are shown in Table 1. As can be seen from Table 1, with the increase in thermal conductivity coefficients, the pressure peaks at each measuring point on the pipe wall decrease overall. When the thermal conductivity coefficient is 60 W/(m·K), the peak pressure at the measuring point on the pipe wall is the smallest compared to other conditions. The pipe pressure reflects the severity of the gas explosion impact on the pipe wall. The obtained pressure data are consistent with the experimental results obtained in the literature [1,2].
After a gas explosion, due to the irregular reflection of the shock wave in the pipe, the thermal impact load generated by the gas explosion is first applied to the wall surface, and a large amount of heat needs a certain amount of time to be dissipated through the pipe and the air. Due to the different thermal conductivity coefficients of the pipe wall, the thermal dissipation capacities of the pipe wall are also different. Five measuring points on the pipe wall are selected to analyze the last four pressure peaks within 0.05 s after the gas explosion. It is found that with the propagation of the shock wave, due to the thermal conversion and continuous energy loss, the pressure values at the measuring points show a general attenuation trend. As can be seen from Table 1, the pressures at the measuring point on the pipe wall decrease with the increase in thermal conductivity coefficients. When the thermal conductivity coefficient is 60 W/(m·K), the pressure at the measuring point is the lowest. The reason for this situation is that the energy in the process of a gas explosion comes from the chemical reaction of gas combustion, and the gas with a high temperature and high pressure dissipates the energy generated by the gas explosion through thermal conduction, thermal convection and thermal radiation by contacting the pipe wall in the propagation process. As the thermal conductivity of the pipe increases, the degree of thermal dissipation on the pipe wall becomes stronger, and the amount of thermal dissipation through the pipe wall increases, resulting in a decrease in the energy that subsequently drives the shock wave and a decrease in the degree of impact on the pipe wall.
The inner wall of the pipe is first subjected to thermal impact load, and the heat is transferred radially along the pipe wall to the entire pipe. As the temperature increases, the material properties of the pipe also change accordingly, and the elastic modulus and strength limit of the pipe material all show a downward trend [25]. Therefore, the pipe is more susceptible to damage under high temperature. For pipes with higher thermal conductivity, their wall surface’s thermal dissipation is faster, which results in a relatively low temperature after a gas explosion and thus a lower impact of the explosion.

3.2.2. Displacement and Analysis of Measuring Points on Pipe Wall

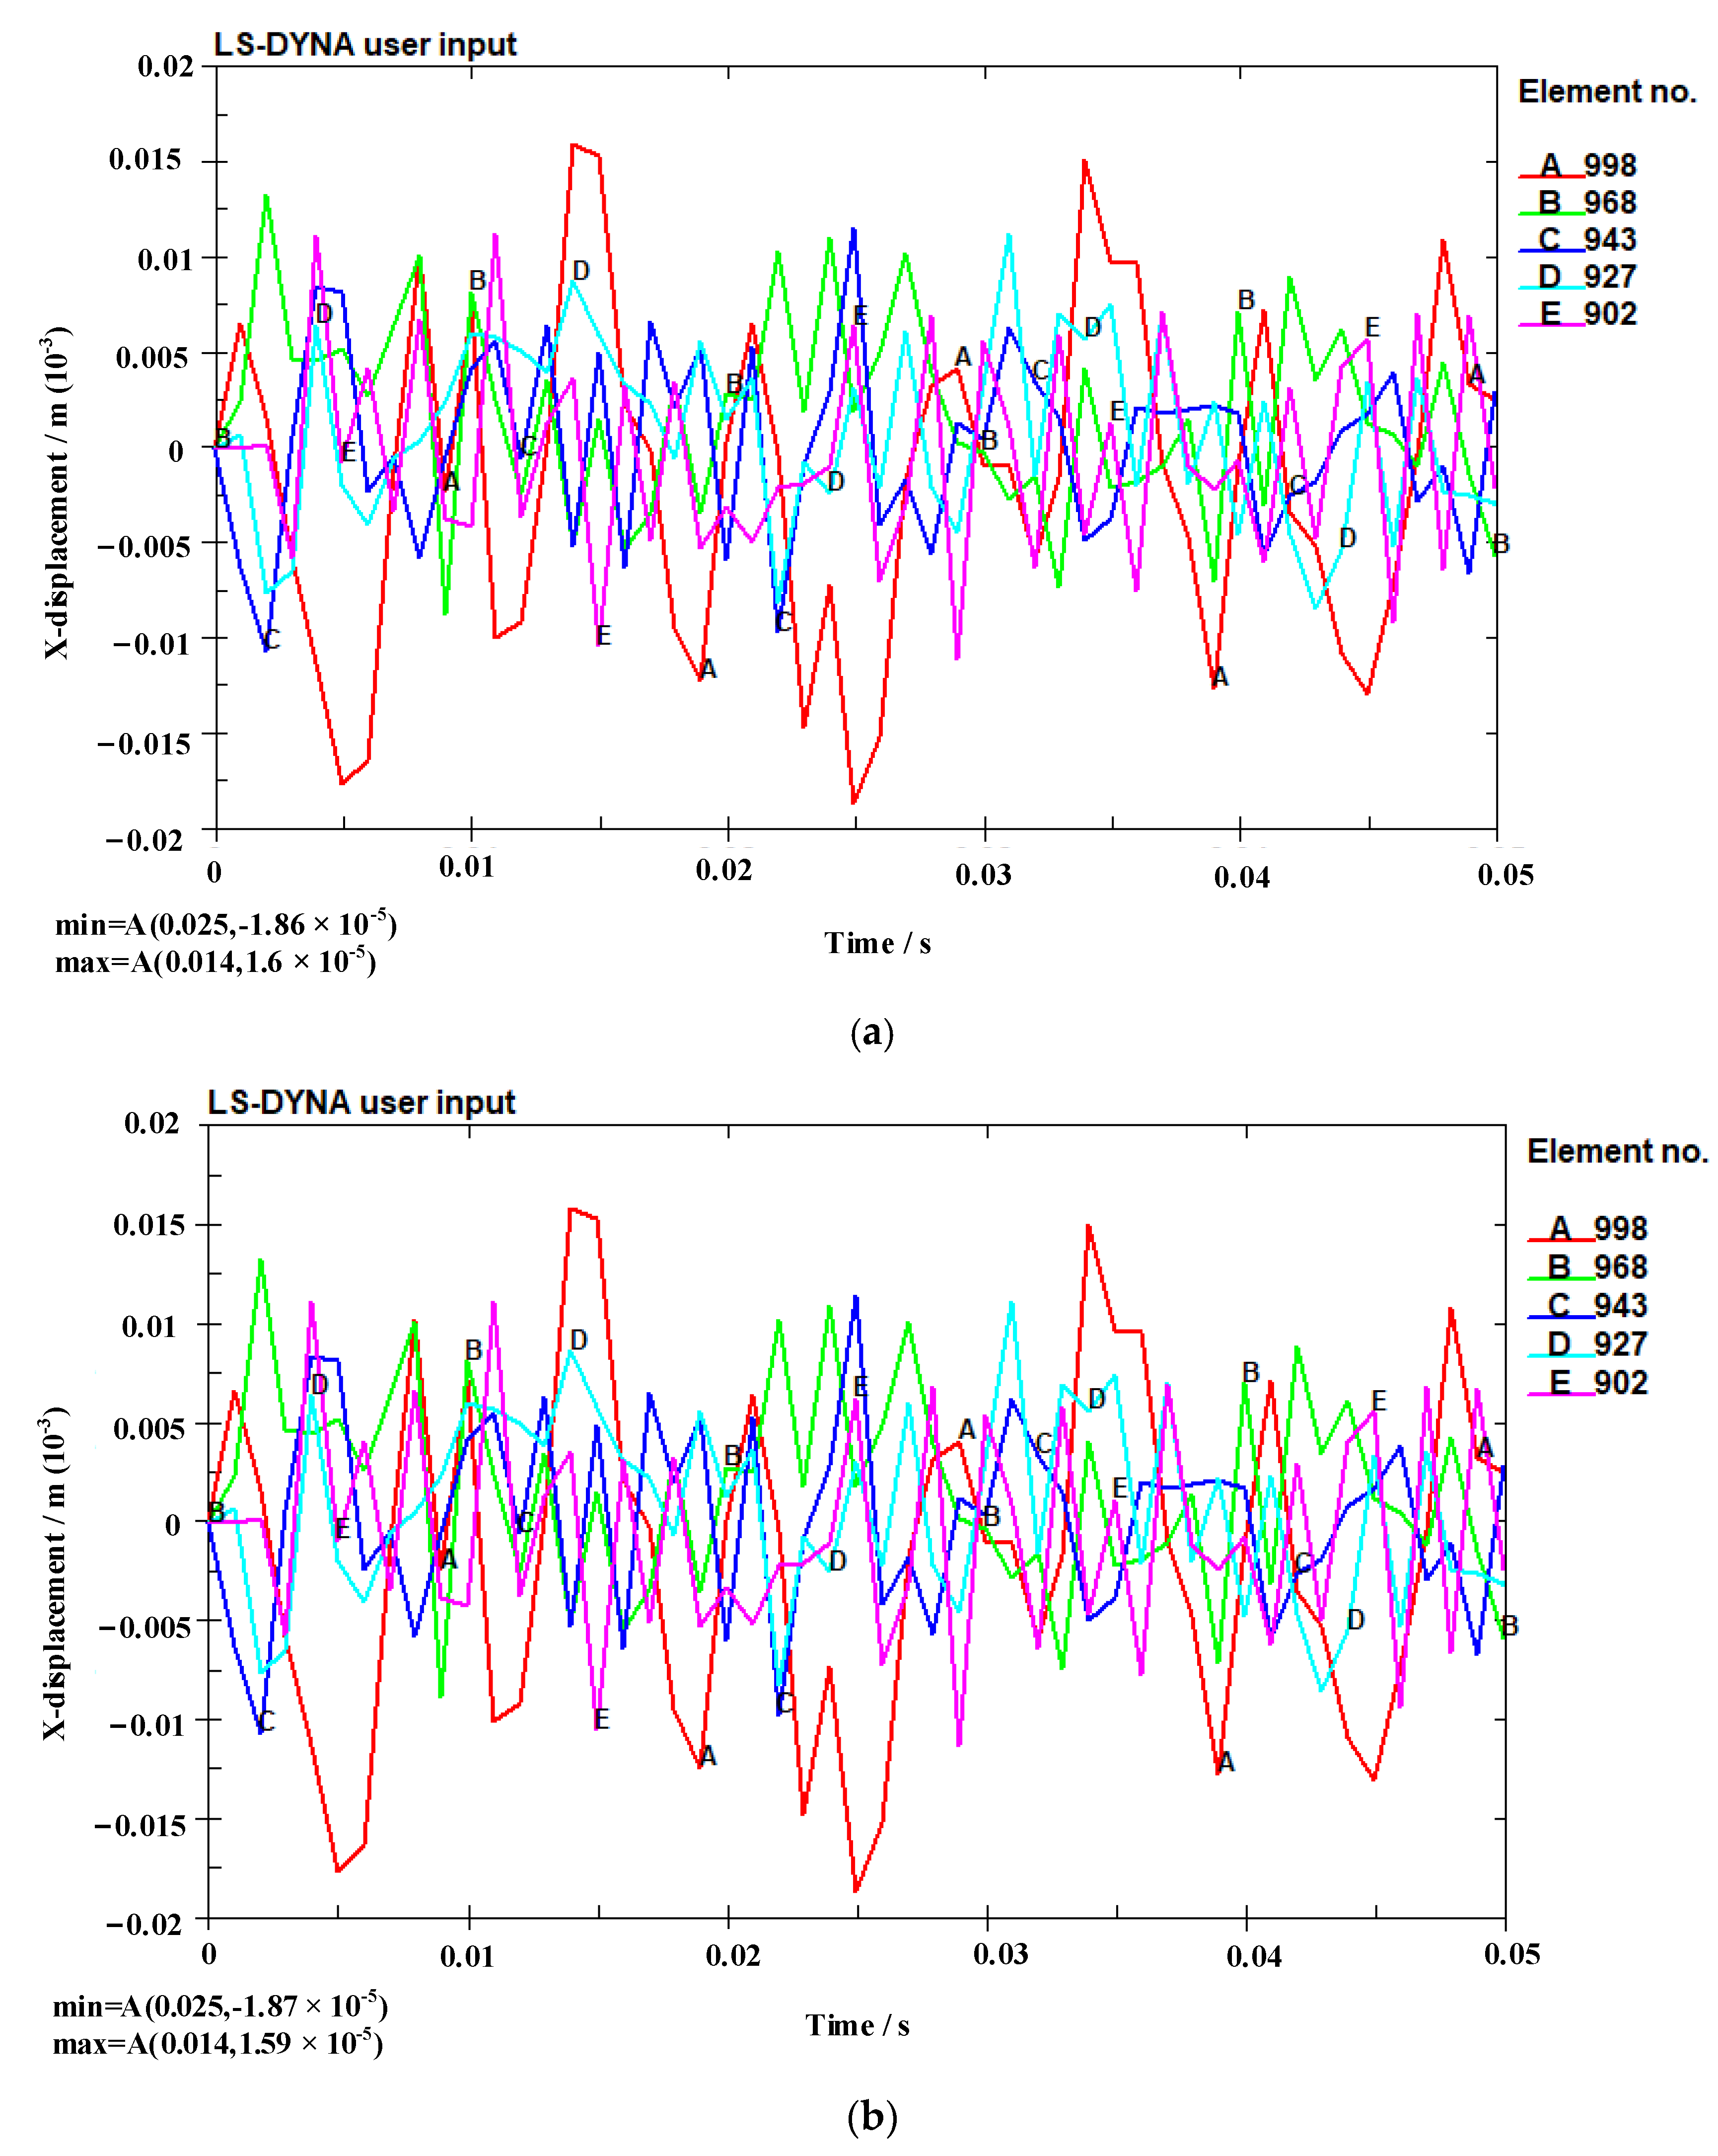
Figure 5 shows the radial displacement curve of measuring points A–E under four thermal conductivity coefficients within 0.05 s after a gas explosion. The impact degree of the pipe wall can be seen in Figure 5. Due to the irregular reflection of the shock wave on the wall surface and the material properties of the steel pipe, its own yielding leads to rebound after the internal wall displacement of the pipe, and the radial displacement curve oscillates. It can also be seen that after the gas explosion, the radial displacement value of the arranged measuring points tends to slightly decrease with the increase in the thermal conductivity.

3.2.3. Time History Curve of Shock Wave Velocity at Measuring Points in the Air Region

Figure 6 shows the velocity time history curve of the arranged measuring points in the air region. The peak curve is the shock wave velocity when the shock wave reaches the measuring point. The simulation results under the conditions of a thermal conductivity coefficient of 15 W/(m·K) and 60 W/(m·K) are adopted for analysis.
From Figure 6, it can be seen that the peak velocity of the shock wave reaching each measuring point is shown in Table 2. From Table 2, it can be seen that the shock wave velocity at each measuring point is relatively small at a thermal conductivity coefficient of 60 W/(m·K), and the velocity difference of the shock wave between the two conditions becomes larger as the distance from the explosion source increases. Moreover, as the thermal conductivity of the pipe wall increases, the wall thermal dissipation increases, and the gas explosion energy involved in expansion and work in pipes with high thermal conductivity is lower, resulting in lower explosion wave intensity and faster shock wave attenuation. After a gas explosion, the amount of thermal dissipation through the pipe wall is also greater at the location further away from the explosion source. Therefore, under the influence of the increase in the thermal conductivity coefficient of the pipe wall, the velocity difference of the shock wave also increases. The obtained data and conclusions are consistent with the experimental results obtained in the literature [2].

4. Conclusions

The numerical model of the thermal impact of a gas explosion is established based on the ANSYS/LS-DYNA software, and the thermal impact processes of a gas explosion in the pipe wall with four thermal conductivity coefficients are simulated. The following conclusions are obtained:
(1)
When the pipe wall is approximately insulated, the phenomenon of stress concentration is more obvious, and the equivalent stress distribution is relatively uneven. The degree of thermal dissipation from the pipe wall affects the gas explosion intensity. A portion of the energy generated by gas explosions is dissipated through the thermal dissipation of the pipe wall, resulting in greater gas explosion intensity under the pipe wall conditions of the approximate insulation.
(2)
With an increase in the thermal conductivity of the pipe wall, the peak pressure at each measuring point of the pipe decreases as a whole. Under the condition of a thermal conductivity coefficient of 60 W/(m·K), the peak pressure at the measuring point of the pipe wall is the smallest compared to other conditions.
(3)
As the thermal conductivity of the pipe wall increases, the degree of thermal dissipation on the pipe wall becomes stronger, and the amount of thermal dissipation through the pipe wall increases, resulting in a decrease in the energy that subsequently drives the shock wave and a decrease in the impact degree of the pipe wall.
(4)
With an increase in the thermal conductivity of the pipe wall, the radial displacement values of the arranged measuring points decrease, and the gas explosion energy involved in expansion and work in pipes with high thermal conductivity is lower, which reduces the intensity of the explosion wave. After the gas explosion, the amount of thermal dissipation through the pipe wall is greater at a location farther away from the explosion source, resulting in an increase in the velocity difference of the shock wave due to an increase in the thermal conductivity of the pipe wall.

Author Contributions

Conceptualization, X.G. and Q.Y.; methodology, Z.J. and Q.Y.; software, Z.J. and Q.Y.; investigation, X.G. and Z.J.; writing—original draft preparation, Z.J. and Q.Y.; writing—review and editing, Z.J. and Q.Y. All authors have read and agreed to the published version of the manuscript.

Funding

This work received funding from the National Natural Science Foundation Project of China (52174178, 52174177), and the project was supported by the Scientific Research Fund of the Hunan Provincial Education Department (20B240).

Institutional Review Board Statement

Not applicable.

Informed Consent Statement

Not applicable.

Data Availability Statement

Not applicable.

Conflicts of Interest

The authors declare no conflict of interest.

References

  1. Ye, Q.; Wang, G.G.; Jia, Z.; Zheng, C. Experimental study on the influence of wall heat effect on gas explosion and its propagation. Appl. Therm. Eng. 2017, 118, 392–397. [Google Scholar] [CrossRef]
  2. Baiquan, L.; Congguang, J. Energy changing characteristics of explosion wave and heating effect of wall. J. China Coal Soc. 2004, 29, 429–433. [Google Scholar]
  3. Kang, X.; Veeraragavan, A. Experimental investigation of flame stability limits of a mesoscale combustor with thermally orthotropic walls. Appl. Therm. Eng. 2015, 85, 234–242. [Google Scholar] [CrossRef]
  4. Ezekoye, O.; Greif, R.; Sawyer, R. Increased surface temperature effects on wall heat transfer during unsteady flame quenching. Symp. (Int.) Combust. 1992, 24, 1465–1472. [Google Scholar] [CrossRef]
  5. Jiang, B.; Lin, B.; Zhu, C.; Zhai, C.; Liu, Q. Premixed methane-air deflagrations in a completely adiabatic pipe and the effect of the condition of the pipe wall. J. Loss Prev. Process. Ind. 2013, 26, 782–791. [Google Scholar] [CrossRef]
  6. Yan, Y.; Wang, H.; Pan, W.; Zhang, L.; Li, L.; Yang, Z.; Lin, C. Numerical study of effect of wall parameters on catalytic combustion characteristics of CH4/air in a heat recirculation micro-combustor. Energy Convers. Manag. 2016, 118, 474–484. [Google Scholar] [CrossRef]
  7. Lee, M.J.; Cho, S.M.; Choi, B.I.; Kim, N.I. Scale and material effects on flame characteristics in small heat recirculation combustors of a counter-current channel type. Appl. Therm. Eng. 2010, 30, 2227–2235. [Google Scholar] [CrossRef]
  8. Norton, D.; Vlachos, D. Combustion characteristics and flame stability at the microscale: A CFD study of premixed methane/air mixtures. Chem. Eng. Sci. 2003, 58, 4871–4882. [Google Scholar] [CrossRef]
  9. Wang, L.-Q.; Ma, H.-H.; Shen, Z.-W. An experimental investigation on explosion behaviors of syngas-air mixtures in a vessel with a large blockage ratio perforated plate. Fuel 2019, 264, 116842. [Google Scholar] [CrossRef]
  10. Sun, Z.-Y.; Li, G.-X. Turbulence influence on explosion characteristics of stoichiometric and rich hydrogen/air mixtures in a spherical closed vessel. Energy Convers. Manag. 2017, 149, 526–535. [Google Scholar] [CrossRef]
  11. Huang, K.; Sun, Z.; Tian, Y.-C.; Wang, K.-L. Turbulent combustion evolution of stoichiometric H2/CH4/air mixtures within a spherical space. Int. J. Hydrogen Energy 2020, 45, 10613–10622. [Google Scholar] [CrossRef]
  12. Wan, J.; Fan, A.; Yao, H.; Liu, W. Effect of thermal conductivity of solid wall on combustion efficiency of a micro-combustor with cavities. Energy Convers. Manag. 2015, 96, 605–612. [Google Scholar] [CrossRef]
  13. Jiang, L.; Zhao, D.; Guo, C.; Wang, X. Experimental study of a plat-flame micro combustor burning DME for thermoelectric power generation. Energy Convers. Manag. 2011, 52, 596–602. [Google Scholar] [CrossRef]
  14. Zhang, B.; Chang, X.; Bai, C. End-wall ignition of methane-air mixtures under the effects of CO2/Ar/N2 fluidic jets. Fuel 2020, 270, 117485. [Google Scholar] [CrossRef]
  15. Campbell, A.N. The effect of external heat transfer on thermal explosion in a spherical vessel with natural convection. Phys. Chem. Chem. Phys. 2015, 17, 16894–16906. [Google Scholar] [CrossRef] [PubMed]
  16. Jianlong, W.; Aiwu, F.; Yi, L.; Hong, Y.; Wei, L.; Xiaolong, G.; Daiqing, Z. Experimental investigation and numerical analysis on flame stabilization of CH4/air mixture in a mesoscale channel with wall cavities. Combust. Flame 2015, 162, 1035–1045. [Google Scholar]
  17. Jia, Z.; Ye, Q.; Wang, H.; Li, H.; Shi, S. Numerical Simulation of a New Porous Medium Burner with Two Sections and Double Decks. Processes 2018, 6, 185. [Google Scholar] [CrossRef]
  18. Qing, Y.; Baiquan, L.; Congguang, J.; Zhenzhen, J. Propagation characteristics of gas explosion in duct with sharp change of cross sections. Disaster Adv. 2012, 15, 999–1003. [Google Scholar]
  19. Baiquan, L.; Congguang, J.; Hui, Z. The Influence of Heat Dissipated in a Conduit Wall on the Transmission Characteris-tics of Gas Explosions. J. China Univ. Min. Technol. 2009, 38, 1–4. [Google Scholar]
  20. Ye, Q.; Jia, Z.Z. Effect of the bifurcating duct on the gas explosion propagation characteristics. Combust. Explos. Shock Waves 2014, 50, 424–428. [Google Scholar] [CrossRef]
  21. Haohao, Z.; Zhenzhen, J.; Qing, Y.; Yu, C.; Shujuan, L. Numerical simulation on influence of initial pressures on gas explosion propagation characteristics in roadway. Front. Energy Res. 2022, 10, 913045. [Google Scholar] [CrossRef]
  22. Jia, Z.; Ye, Q.; Li, H. Damage Assessment of Roadway Wall Caused by Dynamic and Static Load Action of Gas Explosion. Processes 2023, 11, 580. [Google Scholar] [CrossRef]
  23. Li, S.; Jia, Z.; Ye, Q. Study on Dynamic Response of Damper under Gas Explosion Impact. Sustainability 2023, 15, 3356. [Google Scholar] [CrossRef]
  24. Dangyong, S.; Yuchun, L.; Shengmin, Z. Display Dynamic Analysis Based on ANSYS/LS-DYNA8.1 Version; Tsinghua University Press: Beijing, China, 2005; pp. 35–58. [Google Scholar]
  25. Jia, Z.; Tao, F.; Ye, Q. Experimental Research on Coal-Gas Outburst Prevention by Injection Liquid Freezing during Uncovering Coal Seam in Rock Crosscut. Sustainability 2023, 15, 1788. [Google Scholar] [CrossRef]
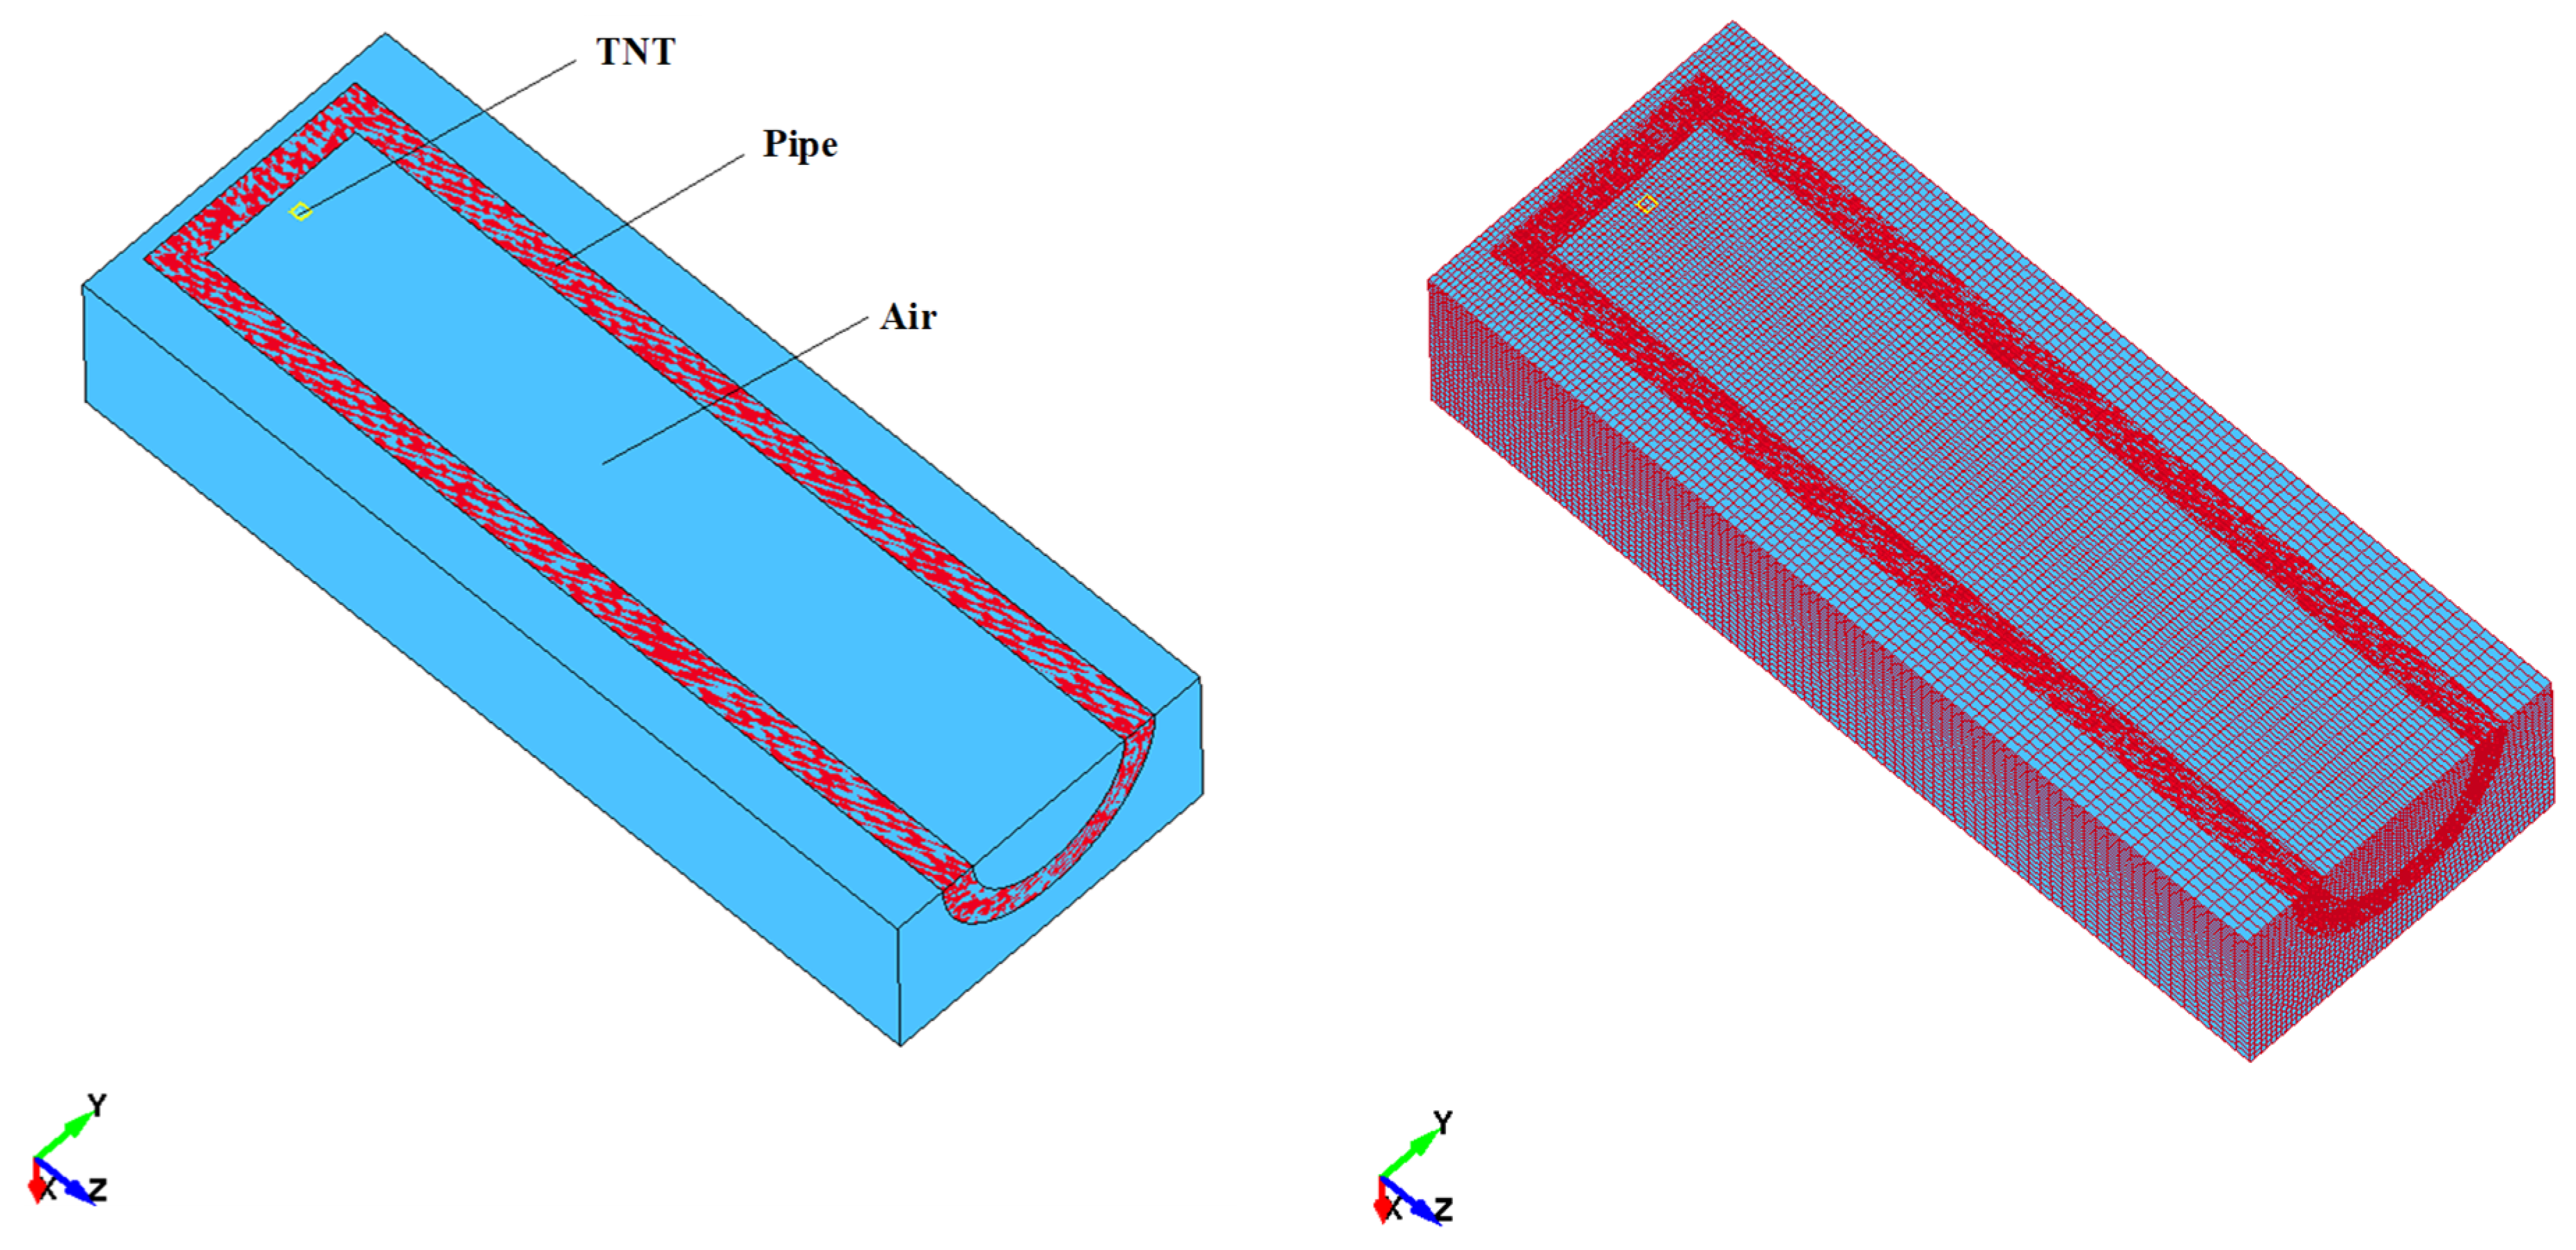
Figure 1. The finite element model before and after meshing.
Sustainability 15 07792 g001
Figure 2. Schematic diagram of measuring point layout. (a) Measuring point on pipe wall. (b) Measuring point in air region.
Sustainability 15 07792 g002
Figure 3. Stress distribution nephogram of pipe wall under two conditions. (a) t=0.001 s; (b) t = 0.01 s; (c) t = 0.02 s; (d) t = 0.03 s; (e) t = 0.04 s; (f) t = 0.05 s.
Sustainability 15 07792 g003aSustainability 15 07792 g003bSustainability 15 07792 g003c
Figure 4. Pressure curve of pipe with 4 kinds of thermal conductivity coefficients. (a) Thermal conductivity coefficient of 15 W/(m·K); (b) thermal conductivity coefficient of 30 W/(m·K); (c) thermal conductivity coefficient of 45 W/(m·K); (d) thermal conductivity coefficient of 60 W/(m·K).
Sustainability 15 07792 g004aSustainability 15 07792 g004b
Figure 5. Radial displacement curve of pipe wall under different thermal conductivity coefficients. (a)Thermal conductivity coefficient of 15 W/(m·K); (b)thermal conductivity coefficient of 30 W/(m·K); (c) thermal conductivity coefficient of 45 W/(m·K); (d) thermal conductivity coefficient of 60 W/(m·K).
Sustainability 15 07792 g005aSustainability 15 07792 g005b
Figure 6. Velocity of shock wave in air region under thermal conductivity coefficient of 15 and 60 W/(m·K). (a) Thermal conductivity coefficient of 15 W/(m·K); (b) thermal conductivity coefficient of 60 W/(m·K).
Sustainability 15 07792 g006
Table 1. Peak pressure of each measuring point under different thermal conductivities (Unit/MPa).
Thermal Conductivity
W/(m·K)
Measuring Point
ABCDE
152.472.342.32.092.03
302.192.062.191.812.05
452.212.072.191.852.01
601.911.862.071.521.95
Table 2. Peak velocity of shock wave at measuring points in the air region (Unit m/s).
Thermal Conductivity
W/(m·K)
Measuring Point
FGHI
15758.33462.67591.90559.65
60629.11406.31416.52480.91
Disclaimer/Publisher’s Note: The statements, opinions and data contained in all publications are solely those of the individual author(s) and contributor(s) and not of MDPI and/or the editor(s). MDPI and/or the editor(s) disclaim responsibility for any injury to people or property resulting from any ideas, methods, instructions or products referred to in the content.