Abstract
Drought is considered a natural hazard and has become a recurrent phenomenon in Algeria since the 1970s. Algeria is characterized by three different climates, namely, sub-humid, semi-arid and arid climates. In this study, we aimed to spatiotemporally assess drought hazard, vulnerability and risk in the three climates of three sub-basins, namely, the Seybouse Maritime, Wadi Djelfa-Hadjia and Wadi M’Zi sub-basins. To this end, the standardized precipitation index (SPI) and the reconnaissance drought index (RDI) were used to evaluate drought physical characteristics on a 12-month timescale, based on precipitation and temperature monthly data covering the period of 1979–2019. High values of the coefficient of determination (R2) (0.76–0.99) confirmed by low values of the root-mean-square error (RMSE) (0.08–0.49) proved that the drought indices displayed a high correlation. Drought hazard and vulnerability were evaluated based on physical characteristics and socioeconomic aspects, respectively. The results led to the determination of a high correlation between the two indices used; the determination of the main drought events; and the mapping of the drought hazard, vulnerability and risk using a geographic information system (GIS). These findings suggest that the SPI provided the highest intensities, while the longest periods and the strongest magnitudes were given by the RDI. The spatiotemporal drought distributions varied with time from station to station and from sub-basin to sub-basin. Risk maps revealed that vulnerability based on socioeconomic factors controls drought risk.
1. Introduction
Drought is considered a natural hazard [1,2] and can be confused with aridity, which can be caused by low rainfall in a region. Drought can be defined as the excessive persistence of a precipitation deficit in a particular area for a certain amount of time [3,4]. Drought can occur in virtually all of the different climatic zones [4,5,6] and can be classified into several categories [7,8,9,10]: (1) meteorological drought, which is characterized by a prolonged precipitation deficiency in an area for a period of time [6,11,12]; (2) hydrological drought, which occurs when surface and groundwater recharge depletes [5,6,12,13,14]; (3) agricultural drought, which is caused by a soil moisture deficiency leading to crop failure [6,15]; and (4) socioeconomic drought, which is related to a shortage of water that isrequired to meet the demand for economic goods [8,16].
In addition to the types of drought, the characterization of droughts based on their duration, severity, intensity and spatial extent [17,18] is carried out using numerous indices (more than 150) [19,20]. In order to asses meteorological drought, some indices have been developed, e.g., the Dimensionless Precipitation Anomaly Index (DPAI) [21], the Standardized Precipitation Temperature Index (SPTI) [22], the Standardized Effective Precipitation Evapotranspiration Index (SP*ETI) [23], the Regional Drought Area Index (RDAI) [24,25], the Standardized Precipitation Evapotranspiration Index (SPEI) [26], the Streamflow Drought Index (SDI) [27], the Reconnaissance Drought Index (RDI) [28], the Reclamation Drought Index (RDI) [29], the Standardized Precipitation Index (SPI) [30,31], the Standardized Streamflow Index (SSI) [31,32], the Percent of Normal Precipitation Index (PNPI) [33], the National Rainfall Index (NRI) [34], the Surface Water Supply Index (SWSI) [35], the Bhalme and Mooly Drought Index (BMDI) [36], the Crop Moisture Index (CMI) [37] and the Rainfall Anomaly Index (RAI) [38], with each of these indicators having its own strengths and weaknesses. Among the most commonly used meteorological drought indices are the Standardized Precipitation Index (SPI) [31] and the Reconnaissance Drought Index (RDI) [28], and both are based on precipitation, which is combined with potential evapotranspiration (PET) in the RDI. These indices allow for the quantification of drought characteristics in order to develop measures to reduce the impacts of droughts [6].
Many studies have been carried out to analyze drought all over the world [39,40,41,42,43,44,45,46,47,48,49,50,51,52]. Algeria has been affected by drought since the 1970s [53], and several studies have been carried out to assess and monitor drought events [54,55,56,57,58,59,60,61,62,63,64]. Achite et al. [65] used the Standardized Precipitation Index (SPI) to map spatial and temporal drought variations during the period of 1970–2010 based on data from 16 rainfall stations located in the Wadi Mina basin in northwestern Algeria. The findings showed decreasing precipitation trends. In a study using the SPI to monitor the spatiotemporal evolution of meteorological drought in the Chelif Basin in northwestern Algeria over 73 years between 1936 and 2008, higher intensities, durations and frequencies were observed after 1976 [66]. Mellak and Souag-Gamane [67] analyzed drought characteristics with the SPI in northern Algeria using data from 194 rainfall stations distributed over 16 catchments over the period of 1970–2006. Severe-to-extreme droughts of short durations and high probabilities of exceedance were found to occur in the western part of Algeria. Nevertheless, the remainder of the studied area was affected by mild droughts with lower probabilities of long-term durations. In the plains of northwestern Algeria, Achour et al. [68], using monthly rainfall data covering over 50 years, applied an artificial neural network (ANN) model to analyze historic droughts and predict future droughts. The seven plains of northwestern Algeria were severely affected by drought; furthermore, the proposed ANN-based drought forecast model can be adopted to schedule adequate irrigation 2 months in advance in order to mitigate water stress and optimize agricultural production.
A disaster has been defined as the combination of the probability of a hazardous event and its consequences [69,70,71]. Risk was conceptualized by Brooks et al. [72] as a function of hazard and vulnerability. Many studies have focused on risk assessments; nevertheless, few have combined drought hazard and vulnerability [73,74,75,76,77,78,79].
In this work, we aimed to carry out a spatiotemporal assessment of drought in three different climatic zones in Algeria (sub-humid, semi-arid and arid climates). The main objectives of this paper were to (1) analyze and compare the physical drought characteristics during the period of 1979–2019; (2) detect historical drought events over the observation period; (3) map and compare drought hazard, vulnerability and risk indices in the Seybouse Maritime, Wadi Djelfa-Hadjia and Wadi M’Zi sub-catchments; and (4) evaluate the extent of the drought hazard, vulnerability and risk in each climatic zone of Algeria in order to develop strategies to help decision-makers mitigate drought and ensure sustainable development in Algeria.
This work is structured as follows. Firstly, the study area is presented with a brief description. Secondly, the methodology followed is explained. The results are then reported in terms of drought hazards, vulnerabilities and risk variations, as well as drought physical characteristics (duration, magnitude, intensity and frequency).
2. Study Area and Data
2.1. Study Area
The study area was composed of three sub-basins, namely, the Seybouse Maritime, the Wadi Djelfa-Hadjia and the Wadi M’Zi sub-basins.
2.1.1. Seybouse Maritime
Seybouse is one of the most important wadis in Algeria because of its length, number of tributaries and watershed area. The Seybouse Maritime sub-basin is one of three sub-basins comprising the Seybouse watershed. It is located between 7°27′ and 7°53′ east longitude and 36°27′ and 36°55′ north latitude (Figure 1). It is limited by the Mediterranean Sea to the north; the eastern extension of the Annaba–Bouteldja aquifer system to the east; the Bni Salah Mountain to the southeast; Edough Mountain and the basin of Lake Fetzara to the west; and the mountains of Mahouna, Ain Larbi and Sedrata to the south. The Seybouse Maritime sub-basin covers 21 provinces; among them, 15 provinces are partially covered (Annaba, Seraidi, Oued El Aneb, El Bouni, Sidi Amar, Ain Berda, Cheurfa, Echatt, Chihani, Besbes, Bouchegouf, Beni Mezline, Medjez Sfa, Guelaât Bou Sbaâ and Djeballah Khemissi), and 6 provinces are totally covered (El Hadjar, Chebaita Mokhtar, Drean, Ain Ben Beida, Nechmaya and Oued Fragha), with a total surface area of 1066.02 km2 and 844,745 inhabitants in 2019. This sub-basin presents an asymmetrical relief with a zone of medium mountains, relatively accentuated on the left bank of the Wadi Seybouse. In the extreme northwest, Edough Mountain has an altitude of 1008 m (Kef Seba), and the average altitude of the Numidian chain is 500 m [80]. This area has a sub-humid climate characterized by a hot and dry season and a humid and wet season. The annual average precipitation ranges from 190 mm to 220 mm in the upstream and 500 mm to 1000 mm in the downstream, and the annual average temperature is 16.9 °C.
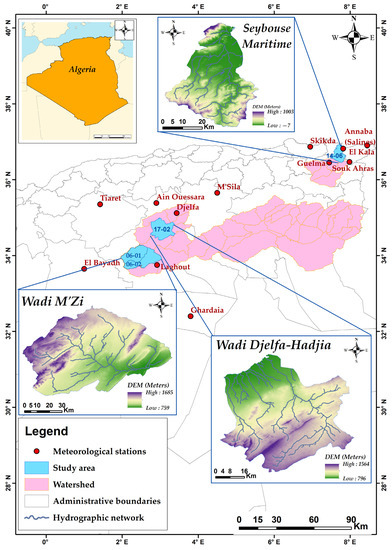
Figure 1.
Geographical situation, Digital Elevation Model (DEM) and meteorological station distribution within the study area.
2.1.2. Wadi Djelfa-Hadjia
Belonging to the Zahrez watershed, the Wadi Djelfa-Hadjia sub-basin, which spans an area of 2414.51 km2 and has a circumference of 264.1 km, is situated in the center of Djelfa, marking the boundary between the country’s northern region and the Sahara Desert. It is located between 2°43′ and 3°24′ east longitude and 34°24′ and 34°59′ north latitude (Figure 1). This sub-basin—which is limited to the north and the northeast by the Wadi Zahrez Gharbi sub-basin; to the east by the Zahrez Chergui, Wadi Medjadel and Daiet Mefiteg sub-basins; to the west by the Wadi El Mesrane sub-basin; to the southeast by the Wadi Demmed sub-basin; and to the south and southwest by the Wadi Taadmit sub-basin—is located in the Djelfa territory and partially covers 13 provinces, namely, Ain Maabad, Ain El Ibel, Beni Yagoub, Charef, Djelfa, Dar Chioukh, El Gueddid, HassiBahbah, Moudjbara, Sidi Baizid, Taadmit, Zaafrane and Zaccar, comprising a population of 682,364 inhabitants in 2019. The studied sub-watershed has a relatively high topography; its elevation ranges from 1020 m to 1489 m. With a semi-arid climate, the Wadi Djelfa-Hadjia sub-basin has an annual average rainfall ranging between 250 mm and 350 mm and an annual temperature of 15.3 °C.
2.1.3. Wadi M’Zi
One of the most significant wadis in the Central Saharan Atlas is Wadi M’Zi. This wadi starts in Aflou in the Djebel Amour mountain range and meets Wadi Messaad in the southeast of Laghouat to form Wadi Djedi. With an orientation of east–west, the Wadi M’Zi sub-basin belongs to the wilaya of Laghouat and, which straddles two quite different geological domains: one in the north, the central Saharan Atlas relief, and one in the south, the Saharan platform. It is located between 1°57′ and 3°20′ east longitude and 33°38′ and 34°59′ north latitude (Figure 1).
Occupying a surface area of 4379.16 km2, this sub-watershed partially covers 15 provinces, namely, Laghouat, Aflou, Ain Madhi, Tadjmout, Kheneg, El Houaita, Tadjrouna, Oued Morra, Oued M’Zi, El Ghicha, Sidi Makhlouf, El Assafia and Sebgag in the wilaya of Laghouat and Ain Chouhada and Douis in the wilaya of Djelfa, with a total population of 716,220 inhabitants in 2019. Characterized by an arid climate, this sub-basin has an annual average rainfall of 220 mm.
2.2. Data Used
The data used in this study included the mean monthly precipitation and temperatures recorded at 12 meteorological stations located within and near the 3 studied sub-basins, as shown in Figure 1. These data were collected from the Algerian National Meteorological Organization and covered a 40-year period from 1979 to 2019, with October-to-September water years being used. Table 1 lists the coordinates and elevations of the meteorological stations.

Table 1.
Characteristics of meteorological stations used in the study.
3. Methodology
The spatiotemporal variation of the drought events was assessed using two commonly used drought indices, namely, the Standardized Precipitation Index (SPI) and the Reconnaissance Drought Index (RDI). The data used comprised the precipitation, the temperature and the calculated potential evapotranspiration for a period of forty years (1979–2019). Drought physical characteristics were evaluated on a 12-month timescale. These later enabled the estimation of the Drought Hazard Index (DHI). In contrast, the Drought Vulnerability Index (DVI) was evaluated based on the socioeconomic factors of the three studied regions.
3.1. Drought Indices
3.1.1. Standardized Precipitation Index
McKee, Doesken and Kleist [31] developed the Standardized Precipitation Index (SPI), which is a powerful index that is flexible to use and easy to calculate. The rainfall data are actually the only required parameter. The SPI is statistically based on the total likelihood of a particular quantity of precipitation recorded at an observation station [81,82]. Monthly precipitation data covering at least 20 to 30 years, but ideally 50 to 60 years or more [83], are needed for the computation of the SPI.
The SPI is typically calculated for five timescales (1, 3, 6, 9, and 12 months), although it may be adjusted for the length of time selected [81]. This flexibility enables the SPI to be used to monitor both short-term and long-term water resources, including groundwater supplies; stream flows; lake and reservoir levels; and soil moisture, which are crucial for agricultural productivity [6].
The SPI computation for the precipitation of a desired station is first fitted to a Probability Density Function (PDF) (gamma distribution) [84,85,86]. The gamma distribution can be defined as follows:
where α and β are the shape and scale parameters, respectively, when x > 0; Γ(α) is the gamma function; and x is the rainfall value.
The Alpha (α) and Beta (β) are determined using the maximum likelihood method:
where x is the average amount of precipitation; n is the number of measurements; and xi is the amount of precipitation across a data series. The cumulative probability is expressed as
Given that the precipitation distribution may be zero, the cumulative probability equation becomes as follows:
where q is the probability that the precipitation quantity equals zero.
Then, the SPI can be calculated using the following equation:
where ϕ is the standard normal cumulative distribution function.
3.1.2. Reconnaissance Drought Index
Developed by Tsakiris and Vangelis [28] in 2005, the Reconnaissance Drought Index (RDI) calculation is similar to the SPI. However, while the SPI is based only on precipitation data, the RDI computation is based on both precipitation and potential evapotranspiration. The complete formulation of the RDI has already been presented by [28,87,88,89] as follows:
- The initial :where Pij and PETij are the precipitation and potential evapotranspiration, respectively, of month j of hydrological year i.
- The Normalized RDI (RDIn):where is the arithmetic mean of values.
- The Standardized RDI (RDIst):where is the ; is the arithmetic mean; and is the standard deviation.
The drought classifications of both SPI and RDI are described in Table 2.
Table 2.
Drought classes based on SPI and RDI values.
3.2. Potential Evapotranspiration
According to Shahidian et al. [90], the potential evapotranspiration (PET) can be estimated either based on the temperature-based equations comprising the Hargreaves–Samani, Thornthwaite and Blaney–Criddle methods or on the reduced-set PM methods, which comprise the Priestley–Taylor; Makkink; Turc; and Jensen and Haise methods.
During the present study, the PET values were calculated based on the Thornthwaite [91] method because Vangelis et al. [88] concluded that the use of four PET methods (Hargreaves, Thornthwaite, Blaney–Criddle and FAO Penman–Monteith (only T)) in coastal semi-arid (Mediterranean) climatic conditions demonstrated that none of these used PET methods identified any appreciable impact on the results of the RDI.
The Thornthwaite Method
Developed in 1948 by Thornthwaite, this method allows for calculations based on the average air temperature and the number of daylight hours [90]. It is calculated as follows [89,90,92]:
where I is the annual heat index, and Tmean is the mean monthly temperature (°C).
3.3. Drought Characteristics
According to the widely adopted terminology of Salas [93], drought is characterized by its duration, severity/magnitude, intensity, frequency and geographical extent. Except for the geographical extent, the drought characteristics are calculated based on the drought indices using the theory of RUN [94], as used by Dracup et al. [95].
3.3.1. Duration
Duration may be described as the period during which wet and dry episodes coexist in various timescales. It can range from a week to a few years [12]. The total number of months with an index value below −1 during a particular period of time is hence considered the drought duration [74,96].
According to Spinoni et al. [97] and Singh et al. [74], the drought duration must be at least 2 months.
3.3.2. Magnitude
The cumulative shortfall of water below a certain threshold throughout the course of a drought episode is how Zargaret al. [12] defined drought magnitude, but it can also be defined as the cumulated rainfall deficits throughout a specific period [98]. According to the SPI and RDI classification values, the thresholds of −1, −1.5 and <−2 were selected to categorize the drought magnitudes reported in this study as moderate, severe and extreme, respectively [74]. The drought magnitude can be calculated as follows:
where j is the first month for which the SPI 12 is below the chosen threshold, and x is the number of consecutive months with negative values below the chosen threshold [23].
3.3.3. Intensity
Intensity may be characterized as the ratio of the drought magnitude to its duration [12,99], and it quantifies the average monthly severity of the drought [74]. To compare the drought events that were documented for each of our three sub-basins across various climatic zones, the drought intensities of each event were determined.
3.3.4. Frequency (Return Period)
The average amount of time between drought incidents is known as the frequency or return period [12,100]. This is determined by dividing the number of dry months by the entire duration of the analysis of drought episodes [74].
3.4. Drought Hazard Index (DHI)
The calculation method adopted to determine the Drought Hazard Index was the method used by Maccioni et al. [23]. It is a relatively simple method, and it is based on the blending of four indicators, namely, the number of drought events recorded throughout the reference period (F), the number of drought events for which the duration is greater than 24 months (F24) as a sensible descriptor of prolonged events in the Mediterranean climate, the maximum drought magnitude (DMmax) and the maximum drought duration (Dmax) [23]. A score from 1 to 4 and a weight are assigned to each indicator; the latter is determined based on the analytic hierarchy process (AHP) developed by Saaty [101]. Since the four indicators equally contribute to the definition of a hazard, Maccioni et al. [23] suggested assigning equal weights (0.25).
3.5. Drought Vulnerability Index (DVI)
Vulnerability is the susceptibility degree of a system to damage due to the occurrence of a phenomenon [102]. It is also defined by Wilhelmi and Wilhite [103] as the degree of susceptibility or resilience of a socioeconomic system or its physical variables to be affected by the impact of natural hazards. Moreover, Vogt et al. [99] defined it as the sensitivity to the negative impacts of droughts on exposed components.
Several approaches have been proposed to study vulnerability. The first one, named the socio-level approach [104,105], is used to assess social vulnerability, and it can be used to assess drought vulnerability. The taxonomic approach addresses social vulnerability causes [75]. A third approach was proposed by Wisner, and it is similar to the “house hold livelihood security” or “access model” utilized by Blaikie et al. [106]. The last method, named the contextual and proactive approach [104,105], attempts to determine drought vulnerability based on the participatory paradigm of a given community.
The region under examination determines the indicators of vulnerability, which are typically difficult to evaluate objectively [75]. Numerous academics have outlined these markers in their studies related to the effects of climate change on water resources [72,107]. After careful consideration, depending on the study area, the following vulnerability indicators were chosen: population density (PD), female-to-male ratio (FRM), municipal water demand (MW), irrigation water needs (IW), livestock water demand (LW) andindustrial water demand (INW). Each of these 6 indicators was divided into 4 classes ranging from 1 to 4 using the Jenks natural break method [74]. Then, on a scale of 0 to 1, each class of these indications was rated. The Drought Vulnerability Index, as discussed by Shahid and Behrawan [79] and Rajsekhar et al. [75], was adopted in this study. The DVI can be calculated as shown in the following equation:
3.6. Drought Risk Index (DRI)
The relationship between vulnerability, hazard and risk was underlined by Wisner [104,105]. Furthermore, drought risk is defined as a combination of hazard and vulnerability [106,108,109,110]. It is calculated as follows:
where DHI and DVI are the drought hazard and vulnerability indices, which are defined as the probability of the occurrence of droughts and the concept of drought vulnerability in a region, respectively. Since drought risk arises from the combination of drought hazard and vulnerability, this implies that, if either DVI or DHI is 0, there will be no risk associated with that drought event.
4. Results
We carried out spatial and temporal assessments of drought hazard, vulnerability and risk based on their cartography using a GIS. To this end, the SPI and RDI indices were used for a 12-month timescale. Based on these two indices, the physical drought characteristics (duration, magnitude, intensity and frequency) were evaluated. Finally, the Drought Hazard Index (DHI), Drought Vulnerability Index (DVI) and Drought Risk Index (DRI) were calculated and mapped for each region.
4.1. Comparison of Drought Indices
Two indices were used in this study, the SPI and RDI, determined for a 12-month timescale and for each station using precipitation and temperature over a period of 40 years (1979–2019). Figure 2 and Table 3 show a comparison of the SPI and RDI and their correlations, respectively. It can be seen that the indices used have the same evolution for the same station but differ from station to station and from sub-basin to sub-basin (Figure 2). The RDI provides higher values than the SPI [111]. The correlation between these two indices was ensured using the coefficient of determination (R2); furthermore, to prove their accuracy, the root-mean-square error (RMSE) was used, as shown in Table 3. The high R2 values demonstrate a high correlation between the SPI and the RDI [12,23,42,112]. The low RMSE values confirm the results of R2, indicating the good fitting of the two indices used.
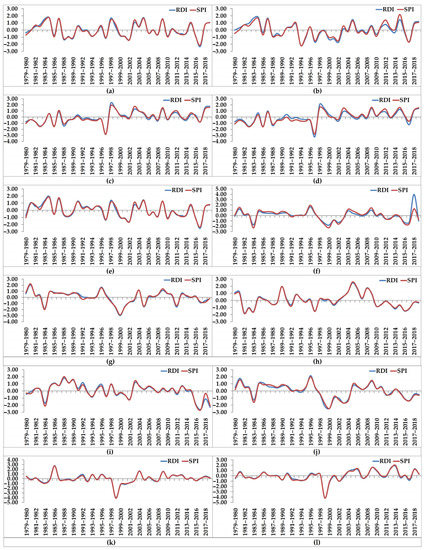
Figure 2.
SPI and RDI comparison at different stations for a 12-month timescale: (a) Annaba (Salines); (b) El Kala; (c) Guelma; (d) Souk Ahras; (e) Skikda; (f) Djelfa; (g) Ain Ouessara; (h) Ghardaia; (i) M’Sila; (j) Laghouat; (k) El Bayadh; and (l) Tiaret.
Table 3.
Comparison of coefficient of determination (R2) and root-mean-square error (RMSE) between SPI and DRI.
4.2. Drought Spatiotemporal Variation
The spatiotemporal variation of drought in our study was assessed in and near the three sub-basins. As previously mentioned, each of the sub-basins belongs to a different climatic zone: the Seybouse Maritime sub-basin belongs to the sub-humid climate; the Wadi Djelfa-Hadjia sub-basin belongs to the semi-arid climate; and the Wadi M’Zi sub-basin belongs to the arid climate.
Droughts were recorded during the years 1985, 1987–1989, 1993–1995, 1996, 1999–2001 (SPI) and 1998–2001 (RDI) all over the Seybouse Maritime sub-basin. In the eastern part (El Kala) near this sub-basin, the following years were characterized by drought: 1987, 1993–1995, 1995–1998, 1998–2001 and 2015–2016. In Skikda, located in the western part next to this sub-basin, drought events were recorded during the years 1996–1997 (RDI), 1996 (SPI), 1999–2001 (SPI), 1998–2001 (RDI), 2009–2010 and 2015–2017. In the southwest (upstream) of this sub-basin (Guelma), four drought events were recorded during the years 1982–1984 (SPI), 1982–1983 (RDI), 1985, 1987–1989, 1994–1996 (SPI) and 1993–1996 (RDI). Moreover, five drought events were recorded in Souk Ahras, located in the southeast (upstream) of this sub-basin, during the years 1982–1983, 1984, 1987–1988, 1996 and 2016 (Figure 2).
In Wadi Djelfa-Hadjia, covered by Djelfa Station, four drought events were recorded during the years 1982–1983, 1997–2000, 2001 and 2014–2017. In Ain Ouessara, M’Sila and Tiaret, even though they are characterized by the same climate as the region of Djelfa, drought events were not the same as those seen in the Wadi Djelfa-Hadjia sub-basin. Drought events in Ain Ouessara were recorded during the years 1982–1983, 1997–2002 (SPI), 1997–2001 (RDI), 2004–2005 and 2011. In M’Sila, drought events were recorded in 1982–1984, 2000–2002, 2015–2017 (SPI) and 2015–2018 (RDI). Moreover, only two drought events were recorded in Tiaret: one during the years 1997–2000 and one during the years 2000–2002 (Figure 2).
The spatial distribution of droughts in Wadi M’Zi, covered by three meteorological stations named Laghouat, Ghardaia and El Bayadh and located in the same climatic zone characterized by an arid climate, showed that drought events occurred during the years 1982–1983 (SPI), 1983 (RDI), 1997–2001, 2001–2004 and 2014–2017 at the closest station (Lagouat). In the southeastern part of the sub-basin (Ghardaia), drought events were recorded during the years 1980–1983, 1995–1997 (SPI), 1996–1997 (RDI), 2012–2014 and 2015–2017. In the west (El Bayadh), drought events were recorded during the years 1982–1984 and 1987–2002 (Figure 2).
Large parts of the sub-basins were affected by drought in the following years: 1987 and 1996 in the Seybouse Maritime sub-basin region; 1982–1983, 1997–2000 and 2001 in the Wadi Djelfa-Hadjia sub-basin region; and 1982–1983 in the Wadi M’Zi sub-basin region.
Overall, we can conclude that drought episodes in the northern part of Algeria (Seybouse Maritime) had downward drought periods during the observation period. These results correspond perfectly with the works realized by Rahman et al. [113]. Drought events occurred in the 1980s and 1990s in the Seybouse Maritime located in the northern part of Algeria, as observed in previous studies [19,54,56,65,114,115,116]. Moreover, drought periods in the Wadi Djelfa-Hadjia and Wadi M’Zi sub-basins, representing semi-arid and arid climates, increased during the 2000s and 2010s.
4.3. Maximum Drought Duration
The maximum drought duration was analyzed according to the SPI and RDI for a 12-month timescale. Figure 2 shows the maximum drought durations recorded at the meteorological stations located inside and near the sub-basins.
For the Seybouse Maritime sub-basin, the average maximum drought duration was 51.5 months (4.29 years), 51 and 52 months for the SPI and RDI, respectively. The highest maximum drought duration was observed at the El Kala Station at 61 months (5.08 years), located in the eastern part of the sub-basin.
The maximum drought duration observed in Wadi Djelfa-Hadjia had an average of 56.25 months or about 4.69 years—55.25 and 57.25 months for the SPI and the RDI, respectively: 75 months (SPI) and 76 months (RDI) at Djelfa Station; 63 months (SPI) and 57 months (RDI) at Ain Ouessara Station; 51 months (SPI) and 62 months (RDI) at M’Sila Station; and 32 months (SPI) and 34 months (RDI) at Tiaret Station.
In the Wadi M’Zi sub-basin, the maximum drought duration mean value was 60.83 months (5.07 years)—61.33 and 60.33 months recorded by SPI and RDI, respectively. The Laghouat Station recorded the highest maximum duration with 92 months for both SPI and RDI; 55 months (SPI) and 50 months (RDI) were recorded at Ghardaia Station, and 37 months (SPI) and 39 months (RDI) were recorded at El Bayedh Station.
Overall, it can be concluded that the Wadi M’Zi sub-basin experienced the longest drought durations compared with the Wadi Djelfa-Hadjia and Seybouse Maritime sub-basins, which experienced the shortest drought durations among all the sub-basins.
4.4. Maximum Drought Magnitude
To compare the highest drought magnitudes, successive negative values below −1 for each location were added to determine the drought magnitude for each drought occurrence.
The maximum drought magnitude calculation showed that it ranged between −78.31 and −96.61 for the SPI and −79.98 and −100.55 for the RDI. The highest maximum intensities were recorded at El Kala Station. As shown in Figure 2a–e, drought events are characterized by aseverity ranging from moderate to extreme.
In Wadi Djelfa-Hadjia, the highest maximum drought magnitudes of −125.68 (SPI) and −116.85 (RDI) were recorded at Djelfa and M’sila Stations, respectively, while the lowest maximum drought magnitudes were recorded at Tiaret Station (−65.61 for SPI and −70.17for RDI).
The maximum drought magnitudes calculated for the Wadi M’Zi sub-basin were the highest compared with the two other sub-basins. The highest maximum magnitudes occurred at Laghouat Station with −144.93 for the SPI and −144.66 for the RDI.
4.5. Maximum Drought Intensity
A drought episode of high intensity often has a high severity and short duration [117]. The maximum intensities for each station computed based on the ratio of magnitude and duration for the SPI showed that the highest maximum intensity occurring in the Saybouse Maritime sub-basin was recorded at Annaba (Salines) Station at about −8.23, although the RDI recorded the highest value of about −9.09 at Souk Ahras Station.
In the Wadi Djelfa-Hadjia sub-basin, the maximum drought intensity ranged from −3.60 at Tiaret Station to −6.45 at Djelfa Station for the SPI. The RDI showed a maximum intensity ranging from −3.74 at Tiaret Station to −5.87 at Ain Ouessara Station.
For the Wadi M’Zi sub-basin, the calculated values of the maximum intensity allowed us to distinguish that the highest intensities belong to Laghouat Station for both drought indices (−6.25 and −6.05). El Bayedh Station had the lowest values, with maximum drought intensities varying between −3.78 for the RDI and −3.82 for the SPI.
4.6. Maximum Drought Frequency
Based on Table 4, which contains the drought frequency with moderate, severe and extreme classes, it can be concluded that the frequency of moderate droughts observed in Seybouse Maritime varied between 6.88% and 38.89% and between 7.08% and 25.00% at Annaba and Souk Ahras Stations for the SPI and RDI, respectively. The frequency of severe droughts ranged from 2.71% at Annaba Station for both indices to 22.22% for the SPI and 19.27% for the RDI at El Kala Station. For extreme drought events, the highest frequencies were observed at Skikda Station, at 22.22% and 17.24%.
Table 4.
Frequency of different drought categories of the SPI and RDI.
The highest frequency of moderate droughts was obtained for Tiaret Station for both the SPI and RDI (30.95% and 40.00%); however, the lowest frequency (5.21% and 8.54% for the SPI and RDI, respectively) was obtained for Djelfa Station in the Wadi Djelfa-Hadjia sub-basin. For severe droughts, the highest frequency was found for Ain Ouessara (36.36% for SPI) and M’Sila (23.08% for RDI) Stations. A high frequency of extreme droughts was found with a probability of 39.39% for the SPI at M’Sila Station and with a probability of 34.29% for the RDI at Tiaret Station.
In Wadi M’Zi, the highest frequency for moderate droughts was determined for Ghardaia Station (29.03% and 21.49% for the two indices, respectively). The severe drought frequency ranged between 4.38% (SPI) and 3.54% (RDI) at Laghouat Station and 16.47% (SPI) and 19.83% (RDI) at El Bayeth and Ghardaia Stations, respectively. Extreme drought frequency was found to be highest for El Bayedh Station, with 16.47% for the SPI and 17.65% for the RDI. Ghardia was found to display a 0.00% probability of a return period.
It can be concluded that the frequencies of moderate droughts are higher than those of severe and extreme droughts for the majority of the twelve meteorological stations for both indices, which means that the probability of occurrence or the return period of moderate droughts is the highest. The highest drought frequencies were obtained for moderate and severe drought events using the RDI and for extreme drought events using the SPI. The highest frequencies of moderate droughts were recorded at Souk Ahras and Tiaret, while the lowest were recorded at Annaba and Djelfa. Regarding severe events, the highest drought frequencies were recorded at Ain Ouessara using the SPI and at M’Sila using the RDI. The highest drought frequencies for extreme events were recorded at M’Sila using the SPI and at Tiaret using the RDI.
4.7. Longest and Strongest Dry Periods
The longest and the strongest (severe) dry periods were determined and are illustrated in Table 5. It can be seen that the longest and most severe drought event occurring in the last 40 years in the Seybouse Maritime sub-basin was found at El Kala Station, characterizing the period between 1998 and 2001 as having a maximum duration of 27 and 28 months and a maximum magnitude of −44.01 and −49.31 for the SPI and RDI, respectively.
Table 5.
Maximum drought duration, magnitude and intensity determined using the SPI and RDI.
The Wadi Djelfa-Hadjia sub-basin recorded the longest dry periods at Ain Ouessara during the periods 1997–2002 and 1997–2001, with maximum durations of 46 and 41 months for the SPI and RDI, respectively. The most severe dry period was observed during the periods 1997–2002 and 1997–2001, with maximum magnitudes of −83.78 (SPI) and −79.38 (RDI) at Ain Ouessara and M’Sila Stations.
In the Wadi M’Zi sub-basin, the longest dry period was found for Laghouat Station during the period 1997–2001 for both indices. The most severe dry period was recorded at El Bayedh Station during the period 1998–2001 with maximum magnitudes of −65.34 (SPI) and −71.38 (RDI).
Overall, it can be said that, for the three sub-basins, the longest and most severe drought events were found during almost the same period (1998–2001 ± 1 year).
4.8. Multivariate Statistical Analysis
A variety of multivariate statistical approaches, such as cluster analysis (CA), factor analysis (FA), principal components analysis (PCA) and discriminant analysis (DA), are now being used for reliable data analysis, interpretation and impact factor determination [118].
Principal component analysis (PCA) was undertaken to investigate the correlations between the analyzed variables (mean precipitation, drought indicators, and any additional explanatory factors). PCA has been used in multiple drought studies as a tool for studying and comprehending the effect of various components [119].
Principal component analysis (PCA) assisted in data reduction by evaluating clustering/similarities in the datasets, the consistency/overlap of the clusters and the causes of variation across parameters [120].
The Spearman correlation matrix was calculated to identify relationships and differences between the meteorological stations considered as individuals and the following chosen variables: the latitude of the station (UTM coordinate), the longitude (UTM coordinate), the altitude (m), the average monthly precipitation (mm/month), the average annual precipitation (mm/year), the average monthly potential evapotranspiration (PET) (mm/month), the average annual potential evapotranspiration (PET) (mm/year), the SPI average, the RDI average, the maximum drought duration for the SPI, the maximum drought duration for the RDI, the maximum drought magnitude for the SPI, the maximum drought magnitude for the RDI, the maximum drought intensity for the SPI, the maximum drought intensity for the RDI, the maximum drought frequency for the SPI and the maximum drought frequency for RDI. The selected variables are plotted on the main components, PC1 and PC2. PC1 versus PC2 gathered a cumulative variance of 70.47% (Figure 3).
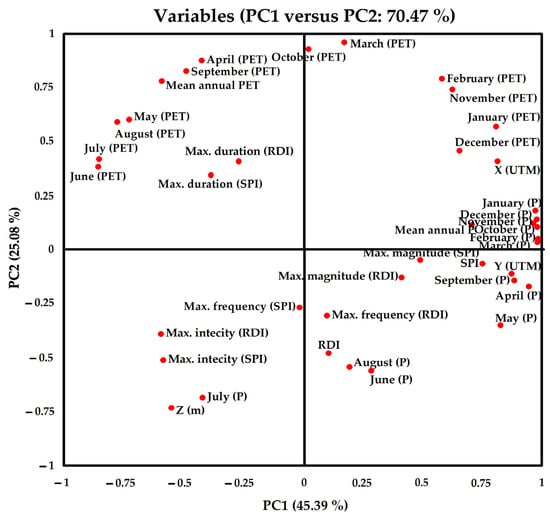
Figure 3.
Biplot of the first component (PC1) and the second component (PC2) of the selected variables. X (UTM), Y (UTM), and Z (m): the coordinates and altitude of the meteorological stations, Mean annual P or PET: the average annual precipitation or potential evapotranspiration, January (P) or (PET),…, December (P) or (PET): the average monthly precipitation and evapotranspiration, SPI and RDI: average SPI and RDI, Max. duration, magnitude, intensity, and frequency (SPI) or (RDI): maximum duration, magnitude, intensity, and frequency for the SPI or RDI.
The first principal component, PC1 (Figure 3), showed that the cluster composed of monthly autumn and winter precipitation, meteorological stations and the SPI is highly negatively correlated with monthly summer PET and the maximum intensity for the SPI and RDI. PC2 (Figure 3) revealed a negative correlation between the annual and monthly autumn and spring PET cluster and the monthly summer precipitation (June and July), elevation and RDI.
It can be concluded that, while precipitation is highly influenced by the wet seasons (autumn and winter), the annual potential evapotranspiration is governed by the dry season.
4.9. Drought Hazard, Vulnerability and Risk Assessment
Two categories of the Drought Hazard Index, moderately low hazards (<2) and moderately high hazards (>2) [23,74], were adopted.
4.9.1. Seybouse Maritime
The Seybouse Maritime sub-basin was characterized by a moderately low hazard throughout the observation period (1979–2019) (Figure 4).
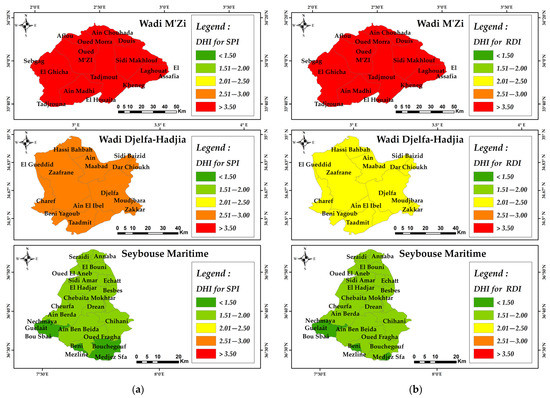
Figure 4.
Spatiotemporal distribution of the Drought Hazard Index based on (a) SPI and (b) RDI.
The vulnerability distribution map (Figure 5) was generated based on socioeconomic aspects, and it shows that very low vulnerability (<1.50) was observed in Mdjez Sfa, Beni Mezline, Oued Fragha, Guelâat Bou Sbâa, Nechmaya, Chihani, Ain Berda, Cheurfa, Oued El Aneb and Seraidi in the Seybouse Maritime sub-basin. The following were characterized by low vulnerability (1.51–2.00): Bouchegouf, Djeballah Khemissi, Ain Ben Beida, Chebaita Mokhtar and El Hadjar. Moderate (2.01–2.50) values of vulnerability were observed in Drean, Echat, Sidi Amar and El Bouni. Besbes was the only province characterized by severe vulnerability (2.51–3.00).
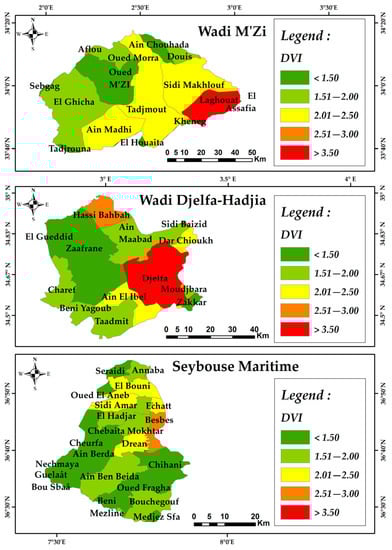
Figure 5.
Spatial distribution of the Drought Vulnerability Index.
According to Figure 6, 20.50% of the Seybouse Maritime sub-basin’s total surface area (Mdjez Sfa, Beni Mezline, Oued Fragha, Guelâat Bou Sbâa and Nechmaya) was characterized by very low risk. The following were characterized by low risk: 75.60% (Bouchegouf, Ain Ben Beida, Chihani, Drean, Chebaita Mokhtar, El Hadjar, Echatt, Sidi Amar, Oued El Aneb, El Bouni, Seraidi and Annaba). Moderate risk was recorded in Besbes Province (3.90%).
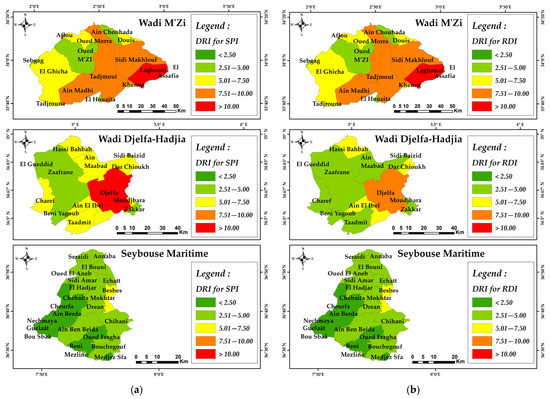
Figure 6.
Spatiotemporal distribution map of Drought Risk Index based on (a) SPI and (b) RDI.
4.9.2. Wadi Djelfa-Hadjia
Figure 4 shows that the drought hazard in the Wadi Djelfa-Hadjia sub-basin is considered moderately high (severe and moderate hazards using the SPI and RDI, respectively).
Very low vulnerability (<1.50) was found in Zakkar, Zaafrane and El Gueddid in Wadi Djelfa-Hadjia Low vulnerability (1.51–2.00) was observed in Moudjbara, Taadmit, Beni Yagoub, Charef and Ain Maabad. The following demonstrated moderate vulnerability (2.01–2.50): Ain El Ibel and Dar Chioukh. Hassi Bahbah was characterized by severe vulnerability (2.51–3.00), and Djelfa was characterized by extreme vulnerability (>3.00) (Figure 5).
Figure 6 shows that 36.16% of the total area (Zakkar, Beni Yagoub, Zaafrane and El Gueddid) of Wadi Djelfa-Hadjia using the SPI (Figure 6) and 65.12% (Zakkar, Moudjbara, Taadmit, Beni Yagoub, Zaafrane, Ain Maabad, Charef and El Gueddid) using the RDI (Figure 6) were characterized by low risk. The following were characterized by a moderate risk Moudjbara, Ain El Ibel, Taadmit, Dar Chioukh, Ain Maabad, Charef and Hassi Bahbah (43.66%) using the SPI (Figure 6), and Ain El Ibel, Dar Chioukh and Hassi Bahbah (14.70%) were characterized using the RDI (Figure 6b). Severe and extreme risk were found in Djelfa Province (20.19%) using the RDI (Figure 6b) and SPI (Figure 6), respectively.
4.9.3. Wadi M’Zi
In the Wadi M’Zi sub-basin, a moderately high hazard was observed using both indices (extreme hazard) (Figure 4).
From Figure 5, it is clear that very low vulnerability (<1.50) was found for Sebgag, Tadjrouna, Oued M’Zi, El Houaita and Ain Chouhada in Wadi M’Zi. Low vulnerability (1.51–2.00) characterized El Ghicha, Oued Morra, Douis and Kheng. Moderate vulnerability (2.01–2.50) was observed in Ain Madhi, Tajmout, Sidi Makhlouf and El Assafia. Aflou and Laghouat were characterized by severe (2.51–3.00) and extreme (>3.00) vulnerability, respectively.
Based on Figure 6, the following were characterized by low risk in Wadi M’Zi: Oued M’Zi, El Houaita and Ain Chouhada. These represent 16.26% of the total area. Moderate risk was found for El Ghicha, Tadjrouna, Oued Morra, Douis and Kheneg, covering 27.73% of the sub-basin area. Ain Madhi, Tajmout, Sidi Makhlouf and El Assafia (48.11%) were characterized by severe risk. Aflou and Laghouat (7.90%) were found to be characterized by extreme risk.
5. Discussion
Based on the SPI and RDI and their high correlation, which demonstrates their suitability for determining drought characteristics, the results of this study suggest that the RDI recorded the longest drought durations and the strongest magnitudes; meanwhile, the highest intensities were recorded via the SPI [111].
The spatiotemporal drought distributions vary from station to station and from sub-basin to sub-basin, as well as with time. These results are in accordance with those found by Fellag et al. [56], who concluded that spatiotemporal drought variations are mainly due to extensive fluctuations in precipitation, which may vary greatly from one sub-basin to another and from one year to another. Overall, drought events that affected the study area may have been related to rainfall shortages [121], which are affected by the region’s physical location with respect to the Atlantic Ocean, the Mediterranean Sea and the Atlas Mountain Range [122] and by the drought affecting the African Sahel region since 1980 [123].
The drought physical characteristics, namely, the drought duration, magnitude, intensity and frequency, showed the following: firstly, the maximum durations and magnitudes increased toward the south (i.e., toward the semi-arid and arid climates), which can be explained by the effect of the climate type on these two drought physical characteristics; secondly, the RDI recorded higher maximum durations and magnitudes than the SPI. Almost all of the highest maximum drought frequencies were recorded in semi-arid and arid climates; however, Souk Ahras Station, which also recorded the highest maximum drought frequencies for moderate droughts, is near the Seybouse Maritime sub-basin and, at the same time, has a sub-humid climate. Moreover, the spatial distribution of drought frequency was more likely (shorter return periods) with severe and extreme droughts [56,65,124], although such high intensities were not related to climate types.
The principal component analysis (PCA) revealed a strong positive correlation between the SPI and the rainy months, contradicting the results presented by Gader et al. [114], which may be related to the low precipitation quantity characterizing semi-arid and arid regions. Even though the PET increase during spring and autumn should be correlated with high RDI values, the RDI decrease reveals the impact of autumn and spring rainfall on this index.
The Drought Hazard Index suggests that drought hazards concern two climatic zones, namely, semi-arid and arid climates, as represented by the Wadi Djelfa-Hadjia and Wadi M’Zi sub-basins, respectively (Figure 4). More precisely, a drought hazard concerns water resource shortages resulting in hydrologic drought. The drought hazard maps that reflect the drought characteristics match the different climatic zones studied, which means that droughts in Algeria depend on the climate type.
However, drought vulnerability is governed by the dominant characteristic of each district. Rural regions characterized by agricultural activities are dependent on irrigation water. Urban regions characterized by their population density and industrial activities are related to the water demand of the municipality or industries.
By developing risk maps, it seems clear that vulnerability represented by socioeconomic factors controls drought risk [109]. Even if a region is not affected by the physical characteristics of drought, socioeconomic factors make it vulnerable to drought and vice versa.
It can be noticed that drought hazard, vulnerability and risk in different climatic zones in Algeria have not been assessed by previous studies. Therefore, this study highlighted the impact of socioeconomic factors on risk, which can be helpful for decision-makers to develop strategies for better managing water resources, especially in provinces with high risk [109].
6. Conclusions
In this paper, the spatial and temporal assessment of drought hazard, vulnerability and risk is performed. For this purpose, the SPI and RDI were used for a 12-month timescale and chosen to evaluate drought characteristics (duration, magnitude, intensity and frequency). The Drought Hazard Index (DHI) and the Drought Vulnerability Index (DVI) determinations were based on drought characteristics and the socioeconomic factors of the three studied regions, respectively. Their mapping was achieved using a GIS.
The following conclusions can be made in light of the results:
- (1)
- The correlation between the SPI and RDI based on the coefficient of determination (R2) and the root-mean-square error (RMSE) demonstrated their suitability for assessing the drought in the study area.
- (2)
- The spatiotemporal drought distributions vary with time from station to station and from sub-basin to sub-basin.
- (3)
- The study findings indicate that, while the RDI recorded the longest drought durations and the strongest magnitudes, highest severities and highest drought frequencies for moderate and severe drought events, the SPI recorded the highest frequencies for extreme drought events.
- (4)
- The increasing maximum durations and magnitudes toward the south provided evidence of the climate-type-specific effect on these two drought physical characteristics.
- (5)
- The maximum drought frequencies were more likely (with shorter return periods) with severe and extreme droughts, although such high intensities were not related to climate type.
- (6)
- SPI was not influenced by wet season rainfall because of the low precipitation quantities characterizing the semi-arid and arid climates. Higher ETP did not affect the RDI, which is related to the spring and autumn precipitation.
- (7)
- The drought hazard maps that reflect the drought characteristics match the different climatic zones studied, which means that droughts in Algeria depend on the climate type.
- (8)
- The vulnerability to drought depends on the dominant characteristic of each municipality, namely, the water demand of the municipality and for irrigation or industries.
- (9)
- The drought risk index maps revealed that drought vulnerability controls the drought risk. Furthermore, which of Algeria’s provinces are most vulnerable to drought must be determined to develop strategies to mitigate socioeconomic impacts.
- (10)
- Finally, the limitations of this study are that only two meteorological indices and a single 12-month timescale were used, as well as the limited area of the three chosen sub-basins, which can be extended in future works and can be replaced by enlarging the scale of the study in order to map the spatiotemporal variations of droughts in different climatic zones with more than two meteorological indices.
Author Contributions
Conceptualization, N.H.; methodology, N.H., A.F., S.K. and M.A.; software, N.H., A.F. and S.K.; validation, N.H., A.F. and A.B.; formal analysis, N.H.; investigation, N.H. and N.B.; resources, N.H., M.A. and S.K.; data curation, N.H., A.F. and A.B.; writing—original draft preparation, N.H., A.F. and S.K.; writing—review and editing, N.H., A.F. and S.K.; visualization, N.H.; supervision, N.H. and N.B. All authors have read and agreed to the published version of the manuscript.
Funding
This research received no external funding.
Institutional Review Board Statement
Not applicable.
Informed Consent Statement
Not applicable.
Data Availability Statement
The data presented in this study are available upon request from the corresponding authors.
Acknowledgments
The authors wish to thank the peer reviewers for improving this manuscript.
Conflicts of Interest
The authors declare no conflict of interest.
References
- Savari, M.; Damaneh, H.E.; Damaneh, H.E. Drought vulnerability assessment: Solution for risk alleviation and drought management among Iranian farmers. Int. J. Disaster Risk Reduct. 2022, 67, 102654. [Google Scholar] [CrossRef]
- Sharafi, L.; Zarafshani, K.; Keshavarz, M.; Azadi, H.; Van Passel, S. Drought risk assessment: Towards drought early warning system and sustainable environment in western Iran. Ecol. Indic. 2020, 114, 106276. [Google Scholar] [CrossRef]
- Kamruzzaman, M.; Almazroui, M.; Salam, M.A.; Mondol, M.A.H.; Rahman, M.M.; Deb, L.; Kundu, P.K.; Uz Zaman, M.A.; Islam, A.R.M.T. Spatiotemporal drought analysis in Bangladesh using the standardized precipitation index (SPI) and standardized precipitation evapotranspiration index (SPEI). Sci. Rep. 2022, 12, 20694. [Google Scholar] [CrossRef] [PubMed]
- Niaz, R.; Almazah, M.M.A.; Al-Duais, F.S.; Iqbal, N.; Khan, D.M.; Hussain, I. Spatiotemporal analysis of meteorological drought variability in a homogeneous region using standardized drought indices. Geomat. Nat. Hazards Risk 2022, 13, 1457–1481. [Google Scholar] [CrossRef]
- Zarafshani, K.; Sharafi, L.; Azadi, H.; Van Passel, S. Vulnerability assessment models to drought: Toward a conceptual framework. Sustainability 2016, 8, 588. [Google Scholar] [CrossRef]
- Mishra, A.K.; Singh, V.P. A review of drought concepts. J. Hydrol. 2010, 391, 202–216. [Google Scholar] [CrossRef]
- Du, E.; Chen, F.; Jia, H.; Wang, L.; Yang, A. Spatiotemporal evolution and hysteresis analysis of drought based on rainfed-irrigated arable land. Remote Sens. 2023, 15, 1689. [Google Scholar] [CrossRef]
- Xu, K.; Wu, C.; Zhang, C.; Hu, B.X. Uncertainty assessment of drought characteristics projections in humid subtropical basins in China based on multiple CMIP5 models and different index definitions. J. Hydrol. 2021, 600, 126502. [Google Scholar] [CrossRef]
- Haile, G.G.; Tang, Q.; Li, W.; Liu, X.; Zhang, X. Drought: Progress in broadening its understanding. Wiley Interdiscip. Rev. Water 2020, 7, e1407. [Google Scholar] [CrossRef]
- Nabipour, N.; Dehghani, M.; Shamshirband, S.; Mosavi, A. Short-term hydrological drought forecasting based on different nature-inspired optimization algorithms hybridized with artificial neural networks. IEEE Access 2019, 8, 15210–15222. [Google Scholar] [CrossRef]
- Escalante-Sandoval, C.; Nuñez-Garcia, P. Meteorological drought features in northern and northwestern parts of Mexico under different climate change scenarios. J. Arid Land 2017, 9, 65–75. [Google Scholar] [CrossRef]
- Zargar, A.; Sadiq, R.; Naser, B.; Khan, F.I. A review of drought indices. Environ. Rev. 2011, 19, 333–349. [Google Scholar] [CrossRef]
- Moazzam, M.F.U.; Rahman, G.; Munawar, S.; Farid, N.; Lee, B.G. Spatiotemporal Rainfall Variability and Drought Assessment during Past Five Decades in South Korea Using SPI and SPEI. Atmosphere 2022, 13, 292. [Google Scholar] [CrossRef]
- Bouabdelli, S.; Meddi, M.; Zeroual, A.; Alkama, R. Hydrological drought risk recurrence under climate change in the karst area of Northwestern Algeria. J. Water Clim. Chang. 2020, 11, 164–188. [Google Scholar] [CrossRef]
- Araneda-Cabrera, R.J.; Bermúdez, M.; Puertas, J. Benchmarking of drought and climate indices for agricultural drought monitoring in Argentina. Sci. Total Environ. 2021, 790, 148090. [Google Scholar] [CrossRef] [PubMed]
- Wang, T.; Tu, X.; Singh, V.P.; Chen, X.; Lin, K.; Lai, R.; Zhou, Z. Socioeconomic drought analysis by standardized water supply and demand index under changing environment. J. Clean. Prod. 2022, 347, 131248. [Google Scholar] [CrossRef]
- Swain, S.; Mishra, S.K.; Pandey, A. A detailed assessment of meteorological drought characteristics using simplified rainfall index over Narmada River Basin, India. Environ. Earth Sci. 2021, 80, 221. [Google Scholar] [CrossRef]
- Hosseini, A.; Ghavidel, Y.; Khorshiddoust, A.M.; Farajzadeh, M. Spatio-temporal analysis of dry and wet periods in Iran by using Global Precipitation Climatology Center-Drought Index (GPCC-DI). Theor. Appl. Climatol. 2021, 143, 1035–1045. [Google Scholar] [CrossRef]
- Zerouali, B.; Chettih, M.; Abda, Z.; Mesbah, M.; Guimarães Santos, C.A.; Brasil Neto, R.M.; Marques da Silva, R. Spatiotemporal meteorological drought assessment in a humid Mediterranean region: Case study of the Oued Sebaou basin (northern central Algeria). Nat. Hazards 2021, 108, 689–709. [Google Scholar] [CrossRef]
- Niemeyer, S. New drought indices. In Proceedings of the International Conference Drought Management: Scientific and Technological Innovations, Zaragoza, Spain, 12–14 June 2008. [Google Scholar]
- Eris, E.; Cavus, Y.; Aksoy, H.; Burgan, H.L.; Aksu, H.; Boyacioglu, H. Spatiotemporal analysis of meteorological drought over Kucuk Menderes River Basin in the Aegean Regionof Turkey. Theor. Appl. Climatol. 2020, 142, 1515–1530. [Google Scholar] [CrossRef]
- Ali, Z.; Hussain, I.; Faisal, M.; Nazir, H.M.; Abd-elMoemen, M.; Hussain, T.; Shamsuddin, S. A Novel multi-scalar drought index for monitoring drought: The Standardized Precipitation Temperature Index. Water Resour. Manag. 2017, 31, 4957–4969. [Google Scholar] [CrossRef]
- Maccioni, P.; Kossida, M.; Brocca, L.; Moramarco, T. Assessment of the drought hazard in the Tiber River basin in central Italy and a comparison of new and commonly used meteorological indicators. J. Hydrol. Eng. 2015, 20, 05014029. [Google Scholar] [CrossRef]
- Fleig, A.K.; Tallaksen, L.M.; Hisdal, H.; Hannah, D.M. Regional hydrological drought in northwestern Europe: Linking a new regional drought Area Index with weather types. Hydrol. Process. 2011, 25, 1163–1179. [Google Scholar] [CrossRef]
- Fleig, A.K.; Tallaksen, L.M.; Hisdal, H.; Stahl, K.; Hannah, D.M. Inter-comparison of weather and circulation type classifcations for hydrological drought development. Phys. Chem. Earth 2010, 35, 507–515. [Google Scholar] [CrossRef]
- Vicente-Serrano, S.M.; Beguería, S.; López-Moreno, J.I. A multiscalar drought index sensitive to global warming: The standardized precipitation evapotranspiration index. J. Clim. 2010, 23, 1696–1718. [Google Scholar] [CrossRef]
- Nalbantis, I.; Tsakiris, G. Assessment of Hydrological Drought Revisited. Water Resour. Manag. 2009, 23, 881–897. [Google Scholar] [CrossRef]
- Tsakiris, G.; Vangelis, H. Establishing a drought index incorporating evapotranspiration. Eur. Water 2005, 9, 3–11. [Google Scholar]
- Weghorst, K. The Reclamation Drought Index: Guidelines and practical applications. In Proceedings of the North American Water and Environment Congress & Destructive Water, Anaheim, CA, USA, 22–28 June 1996. [Google Scholar]
- McKee, T.B.; Doesken, N.J.; Kleist, J. drought monitoring with multiple time scales. In Proceedings of the 9th conference on applied climatology, Dallas, Texas, USA, 15–20 January 1995. [Google Scholar]
- McKee, T.B.; Doesken, N.J.; Kleist, J. The relationship of drought frequency and duration to time scales. In Proceedings of the 8th Conference on Applied Climatology, Anaheim, California, USA, 17–22 January 1993. [Google Scholar]
- Shukla, S.; Wood, A.W. Use of a standardized runoff index for characterizing hydrologic drought. Geophys. Res. Lett. 2008, 35, L02405. [Google Scholar] [CrossRef]
- Werick, W.J.; Willeke, G.E.; Guttman, N.B.; Hosking, J.R.M.; Wallis, J.R. National drought atlas developed. EOS Trans. 1994, 75, 89–90. [Google Scholar] [CrossRef]
- Gommes, R.; Petrassi, F. Rainfall Variability and Drought in Sub-Saharan Africa Since 1960; FAO Agrometeorology Series Working Paper (FAO): No. 9; Food and Agriculture Organization, Rome, Italy, 1994. Available online: https://www.fao.org/3/au042e/au042e.pdf (accessed on 24 August 2019).
- Shafer, B.A.; Dezman, L.E. Development of a Surface Water Supply Index (SWSI) to assess the severity of drought conditions in snowpack runoff areas. In Proceedings of the 50th Annual Western Snow Conference, Reno, NV, USA, 19–23 April 1982. [Google Scholar]
- Bhalme, H.N.; Mooley, D.A. Large-scale droughts/floods and monsoon circulation. Mon. Weather Rev. 1980, 108, 1197–1211. [Google Scholar] [CrossRef]
- Palmer, W.C. Keeping track of crop moisture conditions, nationwide: The new crop moisture index. Weatherwise 1968, 21, 156–161. [Google Scholar] [CrossRef]
- Van Rooy, M.P. A rainfall anomaly index independent of time and space. Notos 1965, 14, 43–48. [Google Scholar]
- Deng, H.; Cheng, F.; Wang, J.; Wang, C. Monitoring of drought in central Yunnan, china based on TVDI model. J. Arid. Environ. 2021, 30, 3511–3523. [Google Scholar] [CrossRef] [PubMed]
- Saifullah, M.; Liu, S.; Adnan, M.; Zaman, M.; Muhammad, S.; Babur, M.; Zhu, Y.; Wu, K. Assessment of Spatial and Temporal Pattern of Hydrological Droughts in the Upper Indus Basin, Pakistan. Pol. J. Environ. Stud. 2021, 30, 4633–4645. [Google Scholar] [CrossRef] [PubMed]
- Brasil Neto, R.M.; Guimarães Santos, C.A.; Medeiros do Nascimento, T.V.; Marques da Silva, R.; Costa dos Santos, C.A. Evaluation of the TRMM Product for Monitoring Drought over Paraíba State, Northeastern Brazil: A Statistical Analysis. Remote Sens. 2020, 12, 2184. [Google Scholar] [CrossRef]
- Hina, S.; Saleem, F. Historical analysis (1981−2017) of drought severity and magnitude over a predominantly arid region of Pakistan. Clim. Res. 2019, 78, 189–204. [Google Scholar] [CrossRef]
- Huang, J.; Zhuo, W.; Li, Y.; Huang, R.; Sedano, F.; Su, W.; Dong, J.; Tian, L.; Huang, Y.; Zhu, D.; et al. Comparison of three remotely sensed drought indices for assessing the impact of drought on winter wheat yield. Int. J. Digit. Earth 2018, 13, 504–526. [Google Scholar] [CrossRef]
- Yan, G.; Wu, Z.; Li, D.; Xiao, H. A comparative frequency analysis of three standardized drought indices in the Poyang Lake basin, China. Nat. Hazards 2018, 91, 353–374. [Google Scholar] [CrossRef]
- Vangelis, H.; Kopsiaftis, G.; Tigkas, D.; Christelis, V. Coastal aquifer response to drought scenarios: The case of Rhodes island. Eur. Water 2017, 60, 219–225. [Google Scholar]
- Khan, M.I.; Liu, D.; Fua, Q.; Faiz, M.A. Detecting the persistence of drying trends under changing climate conditions using four meteorological drought indices. Meteorol. Appl. 2017, 25, 184–194. [Google Scholar] [CrossRef]
- Kopsiaftis, G.; Tigkas, D.; Christelis, V.; Vangelis, H. Assessment of drought impacts on semi-arid coastal aquifers of the Mediterranean. J. Arid. Environ. 2017, 137, 7–15. [Google Scholar] [CrossRef]
- Elkollaly, M.; Khadr, M.; Zeidan, B. Drought analysis in the Eastern Nile basin using the standardized precipitation index. Environ. Sci. Pollut. Res. 2017, 25, 30772–30786. [Google Scholar] [CrossRef] [PubMed]
- Surendran, U.; Kumar, V.; Ramasubramoniam, S.; Raja, P. Development of drought indices for semi-arid region using drought indices calculator (drinc)—A case study from Madurai district, a semi-arid region in India. Water Resour. Manag. 2017, 31, 3593–3605. [Google Scholar] [CrossRef]
- Thomasa, T.; Jaiswalb, R.K.; Galkatec, R.V.; Nayak, T.R. Reconnaissance drought index based evaluation of meteorological drought characteristics in Bundelkhand. Procedia Technol. 2016, 24, 23–30. [Google Scholar] [CrossRef]
- Soro, G.E.; Anouman, D.G.L.; Goula BI, T.A.; Srohorou, B.; Savane, I. Caractérisation des séquences de sécheresse météorologique a diverses échelles de temps en climat de type soudanais: Cas de l’extrême Nord-Ouest de la cote d’Ivoire. Larhyss J. 2014, 18, 107–124. [Google Scholar]
- Yaddanapudi, R.; Mishra, A.K. Compound impact of drought and COVID-19 on agriculture yield in the USA. Sci. Total Environ. 2022, 807, 150801. [Google Scholar] [CrossRef]
- Djellouli, F.; Bouanani, A.; Babahamed, K. Climate change: Assessment and monitoring of meteorological and hydrological drought of Wadi El Hammam basin (NW- ALGERIA). J. Fundam. Appl. Sci. 2016, 8, 1037–1053. [Google Scholar] [CrossRef]
- Elouissi, A.; Benzater, B.; Dabanli, I.; Habi, M.; Harizia, A.; Hamimed, A. Drought investigation and trend assessment in Macta watershed (Algeria) by SPI and ITA methodology. Arab. J. Geosci. 2021, 14, 1329. [Google Scholar] [CrossRef]
- Ballah, A.; Benaabidate, L. Assessing the performance of various meteorological drought indices in capturing historic droughts in the south of Algeria. Arab. J. Geosci. 2021, 14, 1289. [Google Scholar] [CrossRef]
- Fellag, M.; Achite, M.; Wałęga, A. Spatial-temporal characterization of meteorological drought using the standardized precipitation index. Case study in Algeria. Acta Sci. Pol. Form. Circumiectus 2021, 20, 19–31. [Google Scholar] [CrossRef]
- Habibi, B.; Meddi, M. Meteorological drought hazard analysis of wheat production in the semi-arid basin of Cheliff–Zahrez Nord, Algeria. Arab. J. Geosci. 2021, 14, 1045. [Google Scholar] [CrossRef]
- Radia, G.; Kamila, B.H.; Abderrazak, B. Highlighting drought in the Wadi Lakhdar Watershed Tafna, Northwestern Algeria. Arab. J. Geosci. 2021, 14, 984. [Google Scholar] [CrossRef]
- Elhoussaoui, A.; Zaagane, M.; Benaabidate, L. Comparison of various drought indices for assessing drought status of the Northern Mekerra watershed, Northwest of Algeria. Arab. J. Geosci. 2021, 14, 915. [Google Scholar] [CrossRef]
- Habibi, B.; Meddib, M.; Torfs, P.J.J.F.; Remaound, M.; Van Lanen, H.A.J. Characterisation and prediction of meteorological drought using stochastic models in the semi-arid Chéliff–Zahrez basin (Algeria). J. Hydrol. Reg. Stud. 2018, 16, 15–31. [Google Scholar] [CrossRef]
- Merabti, A.; Martins, D.S.; Meddi, M.; Pereira, L.S. Spatial and Time Variability of Drought Based on SPI and RDI with Various Time Scales. Water Resour. Manag. 2018, 32, 1087–1100. [Google Scholar] [CrossRef]
- Smadhi, D.; Zella, L.; Bachir, H. Droughts in semi-arid cereal regions of Algeria. J. Fundam. Appl. Sci. 2017, 9, 1063–1073. [Google Scholar] [CrossRef]
- Khezazna, A.; Amarchi, H.; Derdous, O.; Bousakhria, F. Drought monitoring in the Seybouse basin (Algeria) over the last decades. J. Water Land Dev. 2017, 33, 79–88. [Google Scholar] [CrossRef]
- Hassini, N.; Belaid, A.; Dobbi, A. Trends of precipitation and drought on the Algerian littoral: Impact on the water reserves. Intl. J. Water Resour. Arid Environ. 2011, 1, 271–276. [Google Scholar]
- Achite, M.; Wałęga, A.; Toubal, A.K.; Mansour, H.; Krakauer, N. Spatiotemporal Characteristics and Trends of Meteorological Droughts in the Wadi Mina Basin, Northwest Algeria. Water 2021, 13, 3103. [Google Scholar] [CrossRef]
- Derdous, O.; Bouamrane, A.; Mrad, D. Spatiotemporal analysis of meteorological drought in a Mediterranean dry land: Case of the Chelif basin–Algeria. Model Earth Syst. Environ. 2021, 7, 135–143. [Google Scholar] [CrossRef]
- Mellak, S.; Souag-Gamane, D. Spatiotemporal analysis of maximum drought severity using Copulas in Northern Algeria. J. Water Clim. Chang. 2020, 11, 68–84. [Google Scholar] [CrossRef]
- Achour, K.; Meddi, M.; Zeroual, A.; Bouabdelli, S.; Maccioni, P.; Moramarco, T. Spatiotemporal analysis and forecasting of drought in the plains of northwestern Algeria using the standardized precipitation index. J. Earth Syst. Sci. 2020, 129, 42. [Google Scholar] [CrossRef]
- Jones, R.; Boer, R. Assessing Current Climate Risks. Adaptation Policy Framework: A Fuide for Policies to Facilitate Adaptation to Climate Change. Available online: https://www4.unfccc.int/sites/NAPC/Country%20Documents/General/apf%20technical%20paper04.pdf (accessed on 12 December 2021).
- Brooks, N. Vulnerability, Risk and Adaptation: A Conceptual Framework; Working Paper 38; Tyndall Centre for Climate Change Research, University of East Anglia: Norwich, UK, 2003. [Google Scholar]
- Stenchion, P. Development and disaster management. Aust. J. Emerg. Manag. 1997, 12, 40–44. [Google Scholar]
- Brooks, N.; Adger, W.N.; Kelly, P.M. The determinants of vulnerability and adaptive capacity at the national level and the implications for adaptation. Glob. Environ. Chang. 2005, 15, 151–163. [Google Scholar] [CrossRef]
- Kim, J.E.; Yu, J.; Ryu, J.H.; Lee, J.H.; Kim, T.W. Assessment of regional drought vulnerability and risk using principal component analysis and a Gaussian mixture model. Nat. Hazards 2021, 109, 707–724. [Google Scholar] [CrossRef]
- Singh, G.R.; Jain, M.K.; Gupta, V. Spatiotemporal assessment of drought hazard, vulnerability and risk in the Krishna River basin, India. Nat. Hazards 2019, 99, 611–635. [Google Scholar] [CrossRef]
- Rajsekhar, D.; Singh, V.P.; Mishra, A.K. Integrated drought causality, hazard, and vulnerability assessment for future socioeconomic scenarios: An information theory perspective. J. Geophys. Res. Atmos. 2015, 120, 6346–6378. [Google Scholar] [CrossRef]
- Zhang, Q.; Sun, P.; Li, J.; Xiao, M.; Singh, V.P. Assessment of drought vulnerability of the Tarim River basin, Xinjiang, China. Theor. Appl. Climatol. 2014, 121, 337–347. [Google Scholar] [CrossRef]
- Kim, H.; Park, J.; Yoo, J.; Kim, T.W. Assessment of drought hazard, vulnerability, and risk: A case study for administrative districts in South Korea. J. Hydro-Environ. Res. 2013, 9, 28–35. [Google Scholar] [CrossRef]
- Bin, H.; Lü, A.; Wu, J.; Zhao, L.; Liu, M. Drought hazard assessment and spatial characteristics analysis in China. J. Geogr. Sci. 2011, 21, 235–249. [Google Scholar]
- Shahid, S.; Behrawan, H. Drought risk assessment in the western part of Bangladesh. Nat. Hazards 2008, 46, 391–413. [Google Scholar] [CrossRef]
- Louamri, A. Le Bassin-Versant de la Seybouse (Algérie Orientale): Hydrologie et Aménagement des Eaux. Ph.D. Thesis, Constantine 1 University, Constantine, Algeria, 2013. [Google Scholar]
- Edwards, D.C.; McKee, T.B. Characteristics of 20th century drought in the United States at multiple scales. Atmos. Sci. Pap. 1997, 634, 1–30. [Google Scholar]
- Thom, H.C.S. A note on the gamma distribution. Mon. Weather Rev. 1958, 86, 117–122. [Google Scholar] [CrossRef]
- Guttman, N.B. On the sensitivity of sample L moments to sample size. J. Clim. 1994, 7, 1026–1029. [Google Scholar] [CrossRef]
- Khan, M.I.; Zhu, X.; Jiang, X.; Saddique, Q.; Saifullah, M.; Niaz, Y.; Sajid, M. Projection of future drought characteristics under multiple drought indices. Water 2021, 13, 1238. [Google Scholar] [CrossRef]
- Nasirudeen, A.F.; Kabo-bah, A.T.; Amo-Boateng, M.; Karthikeyan, B. Analysis of drought patterns in the Tano river basin of Ghana. Sci. Afr. 2021, 13, e00883. [Google Scholar] [CrossRef]
- Tan, M.L.; Chua, V.P.; Li, C.; Brindha, K. Spatiotemporal analysis of hydro-meteorological drought in the Johor River Basin, Malaysia. Theoret. Appl. Climatol. 2019, 135, 825–837. [Google Scholar] [CrossRef]
- Haied, N.; Foufou, A.; Khadri, S.; Latifi, S.; Chaab, S.; Mekkaoui, F.Z. Drought monitoring till 2100 using future projected climate in Wadi M’Zi sub-basin. In Proceedings of the Séminaire International sur l’Hydrogéologie et l’Environnement, Ouargla, Algeria, 12–14 March 2019. [Google Scholar]
- Vangelis, H.; Tigkas, D.; Tsakiris, G. The effect of PET method on Reconnaissance Drought Index (RDI) calculation. J. Arid. Environ. 2013, 88, 30–140. [Google Scholar] [CrossRef]
- Zarch, M.A.A.; Malekinezhad, H.; Mobin, M.H.; Dastorani, M.T.; Kousari, M.R. Drought monitoring by Reconnaissance Drought Index (RDI) in Iran. Water Resour. Manag. 2011, 25, 3485–3504. [Google Scholar] [CrossRef]
- Shahidian, S.; Serralheiro, R.; Serrano, J.; Teixeira, J.; Haie, N.; Santos, F. Hargreaves and other reduced-set methods for calculating Evapotranspiration. In Evapotranspiration-Remote Sensing and Modeling; Irmak, A., Ed.; IntechOpen: London, UK, 2012; pp. 59–80. [Google Scholar]
- Thornthwaite, C.W. An approach toward a rational classification of climate. Geogr. Rev. 1948, 38, 55–94. [Google Scholar] [CrossRef]
- Zarei, A.R.; Mahmoudi, M.R. Evaluation of changes in RDIst index effected by different Potential Evapotranspiration calculation methods. Water Resour. Manag. 2017, 31, 4981–4999. [Google Scholar] [CrossRef]
- Salas, J. Analysis and modeling of hydrologic time series. In Handbook of Hydrology; McGraw-Hill: New York, NY, USA, 1993; pp. 1–72. [Google Scholar]
- Yevjevich, V.M. An Objective Approach to Definitions and Investigations of Continental Hydrologic Droughts; Hydrology Papers; No. 23; Colorado State University: Fort Collins, CO, USA, 1967. [Google Scholar]
- Dracup, J.A.; Lee, K.S.; Paulson, E.G. On the definition of drought. Water Resour. Res. 1980, 16, 297–302. [Google Scholar] [CrossRef]
- Yisehak, B.; Shiferaw, H.; Abrha, H.; Gebremedhin, A.; Hagos, H.; Adhana, K.; Bezabh, T. Spatio-temporal characteristics of meteorological drought under changing climate in semi-arid region of northern Ethiopia. Environ. Syst. Res. 2021, 10, 21. [Google Scholar] [CrossRef]
- Spinoni, J.; Naumann, G.; Carro, H.; Barbosa, P.; Vogt, J. World drought frequency, duration, and severity for 1951–2010. Int. J. Climatol. 2014, 34, 2792–2804. [Google Scholar] [CrossRef]
- Gidey, E.; Dikinya, O.; Sebego, R.; Segosebe, E.; Zenebe, A. Modeling the spatio-temporal meteorological drought characteristics using the Standardized Precipitation Index (SPI) in Raya and its environs, Northern Ethiopia. Earth Syst. Environ. 2018, 2, 292–303. [Google Scholar] [CrossRef]
- Vogt, J.V.; Naumann, G.; Masante, D.; Spinoni, J.; Cammalleri, C.; Erian, W.; Pischke, F.; Pulwarty, R.; Barbosa, P. Drought Risk Assessment and Management. A Conceptual Framework; EUR 29464 EN; Publications Office of the European Union: Luxembourg, 2018. [Google Scholar]
- Ankrah, J.; Monteiro, A.; Madureira, H. Spatiotemporal Characteristics of Meteorological Drought and Wetness Events across the Coastal Savannah Agroecological Zone of Ghana. Water 2023, 15, 211. [Google Scholar] [CrossRef]
- Saaty, T.L. Scaling method for priorities in hierarchical structure. J. Math. Psychol. 1977, 15, 234–281. [Google Scholar] [CrossRef]
- Smit, B.; Burton, I.; Klein, R.J.T.; Street, R. The Science of Adaptation: A Framework for Assessment. Mitig. Adapt. Strat. Glob. Chang. 1999, 4, 199–213. [Google Scholar] [CrossRef]
- Wilhelmi, O.V.; Wilhite, D.A. Assessing vulnerability to agricultural drought: A Nebraska case study. Nat. Hazards 2002, 25, 37–58. [Google Scholar] [CrossRef]
- Wisner, B. Vulnerability in disaster theory and practice: From soup to taxonomy, then to analysis and finally tool. In Proceedings of the International Work-Conference Disaster Studies of Wageningen University and Research Centre, Wageningen, The Netherlands, 29–30 June 2001. [Google Scholar]
- Wisner, B. Assessment of capability and vulnerability. In Mapping Vulnerability: Disasters, Development and People; Bankoff, G., Frerks, G., Hilhorst, D., Eds.; Earth Scan: London, UK, 2004. [Google Scholar]
- Blaikie, P.; Cannon, T.; Davis, I.; Wisner, B. At Risk: Natural Hazards, Peoples Vulnerability, and Disasters; Routledge: London, UK; New York, NY, USA, 1994. [Google Scholar]
- Metzger, M.J.; Rounsevell, M.D.A.; Acosta-Michlik, L.; Leemans, R.; Schröter, D. The vulnerability of ecosystem services to land use change. Agric. Ecosyst. Environ. 2006, 114, 69–85. [Google Scholar] [CrossRef]
- Downing, T.E.; Bakker, K. Drought discourse and vulnerability. In Drought: A Global Assessment, Natural Hazards and Disasters Series; Wilhite, D.A., Ed.; Routledge Publishers: London, UK, 2000. [Google Scholar]
- Dabanli, I. Drought risk assessment by using drought hazard and vulnerability indexes. Nat. Hazards Earth Syst. Sci. Discuss. 2018, 1–15. [Google Scholar] [CrossRef]
- Wilhite, D.A. Drought as a natural hazard: Concepts and definitions. In Drought: A Global Assessment; Wilhite, D.A., Ed.; Routledge: New York, NY, USA, 2000. [Google Scholar]
- Haied, N.; Foufou, A.; Chaab, S.; Azlaoui, M.; Khadri, S.; Benzahia, K.; Benzahia, I. Drought assessment and monitoring using meteorological indices in a semi-arid region. Energy Procedia 2017, 119, 518–529. [Google Scholar] [CrossRef]
- Tsakiris, G.; Pangalou, D.; Vangelis, H. Regional drought assessment based on the Reconnaissance Drought Index (RDI). Water Resour. Manag. 2007, 21, 821–833. [Google Scholar] [CrossRef]
- Rahman, N.; Rony, R.H.; Jannat, F.A. Spatiotemporal evaluation of drought trend during 1979–2019 in seven climatic zones of Bangladesh. Heliyon 2021, 7, e08249. [Google Scholar] [CrossRef] [PubMed]
- Gader, K.; Gara, A.; Vanclooster, M.; Khlifi, S.; Slimani, M. Drought assessment in a south Mediterranean transboundary catchment. Hydrol. Sci. J. 2020, 65, 1300–1315. [Google Scholar] [CrossRef]
- Zerouali, B.; Chettih, M.; Abda, Z.; Mesbah, M.; Djemai, M. The use of hybrid methods for change points and trends detection in rainfall series of northern Algeria. Acta Geophys. 2020, 68, 1443–1460. [Google Scholar] [CrossRef]
- Caloiero, T.; Aristodemo, F.; Algieri Ferraro, D. Trend analysis of significant wave height and energy period in southern Italy. Theor. Appl. Climatol. 2019, 138, 917–930. [Google Scholar] [CrossRef]
- Adhyani1, N.L.; June, T.; Sopaheluwakan, A. Exposure to Drought: Duration, Severity and Intensity (Java, Bali and Nusa Tenggara). IOP Conf. Ser. Earth Environ. Sci. 2017, 58, 012040. [Google Scholar] [CrossRef]
- Taşan, M.; Demir, Y.; Taşan, S. Groundwater quality assessment using principal component analysis and hierarchical cluster analysis in Alaçam, Turkey. Water Supply 2022, 22, 3431–3447. [Google Scholar] [CrossRef]
- Merabti, A.; Darouich, H.; Paredes, P.; Meddi, M.; Pereira, L.S. Assessing Spatial Variability and Trends of Droughts in Eastern Algeria Using SPI, RDI, PDSI, and MedPDSI—A Novel Drought Index Using the FAO56 Evapotranspiration Method. Water 2023, 15, 626. [Google Scholar] [CrossRef]
- El-Rawy, M.; Fathi, H.; Abdalla, F.; Alshehri, F.; Eldeeb, H. An Integrated Principal Component and Hierarchical Cluster Analysis Approach for Groundwater Quality Assessment in Jazan, Saudi Arabia. Water 2023, 15, 1466. [Google Scholar] [CrossRef]
- Farooq, I.; Shah, A.R.; Sahana, M.; Azhar Ehsan, M. Assessment of Drought Conditions Over Different Climate Zones of Kazakhstan Using Standardised Precipitation Evapotranspiration Index. Earth Syst. Environ. 2023, 7, 283–296. [Google Scholar] [CrossRef]
- Caloiero, T.; Caloiero, P.; Frustaci, F. Long-term precipitation trend analysis in Europe and in the Mediterranean basin. Water Environ. J. 2018, 32, 433–445. [Google Scholar] [CrossRef]
- Nicholson, S.E.; Funk, C.; Fink, A.H. Rainfall over the African continent from the 19th through the 21st century. Global Planet Chang. 2018, 165, 114–127. [Google Scholar] [CrossRef]
- Meddi, H.; Meddi, M. Variabilité spatiale et temporelle des précipitations du Nord-Ouest de l’Algérie. Géogr. Tech. 2007, 2, 49–55. [Google Scholar]


Disclaimer/Publisher’s Note: The statements, opinions and data contained in all publications are solely those of the individual author(s) and contributor(s) and not of MDPI and/or the editor(s). MDPI and/or the editor(s) disclaim responsibility for any injury to people or property resulting from any ideas, methods, instructions or products referred to in the content. |
© 2023 by the authors. Licensee MDPI, Basel, Switzerland. This article is an open access article distributed under the terms and conditions of the Creative Commons Attribution (CC BY) license (https://creativecommons.org/licenses/by/4.0/).