Abstract
The energy consumption status and energy saving potential of the air-conditioning systems of data centers in seven typical cities in China (Xinjiang, Beijing, Jinan, Shanghai, Nanning, Guilin, and Haikou), representing diverse climate regions, were studied. The power usage effectiveness (PUE) and cooling load factor (CLF) were taken as the evaluation indicators. First, the energy consumption situations of the existing air-conditioning systems were analyzed using an internship survey. Second, the meteorological data throughout the year for the seven cities were statistically analyzed. Then, two energy saving renovation schemes were proposed. The operating hours under different operating modes in the seven cities were calculated, and the PUE and energy saving potential of the two energy saving schemes were evaluated by taking the production of 15 °C chilled water as an example. This study provides an overall picture of the energy utilization status in the current Chinese data center market and provides solutions for improving the design of air-conditioning systems, with energy saving benefits.
1. Introduction
With the rapid development of communication and network technology, social informatization, and the scale of computing devices, data centers play an increasingly important role in the national economy. Obviously, people’s daily lives are inseparable from the support of data centers. Mateusz Borkowski et al. [1] pointed out that a data center consumes approximately 50 to 100 times the power of a standard office building. Abbas et al. [2] indicated that the energy consumption of US data centers in 2020 was twice the energy consumption in 2013. Kandasamy et al. [3] reported that the energy consumed by data centers accounted for approximately 1.15% of the total global energy consumption in 2016 and is expected to increase to 1.86% by 2030. The 2020 data center annual development research report pointed out that data centers in China consume as much as 204.5 billion kWh of electricity [4].
The growth of the data center industry is highly valued in China. To “optimize and improve digital infrastructure and accelerate the creation of a national integrated large data center system” was suggested in the “14th Five-Year Plan” and is a target for 2035 in China. President Xi proposed the objective “China will achieve carbon peak in 2030 and achieve carbon neutrality in 2060” at the 2020 UN General Assembly, which demonstrates China’s responsibility and unwavering commitment to following green development as a major country. In order to achieve this goal, the energy conservation of data centers will be crucial. The power usage effectiveness (PUE) of new large and ultra-large data centers must not exceed 1.3, according to policies jointly released by the National Development and Reform Commission, the Ministry of Industry and Information Technology, the Ministry of Ecology and Environment, and the National Energy Administration of China. To strengthen the development of green and high-quality data centers, this limitation on PUE cannot exceed 1.5 by 2025 [5].
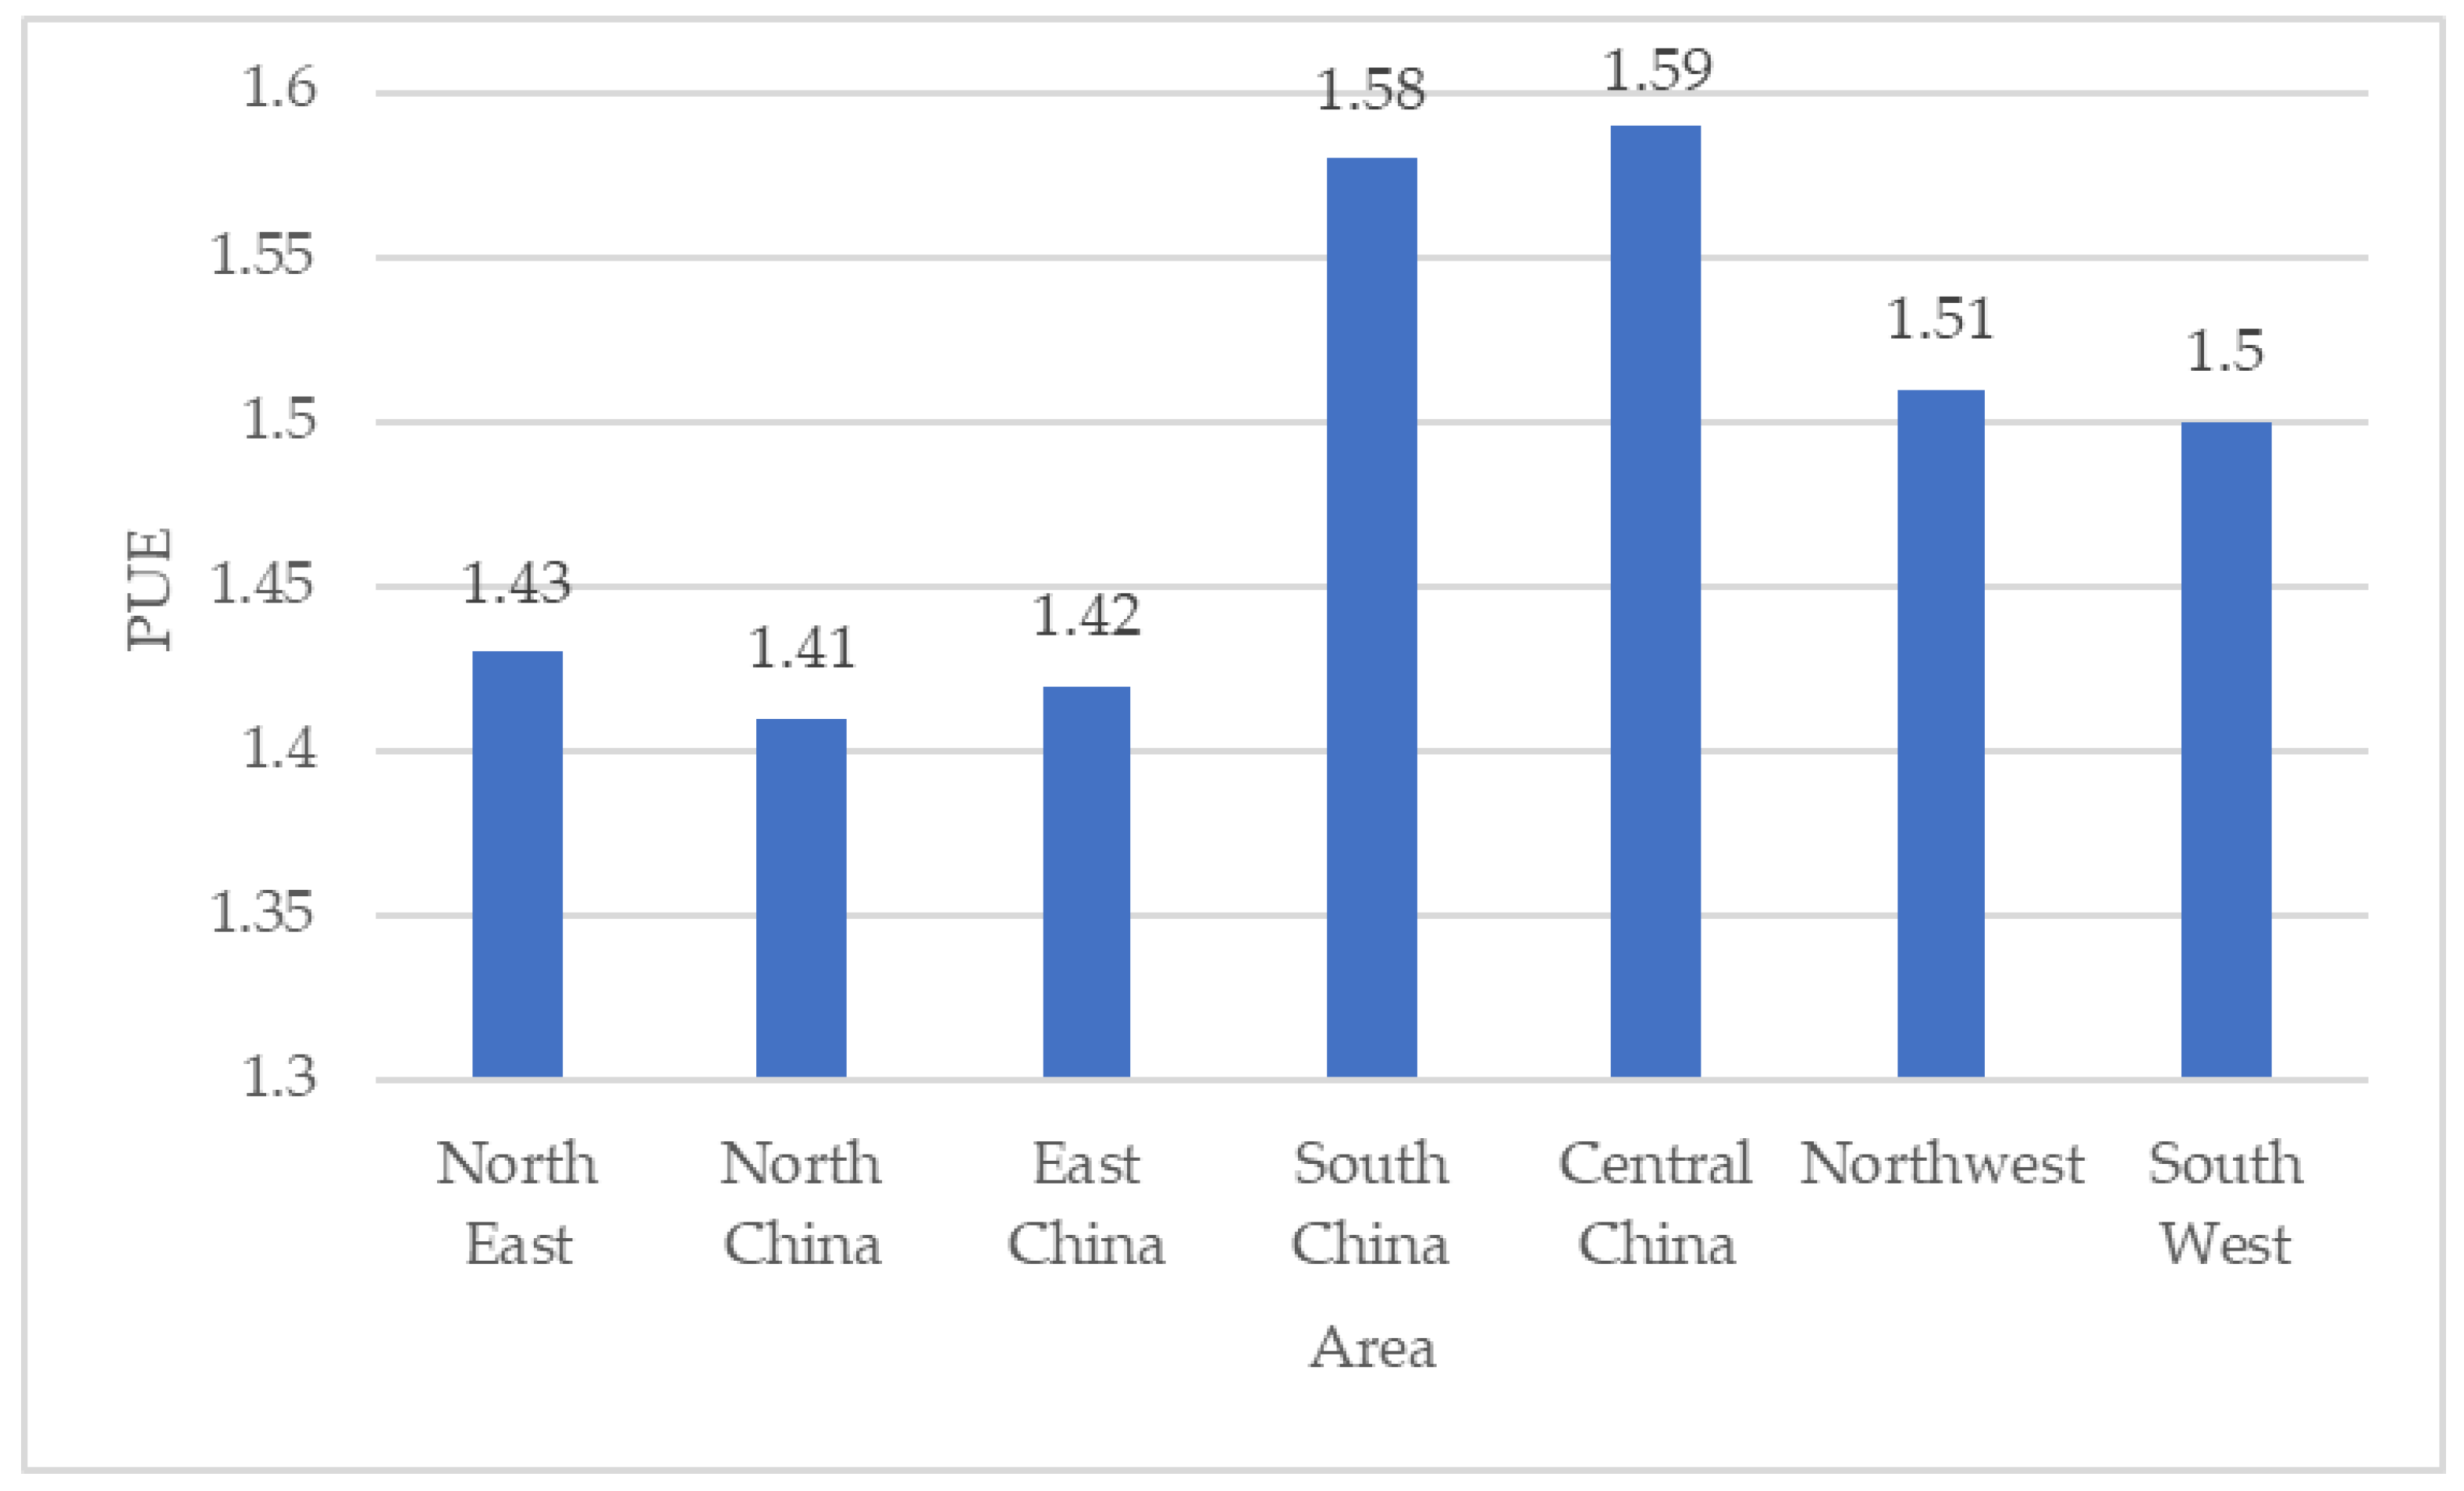
The yearly power consumption of data centers is expanding, as reported by the 2014–2025 data center annual development study report (see Figure 1). By 2025, the power consumption of data centers is predicted to reach 395.2 billion, five times as much as in 2014 [6]. The annual average PUE of data centers across China in the year of 2021 is depicted in Figure 2. The PUE values in north and east China are relatively low, but they are extremely high in south and central China, not complying with the official standards as a whole. Therefore, the design of energy saving schemes is necessary and urgent. The three primary components of the energy usage of a data center are: ① information technology (IT) hardware and software, ② power supply and distribution, and ③ refrigeration and air-conditioning. Figure 3 displays a breakdown of energy statistics for each part of the data center. Approximately 45% of the overall energy use of a data center is attributed to the IT equipment, and 40% is for the air-conditioning system. These two parts account for the major components of the energy used in the data center. Hence, efforts to reduce the energy consumption of data centers have been concentrated on these two parts. However, the growth of IT technology has a significant impact on the energy consumption of servers and software systems. Currently, there is not much room for increasing the energy efficiency of IT equipment, due to the need of maintaining the computational capacity and dependability, which is not the focus of this study [7]. On the contrary, refrigeration and air-conditioning systems are flexible enough to implement various energy saving design concepts and new refrigeration technologies, so as to reduce the energy consumption of the data center and enhance its energy efficiency. Therefore, energy saving design of refrigeration and air-conditioning systems and the implementation of innovative refrigeration technologies hold the key to enhancing data center energy utilization efficiency and, eventually, lowering these systems’ energy consumption [8].
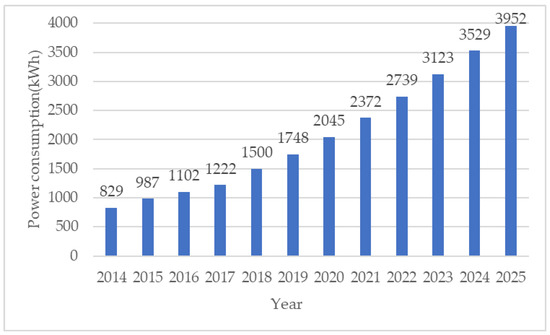
Figure 1.
Power consumption of data centers [9].
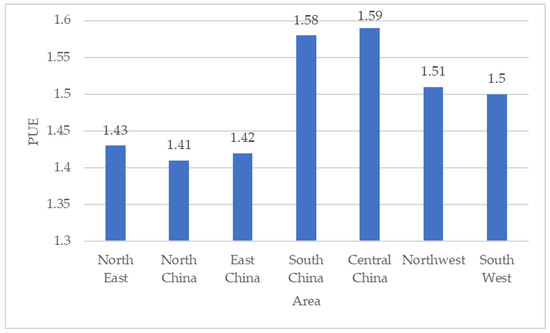
Figure 2.
The annual average PUE of data centers in the various regions in China in the year 2021 [10].
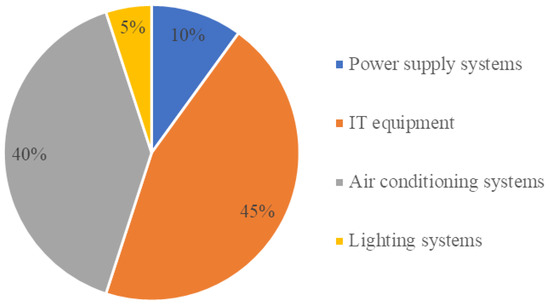
Figure 3.
The proportion of power consumption of data centers in China.
This paper first investigates the current energy consumption status of data centers in seven cities (Urumqi, Beijing, Jinan, Shanghai, Nanning, Guilin, and Haikou) using an internship survey and then proposes energy saving renovation plans, to analyze their energy saving potential based on annual statistical climate data in the seven cities.
2. Current Energy Consumption of Existing Air-Conditioning Systems in Data Centers
2.1. Evaluation Indicators and Research Methods
Equation (1) illustrates the power usage effectiveness (PUE), which represents an indicator for assessing the energy efficiency of data centers. The energy used by the IT equipment, cooling, power distribution, and other systems is included in the data centers’ overall energy usage. Better energy efficiency is achieved when the PUE is close to 1, which indicates less energy consumed by non-IT equipment, mainly the air-conditioning systems [11].
PUE = Total energy consumption of the data center/energy consumption of the IT equipment
The cooling load factor (CLF) is the ratio of the power consumption of the data center cooling equipment to the power consumption of the IT equipment, which can be expressed as:
CLF = Energy consumption of the refrigeration equipment/energy consumption of the IT equipment
This paper first conducted an internship survey on data centers in Urumqi, Beijing, Jinan, Shanghai, Nanning, Guilin, and Haikou, measuring the annual energy consumption of the IT equipment, energy consumption of the refrigeration equipment, and total energy consumption of data centers, and calculating the annual PUE and CLF to reveal the current energy consumption status.
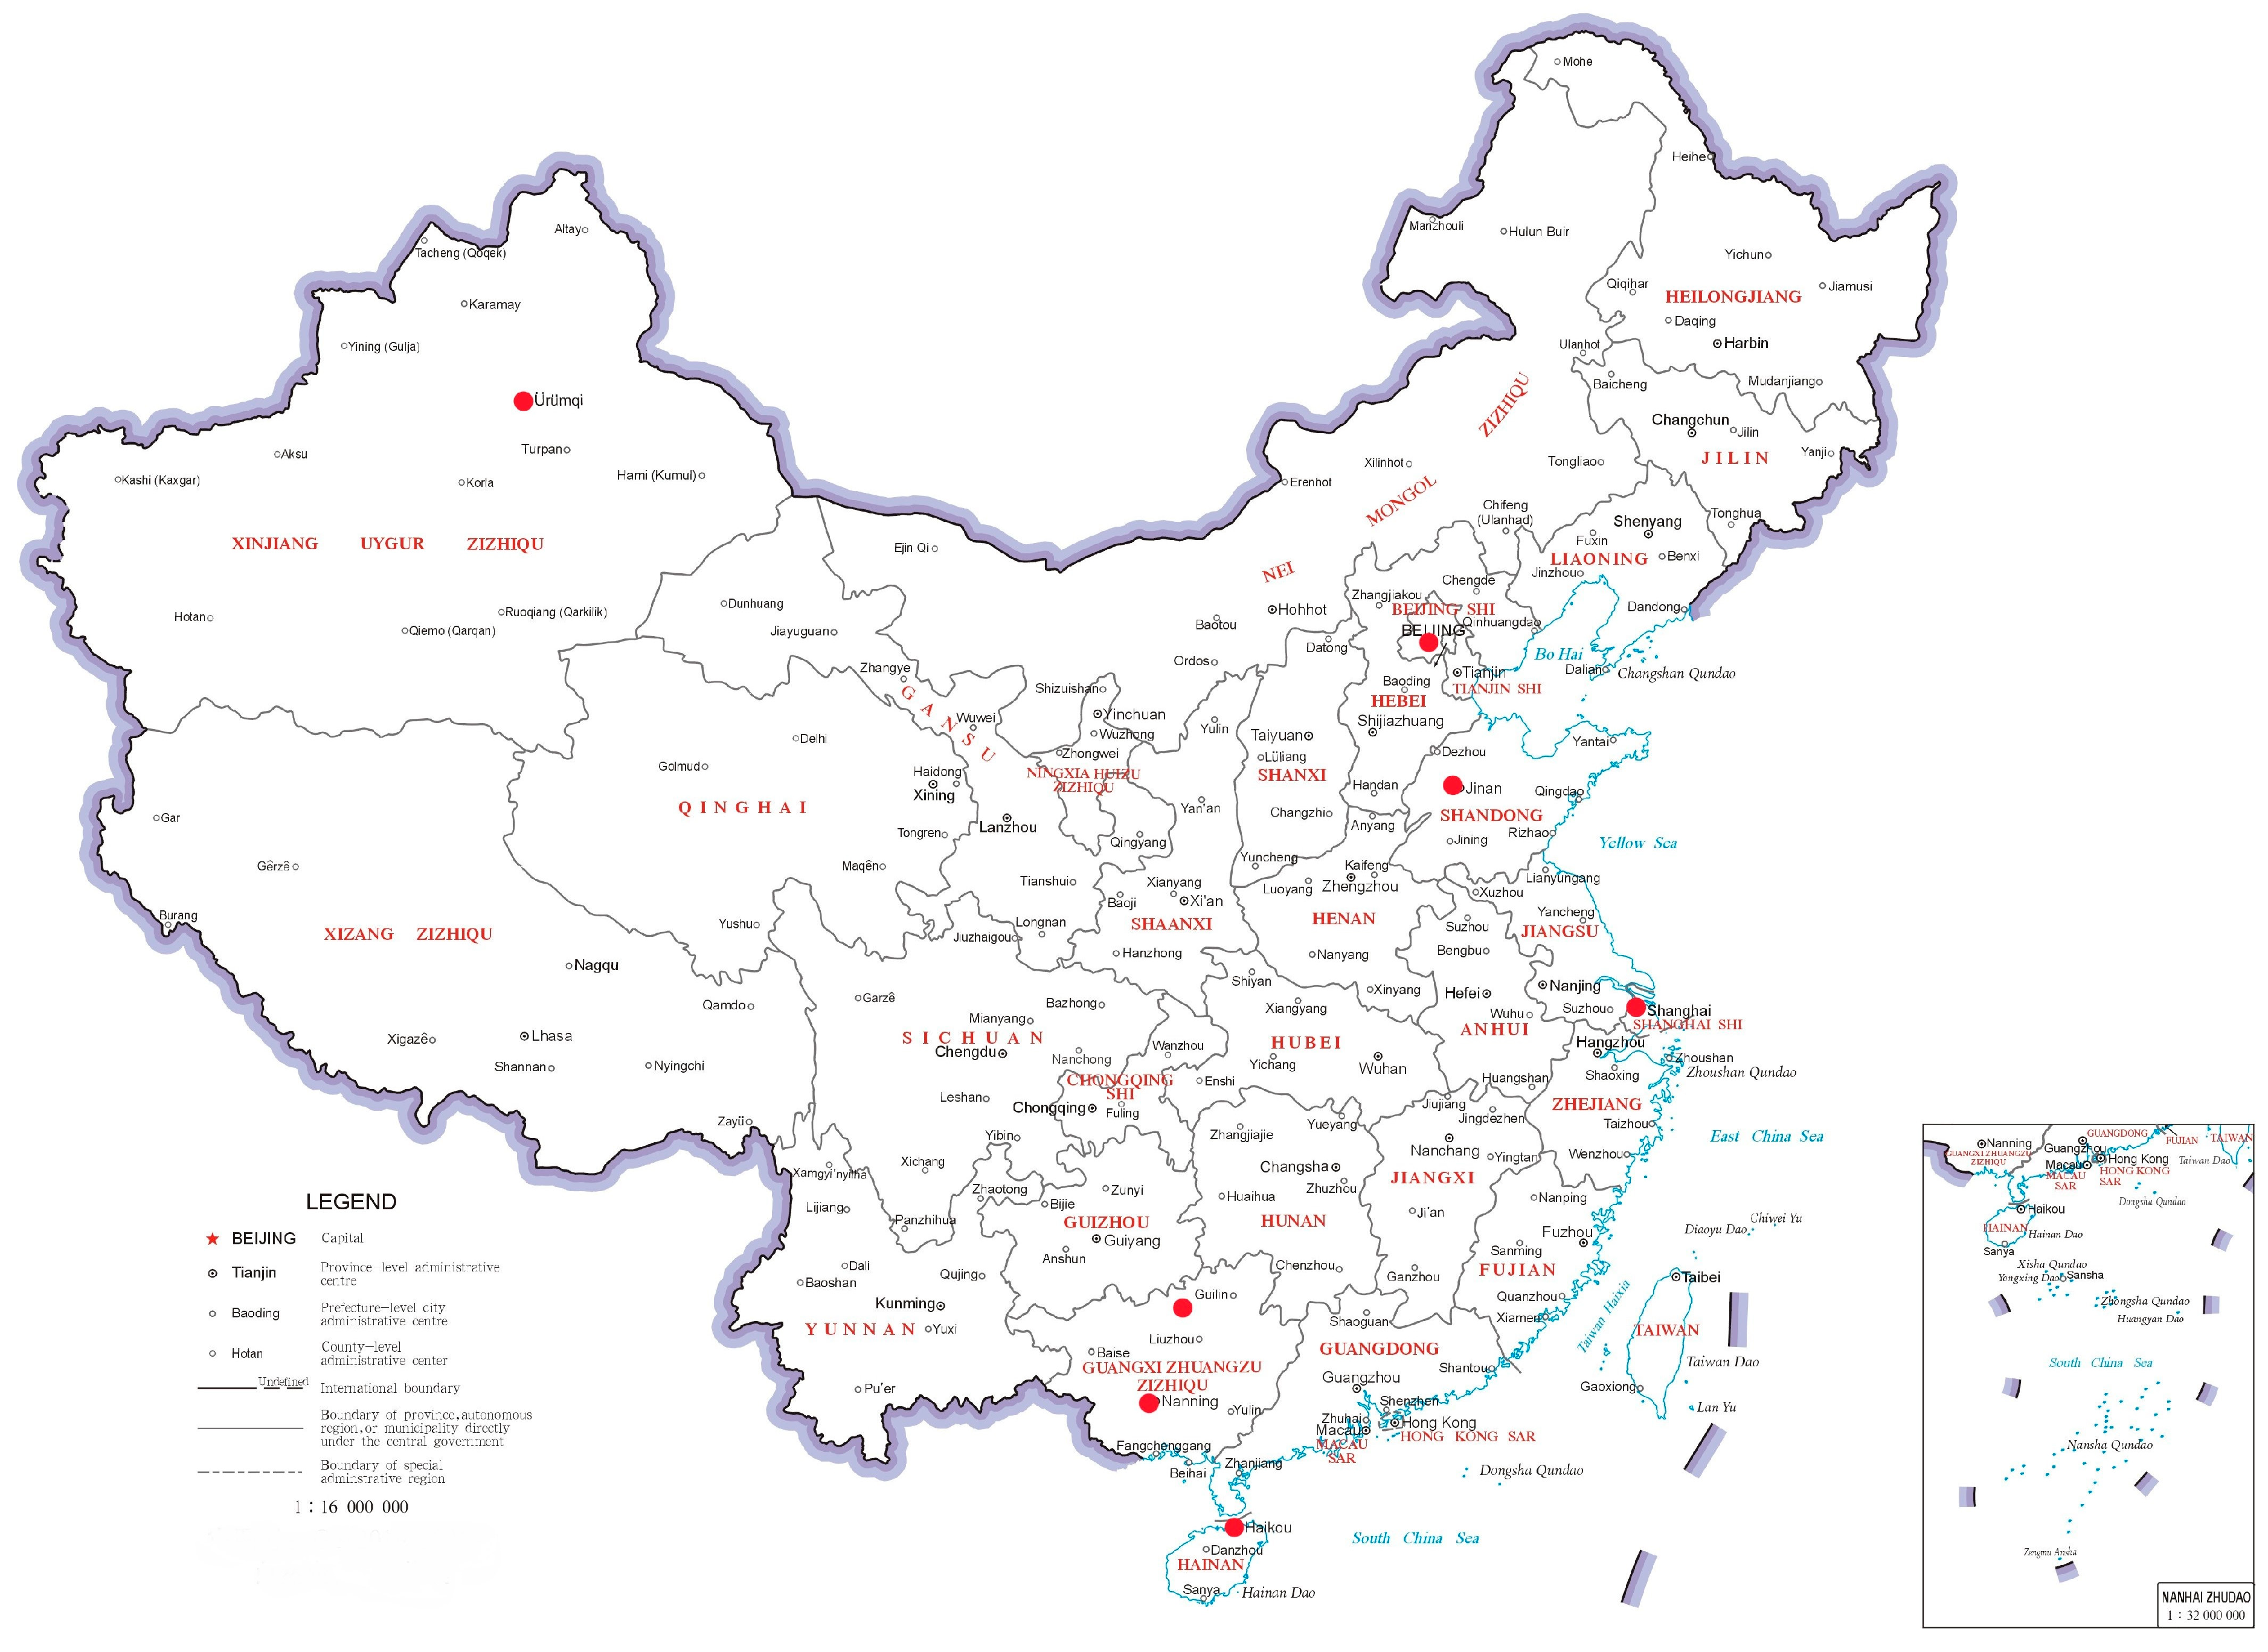
The seven typical cities selected represent a wide range of climate conditions, as listed in Table 1, including western hot-arid regions, coastal hot-humid regions, etc. The locations of the seven typical cities are shown in Figure 4, in which the positions of the seven cities are marked with red circles.

Table 1.
Climate conditions of the selected seven typical cities.
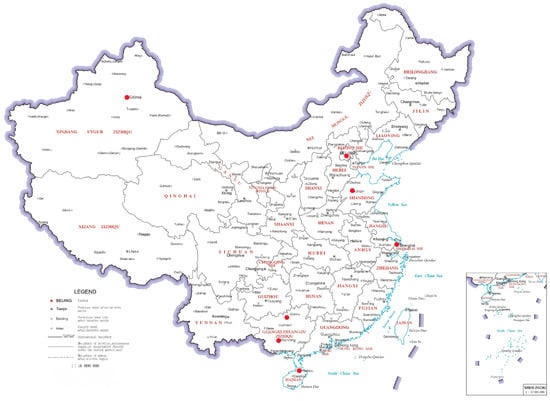
Figure 4.
Locations of the seven typical cities in China.
2.2. Analysis of Research Data
Table 2 lists the cities that were studied with the internship survey, including Urumqi in the dry area; Beijing and Jinan in areas of moderate humidity; and Shanghai, Nanning, Guilin, and Haikou in areas of high humidity. The operating data centers in these seven cities already use water-cooling and air-cooling technologies. The cooling factor CLF values of the data centers were between 0.4 and 0.7, and the PUE values ranged from 1.45 to 1.85. The survey results revealed that all the PUE values in the real projects were higher than 1.3, which is the level required by the recent national government legislation [12]. Therefore, the design of an energy saving scheme is necessary and urgent.
Table 2.
Survey results of the data centers.
In order to solve the problem of the high energy consumption of these data centers, this paper puts forward two renovation schemes. The methods are as follows: First, the operating mode of the system was given according to the outdoor climate conditions; then Excel software was used to analyze the annual wet and dry bulb temperature difference and the number of hours at each wet bulb temperature in the different cities. After that, the running time of each model was determined according to the meteorological data. Finally, the running time and unit efficiency were used to estimate the energy saving rate.
3. Introduction to Energy Saving Solutions
The above survey proved the need for carrying out energy saving transformation of the existing data centers, to comply with the low PUE policy [13]. In this study, two evaporative cooling technology transformation schemes are proposed and the energy saving potentials of the above mentioned data centers are analyzed.
3.1. “Scheme 1”: Combined Indirect Evaporative Cooling Chiller and Mechanical Refrigeration Water System
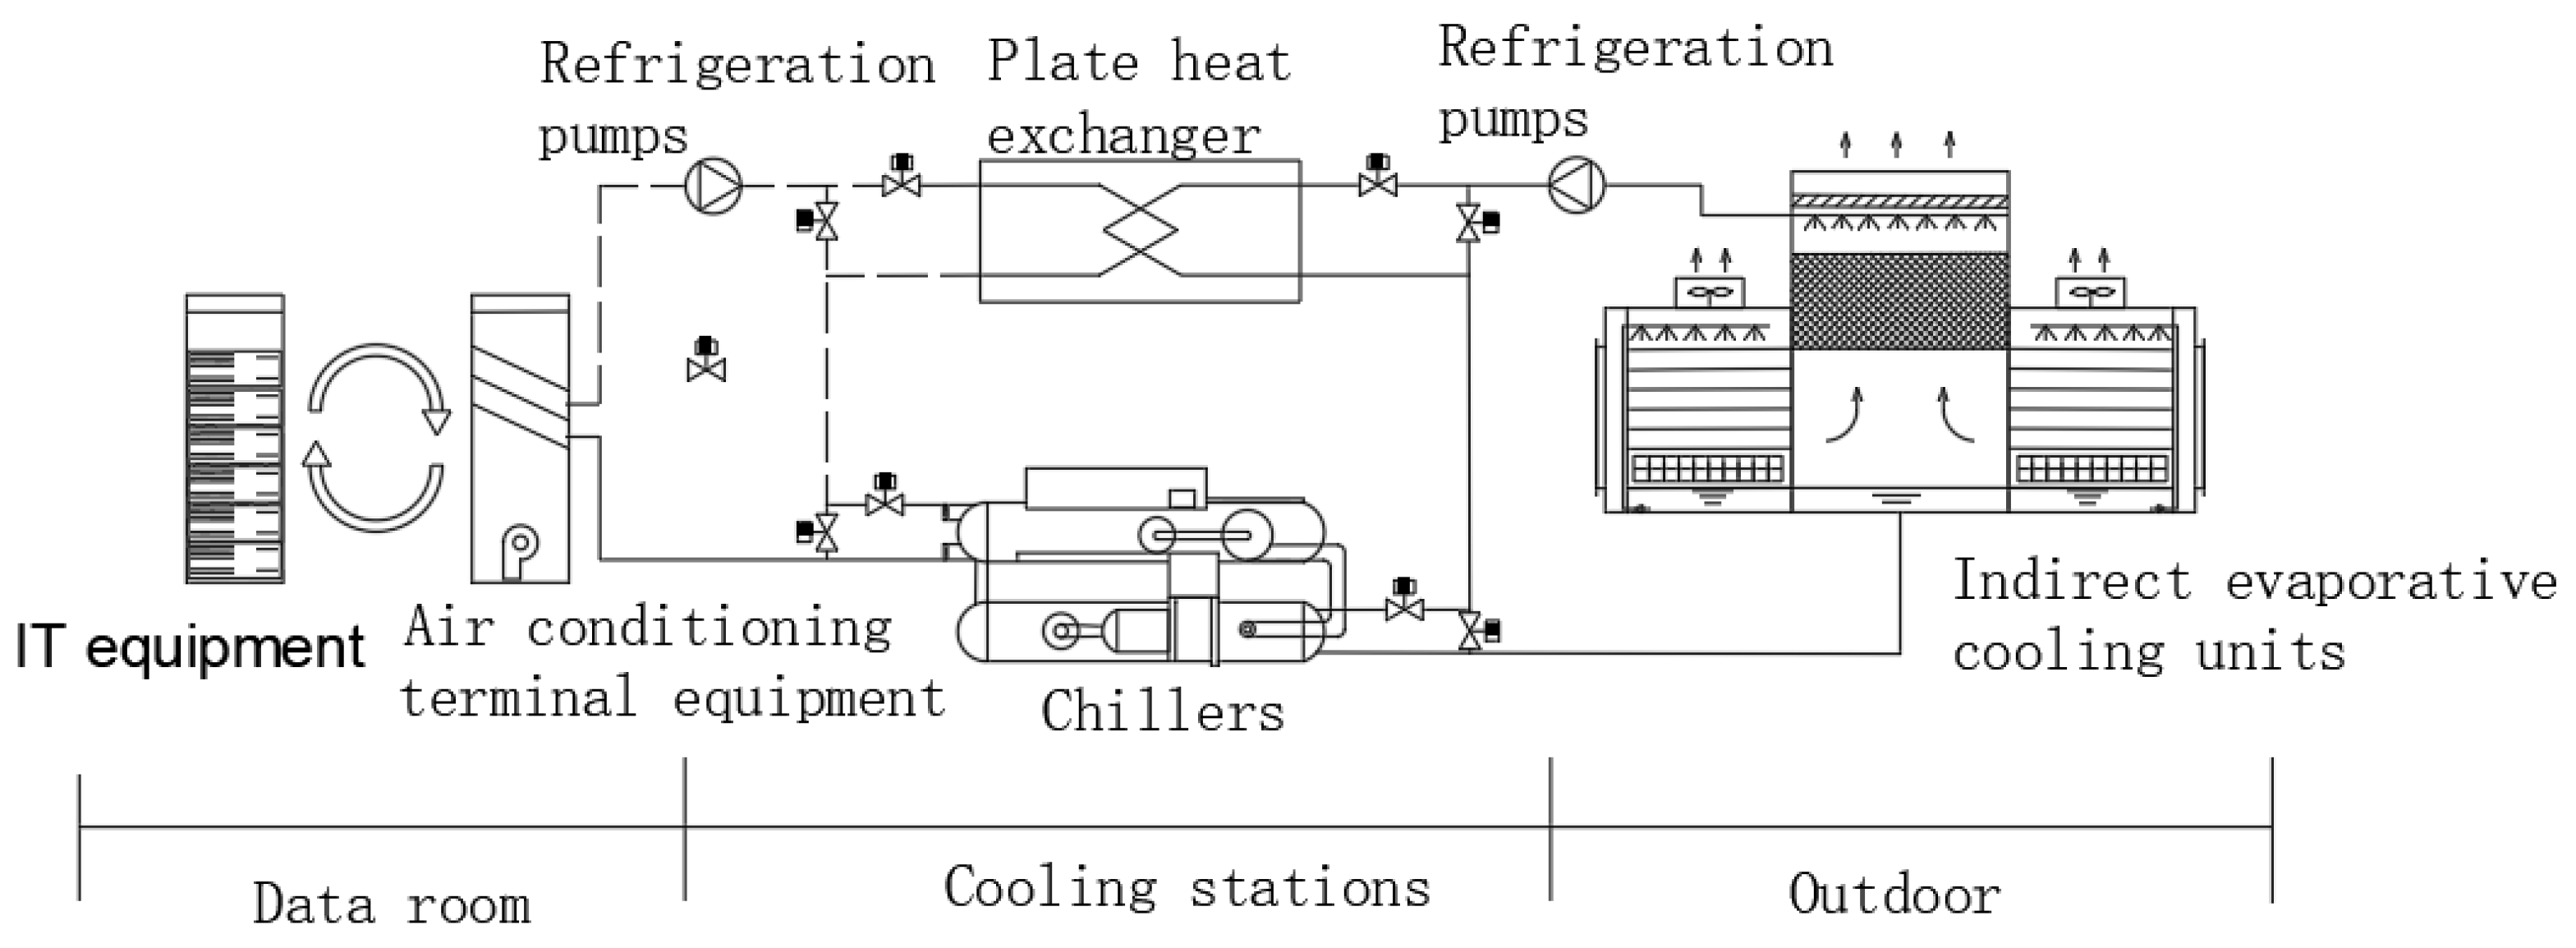
An indirect evaporative cooling chiller and mechanical cooling chiller are combined in this chiller system design. The indirect evaporative cooling chiller can produce cold water with a temperature lower than the wet bulb temperature of outdoor air, which is 4–6 °C lower than the cold water temperature produced by a traditional cooling tower. Figure 5 shows the schematic diagram of “scheme 1”. This modification can extend the operating time of evaporative cooling, to save energy consumption of the data centers [14].

Figure 5.
Schematic diagram of “scheme 1”.
As shown in Table 3, this system has three operating modes throughout the operating cycle. The direct evaporative cooling section of the indirect evaporative cooling chiller is open, to produce cold water when the wet bulb temperature Ts of the outdoor air is below 13 °C, and the plate heat exchanger at the end of the data center is used to exchange heat with the return water for cooling. Both the indirect section and direct evaporative cooling section of the indirect evaporative cooling chiller are open simultaneously when Ts is between 13 °C and 15 °C, and the data center is cooled by the plate heat exchanger. Both the mechanical cooling chiller and the indirect evaporative cooling chiller are open simultaneously when Ts is more than 15 °C, and the mechanical cooling chiller provides chilled water for cooling at the end of the data center.
Table 3.
Operating mode of the combined indirect evaporative cooling chiller and mechanical refrigeration water system.
3.2. “Scheme 2”: Combined Indirect Evaporative Cooling and Mechanical Cooling Air System
The second transformation scheme is also a combined system consisting of an indirect evaporative cooler and an air-cooled mechanical refrigeration system. As shown in Figure 6, indirect evaporative coolers are used whenever possible, to meet the supply air temperature requirements for constant humidity cooling, such as in the case of the data center equipment room. The use of evaporative cooling reduces the operating time and part of the cooling load of mechanical cooling [15].
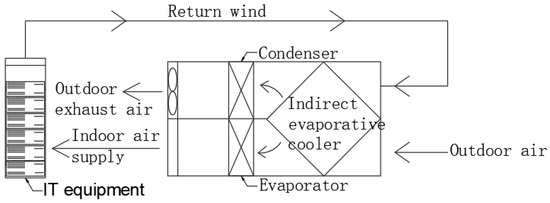
Figure 6.
Schematic diagram of “scheme 2”.
As shown in Table 4, this system has three operating modes, according to the wet bulb temperature Ts and the dry bulb temperature Tg of the outdoor air. The wet channel of the indirect evaporative cooler is not wetted with water, the mechanical refrigeration does not operate, and the outdoor air cools the return air of the data center with an indirect evaporative cooler, supplied to the computer room of the data center when Tg ≤ 16 °C. The wet channel of the indirect evaporative cooler is sprayed with water, and the mechanical cooling is not used when Tg > 16 °C and Ts ≤ 19 °C. The outdoor air passes through the indirect evaporative cooler to indirectly cool the return air of the data center. The wet channel of the indirect evaporative cooler is sprayed with water and the mechanical cooling starts operation when Ts > 19 °C. The return air of the computer room in the data center is first water cooled by the indirect evaporative cooler and then is sent to the computer room after being cooled by the mechanically cooled evaporator. This system operates in three operating modes throughout the year, to achieve a low energy consumption [16].
Table 4.
Operating mode of the indirect evaporative cooling and mechanical refrigeration combined air system.
4. Analyses of Urban Meteorological Characteristics and Operating Time of Evaporative Cooling
4.1. Analysis of Climate Characteristics
The performance of evaporative cooling is highly dependent on the ambient condition. Therefore, the meteorological characteristics of the seven typical cities were analyzed using meteorological data statistics. The meteorological indicators included: outdoor dry bulb temperature, outdoor wet bulb temperature, and the temperature difference between the dry bulb and wet bulb temperatures. The above indicators greatly affect the temperature of the cold air and cold water produced by evaporative cooling. The climate features of the seven cities were examined based on meteorological information, to precisely determine the duration of the energy saving scheme in the surveyed locations [17].
4.1.1. Urumqi
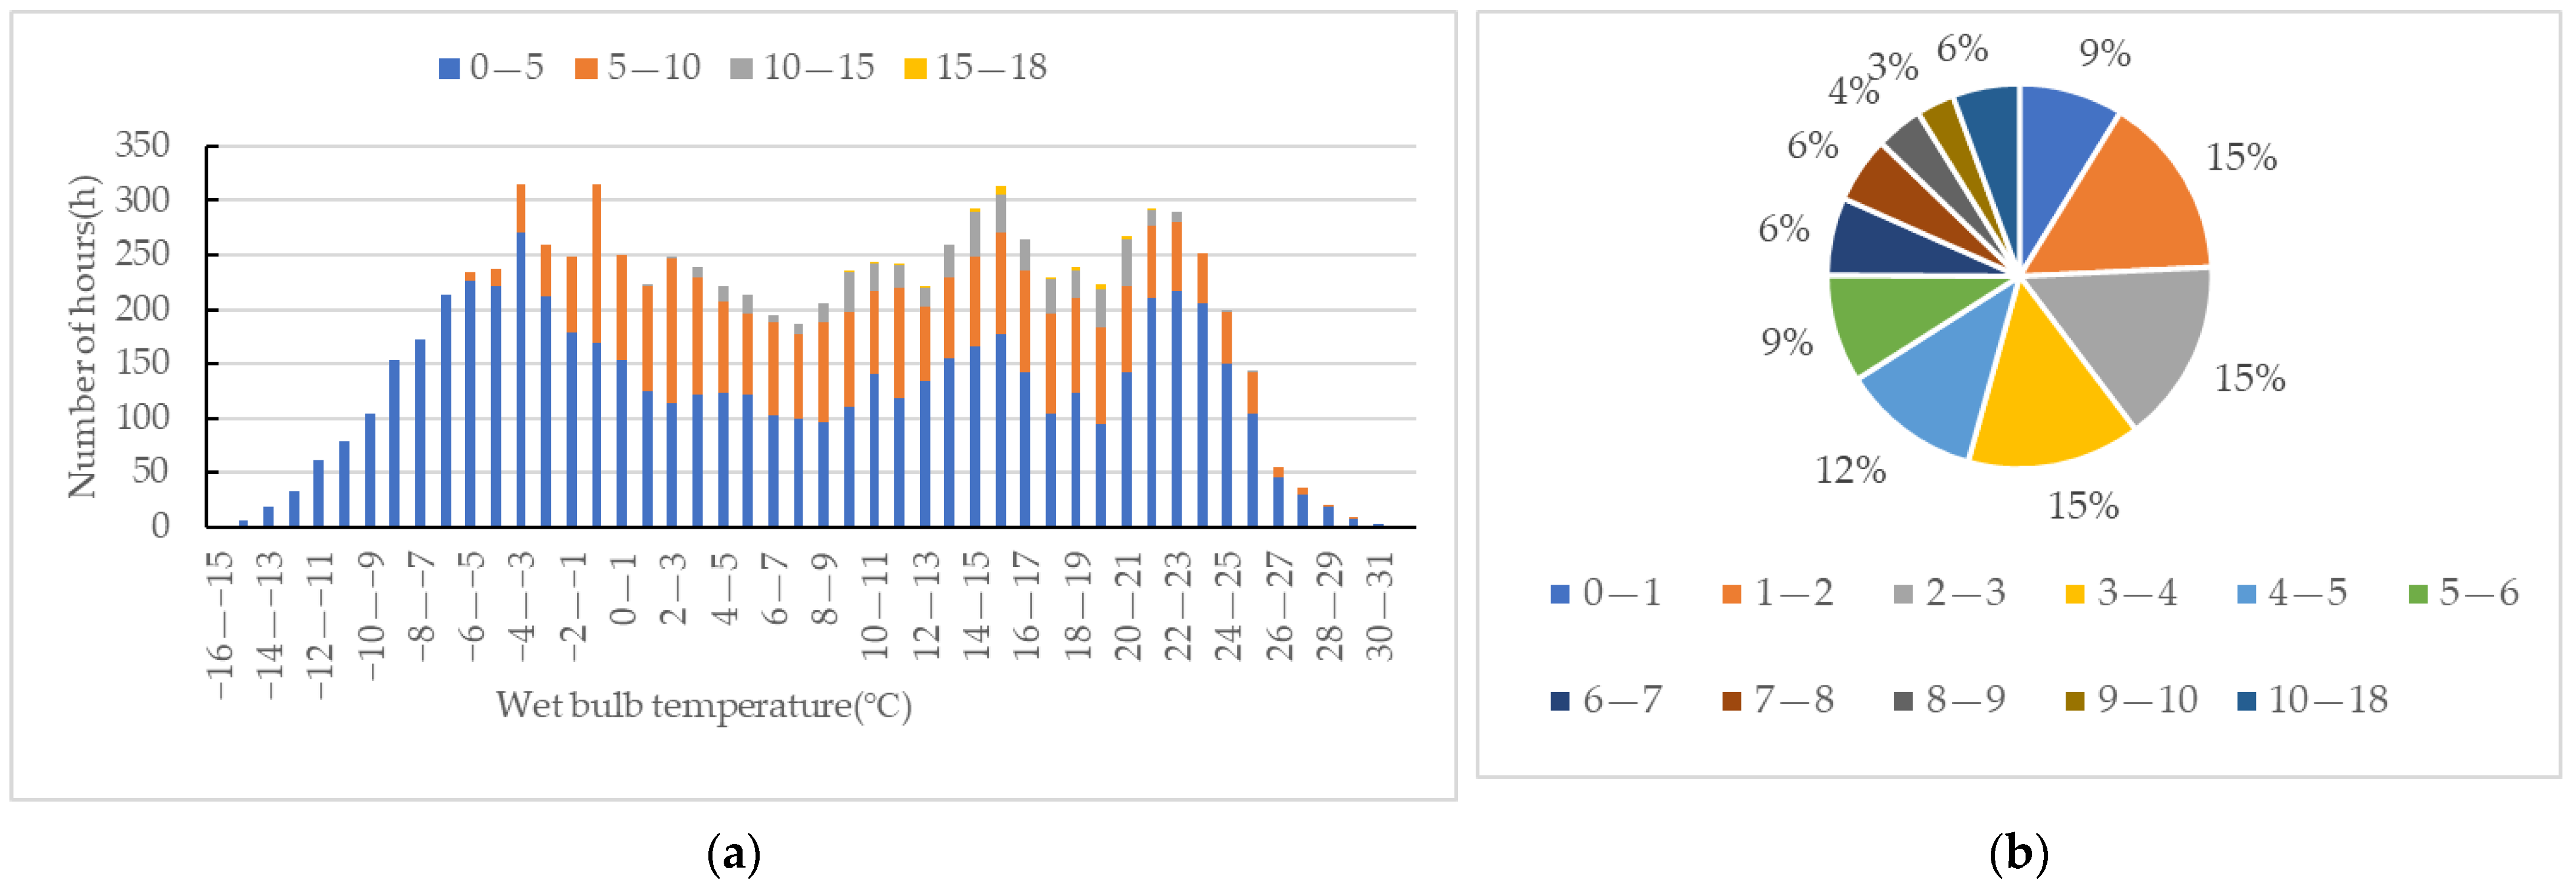
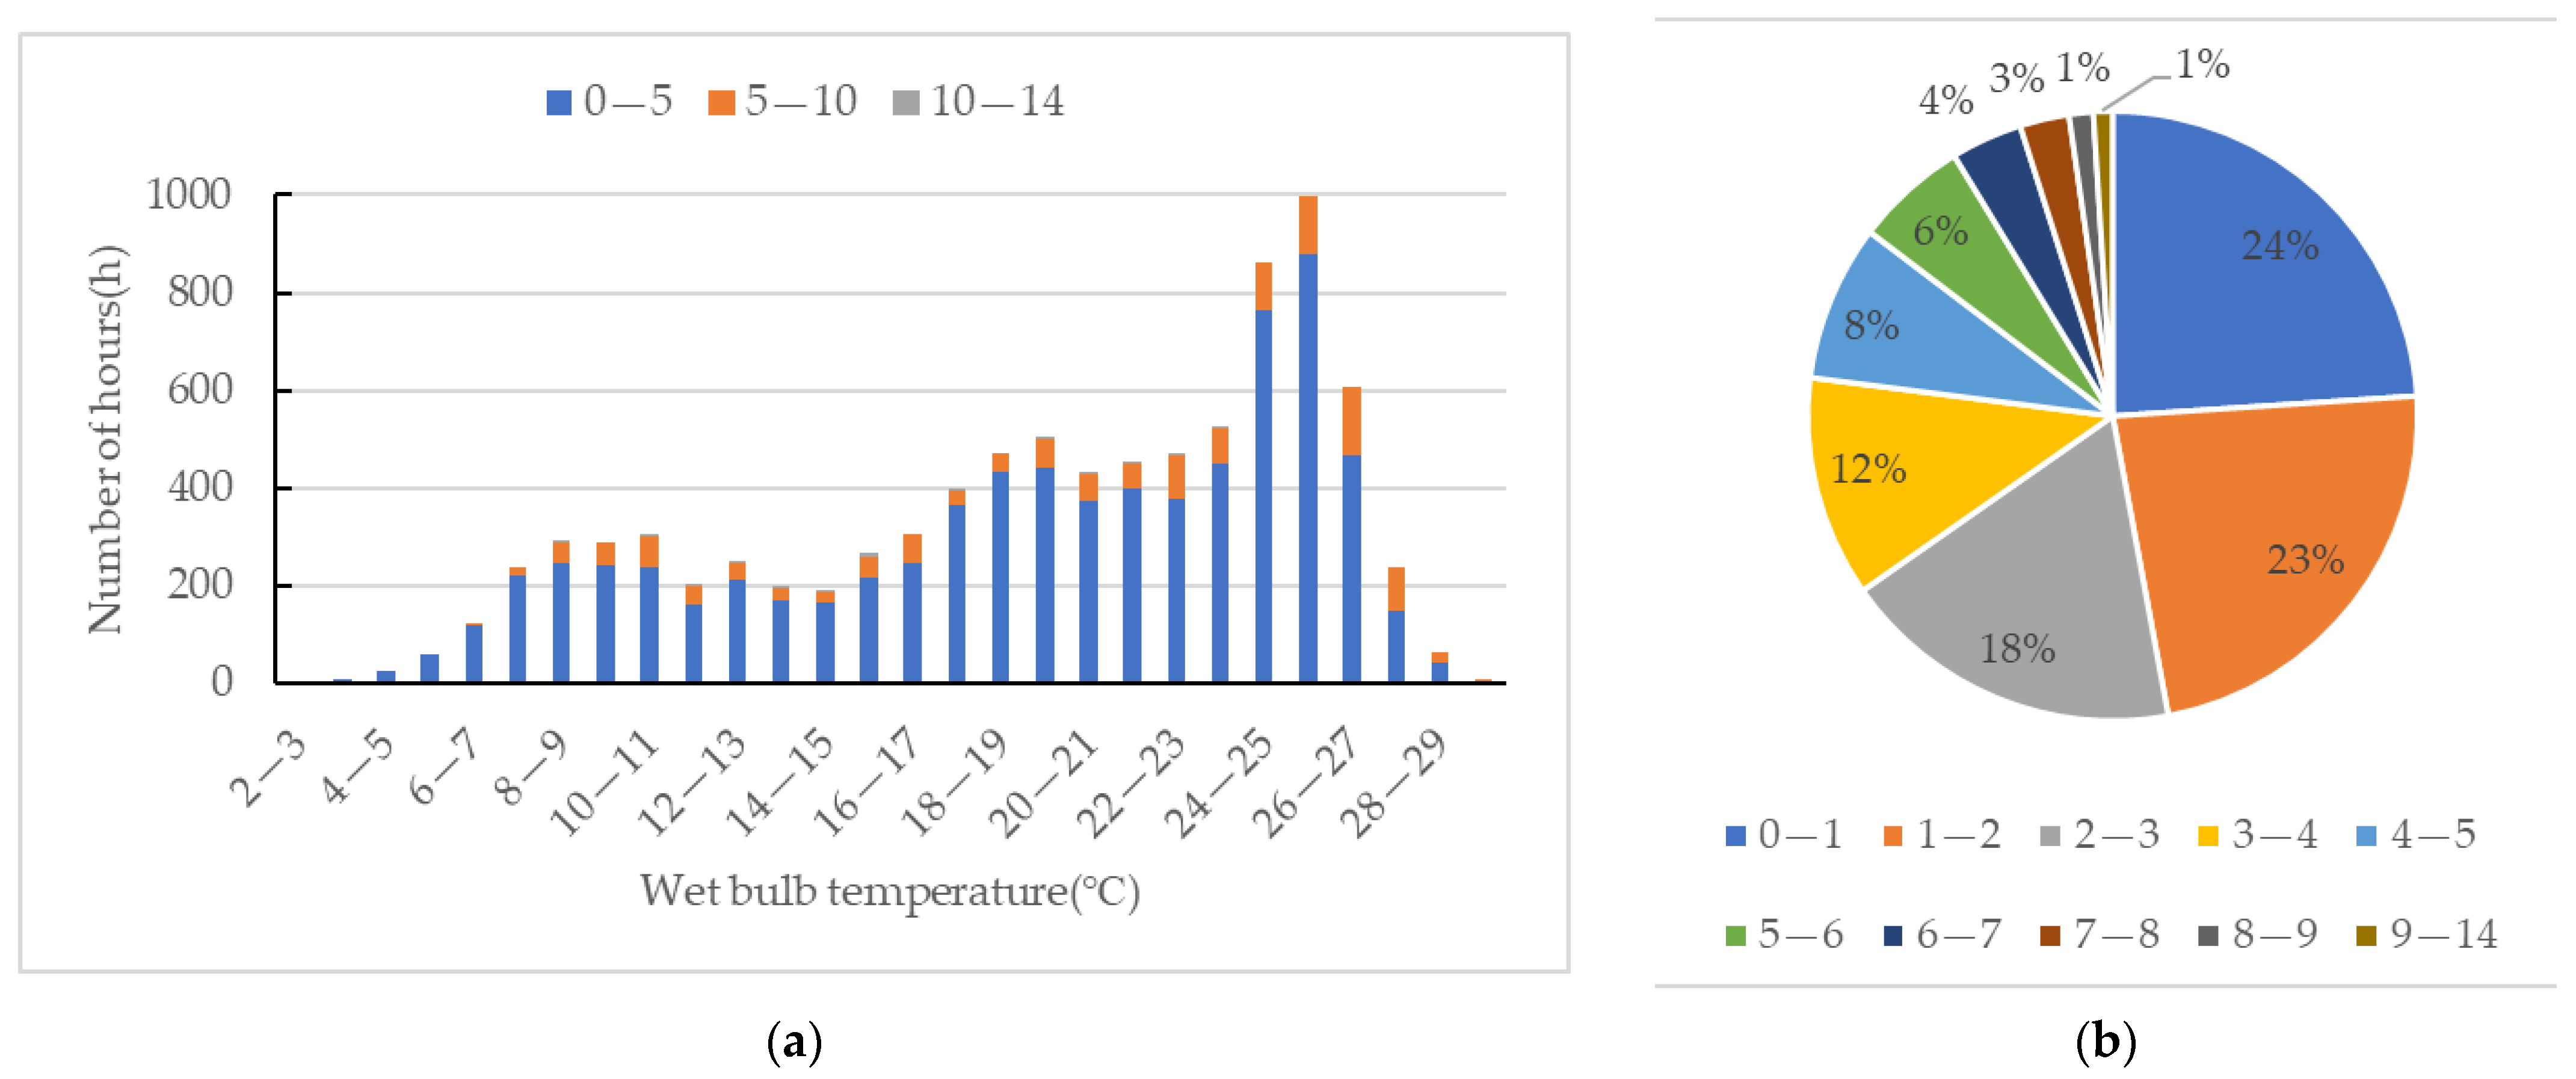
The annual dry and wet bulb temperatures and the difference between the dry and wet bulb temperatures in Urumqi are shown in Figure 7a. The abscissa is the distribution of wet bulb temperature, and the ordinate is the durational proportion of the various dry and wet bulb temperature differences. The wet bulb temperature ranges from −15 °C to 19 °C throughout the year. When the wet bulb temperature is lower than 5 °C, the difference between the wet and dry bulb temperature is generally between 0 °C and 5 °C. When the wet bulb temperature is 10–15 °C, the dry and wet bulb temperature difference is generally between 5 °C and 10 °C. It can be seen that the dry air energy in this area is abundant.
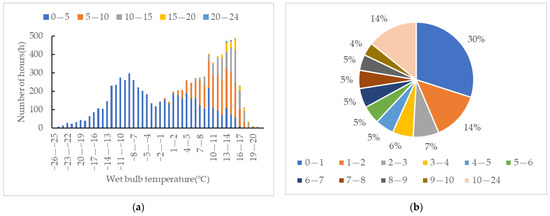
Figure 7.
(a) Hours of different dry and wet bulb temperature differences at various wet bulb temperatures in Urumqi; (b) percentage of the various dry and wet bulb temperature differences in Urumqi for the year 2000.
Figure 7b shows the proportion of the differences between the dry and wet bulb temperatures in Urumqi throughout the year. The temperature difference between the dry and wet bulb temperatures is mostly concentrated in the range 0 °C–3 °C, accounting for 51%; the range of 0 °C–1 °C accounts for the largest part, with 30%; the range of 1 °C–2 °C accounts for 14%; and the range of 2 °C–3 °C accounts for 7%. The proportion gradually decreases with the increase in temperature difference. This proves that this city is ideal for all-year-round air-conditioning with evaporative cooling.
4.1.2. Beijing
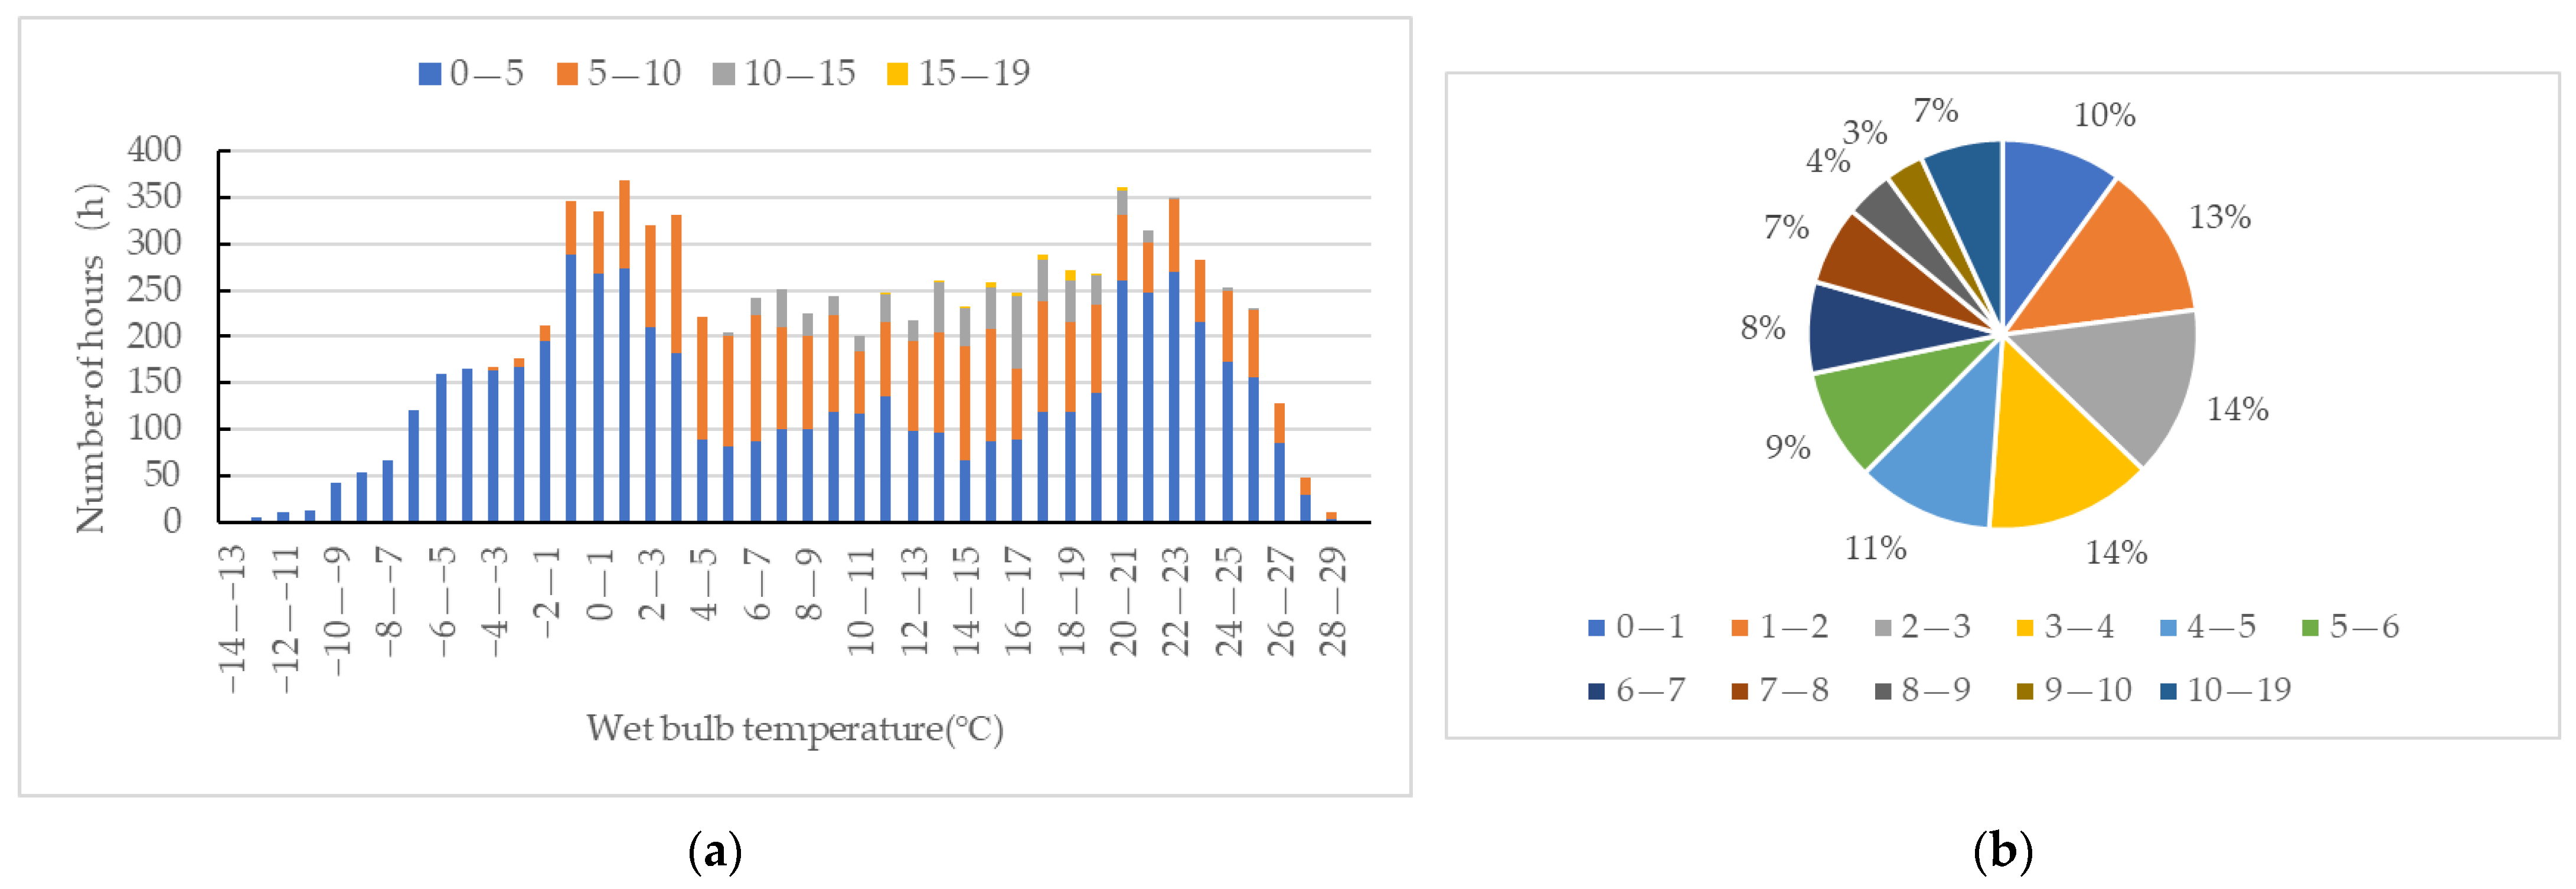
The annual dry and wet bulb temperatures and the difference between the dry and wet bulb temperatures in Beijing are shown in Figure 8a. The abscissa is the distribution of the wet bulb temperature, and the ordinate is the durational proportion of the various dry and wet bulb temperature differences. The wet bulb temperature mainly ranges from −10 °C to 26 °C, and the temperature difference between the wet and dry bulb temperatures is mainly between 0 °C and 5 °C. When the wet bulb temperature is 0 °C~15 °C, nearly half of the temperature difference between the wet and dry bulb temperatures is between 5 °C~10 °C. This area is suitable for the operation of evaporative cooling air-conditioning.

Figure 8.
(a) Hours of the various dry and wet bulb temperature differences at different wet bulb temperatures in Beijing; (b) Percentage of dry and wet bulb temperature differences in Beijing for the year 2000.
Figure 8b displays the annual percentage of dry and wet bulb temperatures in Beijing. The temperature variations between the dry and wet bulb temperatures are primarily concentrated between 0 °C and 4 °C, accounting for 54%; 0–1 °C accounts for 9%; and 1 °C~4 °C accounts for 15%. The proportion drops as the temperature difference increases.
4.1.3. Jinan
The annual dry and wet bulb temperatures and the difference between the dry and wet bulb temperatures in Jinan are shown in Figure 9a. The wet bulb temperature is mainly concentrated between −7 °C and 26 °C, and the temperature difference between wet and dry bulb temperatures is mainly between 0 °C and 5 °C. When the wet bulb temperature is between 5 °C and 20 °C, nearly half of the dry and wet bulb temperature difference is in the range of 5–10 °C; thus, evaporative cooling air-conditioning would run for a shorter period than in Beijing.
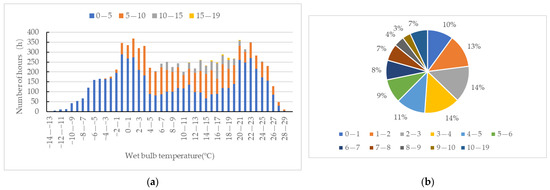
Figure 9.
(a) Hours of dry and wet bulb temperature differences at various wet bulb temperatures in Jinan; (b) Percentage of wet and dry bulb temperature differences in Jinan for the year 2000.
Figure 9b shows the proportion of the various wet and dry bulb temperature differences in Jinan throughout the year. The dry and wet bulb temperature differences are mainly concentrated in the range 0–4 °C, accounting for 51%; 0–1 °C accounts for 10%, 1–2 °C accounts for 13%; and 2–3 °C accounts for 14%. The proportion drops as the temperature difference increases.
4.1.4. Shanghai
The annual dry and wet bulb temperatures and the difference between the dry and wet bulb temperatures in Shanghai are shown in Figure 10a. It can be seen that the difference in the dry and wet bulb temperatures throughout almost the whole year is between 0 °C and 5 °C, and the wet bulb temperature is less than 15 °C for about half of the year. Therefore, the time of using evaporative cooling air-conditioning in Shanghai would be short.

Figure 10.
(a) Hours of dry and wet bulb temperature differences at various wet bulb temperatures in Shanghai; (b) percentage of dry and wet bulb temperature differences in Shanghai for the year 2000.
Figure 10b shows the percentage of dry and wet bulb temperature differences in Shanghai throughout the year. The dry and wet bulb temperature differences are mainly concentrated in 0 °C to 3 °C, accounting for 65%; 0 °C–1 °C accounts for 17%; 1 °C–2 °C accounts for 26%; 2 °C–3 °C accounts for 22%; and 3 °C–4 °C accounts for 14%. The percentage gradually decreases as the temperature difference increases.
4.1.5. Nanning
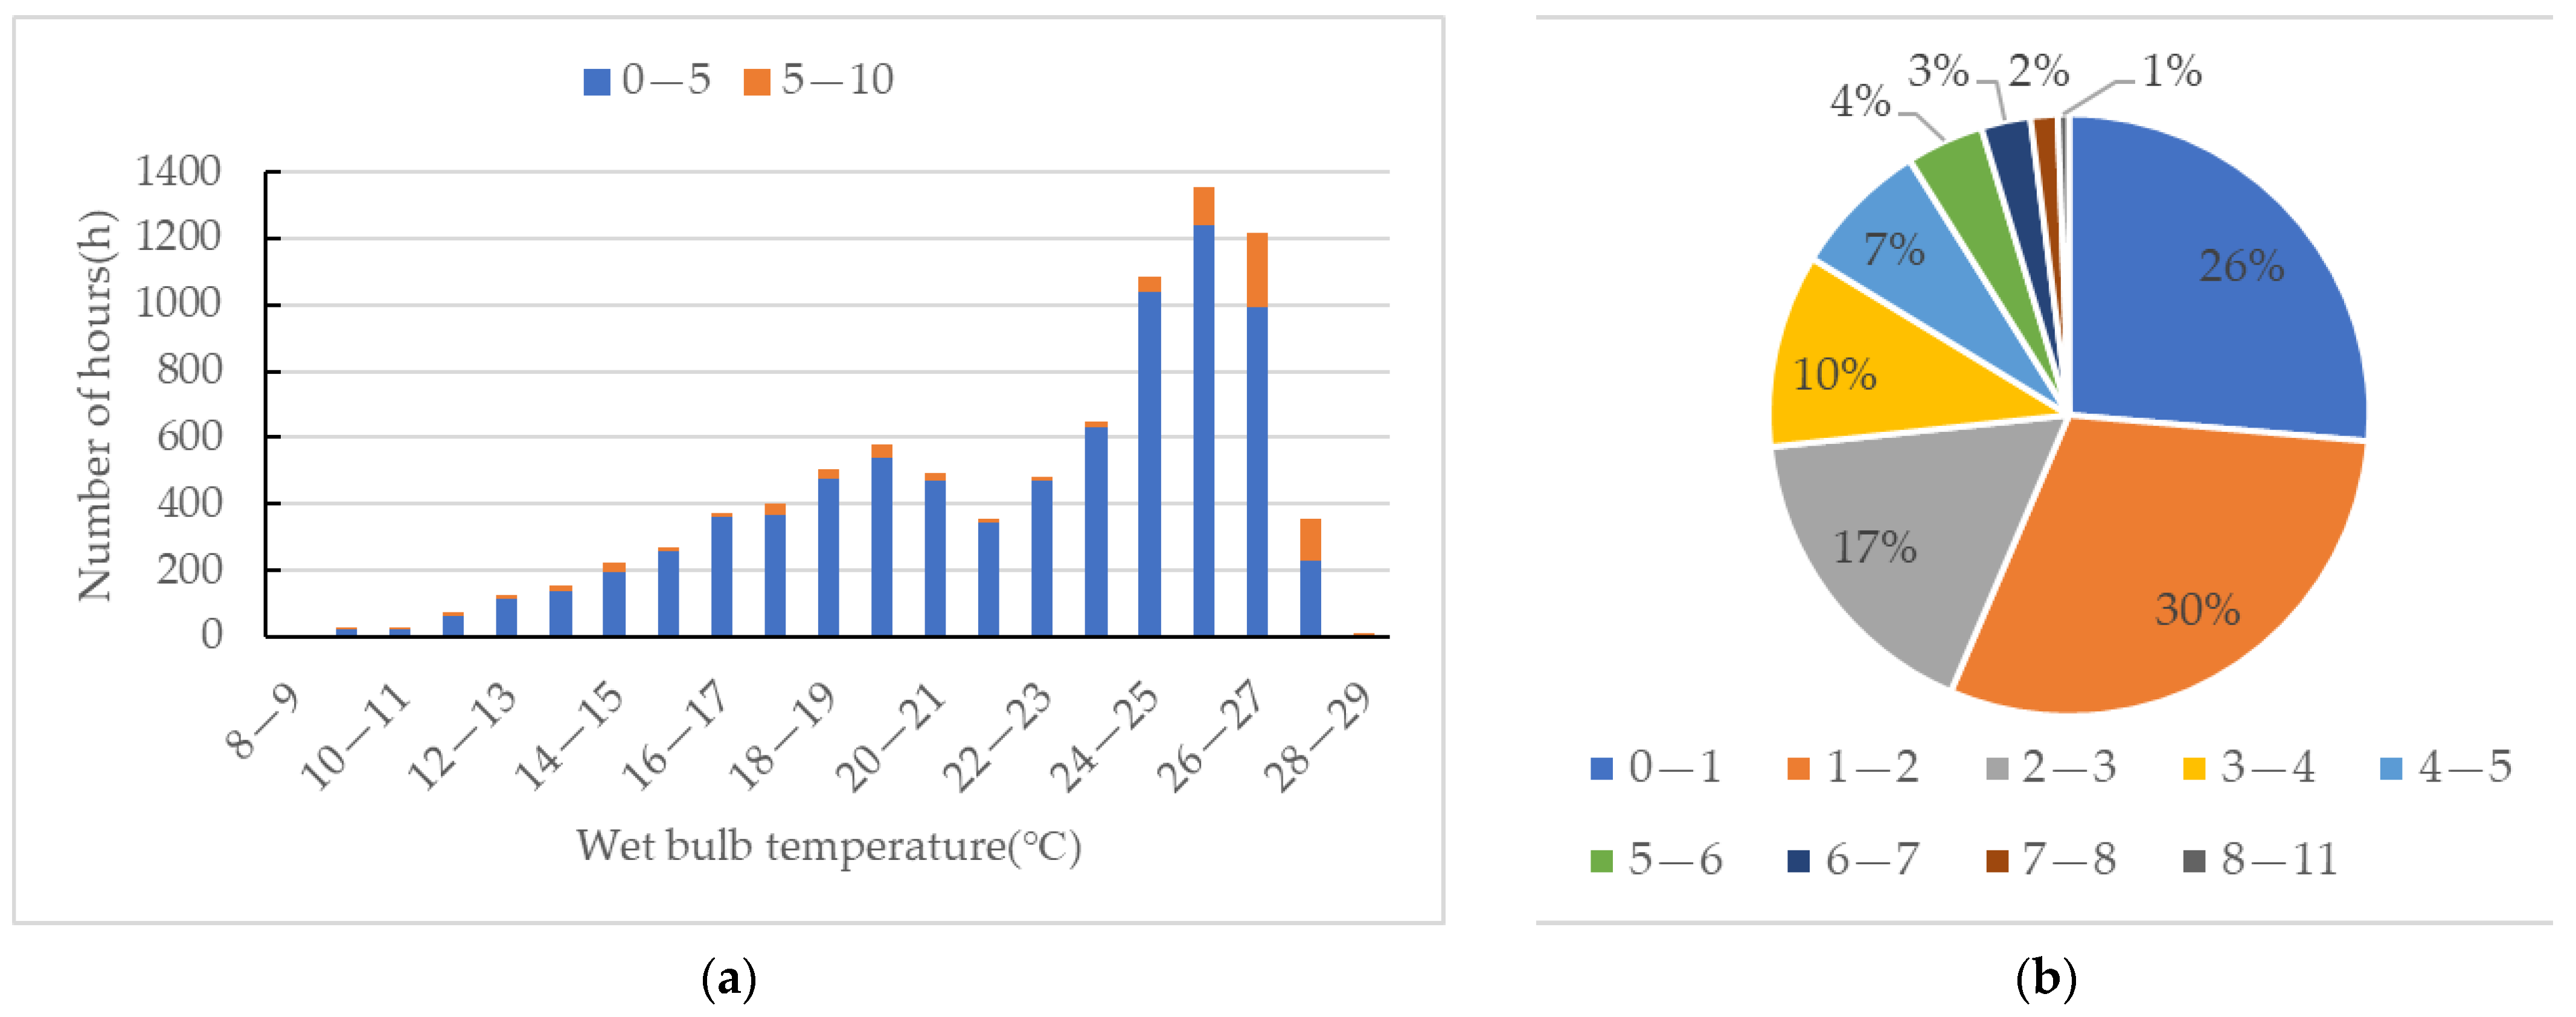
The annual dry and wet bulb temperatures and the difference between the dry and wet bulb temperatures in Nanning are shown in Figure 11a. The wet bulb temperature mainly ranges from 6 °C to 27 °C. The temperature difference between the wet and dry bulb temperatures is mostly between 0 °C and 5 °C. When the wet bulb temperature is between 8 °C and 18 °C, the temperature difference between the wet and dry bulb is distributed over a very small number of hours, so it would not be suitable for evaporative cooling air-conditioning to run alone, and mechanical cooling is also required.
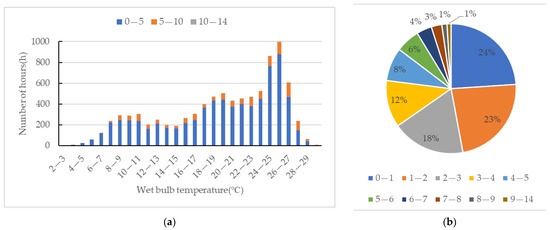
Figure 11.
(a) Hours of different dry and wet bulb temperature differences at different wet bulb temperatures in Nanning; (b) percentage of different dry and wet bulb temperature differences in Nanning for the year 2000.
Figure 11b shows the proportion of different dry and wet bulb temperature differences in Nanning throughout the year. The dry and wet bulb temperature differences are mainly concentrated in 0 °C to 3 °C, accounting for 65%; 0–1 °C accounts for 24%, 1–2 °C accounts for 23%; 2–3 °C accounts for 18%; and 3–4 °C accounts for 12%. The proportion gradually decreases as the temperature difference increases.
4.1.6. Guilin
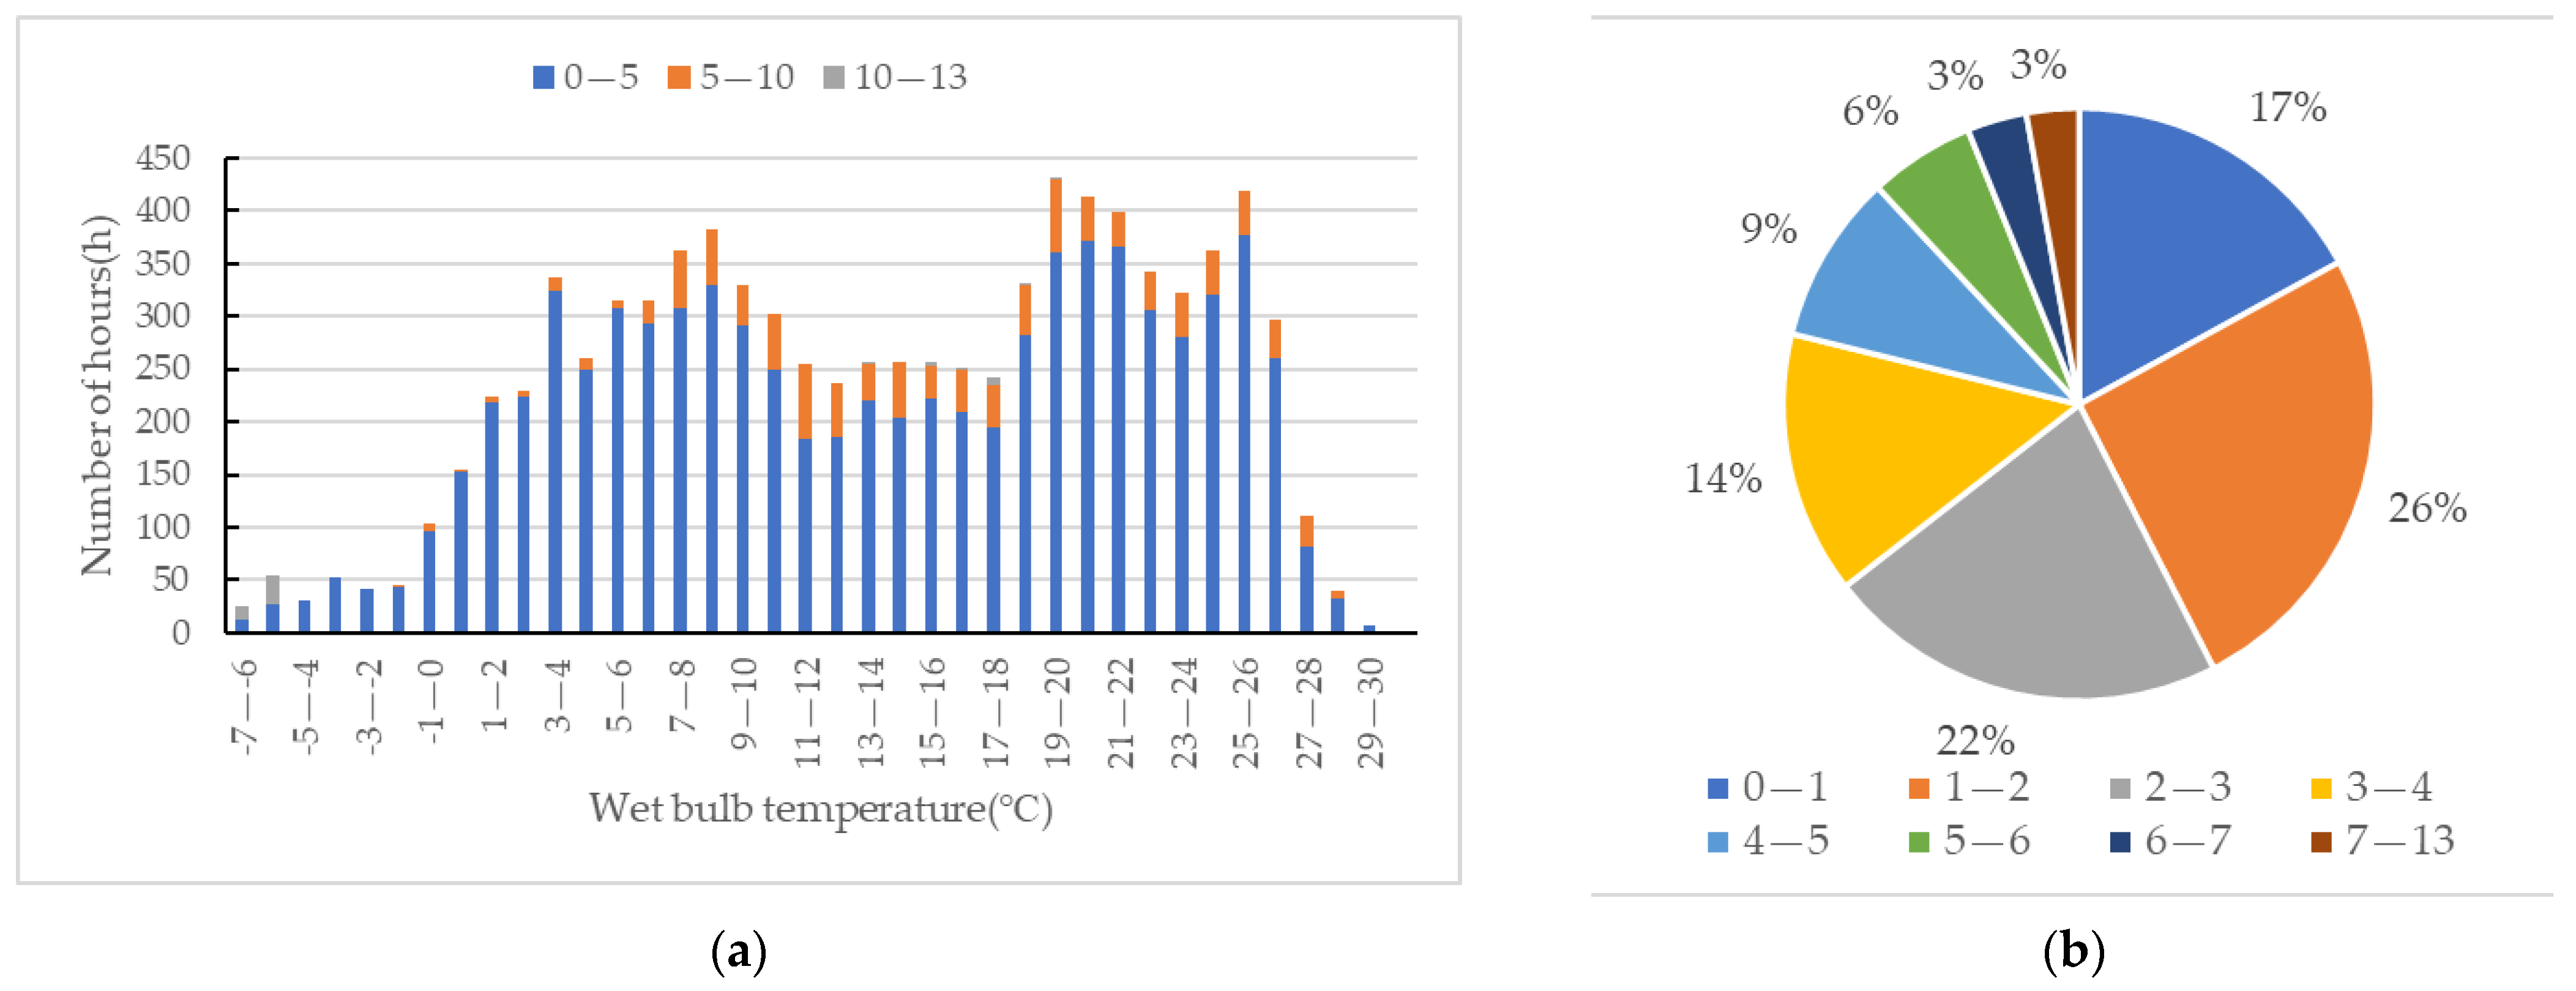
The annual dry and wet bulb temperatures and the difference between the dry and wet bulb temperatures in Guilin are shown in Figure 12a. The wet bulb temperature mainly ranges from 3 °C to 26 °C. The temperature difference between the wet and dry bulb temperatures is mostly between 0 °C and 5 °C. When the wet bulb temperature is between 8 °C and 18 °C, the temperature difference between wet and dry bulb is small, and the annual operation time suitable for evaporative cooling air-conditioning is very short, so it would be necessary to use evaporative cooling air-conditioning in cooperation with mechanical refrigeration.
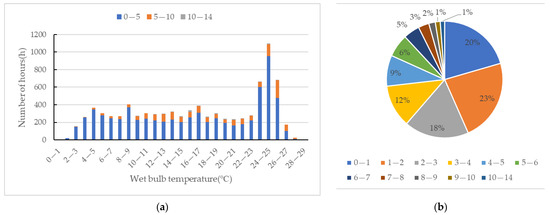
Figure 12.
(a) Hours of different dry and wet bulb temperature differences at different wet bulb temperatures in Guilin; (b) percentage of wet and dry bulb temperature differences in Guilin for the year 2000.
Figure 12b shows the percentage of the various dry and wet bulb temperature differences in Guilin throughout the year. The dry and wet bulb temperature differences are mainly concentrated in 1 °C to 3 °C, accounting for 51%; 1–2 °C accounts for 29%; 2–3 °C accounts for 22%; and 3–4 °C accounts for 15%. The percentage gradually decreases as the temperature difference increases.
4.1.7. Haikou
The annual dry and wet bulb temperatures and the difference between the dry and wet bulb temperatures in Haikou are shown in Figure 13a. The wet bulb temperature mainly ranges from 11 °C to 28 °C. The temperature difference between the wet and dry bulb temperatures is between 0 °C and 5 °C. When the wet bulb temperature is between 8 °C and 18 °C, the distribution of hours of temperature difference between the wet and dry bulb is low, and the number of hours suitable for running evaporative cooling air-conditioning throughout the year is small. Evaporative cooling air-conditioning can only run together with mechanical refrigeration.
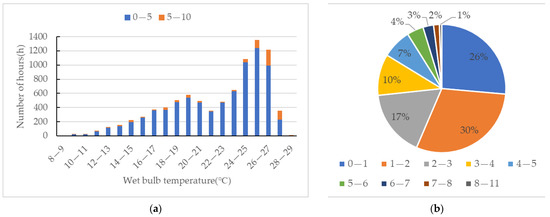
Figure 13.
(a) Hours of the various wet and dry temperature differences at different wet bulb temperatures in Haikou; (b) percentage of dry and wet bulb temperature differences in Haikou for the year 2000.
Figure 13b shows the percentage of different dry and wet bulb temperature differences in Haikou city throughout the year. The dry and wet bulb temperature differences are mainly concentrated from 0 °C to 2 °C, accounting for 56%; 0–1 °C accounts for 26%; 1–2 °C accounts for 30%; and 2–3 °C accounts for 17%. The percentage gradually decreases as the temperature difference increases.
4.1.8. Summary of the Climatic Characteristics
The climate analysis of the seven cities was divided into three zones, based on relative humidity: dry area, medium humidity area, and high humidity area. In the dry areas such as Urumqi, an indirect evaporative cooling chiller could reduce the discharge water temperature to 2 °C lower than the wet bulb temperature of the outdoor air; in medium humidity areas such as Beijing, an indirect evaporative cooling chiller could reduce the discharge water temperature to 1 °C lower than the wet bulb temperature of the outdoor air; and in high humidity areas such as Haikou, an indirect evaporative cooling chiller could reduce the discharge water temperature to the same level as the wet bulb temperature of the outdoor air. Table 5 shows the hourly number of maximum and minimum dry and wet bulb temperature differences in the seven cities.
Table 5.
Summary of the climatic characteristics.
4.2. Operating Hours of the Water and Air Systems of Indirect Evaporative Cooling Chillers in the Different Cities
4.2.1. Water Systems with Indirect Evaporative Cooling Chillers and Mechanical Refrigeration
Assuming a chiller produces a water temperature of 15 °C, Table 6 shows the operating hours of indirect evaporative cooling chillers in the seven cities. As Urumqi is in the dry region, with a large difference in wet and dry bulb temperatures throughout the year and the lowest relative humidity among the seven cities [18], the operating hours of the direct section are up to 6933 h. Haikou is in the high humidity area and has the highest relative humidity among the seven cities, so indirect evaporative cooling has to run simultaneously with mechanical cooling, and the operating hours are 8112 h.
Table 6.
Operating hours of water systems in the different modes.
4.2.2. Air Systems with Indirect Evaporative Cooling Chillers and Mechanical Refrigeration
Table 7 shows the operating hours of the seven cities using an air handling unit (AHU) in different modes. Again, Urumqi has the lowest relative humidity, and Haikou has the highest relative humidity among the seven cities. Urumqi has the longest operating hours in dry mode, at 5773 h; the seven cities in spray mode are relatively similar in terms of operating hours; Haikou has the longest operating hours in mixed mode, at 5997 h [19].
Table 7.
Operating hours of air systems in different modes.
5. Analysis of Energy Saving Potential in Data Centers
5.1. Energy Saving Renovation of Water Systems with a Combination of Evaporative Cooling and Mechanical Cooling
Table 8 shows the PUE values and energy saving rates after retrofitting with indirect evaporative cooling chillers. The PUE values of all projects drop to lower than 1.36, basically meeting the requirements [20]. The dry and wet bulb temperature difference gradually decreases as the relative humidity increases, the PUE value after retrofitting shows a trend from a low to a high value, and the energy saving rate shows a trend from a high to a low rate with the increase in the relative humidity. The Urumqi project has the best energy saving potential with retrofitting, with a PUE value reduction of 0.49.
Table 8.
Energy saving analyses of data centers with retrofitting the air-conditioning systems (water system).
5.2. Energy Savings from Air Systems Combined with Evaporative Cooling and Mechanical Cooling
Table 9 shows the PUE values and energy saving rates after retrofitting using air systems. All the PUE values drop to a value lower than 1.39, with a significant energy saving potential. The retrofitted PUE gradually increases, and the energy saving rate gradually decreases as the relative humidity increases. Urumqi has the best energy saving potential, with a reduction in PUE of 0.44, and the highest energy saving rate.
Table 9.
Data center energy saving retrofit results (air system).
6. Conclusions
This study selected data centers from seven cities, including Urumqi, Beijing, Jinan, Shanghai, Nanning, Guilin, and Haikou for research and testing, aiming to investigate the energy consumption and energy saving potential of the air-conditioning systems. The climate characteristics of the seven cities were analyzed. In addition, an energy saving strategy of a combined evaporative cooling and mechanical cooling air-conditioning system was proposed to upgrade the old air-conditioning systems, to save energy. Meanwhile, the energy saving potential of applying the proposed air-conditioning systems in the selected data centers was analyzed.
The survey of the selected data centers found that the selected data centers from seven cities all employed mechanical cooling systems, and their PUE values were almost all above 1.5. Moreover, there was no obvious relationship between energy consumption and the urban climate. The energy saving potential is huge if mechanical cooling systems are upgraded to combined evaporative cooling and mechanical cooling systems. The maximum energy saving rate is as high as 73.26% for Urumqi project A, while the lowest energy saving rate is 41.23% for Hainan project A. The energy saving rate of the proposed air-conditioning system is related to the urban climate. The drier the climate, the higher the energy saving rate.
This study carried out energy consumption research and energy saving potential analysis of the current air-conditioning systems of data centers from seven cities, which provides a reference for the energy saving renovation of old air-conditioning systems. Energy consumption and energy saving potential need to be analyzed for specific projects, due to differences in climate and project context, during the design of combined evaporative cooling and mechanical cooling systems.
Author Contributions
Conceptualization, T.S. and C.L.; funding acquisition, X.H. and R.L.; project administration, C.L.; visualization, Y.Y.; writing—original draft, T.S. All authors have read and agreed to the published version of the manuscript.
Funding
This research received no external funding.
Institutional Review Board Statement
The study does not require ethical approval.
Informed Consent Statement
The study did not involve human.
Data Availability Statement
Data not available due to privacy.
Conflicts of Interest
The authors declare no conflict of interest.
References
- Borkowski, M.; Piłat, A.K. Customized data center cooling system operating at significant outdoor temperature fluctuations. Appl. Energy 2022, 306, 117975. [Google Scholar] [CrossRef]
- Abbas, A.M.; Huzayyin, A.S.; Mouneer, T.A. Effect of data center servers’ power density on the decision of using in-row cooling or perimeter cooling. Alex. Eng. J. 2021, 60, 3855–3867. [Google Scholar] [CrossRef]
- Kandasamy, R.; Ho, J.Y.; Liu, P. Two-phase spray cooling for high ambient temperature data centers: Evaluation of system performance. Appl. Energy 2022, 305, 117816. [Google Scholar] [CrossRef]
- Wang, S.; Wang, S. Research on data center energy efficiency indicators and energy consumption models. Inf. Commun. Technol. Policy 2019, 2, 18–21. [Google Scholar]
- Cheng, Y. A preliminary study on the development trend of data center technology. Digit. Technol. Appl. 2021, 39, 98–100. [Google Scholar]
- Jin, C. Development trend of greening data center in China and reflections. Inf. Technol. Stand. 2021, 12, 50–52. [Google Scholar]
- Guo, L. Fulfilling the characteristics of “four highs” and orderly promoting the development process of new data centers in the 14th Five-Year Plan. Commun. World 2021, 23, 18–21. [Google Scholar]
- Implementation Plan for Promoting Green and High-Quality Development of Data Center and New Infrastructure such as 5G by Implementing the Carbon Neutral Target of Carbon Peaking; National Development and Reform Commission: Beijing, China. 2021; Volume 11, p. 30. Available online: https://www.ndrc.gov.cn/xxgk/zcfb/tz/202112/t20211208_1307104.html?code=&state=123 (accessed on 5 May 2023).
- Data Centre Annual Development Study. 2019–2021; China Architecture & Building Press: Beijing, China, 2022.
- CDCC China Data Centre Market Report; CDCC: Beijing, China, 2021.
- Peng, Y.F.; Sun, Y.F.; Liang, X.; Liang, B. Characteristics and Applications of New Generation Prefabricated Modular Data Center. China Telecom Ind. 2021, S1, 41–49. [Google Scholar]
- Sun, C.P. Design and application of intelligent systems for data center projects. Intell. Build. Smart City 2021, 9, 8–10. [Google Scholar]
- Wen, L. Methodological dimensions and cutting-edge trends in data center PUE reduction. Telecommun. Express 2022, 6, 43–46. [Google Scholar]
- Xu, S. Exploring energy-saving technologies for green data center. Constr. Technol. 2019, 12, 33–36. [Google Scholar]
- Boulder, N. NSIDC Data Center: Energy Reduction Strategies Airside Economization and Unique Indirect Evaporative Cooling; Department of Energy, U.S.: Washington, DC, USA, 2012.
- Xu, S.; Zhang, H. Thermal Management and Energy Consumption in Air, Liquid, and Free Cooling Systems for Data Centers: A Review. Energies 2023, 16, 1279. [Google Scholar] [CrossRef]
- Coad, W.J. Open chilled-water systems for free cooling—A simple concept that lack simplicity. ASHRAE Trans. 1994, 7, 805–810. [Google Scholar]
- Theodore, A.; Ndukaife, A.G.; Agwu, N. Optimization of Water Consumption in Hybrid Evaporative Cooling Air Conditioning Systems for Data Center Cooling Applications. Heat Transf. Eng. 2019, 40, 559–573. [Google Scholar]
- Aayush, A.; Mayank, K.; Sanjeev, J. Transient simulation of wet cooling strategies for a data center in worldwide climate zones. Energy Build. 2016, 127, 352–359. [Google Scholar]
- Stefano, D.A. Experimental analysis of a cross flow indirect evaporative cooling system. Energy Build. 2016, 121, 130–138. [Google Scholar]


Disclaimer/Publisher’s Note: The statements, opinions and data contained in all publications are solely those of the individual author(s) and contributor(s) and not of MDPI and/or the editor(s). MDPI and/or the editor(s) disclaim responsibility for any injury to people or property resulting from any ideas, methods, instructions or products referred to in the content. |
© 2023 by the authors. Licensee MDPI, Basel, Switzerland. This article is an open access article distributed under the terms and conditions of the Creative Commons Attribution (CC BY) license (https://creativecommons.org/licenses/by/4.0/).