Abstract
Tax reduction policies can promote economic development, employment, and social equity in the short term. Especially during economic downturns, their effects are even more pronounced. Following the massive tax cuts amounting to 4 trillion yuan in China in 2022, the government work report for 2023 has revealed that tax reduction will continue to be the central theme of fiscal policies. However, amidst a backdrop of economic growth slowdown, China is facing objective challenges such as sluggish growth in fiscal revenues, rising inflexibility in fiscal expenditures, mounting debt burdens, and fiscal imbalances among regions, which pose severe threats to fiscal sustainability. This paper selects panel data from 30 provinces in China from 2009 to 2019. Controlling for provincial and year fixed effects, FGLS method is used to empirically test the impact of tax reduction policies on fiscal sustainability. The results indicate that tax reduction significantly undermines fiscal sustainability, which exhibits a certain degree of persistence. Heterogeneity tests reveal that tax reduction policies have more pronounced inhibitory effects on fiscal sustainability in western regions, regions with lower proportions of the tertiary industry, and regions with higher levels of fiscal decentralization. Further analysis demonstrates that tax reduction primarily impacts local fiscal sustainability through two channels: stimulating enterprise production and distorting local government behavior. Based on these findings, our study proposes the need to moderate the pace of overall tax reduction policies in China, implement tax reduction policies with varying intensities tailored to regional characteristics, and promote tax reduction policy dividends as well as reduce policy costs to enhance fiscal sustainability.
1. Introduction
In response to downward economic pressure, uncertainty risks, and the need for deeper supply-side structural reforms, China has implemented a series of tax reduction policies since the introduction of “structural tax reduction” in 2008. According to the reform objectives, policy strength and performance characteristics, China’s tax reduction policies can be summarized into three stages [1]. The first stage, from 2008 to 2011, focused on structural tax reductions, including an increase in export rebate rates, value-added tax VAT transformation and income tax rate adjustments. The second stage, from 2012 to 2017, involved further improving structural tax reduction policies in conjunction with tax system reforms. The main focus during this stage was on the pilot program for replacing business tax with VAT and its subsequent nationwide implementation. Other important measures included accelerated depreciation of fixed assets for corporate income tax, increased deduction ratio for enterprise R&D expenses, and a reduction in unemployment insurance premium rates. The third stage, starting from 2018, witnessed a larger-scale tax reduction policy, characterized by a combination of structural and inclusive tax cuts. This included lowering VAT rates, reducing social insurance premium rates, and introducing a series of phased tax and fee exemptions in response to the impact of the COVID-19 pandemic. Especially since 2019, local governments at all levels in China have increased the precision and phased intensity of tax reduction measures while implementing larger-scale tax reduction policies. In 2022, the total amount of tax reduction and fee reduction exceeded 4.2 trillion yuan, accounting for 3.50% of that year’s GDP.
The continuous implementation of tax reduction policies has impacted the growth rate of local government revenue. Under the constraints of rigid expenditure reduction, the contradiction between local government revenue and expenditure has become more prominent. Under the tax reduction policies, various uncertainties have accumulated, leading to increased fiscal pressure. The fiscal sustainability is facing unprecedented challenges. According to Figure 1, as the intensity of tax reduction increases, the overall growth rate of tax revenue shows a declining trend, and fiscal pressure has been rising year by year. Meanwhile, the per capita GDP growth rate has been slowing down. This indicates that China’s tax reduction policies have posed a significant threat to fiscal sustainability without achieving the intended goal of supporting economic growth.
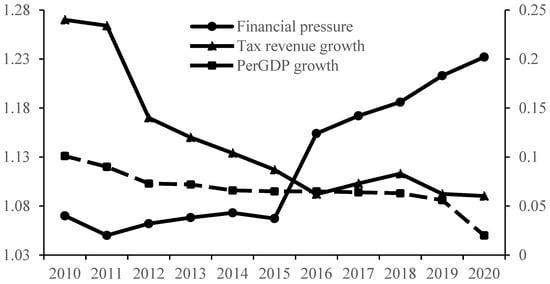
Figure 1.
Growth Rate of Tax Revenue, Fiscal Pressure, and Per Capita GDP during the Period of Tax Reduction.
High-quality operation of fiscal sustainability is the foundation and important pillar of national governance, as well as a crucial factor in ensuring stable economic development and social-political stability in regions. Under the fiscal decentralization system, such a large-scale, wide-ranging and protracted tax reduction policy is superimposed on factors such as economic revenue reduction, rigid fiscal expenditure, government debt expansion, and low efficiency of fiscal expenditure, which has caused tremendous pressure on local finances, restricted the smooth operation of local finances, and posed a threat to the sustainable development of economic and social undertakings. Hence, in order to address the current challenges of local finances, it is imperative to conduct comprehensive research on how tax reduction policies impact the sustainability of local finances and to what extent, within the existing fiscal and taxation framework in China. Targeted strategies and recommendations should be formulated to facilitate high-quality and sustainable operation of local finances.
2. Literature Review
2.1. A Literature Review on Fiscal Sustainability
As early as 1923, Keynes pioneered the concept of “sustainable fiscal policy” while studying France’s debt problems. He believed that if a country’s fiscal revenue cannot cover the interest payments and costs of issuing new debt, the issuance of government bonds would become unsustainable, and fiscal sustainability would not be achieved. The concept was first rigorously defined from an academic perspective in 1985, when Buiter W.H., et al. pointed out that fiscal sustainability is the survival status or capacity of a country’s finances as an economic entity, which requires maintaining the ratio of the net worth of the public sector to output at current levels [2]. He, D.X. and Zhang, F.Y. defined fiscal sustainability as the government’s own revenue being able to cover its public expenditure [3]. Furceri, et al. used a dynamic stochastic general equilibrium approach to confirm the short-term effectiveness of government debt as a fiscal stimulus policy [4], while Ghosh, et al. argued that the government can adjust its fiscal behavior within a limited degree (fiscal space) and used a non-linear response function to measure changes in the government debt-to-GDP ratio [5].
In China, scholars have understood fiscal sustainability from various perspectives such as resources, debt, balance of payments, and comprehensive analysis. Some representative views include Liu, S.X.’s belief that fiscal unsustainability mainly refers to the possibility of damage to the stability and development of the economy, politics, and society, due to insufficient public resources to fulfill the government’s expenditure responsibilities and obligations at some future point [6]. Deng, Z.J. pointed out that fiscal sustainability means that the current level of government debt must be equal to the initial fiscal surplus present value, assuming an infinite period and the ability to borrow new debt to pay off old debt and maintain currency stability [7]. Yu, Y.D. defined the concept as the government’s ability to maintain a long-term balance of payments, stabilize the state by issuing government bonds to finance fiscal deficits, and use the interaction between economic variables to restore or move towards a stable fiscal state [8].
Given the aforementioned viewpoints, existing literature mainly analyzes fiscal sustainability from three perspectives: fiscal expenditure, fiscal revenue, and debt. However, this analysis based on the three factors only considers fiscal sustainability at the overall national level, neglecting the structural fiscal sustainability. After all, all levels of government are major participants in tax reduction and fee reduction, and the fiscal balance between regions will inevitably affect the structural fiscal sustainability. Although China has a transfer payment system to balance this, the transmission mechanism is not entirely smooth, and there is a certain lag effect. Based on this, this paper integrates fiscal expenditure and fiscal revenue into the calculation of sustainability indicators and controls for local debt, fiscal capacity, and regional fiscal decentralization in the regression analysis.
2.2. A Literature Review on Tax Reduction Policy
In response to the economic impact of financial crises and COVID-19, countries around the world have generally adopted tax relief measures. To this end, the Organization for Economic Co-operation and Development (OECD) has compiled and summarized the specific policy content of tax relief measures implemented by various countries and regions worldwide [9]. The study found that the 66 countries and territories participating in the survey (including all OECD and G20 countries, as well as 21 inclusive framework members participating in the survey) have adopted various tax policies and management measures, including corporate income tax (CIT) and other business taxes, personal income tax (PIT) and social security taxes (SSC), value-added tax (VAT) and other consumption taxes, and environmental taxes.
Especially in China, where the economy has shifted from a high-speed growth phase to a high-quality development phase, tax reduction and fee reduction have become a key macroeconomic policy focus during the economic transition period, aimed at activating the vitality of microeconomic entities and fostering new economic growth drivers. According to existing research, scholars have explored the nature and positioning of China’s tax reduction policies, as well as evaluated their effectiveness and impact. On the one hand, the scale of tax reduction and fee reduction has been expanding year by year; on the other hand, the tax reduction model has shifted from preferential tax reduction to universal tax reduction, focusing on small and micro enterprises. From the existing literature, tax reduction and fee reduction policies have achieved the expected goals, releasing tax reduction dividends (Shen, et al.) [10], not only improving the total factor productivity and performance of enterprises (Wu, et al.) [11]; (Zheng and Zhang) [12]; (Fan, et al.) [13], but also improving the market environment (Jia, J.X.) [14], stimulating the long-term development of enterprises, promoting investment and research and development innovation (Liu, et al.) [15], and promoting a virtuous cycle of long-term development for enterprises.
Existing literature has mainly focused on discussing either the benefits or the costs of tax reduction policies, without considering the net utility of such policies by integrating both. This article aims to explore the magnitude of the benefits and costs of tax reduction policies separately, based on their mechanisms, and calculate the positive or negative net utility they bring.
2.3. A Literature Review on the Relationship between Tax Reduction Policies and Fiscal Sustainability
Tax reduction policy refers to a policy measure in which the government lowers the level of taxation or reduces the number of tax categories to promote economic growth and enhance national competitiveness. The implementation of tax reduction policies can have an impact on fiscal sustainability, leading to issues such as fiscal balance and debt pressure. Therefore, the impact of tax reduction policies on fiscal sustainability has become a highly discussed topic.
Academia generally believes that structural tax reductions will lead to a decrease in fiscal revenue [16]. Feng, Q.B. have conducted in-depth analysis of the overall situation of the 2019 tax cuts and fee reductions, comprehensively and systematically sorting out the four types of government revenues, including taxes, fees, rents, and prices [17], which is beneficial for enhancing government fiscal sustainability and ensuring the effectiveness of tax cuts and fee reductions. Du, T.W., et al. have explored the possible impact and mechanisms of tax cuts and fee reductions on the fiscal sustainability of local governments from the perspective of economic growth, using the local government debt ratio as a proxy variable for fiscal sustainability [18]. They believe that tax cuts and fee reductions bring pressure to the fiscal funds of local governments, prompting them to expand their borrowing scale, which is not conducive to the fiscal sustainability of local governments. Yang, Z.W., et al. have also constructed indicators to measure fiscal sustainability based on the discounted value method and used specific cases to demonstrate that tax cuts and fee reductions have a significant negative impact on the fiscal sustainability of local governments [19]. Some research conducted on foreign countries has found that tax reduction policies can lead to a decrease in fiscal revenue, thereby affecting fiscal sustainability, and even to some extent, affecting a country’s creditworthiness [20,21,22]. Especially for countries with significant fiscal deficits, tax reduction policies may exacerbate their fiscal sustainability issues (IMF) [23].
Indeed, there are also scholars who hold opposing views, suggesting that tax reduction policies can promote economic growth, increase fiscal revenue, and, at the same time, enhance fiscal sustainability [24,25]. However, there are also studies that have found heterogeneity in the impact of structural tax reductions on fiscal revenue across different levels of government and different regional industrial structures (Zhou, B. and Du, L.S.) [26].
Overall, the literature suggests that the relationship between tax reduction policies and fiscal sustainability is complex and context-dependent. While tax reductions may have short-term benefits, their long-term effects on fiscal sustainability depend on a variety of factors, including the level of government debt, the effectiveness of government spending, and the overall health of the economy. But research on the impact of structural tax cuts on fiscal sustainability is mainly at the theoretical and empirical level, and there is a lack of empirical verification based on econometric models (Guo, Q.W.) [27]. At the same time, some empirical test results are inconsistent, and the positive or negative correlation between the two has not been confirmed to be consistent. Therefore, this study aims to use empirical testing to determine the sign of this correlation.
3. Theoretical Analysis and Research Hypotheses
3.1. The Impact of Population Aging on Fiscal Sustainability
Tax revenue is a major source of national fiscal income, and China’s tax system is predominantly composed of indirect taxes that exhibit pro-cyclical characteristics. Moreover, personal income tax has a progressive nature, which means that low-income individuals bear a larger tax burden, with significant implications for government fiscal balance, social harmony, and stability. Under the current pressure to increase fiscal revenue, local governments are facing increasing risks of debt, and may face intensified uncertainties in debt repayment. In recent years, local governments have issued bonds continuously, and the coming years will be a critical period for debt repayment, which may pose significant risks to local finances. However, tax revenue is a major source of national fiscal income, and China’s tax system is predominantly composed of indirect taxes that exhibit pro-cyclical characteristics. Moreover, personal income tax has a progressive nature, which means that low-income individuals bear a larger tax burden, with significant implications for government fiscal balance, social harmony, and stability. Under the current pressure to increase fiscal revenue, local governments are facing increasing risks of debt, and may face intensified uncertainties in debt repayment. In recent years, local governments have issued bonds continuously, and the coming years will be a critical period for debt repayment, which may pose significant risks to local finances. Under the backdrop of tax reduction policies, various uncertainties continue to accumulate, resulting in increased fiscal pressure, particularly at the local government level. The sustainability of public finances is facing unprecedented challenges [28]. Based on the research and facts mentioned above, this paper proposes:
Hypothesis 1.
China’s tax reduction policy has a negative impact on the fiscal sustainability.
3.2. The Impact of Tax Reductions on Fiscal Sustainability Varies across Different Regions
With the improvement of China’s economic level and the enhancement of residents’ consumption capacity, the proportion of value-added of the primary industry in GDP has been declining, while the proportion of value-added of the secondary and tertiary industries in GDP has been increasing. These three industries contribute differently to fiscal revenue. Overall, the primary industry makes a relatively small contribution to fiscal revenue, while the secondary industry makes a significant contribution. Meanwhile, the tertiary industry is rapidly rising and gradually becoming a new growth point for fiscal revenue. Due to the potential environmental pollution and other serious issues associated with the growth of second-industry related sectors, the development of the tertiary industry is of greater significance for the sustainable growth of fiscal revenue. Based on regional differences and varying levels of economic development, fiscal revenue relies on different industries. In economically developed regions such as Guangdong, the contribution of the secondary and tertiary industries, particularly the service sector, to fiscal revenue is significant. However, in less developed regions such as Gansu, the manufacturing industry in the secondary sector is the main source of fiscal revenue, despite the potential for significant development in the tertiary industry. Therefore, strategies related to tax incentives and industrial structure in different regions and cities, based on their size and economic conditions, have significant impacts on fiscal sustainability (Ghosh, A.R., et al.) [29].
In addition, economically developed regions tend to have a higher proportion of tax revenue and a relatively lower proportion of transfer payments. The local governments in these regions also have a lower degree of fiscal decentralization, with sufficient financial resources and strong fiscal capacity. Therefore, they can offset fiscal deficits through adjusting their own fiscal behavior and issuing government bonds. However, this also means that tax reduction policies are more likely to trigger “reverse incentives”, leading to increased borrowing and expanded government spending, which may have negative impacts on fiscal sustainability, although these impacts are relatively small. In economically underdeveloped regions, transfer payments tend to constitute a higher proportion of available local financial resources, while tax revenue proportion is relatively low. The local governments in these regions have a higher degree of fiscal decentralization, weak economic foundations, and limited financial resources. They have a weaker capacity to ensure effective fiscal operations through adjusting their own fiscal behavior and issuing debt. Therefore, tax reduction policies can result in “exacerbating effects” for these regions. In situations where local fiscal operations are already challenging, further reduction of fiscal revenue will worsen fiscal sustainability and generate greater negative impacts. (Chen, J. and Li, J.) [30]. Based on the aforementioned research and facts, this article proposes:
Hypothesis 2.
The impact of tax reduction policies on local fiscal sustainability will vary depending on geographical location, industrial structure, and degree of fiscal decentralization. The negative effects are more pronounced in western regions, areas with a lower share of tertiary industry in their economic structure, and regions with a higher degree of fiscal decentralization.
3.3. The Path of the Tax Reduction Policy on Fiscal Sustainability
As shown in Figure 2, tax reduction policy primarily impacts fiscal sustainability through two mechanisms. On one hand, the core of structural tax reduction policy is to relatively reduce the government’s direct allocation of resources, allowing market entities to obtain a larger share of resource allocation and decision-making power in a fair competitive environment, thereby adjusting the relationship between local governments and the market, stimulating market vitality, and promoting economic development. Liu, Q., Lu, Y. [31] proposed that tax reduction achieves the goal of enhancing corporate investment motivation and capacity by lowering the tax burden on enterprises, increasing corporate profits, and improving economic efficiency, particularly manifested in the stimulation of fixed asset investment by enterprises (Lan, F., et al.) [32]. On the other hand, under the condition of unchanged local expenditure pressure, the relative reduction of local fiscal revenue caused by structural tax reduction further exacerbates vertical fiscal imbalance, leading to an expansion of the fiscal deficit and prompting local governments to seek other sources of income to meet expenditure needs. As mentioned by Gu, C. and Pan, X.Y. [33], non-tax revenue and implicit debt, among others, can ultimately lead to a decrease in local fiscal sustainability. Due to the sustained expansion of fiscal revenue pressure, local governments may have a strong motivation to borrow implicit debt through off-budget financing channels such as local investment and financing platforms, PPP projects, and shadow banking. This can result in the accumulation of implicit debt by local governments, which may pose risks of systemic fiscal and financial risks, hinder high-quality economic development, and create hidden risks to fiscal sustainability. Based on the above research and facts, this paper proposes:
Hypothesis 3.
Tax reduction policies can provide safeguards for the sustainability of local fiscal policy by promoting fixed asset investment and innovation research and development. However, they may also lead to distortions in the structure of local revenue and increase the burden of hidden debts, thereby inhibiting the sustainability of local fiscal policy. It’s important to note that the costs of tax reduction policies may outweigh the benefits of tax revenue.
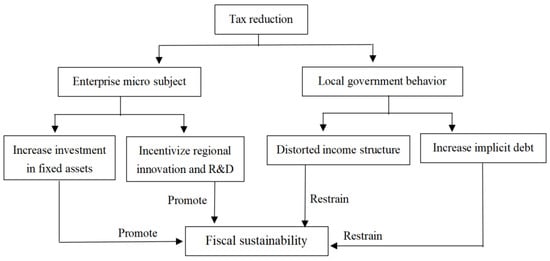
Figure 2.
Mechanism of the impact of tax reduction on fiscal sustainability.
4. Model Settings, Variable Descriptions, Data Descriptions and Sources
4.1. Model Settings
Based on the above theoretical analysis and drawing on the research of Zhang, L. et al. [34], to test Hypothesis 1, this study sets up the following panel data regression model:
where i represents the Chinese province under study, t represents the year; FiscSustain represents local fiscal sustainability; ReTax represents the tax reduction indicator; X represents control variables; α represents the coefficient of the explanatory variable ReTax, which is the main parameter of interest; δ′ represents the coefficient matrix of control variables, u represents the regional random effects, η represents the year fixed effects; represents the random error term.
Considering the potential endogeneity issue caused by the impact of past-year fiscal sustainability on current-year fiscal sustainability, this study incorporates the first lagged terms of fiscal sustainability and tax reduction, denoted as and , based on Equation (1), to establish a dynamic panel regression model as follows:
To test Hypothesis 2, this study first divides the sample into three categories based on the regions of East, Central, and West. Then, the sample regions are further classified into two categories based on the level of the third industry’s structure, i.e., high and low, and regression analysis is conducted on Equation (1) separately for each category. Finally, to explore the heterogeneity across regions with different degrees of fiscal decentralization, the variable Group is introduced as a control variable, and the following regression model is constructed for further examination:
To test Hypothesis 3, this study introduces four mechanism variables, including fixed asset investment of enterprises (Invest), the number of invention patents from innovation inputs (Patent), non-tax revenue (NonTax), and implicit debt (ImDebt), to replace the dependent variable in Equation (1) for regression analysis.
4.2. Variable Descriptions
4.2.1. Dependent Variable
The dependent variable in this study is fiscal sustainability, which is used to measure whether a government’s financial situation can maintain a healthy state over the long term without collapsing due to factors such as budget deficits, excessively high debt levels, or other unsustainable factors. At the core of fiscal sustainability is the ability of governments to maintain long-term balance between their revenues and expenditures, while being able to address future fiscal risks and challenges and ensuring the provision of necessary public services and welfare for their citizens. Therefore, following Liu, Q.Z. and Zhao, D.P. [35], we refer to Aristovnik’s indicator of fiscal burden to represent fiscal sustainability as [36], where FiscalExp represents government expenditure and FiscalRev represents government revenue, as the measure of fiscal sustainability.
4.2.2. Core Explanatory Variables
In this study, the explanatory variable of interest is the tax reduction indicator. Considering the significant contribution of large enterprises to fiscal revenue at the provincial level, fluctuations in tax payments by any single enterprise can cause significant changes in government revenue and expenditure. Therefore, following the study by Danielova, A. and Sarkar, S. [37], this study selects the “tax reduction indicator for large-scale enterprises” as the explanatory variable, which reflects the average annual amount of tax reduction for large-scale enterprises (i.e., industrial legal persons with an annual main business income of 20 million yuan or more) affected by tax reduction policies. In addition, this study also includes the “per capita tax reduction revenue indicator” and the “per capita tax reduction fiscal revenue indicators”. The latter is an indicator that reflects the actual impact on local fiscal revenue after deducting the amount of tax reduction revenue transferred to the central government from the former.
4.2.3. Control Variables
Due to the uneven and unequal development among various provinces in China, this study introduces 4 control variable indicators that affect local fiscal sustainability from the perspectives of economic development, fiscal system, and regional characteristics. The specific definitions and calculation formulas can be found in Table 1. Considering the impact of scale effects, all indicators in this study are based on per capita data. Among them, the fiscal decentralization indicator is measured based on previous research, taking into account transfer payments, fiscal expenditures, and fiscal revenues.

Table 1.
Variable description.
4.2.4. Mediating Variables
This study draws on Cai Xeta’s research [38] and selects four mediating variables to represent four pathways of influence. From the perspective of enterprises, the production incentive effect is reflected in the increase of fixed asset investment and innovation input. The former can be measured by enterprise fixed asset investment (Invest), and the latter can be represented by the number of output invention patents (Patent), which refers to the quantity of provincial-level invention patents. As for the distortion of government behavior due to tax reduction policies, it is mainly reflected in the increase of non-tax revenues other than tax revenues for local governments. On the one hand, this study uses the ratio of the growth rate of non-tax revenues (NonTax) to the growth rate of GDP to measure the change in non-tax revenues. On the other hand, it uses the ratio of the balance of interest-bearing debts of local investment and financing platforms to GDP, as calculated by Mao, J. and Xu, J.W. [39], to represent the burden of implicit debts (ImDebt) of local governments.
The specific definitions and calculation formulas for the variables are shown in Table 1, as depicted.
4.3. Descriptive Statistics and Data Sources
Considering the availability of data from various provinces and changes in the statistical caliber of fiscal data, this study uses panel data from 30 provinces (excluding Tibet) for the years 2009–2019 for empirical analysis, utilizing the approach proposed by Qiong, Z.L. and Zhao, D.P. [35]. Some local fiscal data is sourced from the “Report on the Execution of Fiscal Budget and the Draft of Fiscal Budget” disclosed by the government, while central fiscal data is sourced from the annual “Central Final Accounts Report”. Other economic, population, and central-related variables data are sourced from the “China Statistical Yearbook”. Enterprise fixed asset data is sourced from the industrial enterprise database, aggregated at the provincial level, and provincial-level invention patent data is sourced from the China Foreign Patent Information Service Platform.
The descriptive statistics of all variables are shown in Table 2. The mean of fiscal sustainability in China is 0.597, with a maximum value of 2.491 and a minimum value of only 0.194. The standard deviation is 0.437, indicating significant differences in fiscal sustainability among different provinces. The three variables related to tax reduction show a large disparity in their maximum and minimum values, with large standard deviations, indicating significant differences in the response of different provinces to tax reduction policies. The significant heterogeneity among provinces in these key indicators also implies that Hypothesis 2, which suggests that the impact of tax reduction policies on fiscal sustainability varies across regions, may hold true. The descriptive statistics of other control and mechanism variables are generally consistent with existing literature, providing confidence for subsequent regression analysis.
Table 2.
Descriptive Statistics.
5. Empirical Analysis
5.1. Basic Regression
In this study, we first conducted preliminary empirical tests on the research hypotheses using a static panel data model. The F-test and LR-test both indicate that a fixed-effects panel data model should be established in this study, and the Housman test supports the use of an individual fixed-effects model. Based on theoretical analysis and Chen, S.W. research [40], the basic regression employed feasible generalized least squares (FGLS) to estimate the constructed Model (1), in order to overcome potential issues of heteroscedasticity and autocorrelation in the regression. Model I, Model II, and Model III were estimated using the “tax reduction for large enterprises” indicator with three fiscal decentralization indicators, while Model IV, Model V, and Model VI were estimated using the “per capita tax reduction and fee income” indicator with the same three fiscal decentralization indicators. The estimation results are given in Table 3.
Table 3.
Basic Regression.
According to the regression results in Table 3, regardless of the definitions of the main explanatory variable and control variables, the estimated coefficients of our main explanatory variable ReTax are negative and statistically significant at the 1% level. This negative sign indicates that an increase in the degree of tax reduction and fee reduction will weaken fiscal sustainability, that is, tax reduction policies have a negative impact on China’s fiscal sustainability, verifying Hypothesis 1 as proposed earlier. The consistency of the signs further supports the robustness of the regression results. Taking into account the research background discussed earlier, this study speculates that the negative sign may primarily be due to the fact that large-scale tax reduction has been the main tone of China’s proactive fiscal policy in recent years, while local governments at various levels are struggling to balance their fiscal revenue and expenditure, with increasing rigidity in expenditure and insufficient revenue growth, coupled with the expanding scale of local government debt, among other factors.
5.2. Robustness Test
To validate the robustness of the basic regression results, this study use two alternative methods: first, by changing the estimation methods, using feasible generalized least squares (FGLS) and maximum likelihood estimation (MLE) methods for estimation. The reason why we chose the MLE method as a replacement for the regression method is that Bohn, H. suggests that MLE is an effective, efficient, consistent, and asymptotically optimal method for parameter estimation [41], which can minimize the interference of other factors in regression analysis to the greatest extent. Secondly, in the basic regression of the previous section, we used two indicators to measure the degree of tax reduction and changed the calculation method for controlling the variable of fiscal decentralization, resulting in six basic regression results. In all six regressions, the coefficient of the core explanatory variable ReTax remained consistently negative and statistically significant at the 1% significance level, validating the robustness of the conclusions and their mutual verification. In addition, in this section, we replaced the measurement of tax reduction with the “per capita tax reduction fiscal revenue indicator” and estimated the models using three fiscal decentralization indicators sequentially, with the results given in Table 4. Column I mainly used the FGLS method for estimation, and Column II used the MLE method for estimation.
Table 4.
Robustness test-change the regression method and variable definitions.
From the empirical results in Table 4, regardless of the regression method used and the fiscal decentralization index chosen, the regression coefficient of the core explanatory variable ReTax always remains negative and statistically significant at the 1% level, with little difference among the different regression results. It can be seen that the negative impact of tax reduction policies on local fiscal sustainability as demonstrated in the basic regression is reliable and robust, fully verifying the correctness of Hypothesis 1 proposed in this paper.
5.3. Endogenous Processing
Considering the temporal persistence of fiscal sustainability and the possibility of lagged effects of tax reduction policies, this study introduces the first-order lagged variables of the dependent variable and the core explanatory variable, and establishes a dynamic panel data model (2). The Two-Step System GMM (Generalized Method of Moments) estimation method is used to control for unobserved provincial heterogeneity, autocorrelation of variables, and endogeneity issues (Roodman, D.) [42]. Given the possibility of reverse causality between tax reduction and fiscal decentralization and the dependent variable, which may result in endogeneity issues, we treat these two variables as endogenous variables and assume that other variables are weakly exogenous. Additionally, we use their own lagged values as instrumental variables to address potential endogeneity concerns.
According to the results in Table 5, the Hansen test, AR (1) and AR (2) tests indicate that error terms are not second-order serially correlated and that the instruments used in the model are valid instruments. Consequently, such results indicate that the model satisfies the conditions for efficient and consistent estimators of system GMM. From the regression coefficients, we can observe that the lagged value of the dependent variable has a positive impact on the current fiscal sustainability, suggesting that fiscal sustainability has some inertia. Meanwhile, the coefficient of the lagged tax reduction variable is significantly negative, indicating that the tax reduction policy in the previous period still has a negative impact on the current fiscal sustainability. In addition, the regression coefficients of the main explanatory variables in the three models are consistently positive or negative, with similar magnitudes and strong statistical significance. The negative sign of the ReTax regression coefficient always remains negative, indicating that after controlling for endogeneity issues, tax reduction policies still have a negative impact on fiscal sustainability. All of the regression results mentioned above indicate that the conclusions of our benchmark regression are relatively reliable, further verifying the validity of Hypothesis 1.
Table 5.
Endogenous test.
5.4. Heterogeneity Test
Due to China’s uneven development in social and economic aspects, the impact of tax reduction policy on fiscal sustainability may vary among different regions. To verify Hypothesis 2, this study conducts a regional subgroup analysis and heterogeneity analysis. The sample is divided into three groups based on geographical location: East, Central, and West, and econometric regressions are performed separately for each group, corresponding to Columns (1) to (3) in Table 6. The regression results show that the tax reduction policy has a significant weakening effect on fiscal sustainability in the Western region, little to no effect in the Central region, and a significant positive impact in the Eastern region. This may be because the developed Eastern region not only has a relatively strong fiscal capacity to withstand the policy costs brought by transformational reforms, but also has a solid foundation in industrial agglomeration and integration. The tax reduction policy aligns with and stimulates the integrated development of manufacturing and service industries in these regions, allowing the policy dividends to be fully realized and providing intrinsic impetus for fiscal sustainability. In addition, the regional heterogeneity in the impact of tax reduction policy also indicates that it may exacerbate the already existing imbalance in local fiscal conditions to some extent.
Table 6.
Heterogeneity test of geographic location and industrial structure.
Due to the fact that tax reduction mainly focuses on the service industry, different regions with different industrial structures may be affected by the reform differently. In this study, based on the industrial structure indicators of the sample in 2012, the sample is divided into two sub-samples: one with a lower proportion of the tertiary industry and one with a higher proportion of the tertiary industry, for regression analysis. The results are shown in Columns (4) and (5) of Table 6. The regression results in Column (4) for provinces with a lower proportion of the tertiary industry show that the coefficient of ReTax is significantly negative at the 1% level, indicating a significant impact of tax reduction on regions with a lower proportion of the tertiary industry. However, the regression results in Column (5) show that although the coefficient of the tax reduction variable is still negative, it is no longer significant, indicating that the tax reduction policy has little impact on the fiscal sustainability of regions with a higher proportion of the tertiary industry, and the negative effect disappears. The above regression results may be due to the fact that although the tax reduction policy may increase fiscal pressure on the government, it can also promote the local economy by directly reducing the tax burden on the service industry, thereby affecting fiscal sustainability. However, the ultimate effect of the policy dividend enjoyed by the manufacturing industry on the fiscal side is not obvious. This suggests that the direct effects of the policy may be more significant in the short term, while the indirect effects may be difficult to reflect due to lagged effects.
Based on theoretical analysis, it has been determined that in regions with higher fiscal decentralization, tax cuts may have a more negative impact on fiscal sustainability. Therefore, this study verifies the above hypothesis through group regression analysis, following the approach of Chen, X.L., et al. [43]. The study constructs an empirical model (Model 3) by introducing the control variable “Group”. The grouping is based on the average values of fiscal decentralization expenditure indicators, with Group taking the value of 1 when the fiscal decentralization expenditure indicator is higher than the mean, and 0 otherwise. Two tax cut indicators, “tax cuts for large enterprises” and “tax cuts per capita as a percentage of tax revenue”, are used sequentially. Maximum likelihood estimation (MLE) is employed, and the regression results are given in Table 7. The coefficient of ReTax reflects the impact of tax cuts on fiscal sustainability in the group with lower fiscal decentralization, while the coefficient of the interaction term Group*ReTax reflects the differences in regression coefficients between the group with higher fiscal decentralization and the group with lower fiscal decentralization.
Table 7.
Heteroscedasticity test of fiscal decentralization level.
Based on the results in Table 5, it is evident that the coefficient of the interaction term Group*TACX is significantly negative at the 1% level, indicating that in regions with higher fiscal decentralization, the negative impact of tax cuts on fiscal sustainability is more severe.
In summary, the heterogeneity regression results above validate the impact of tax cuts on fiscal sustainability in line with the mainstream views of previous scholars. The impact of tax reduction policies on local fiscal sustainability will vary depending on geo-graphical location, industrial structure, and degree of fiscal decentralization. The negative effects are more pronounced in western regions, areas with a lower share of tertiary industry in their economic structure, and regions with a higher degree of fiscal decentralization. Our Hypothesis 2 has been fully verified.
5.5. Mediation Effect Test
Based on theoretical analysis, this study examines four potential pathways through which tax cuts may affect fiscal sustainability, including fixed asset investment, regional innovation and R&D, distortion in income structure, and implicit debt burden. In Equation (1), the dependent variable FiscSustain is replaced with mechanistic variables corresponding to these four pathways, namely, corporate fixed asset investment (Invest), number of invention patents (Patent), non-tax revenue (NonTax), and implicit debt (ImDebt), respectively, for empirical testing.
The regression results for the impact mechanisms are shown in Table 8. In Column (1), with fixed asset investment as the dependent variable, the coefficient of the tax cut variable is significant at the 1% level, indicating that tax cuts have a significant positive effect on corporate fixed asset investment (Invest). In Column (2), with the number of invention patents as the dependent variable, the results show that the coefficient of the tax cut variable is significant at the 1% level, indicating that tax cuts have a positive impact on regional innovation and R&D. Columns (3) and (4) present the results for non-tax revenue and implicit debt, respectively. The coefficients of the tax cut variable are both significant and positive, indicating that the revenue pressure caused by tax cuts has influenced local government behavior, leading to distortion in fiscal revenue structure and an increase in implicit debt burden.
Table 8.
Mechanism test results.
The above regression results suggest that, on the one hand, tax cuts can stimulate the vitality of micro-level corporate entities by promoting increased fixed asset investment and innovation research and development, expanding the potential tax base, and providing support for fiscal sustainability. On the other hand, the fiscal pressure brought about by tax cuts may also affect local government behavior, leading to distortion of local revenue structure and an increase in implicit debt burden, which ultimately may hinder fiscal sustainability. However, overall, the positive effects of tax cuts on fiscal sustainability are slightly lower than the negative effects of their costs, indicating that the policy effects tend to weaken fiscal sustainability, supporting Hypothesis 3.
6. Discussion
While exploring the sustainable fiscal impact of tax reduction policies, we chose panel data from various provinces in China as our sample. This is because Banerjee and Dufllo have specifically pointed out that differences in cultural structures, technological levels [44], and financial institutions can cause problems with cross-national data. China, as a socialist country with strong institutional, cultural, political, and even economic controls, minimizes the heterogeneity, measurement errors, and endogeneity issues in our study. In terms of research methods, this paper uses the FGLS method for empirical analysis, with provincial and yearly fixed effects fully controlled throughout the process. The MLE method is chosen as an alternative regression method in the robustness test, and the system GMM method is selected for the dynamic model in the endogeneity analysis. The study proves that the FGLS method can effectively eliminate the spurious regression phenomenon between unit root sequences and stationary auto correlated sequences. There are also many existing studies that use this method for empirical testing, such as Liu, F.H. and Wu, J.P.’s analysis using FGLS and MLE methods to show that tax reduction policies increase fiscal pressure in China [45]. Yin, L.F., Li, M., and Miao, X.L.’s use of this method to demonstrate that tax reduction policies increase the risk of local government debt [46]. The GMM method is a commonly used regression method in dynamic panel regression and has been widely applied in fiscal issues [47,48]. The adjusted R2 value, AR (1), AR (2), and Hansen test p-value of this study are all within the effective range, further demonstrating the reliability and significance of the sample and research methods chosen in this paper.
The research findings indicate that the tax reduction policy has a significant negative impact on fiscal sustainability. This conclusion is closely related to the findings of Wen, F. [49]; Yu, S.Y. and Yang, Y.X. [50], who also found that China’s tax reduction policy in recent years has put enormous pressure on local finances, which could greatly affect fiscal sustainability. In addition to research in China, Deb Rajat found that although the reduction of corporate tax rates in the European Union may accelerate demand in the short term [51], the government may increase spending by borrowing to increase the fiscal deficit, which could lead to a decline in fiscal sustainability. This impact method and mechanism are essentially consistent with the conclusions of this study, verifying the universality of the findings. The conclusion of this paper is an extension of existing literature.
7. Conclusions and Policy Recommendations
As an important tool for proactive fiscal policies and supply-side structural reforms, the policy dividends and costs of tax cuts are worth paying attention to, as they have significant implications for the implementation of tax reduction policies. Especially in the face of significant fiscal pressures, evaluating their impact on fiscal sustainability is urgently needed. Based on the framework of China’s fiscal and tax system, this paper analyzes and proposes three hypotheses at the theoretical level, and empirically tests the impact of tax cuts on fiscal sustainability using a dynamic panel data model. The results show that tax reduction policies in China in recent years have a negative impact on fiscal sustainability, and this negative effect is more significant in western regions, areas with lower shares of the tertiary industry, and areas with higher levels of fiscal decentralization. Mechanism tests reveal that tax cuts can achieve the goal of maintaining tax base and promoting fiscal sustainability by stimulating production incentives for enterprises to increase investment and innovation, but they also have a distorting effect on local government behavior, which negatively impacts fiscal sustainability through distorting local fiscal revenue structure and increasing implicit debt burden. These conclusions are robust after conducting sensitivity tests, verifying the reliability of the three hypotheses. Based on the above research results, this paper proposes the following policy recommendations:
Firstly, it is imperative to timely adjust tax reduction policies to enhance fiscal sustainability. The current tax reduction policies in China have had a profound detrimental impact on fiscal sustainability, resulting in a rapid escalation of fiscal pressures for local governments, which may pose risks such as fiscal adjustment paralysis, social unrest, and economic stagnation. Therefore, both the central and local governments need to judiciously moderate the pace of implementing tax reduction policies, allowing local governments and the economic system to have a cushioning space to adapt to the new high-speed development paradigm while upholding fiscal sustainability. Through a gradual and prudent approach, local governments can strike a delicate balance between ensuring fiscal sustainability and fostering local economic growth through sustainable tax reduction measures, which can elicit enduring support.
Secondly, adopt varying intensities of tax reduction policies for different regions. There are significant differences in economic and industrial development levels among eastern, central, and western regions of China, and accordingly, tax reduction policies should be selectively applied to different regions. For the eastern regions with immense economic development potential, regions with a higher concentration of tertiary industries, and regions with lower fiscal decentralization levels, the existing tax reduction policies can be further implemented, and the scope and intensity of tax reduction measures can even be expanded and deepened for these regions. These regions typically have more abundant fiscal resources and faster business development, and tax reduction policies can provide them with greater economic impetus, while the resulting fiscal pressures can be better adjusted and managed. On the other hand, western regions, regions with a lower proportion of tertiary industries, and regions with higher fiscal decentralization levels may require more moderate tax reduction policies to prevent fiscal disruptions in local funding.
Thirdly, promote the realization of tax reduction dividends and reduce policy costs. Efforts should be made to efficiently alleviate the difficulties of various market entities, stimulate business vitality, and further cultivate high-quality tax sources. Integrated policies should be implemented to improve the business environment for taxation, inject vitality into enterprise development, and fully leverage the production incentive effects of tax reduction policies to nurture fiscal resources in economic development, ensuring the sustainability of local finances. Each region should leverage its comparative advantages to accelerate the cultivation of specialized industrial clusters through tax incentives, guiding production factors with favorable tax policies to generate agglomeration effects and expand the tax base, which is an important path to enhance the sustainability of local finances. In addition, local government departments should strengthen fiscal resource development, enhance the resilience of local fiscal growth, and reduce the costs of tax reduction policies.
However, this article has certain limitations. Firstly, the data is limited. China has only disclosed provincial-level data, and larger sample sizes of prefecture-level data have not been revealed. Secondly, there are minor flaws in the indicator design. Although this article uses multiple indicators for the tax reduction and fee reduction variables, there may be other alternative indicators. For the fiscal sustainability variable, although we have borrowed from other literature to adopt more scientifically grounded indicators, there may be other indicator designs to consider. In the future, once the Chinese government releases prefecture-level data, we will attempt to use larger samples of data from prefecture-level cities. We will also explore other indicators for fiscal sustainability and tax reduction and fee reduction. These will be the directions of our future research.
Author Contributions
Conceptualization, Q.L. and X.Z.; methodology, X.Z.; software, X.Z.; validation, Q.L. and X.Z.; formal analysis, X.Z.; investigation, Q.L. and X.Z.; resources, X.Z.; data curation, X.Z.; writing—original draft preparation, X.Z.; writing—review and editing, Q.L.; visualization, Q.L. and X.Z.; supervision, X.Z.; project administration, Q.L.; funding acquisition, Q.L. and X.Z. All authors have read and agreed to the published version of the manuscript.
Funding
This research was funded by the Key Project of National Social Science Foundation of China, grant number 21AJY005.
Institutional Review Board Statement
Not applicable.
Informed Consent Statement
Not applicable.
Data Availability Statement
Some local fiscal data is sourced from the “Report on the Execution of Fiscal Budget and the Draft of Fiscal Budget” disclosed by the government, while central fiscal data is sourced from the annual “Central Final Accounts Report”. Other economic, population, and central-related variables data are sourced from the “China Statistical Yearbook”. Enterprise fixed asset data is sourced from the industrial enterprise database, aggregated at the provincial level, and provincial-level invention patent data is sourced from the China Foreign Patent Information Service Platform.
Conflicts of Interest
The authors declare no conflict of interest.
References
- Xu, S. Highly concerned about the sustainability of local finance in the context of tax reduction and fee reduction. Fisc. Sci. 2019, 4, 102–106. [Google Scholar] [CrossRef]
- Buiter, W.H.; Minford, P.P. A Guide to Public Sector Debt and Deficits. Econ. Policy 1985, 1, 13–79. [Google Scholar] [CrossRef]
- He, D.; Zhang, F. The role and key links of China’s tax reduction and fee reduction. Econ. Obs. 2019, 2, 49–55. [Google Scholar] [CrossRef]
- Furcerid, D.; Mourougane, A. The effects of fiscal policy on output: A DSGE analysis. OECD Econ. Dep. Work. Pap. 2010, 700, 43–48. [Google Scholar] [CrossRef]
- Ghosh, A.R.; Ostry, J.D.; Quresh, M.S. Fiscal space and sovereign risk pricing in a currency union. J. Int. Money Financ. 2013, 34, 131–163. [Google Scholar] [CrossRef]
- Liu, S. Public Risk Theory, 1st ed.; Beijing, People’s Publishing House: Beijing, China, 2018; pp. 54–72. [Google Scholar]
- Deng, Z.J. Fiscal Balance View and the Sustainability of Active Fiscal Policy. Contemp. Financ. Econ. 2001, 11, 22–25, 80. [Google Scholar]
- Yu, Y.D. A Theoretical Framework for Research on Fiscal Stability Issues. World Econ. 2000, 6, 3–12. [Google Scholar]
- Tax and Fiscal Policies after the COVID-19 Crisis. Available online: https://www.oecd.org/tax/covid-19-tax-policy-and-other-measures.xlsm (accessed on 14 October 2021).
- Shen, G.J.; Chen, B.K.; Yang, R.D. Can Tax Reduction Stimulate China’s Economy?-An Empirical Study Based on China’s Value-added Tax Reform. Econ. Res. 2016, 11, 70–82. [Google Scholar]
- Wu, H.H.; Liu, X.B.; Ji, Y.B. Can Tax Reduction Improve Enterprise Production Efficiency?-A Study Based on the quasi-natural experiment of Western Development. Financ. Econ. Res. 2017, 4, 55–67. [Google Scholar] [CrossRef]
- Zheng, B.H.; Zhang, Z.G. Will a Lower Corporate Income Tax Rate Affect Total Factor Productivity?-Empirical Evidence from Listed Companies in China. Account. Res. 2018, 5, 13–20. [Google Scholar]
- Fan, Y.; Li, H.N. Tax Collection and Management, Tax Compliance and Tax Incentives-Policy Effect Evaluation of the Golden Tax III Project. Financ. Trade Econ. 2020, 5, 51–66. [Google Scholar] [CrossRef]
- Jia, J.X. Tax Incentives, Effective Average Tax Rate of Enterprises, and Enterprise Entry. Econ. Res. 2014, 7, 94–109. [Google Scholar]
- Liu, Q.R.; Zhao, C.; Huang, J.Z. Tax Incentives, Supply-side Reform and Enterprise Investment. Manag. World 2019, 1, 78–96, 114. [Google Scholar] [CrossRef]
- Tian, Z.W.; Hu, Y.J. The Dynamic Impact of Business Tax Reform on Fiscal Economy: An Analysis Based on the CGE Model. Financ. Econ. Res. 2014, 2, 4–18. [Google Scholar] [CrossRef]
- Liu, L.; Zhang, Y.Q. The Impact of Value-added Tax Reduction Policies on the Macro economy-An Analysis Based on a Computable General Equilibrium Model. Public Financ. Res. 2019, 8, 99–110. [Google Scholar] [CrossRef]
- Du, T.W.; Zhang, Y.S.; Li, T.Y. Fiscal Competition, Soft Budget Constraints, and Local Fiscal Sustainability. Econ. Res. J. 2020, 11, 93–107. [Google Scholar] [CrossRef]
- Yang, Z.; Qiu, G.Q. Fiscal Decentralization, Fiscal Transparency, and Soft Budget Constraints in China. Contemp. Econ. Sci. 2019, 1, 35–46. [Google Scholar]
- Bulir, A.; Hamann, J.A. Volatility of Development Aid: From the Frying Pan into the Fire? World Dev. 2008, 36, 2048–2066. [Google Scholar] [CrossRef]
- Julian, L.B. Building a tax state in the 21st century: Fiscal pressure, political regimes, and consumption taxation. World Dev. 2022, 154, 105879. [Google Scholar]
- Kopits, G.; Symansky, S.A. Fiscal Policy Rules. IMF Occas. Pap. 1998, 162, 1–57. [Google Scholar]
- IMF. Fiscal Monitor: Capitalizing on Good Times. Int. Monet. Fund 2018, 4, 1–18. [Google Scholar]
- Barro, R.J.; Redlick, C. Macroeconomic Effects from Government Purchases and Taxes. Q. J. Econ. 2011, 1, 51–102. [Google Scholar] [CrossRef]
- Helms, J.L. The Effect of State and Local Taxes on Economic Growth: A Time Series--Cross Section Approach. Rev. Econ. Stat. 1985, 67, 574–582. [Google Scholar] [CrossRef]
- Zhou, B.; Du, L.S. The Impact of Business Tax Reform on Fiscal Revenue and the Response of Fiscal and Tax System Reform. Contemp. Financ. Econ. 2016, 6, 25–33. [Google Scholar] [CrossRef]
- Guo, Q.W. Potential fiscal impact and risk prevention of tax and fee reductions. Manag. World 2019, 6, 1–10. [Google Scholar] [CrossRef]
- Li, M.; Long, X.Y. The Real Dilemma and Solutions for Local Financial Pressure under the Background of Tax Reduction and Fee Reduction. Contemp. Econ. Manag. 2020, 42, 60–69. [Google Scholar] [CrossRef]
- Ghosh, A.R.; Kim, J.I.; Mendoza, E.G.; Ostry, J.D.; Qureshi, M.S. Fiscal Fatigue, Fiscal Space and Debt Sustainability in Advanced Economies. Econ. J. 2013, 566, 4–30. [Google Scholar] [CrossRef]
- Chen, J.; Li, J.F. Fiscal decentralization, promotion incentive and local government debt financing behavior-based on the perspective of local government investment bonds. Account. Res. 2015, 1, 61–67, 97. [Google Scholar]
- Liu, Q.; Lu, Y. Firm Investment and Exporting: Evidence from China’ s Value-added Tax Reform. J. Int. Econ. 2015, 2, 392–403. [Google Scholar] [CrossRef]
- Lan, F.; Wang, W.; Cao, Q. Tax Cuts and Enterprises’ R & D Intensity: Evidence from a Natural Experiment in China. Econ. Model. 2020, 6, 304–314. [Google Scholar]
- Gu, G.; Pan, X.Y. Tax Reduction and Fiscal Revenue Structure: An Investigation Based on the Change Trend of Non-tax Revenue. J. Fisc. Res. 2020, 6, 19–34. [Google Scholar] [CrossRef]
- Zhang, L.; Chen, Y.; He, Z. The Effect of Investment Tax Incentives: Evidence from China’s Value-Added Tax Reform. Int. Tax Public Financ. 2018, 4, 913–945. [Google Scholar] [CrossRef]
- Liu, Q.Z.; Zhao, D.P. A Study of the Impact of Population Aging on Fiscal Sustainability in China. Sustainability 2023, 15, 5409. [Google Scholar] [CrossRef]
- Aristovnik, A. Fiscal Sustainability In The Mediterranean Region–A. Rom. J. Econ. Forecast. 2008, 161, 23–34. [Google Scholar]
- Danielova, A.; Sarkar, S. The effect of leverage on the tax-cut versus investment-subsidy argument. Rev. Financ. Econ. 2011, 4, 1–129. [Google Scholar] [CrossRef]
- Cai, X.; Lu, Y.; Wu, M.; Yu, L. Does Environmental Regulation Drive Away Inbound Foreign Direct Investment? Evidence from A Quasi-natural Ex-pediment in China. J. Dev. Econ. 2016, 6, 73–85. [Google Scholar] [CrossRef]
- Mao, J.; Xu, J.W. The Real Basis of Research on China’s Local Government Debt Issues: Institutional Changes, Statistical Methods, and Key Facts. Fisc. Stud. 2019, 1, 3–23. [Google Scholar] [CrossRef]
- Chen, S.W. Testing for fiscal sustainability: New evidence from the G-7 and some European countries. Econ. Model. 2014, 2, 1–15. [Google Scholar] [CrossRef]
- Bohn, H. The Sustainability of Budget Deficits in a Stochastic Economy. J. Money Credit. Bank. 1995, 1, 257–271. [Google Scholar] [CrossRef]
- Roodman, D. How to do xtabond2: An introduction to difference and system GMM in stata. Stata J. 2009, 9, 86–136. [Google Scholar] [CrossRef]
- Chen, X.L.; Tan, H.Y.; Liu, Z.X. Research on the impact of aging on local government debt. J. Financ. Econ. 2020, 6, 19–33. [Google Scholar] [CrossRef]
- Banerjee, A.V.; Duflo, E. Inequality and growth: What can the data say? J. Econ. Growth 2003, 8, 267–299. [Google Scholar] [CrossRef]
- Liu, F.H.; Wu, J.P. Tax Reduction, Fiscal Decentralization and Local Fiscal Sustainability: An Empirical Study Based on Western Region, A.J. Sichuan Univ. Sci. Eng. 2020, 6, 54–71. [Google Scholar]
- Yin, L.F.; Li, M.; Miao, X.L. Does Tax Reduction and Fee Reduction Bring Local Debt Risk? An Analysis of Mediating Effects Based on High-Quality Tax Sources. Fisc. Res. 2021, 3, 56–69. [Google Scholar] [CrossRef]
- Keita, K.; Turcu, C. Promoting Counter-Cyclical Fiscal Policy: Fiscal Rules Versus Institutions. Comp. Econ. Stud. 2022, 10, 6. [Google Scholar] [CrossRef]
- Malla, M.H.; Pathranaraku, P. Fiscal Policy and Income Inequality: The Critical Role of Institutional Capacity. Economies 2022, 10, 115. [Google Scholar] [CrossRef]
- Wen, F. Research on the Issue of Fiscal Sustainability under the Background of Tax Reduction and Fee Reduction. Financ. Superv. 2019, 18, 5–11. [Google Scholar]
- Yu, S.Y.; Yang, Y.X. On the Sustainable Development of Local Finance under the Background of Tax Reduction and Fee Reduction. Financ. Superv. 2019, 17, 5–9. [Google Scholar]
- Deb, R. Corporate Tax Cuts and Fiscal Slippage. Indian Econ. J. 2020, 2, 68–72. [Google Scholar] [CrossRef]


Disclaimer/Publisher’s Note: The statements, opinions and data contained in all publications are solely those of the individual author(s) and contributor(s) and not of MDPI and/or the editor(s). MDPI and/or the editor(s) disclaim responsibility for any injury to people or property resulting from any ideas, methods, instructions or products referred to in the content. |
© 2023 by the authors. Licensee MDPI, Basel, Switzerland. This article is an open access article distributed under the terms and conditions of the Creative Commons Attribution (CC BY) license (https://creativecommons.org/licenses/by/4.0/).