Article

The Coupling Relationship and Driving Factors of Fertilizer Consumption, Economic Development and Crop Yield in China

1
Faculty of Earth Resource, China University of Geosciences, Wuhan 430074, China
2
Institute of Mineral Resources, Chinese Academy of Geological Sciences, Beijing 100037, China
3
School of Geography and Tourism, Huanggang Normal University, Huanggang 438000, China
4
School of Earth Sciences and Resources, China University of Geosciences (Beijing), Beijing 100083, China
5
Centre for Strategic Studies, Chinese Academy of Engineering, Beijing 100088, China
*
Author to whom correspondence should be addressed.
Sustainability 2023, 15(10), 7851; https://doi.org/10.3390/su15107851
Submission received: 14 March 2023 / Revised: 5 May 2023 / Accepted: 9 May 2023 / Published: 11 May 2023

Abstract

:
China has become the largest consumer of chemical fertilizers. The excessive application of chemical fertilizers has resulted in a series of problems including environmental pollution, seriously threatening China’s sustainable development. Therefore, it is highly important to study the factors driving chemical fertilizer consumption. In this study, we used the panel data of 31 provinces in China and the Tapio decoupling model to explore the coupling relationship between fertilizer consumption, economic growth and crop yield increase, build the IPAT-LMDI model, and identify and analyze the factors driving the observed changes. The results show the following: (1) Since 2015, the consumption of chemical fertilizers in most provinces of China has decreased significantly, and the implementation of the zero-fertilizer policy in various regions has generally achieved remarkable results. (2) Since 1980, China’s crop production and economic development have undergone coordinated growth, but the decoupling relationship between chemical fertilizer consumption and economic growth has changed from weak to strong, and the dependence of China’s crop production on chemical fertilizers has gradually been reduced. (3) Fertilizer consumption in China is promoted by factors related to economic level (Pg), crop value (Cval), fertilizer efficiency (Feff), fertilization intensity (Fein), per capita arable land area (Clap) and population size (P), while it is restrained by factors related to science and technology level (Ffag), agricultural population (P1) and industrial structure (Inst). (4) Fertilizer consumption has arrived at its peak in East China, South China and Central China, while there is still room for growth in the western areas; gaps in economic and technological development between different provinces are the main factors affecting changes in fertilizer consumption. Finally, we offer specific suggestions for improving the efficiency of chemical fertilizers from the perspectives of farming modes and science and technology.

1. Introduction

1.1. Background and Motivation

Chemical fertilizers are an important material basis for food security, as they account for more than 40% of China’s grain increase [1,2]. Since its reform and opening up, the rapid growth of China’s economy has greatly promoted the development of the Chinese chemical fertilizer industry and led to an increase in fertilizer consumption. In 2020, China’s total consumption of fertilizers reached 45.796 million tons (FAOSTAT, 2022), accounting for 22.8% of the global total consumption, making it the world’s largest consumer of fertilizers. The excessive application of fertilizers, however, leads to a series of negative consequences such as the greenhouse effect, groundwater pollution, soil compaction and heavy metal pollution, [3,4,5] threatening the sustainable development of agriculture. In order to address the significant problem of over-fertilization, the Chinese government set a target of zero growth in the use of chemical fertilizers and pesticides in the “13th Five-Year Plan” (2016–2020), and since then, China’s fertilizer consumption has entered a new stage of development.
The changes in fertilizer consumption across the 31 provinces in China during the implementation of the ‘zero-growth policy’ are crucial for evaluating the effectiveness of regional fertilizer policies. By analyzing the coupling relationship between fertilizer consumption, economic growth, and crop production in China, identifying factors that affect fertilizer consumption, and studying the factors driving inter-provincial differences, we can provide the government with a basis for developing targeted fertilization policies. This research is of great significance for the healthy and sustainable development of agriculture in China.

1.2. Literature Review

Since 21st century, the international community has paid great attention to environmental pollution, turning the relationship between environmental pollution and economic growth into a focal point of research. Philipp and Howitt [6] were the first to study the impact of pollution restrictions on sustainable development. OECD [7] put forward the theory of decoupling, defining a situation where the growth of energy consumption is slower than (negative value) economic growth as relative decoupling (absolute decoupling). Tapio [8] put forward the elastic decoupling theory based on the OECD decoupling theory and refined the elastic index calculation method. Since then, the theory of elastic decoupling has been widely applied in studies of the relationship between pollution, carbon emissions and economic growth [9]. This theory has also been adopted in agriculture, with most studies focusing on the relationship between carbon emissions and agricultural output value rather than agricultural pollution. As chemical fertilizers are the main source of agricultural pollution, it is theoretically and practically feasible to measure the stagnation relationship between chemical fertilizer inputs, economic growth and crop yields with elastic decoupling [10].
The excessive application of chemical fertilizers has a negative impact on the environment, and the number of studies on its evolutional characteristics and influencing factors is increasing. Studies on the factors affecting chemical fertilizer consumption can be categorized into three types (Table 1): firstly, those aiming to study the impacts of factors such as the machinery type, fertilization mode, tillage mode, soil type and climate differences on farmland fertilization through field experiments; secondly, those aiming to explore the impacts of factors such as farm size, household income, education level, and planting structure on fertilizer application; and thirdly, those aiming to analyze the impacts of factors such as fertilization intensity, planting structure, and planting area on chemical fertilizer consumption with statistical data. Of these, the third category is favored by both the government and scholars.
It is common and effective to use statistical data to study the factors affecting fertilizer consumption, usually from the perspectives of fertilization intensity, planting structure and sowing area. He, R. et al. [11] analyzed the development of China’s chemical fertilizer application from 2010 to 2017 and explored the factors driving agricultural chemical fertilizer use efficiency and growth in a time series analysis. Based on the panel data from 2002 to 2016, Yang, J. et al. [12] classified the factors influencing chemical fertilizer consumption into four main categories, including the agricultural scale, intensification, fertilizer utilization rate and labor productivity, so as to study the factors driving and contribution rate of fertilizer reduction in the counties of Zhejiang Province. Qu, H. et al. [13] analyzed the changes in supply and demand of chemical fertilizer consumption and their driving factors in 31 Chinese provinces from 1994 to 2018 and found that differences in rural labor force, the scale of agricultural mechanization, agricultural planting structure, population and urbanization all had significant impacts. Yang, J. et al. [14] analyzed the factors driving the total factor substitution efficiency of fertilizer input based on the panel data of 63 counties in Zhejiang Province from 2003 to 2017. Ji, Y. et al. [15] analyzed the scale effect, intensity effect and structure effect of fertilizer use changes in China from three perspectives: crop, region and fertilizer type. Qu, H et al. [16] focused on the impacts of three factors—the fertilizer input–output ratio (IOR), unit labor output (ULO) and labor input per unit of sown area (LIU)—on changes in fertilizer use based on China’s official statistics from 1997 to 2017. Based on the survey data of 13 major grain-producing provinces in China from 2005 to 2015, Wang, S. et al. [17] analyzed the forces driving the growth of fertilizer application in China with the factoring method and found that the increase in fertilizer application intensity was the main reason for the overall growth in fertilizer use, followed by the expansion of the planting area, while the adjustment of the planting structure made a minimal contribution. Zhang, L. et al. [19] explored spatiotemporal changes in fertilization intensity in southern rice-planting areas based on panel data from 2001 to 2018.
In terms of methodology, index decomposition analysis (IDA) is the most commonly used method to study the factors driving fertilizer consumption. Although IDA involves many methods, the current studies usually adopt the Log Mean Divisia index (LMDI), DEA (Data Envelopment Analysis) model, and Raspberry’s index decomposition [19], among which LMDI has the advantages of leaving no residuals, easy interpretation of factor effects, and a consistent decomposition formula for different numbers of factors [27]. Therefore, in practice, the LMDI method is more extensively adopted [28]. For example, Zhao, X. et al. [29] calculated the agricultural carbon emission load of Hunan Province over the past 15 years with the LMDI method based on the comprehensive statistics of its agricultural output, planting area, effective irrigated area and fertilizer usage from 1999 to 2014 and analyzed the factors influencing agricultural carbon emissions. Lin, Y. et al. [10] decomposed the consumption of chemical fertilizers in eastern China from 1996 to 2014 with the LMDI method and found that the efficiency factor can slow down the growth of agrochemical products. The DEA model is also commonly used in fertilizer consumption research [30,31,32,33]. For example, Shao, Y.H. et al. [34] applied the Dynamic Slack-based Measure (DSBM) and Total Factor Agricultural Efficiency (TFAE) method to investigate the total agricultural production efficiency of 30 administrative regions across eastern, central, and western areas in China from 2012 to 2016.
These studies are of certain value for understanding the factors driving fertilizer consumption in China, but most of the existing studies have focused on the correlation between one or a few factors and the amount of fertilizer applied, which cannot fully reflect the impacts of the economy, society, technology and population on the increase in fertilizer application in agriculture.

1.3. Contribution and Innovation

The existing research has laid the foundation for sustainable development and reductions in agricultural pollution in China, but there are still deficiencies. In light of the relevant studies, the contributions and innovations of this study are summarized as follows:
(1) Only a few factors influencing China’s fertilizer consumption are accounted for in the existing studies. Therefore, with the classic I PAT model, this paper decomposes the factors affecting China’s fertilizer consumption into nine specific indicators: population size, per capita arable land area, fertilization intensity, fertilizer efficiency, crop value, technological level, industrial structure, economic level and the agricultural population, expanding the selection and research scope of indicators and providing a basis for the government to formulate policies for regulating fertilizer consumption and improving fertilization efficiency.
(2) The existing studies have mainly focused on China or a certain province of China, and there are few comparative studies examining different provinces. Based on the panel data of 31 Chinese provinces from 1980 to 2020, in this study, we analyzed the inter-provincial differences in factors affecting fertilizer consumption, providing a reference for differentiated fertilization policies in China.

2. Model Construction and Data Sources

2.1. Tapio Decoupling Model

The decoupling theory was first traced back to the 1960s and was used to measure the degree of correlation between two dynamic factors. The Organization for Economic Cooperation and Development (OECD) applied this model to the study of agricultural policy in the late 20th century, and it was then widely used in economy–resource–environment-related research. Decoupling theory can directly measure the impacts of changes in various influencing [35] factors on the environment or resources, with the main calculation methods including the OECD index, IPAT model, Tapio elastic analysis, etc., among which the change in the total and relative number of samples in the Tapio decoupling model improves the objectivity and accuracy of the results. Therefore, this paper adopts the Tapio decoupling model to study the decoupling effects of GDP, fertilizer consumption and crop production. See Equations (1)–(3) for details:
E F , G = % Δ F % Δ G = ( F 1 F 0 ) / F 0 ( G 1 G 0 ) / G 0
E N , G = % Δ N % Δ G = ( N 1 N 0 ) / N 0 ( G 1 G 0 ) / G 0
E F , N = % Δ F % Δ N = ( F 1 F 0 ) / F 0 ( N 1 N 0 ) / N 0
Here, %ΔF, %ΔG and %ΔN represent the change rates of fertilizer consumption, GDP and total crop output, respectively; E(F,G) stands for the GDP elastic coefficient of fertilizer consumption; E(N,G) stands for the GDP elastic coefficient of crop production, representing the change in the regional crop yield relative to economic growth; and E(F,N) stands for the grain production elasticity level of chemical fertilizer consumption, indicating the degree of crop dependence on chemical fertilizers. Considering the action–reaction time lag, this paper adopts a 5-year interval for analysis.
According to the Tapio decoupling model, decoupling results are divided into weak decoupling, strong decoupling and recessive decoupling (see Table 2). Among these types, strong decoupling means to reduce fertilizer consumption during economic growth, and it is an ideal model for the sustainable development of agriculture.

2.2. IPAT Extension Model

The IPAT model, also known as the environmental pressure model, is a decomposition model extended by constant deformation. It was first proposed by Ehrlich P and other scholars in 1972 and later extended by Commoner B (1992) [36] and became the classic IPAT model. This model decomposes human pressure on the environment (I) into three driving forces: population (P), economy (A) and technology (T), demonstrating the impacts of human activities on the environment in a simple, direct and quantitative manner. Since its conception, the IPAT model has been extensively applied in ecological environment research, such as studies on environmental impacts [37], ecological footprints [38] and CO2 emissions [39]. Some scholars have used this model for studies on resources and energy, such as the impacts of energy and the environment [40], water and land resources [41] and energy consumption [42], while in the field of agriculture, most research has focused on the consumption of agricultural resources or the impact of agriculture on the environment [43,44]. Based on the classic IPAT model, we built a decomposition and expansion model of factors affecting China’s fertilizer consumption, with the specific process presented as follows:
Decomposition model No. 1:
F = P 1 × G 1 P 1 × F G 1   = P 1 × M P 1 × G 1 M × F G 1   = P 1 × M P 1 × F M × N F × G 1 N × F G 1   = P 1 × c l a p × f e i n × f e f f × c v a l × f f a g
Decomposition model No. 2:
F = P × G 1 P × F G 1   = P × G P × G 1 G × F G 1   = P × p g × l n s t × f f a g
In the formulae, F is the consumption of chemical fertilizers, P 1 is the size of the agricultural population, P is the total population, G 1 is the gross agricultural production, G is the gross domestic product, M is the arable area and N is the total output of crops. C l a p = M / P 1 is the cultivated land area per unit of agricultural population; F e i n = F / M is the fertilization amount per unit arable land area, representing fertilization intensity; F e f f = N / F is the ratio of crop output to the fertilization amount, representing fertilizer efficiency; C v a l = G 1 / N is the output value per unit crop, representing crop value; F f a g = F / G 1 is chemical fertilizer consumption per unit agricultural GDP, representing technological level; p g = G / P is GDP per capita, representing economic level; and I n s t = G 1 / G is the proportion of agricultural GDP, representing the industrial structure.

2.3. LMDI Decomposition Model

The Log Mean Divisia Index (LMDI) was proposed by Ang (1998) and other scholars in the 1990s. It has the advantages of full decomposition, no residual error, easy comprehension, etc., and overcomes disadvantages such as zero or negative decomposition results. Thus, it has been widely adopted. This paper uses the LMDI “addition and decomposition” method to decompose the factors driving fertilizer consumption based on the IPAT expansion model:
Δ F = F t F 0 = Δ F P 1 + Δ F c l a p + Δ F f e i n + Δ F f e f f + Δ F c v a l + Δ F f f a g
Δ F = F t F 0 = Δ F p + Δ F p g + Δ F i n s t + Δ F f f a g
Here, F t , F 0 represent the chemical fertilizer consumption in the target year and the base year, Δ F P 1 is the agricultural population effect, Δ F c l a p is the per capita cultivated land area effect, Δ F f e i n is the fertilization intensity effect, Δ F f e f f is the chemical fertilizer efficiency effect, Δ F c v a l is the crop value effect, Δ F f f a g is the technological level effect, Δ F p is the population scale effect, Δ F p g is the economic level effect, and Δ F I i n s t is the industrial structure effect, with the specific calculation formulae as follows:
Δ F P 1 = ( F t F 0 ) ( l n F t l n F 0 ) × ln ( p P 1 t P 1 0 )
Δ F c l a p = ( F t F 0 ) ( l n F t l n F 0 ) × ln ( c l a p t c ; a p 0 )
Δ F f e i n = F t F 0 ( l n F t l n F 0 ) × ln ( f e i n t f e i n 0 )
Δ F f e f f = ( F t F 0 ) ( l n F t l n F 0 ) × ln ( f e f f t f e f f 0 )
Δ F c v a l = ( F t F 0 ) ( l n F t l n F 0 ) × ln ( c v a l t c v a l 0 )
Δ F f f a g = ( F t F 0 ) ( l n F t l n F 0 ) × ln ( f f a g t f f a g 0 )
Δ F P = ( F t F 0 ) ( l n F t l n F 0 ) × ln ( p t p 0 )
Δ F P g = ( F t F 0 ) ( l n F t l n F 0 ) × ln ( p g t p g 0 )
Δ F i n s t = ( F t F 0 ) ( l n F t l n F 0 ) × ln ( i n s t t i n s t 0 )
In the formulae, t represents the target year, 0 represents the base year, and F 0 and F t , respectively, represent the i-industry fertilizer consumption in the base period and period t.
The contribution degree can measure the contribution of a certain factor to the change in fertilizer consumption. The contribution degree of factor i can be calculated as follows:
δ i t = Δ F i t Δ F
δ i t indicates the contribution of factor i in period t, Δ F i t is the effect of i on fertilizer consumption in period t, and Δ F is the change in total fertilizer consumption from 1980 to 2020.

2.4. Overview of the Study Area

Combined with the available data, the research objects of this paper are 31 provinces in mainland China, which are divided among Northeast China, North China, Central China, East China, South China, Northwest China and Southwest China according to regional location in Table 3.

2.5. Data Sources

Chemical fertilizer consumption is the sum of consumptions of nitrogen fertilizer, phosphorus fertilizer, potash fertilizer and compound fertilizer. The data on fertilizer consumption, arable land area, population size, agricultural GDP and China’s GDP are from the “China Statistical Yearbook”; the crop yield is from the “China Agricultural Statistics” and “China Statistical Yearbook”; the crop sown area is from the “China Agricultural Statistics”; and agricultural population and regional GDP data are from the statistical yearbook of each province. Among these data, the crop yields from 1981 to 1984 and 1986 to 1989 were estimated using the interpolation method, and the agricultural population, population size and cultivated land area for some years were also estimated using this method. Referring to the “China Rural Statistical Yearbook”, the types of crops include grains, beans, oilseeds, sugar crops, vegetables, fruits, cotton and flue-cured tobacco. Statistics on fertilizer consumption in Japan and South Korea are from the World Food and Agriculture Organization, while per capita GDP data are from the World Bank.

3. Results and Discussion

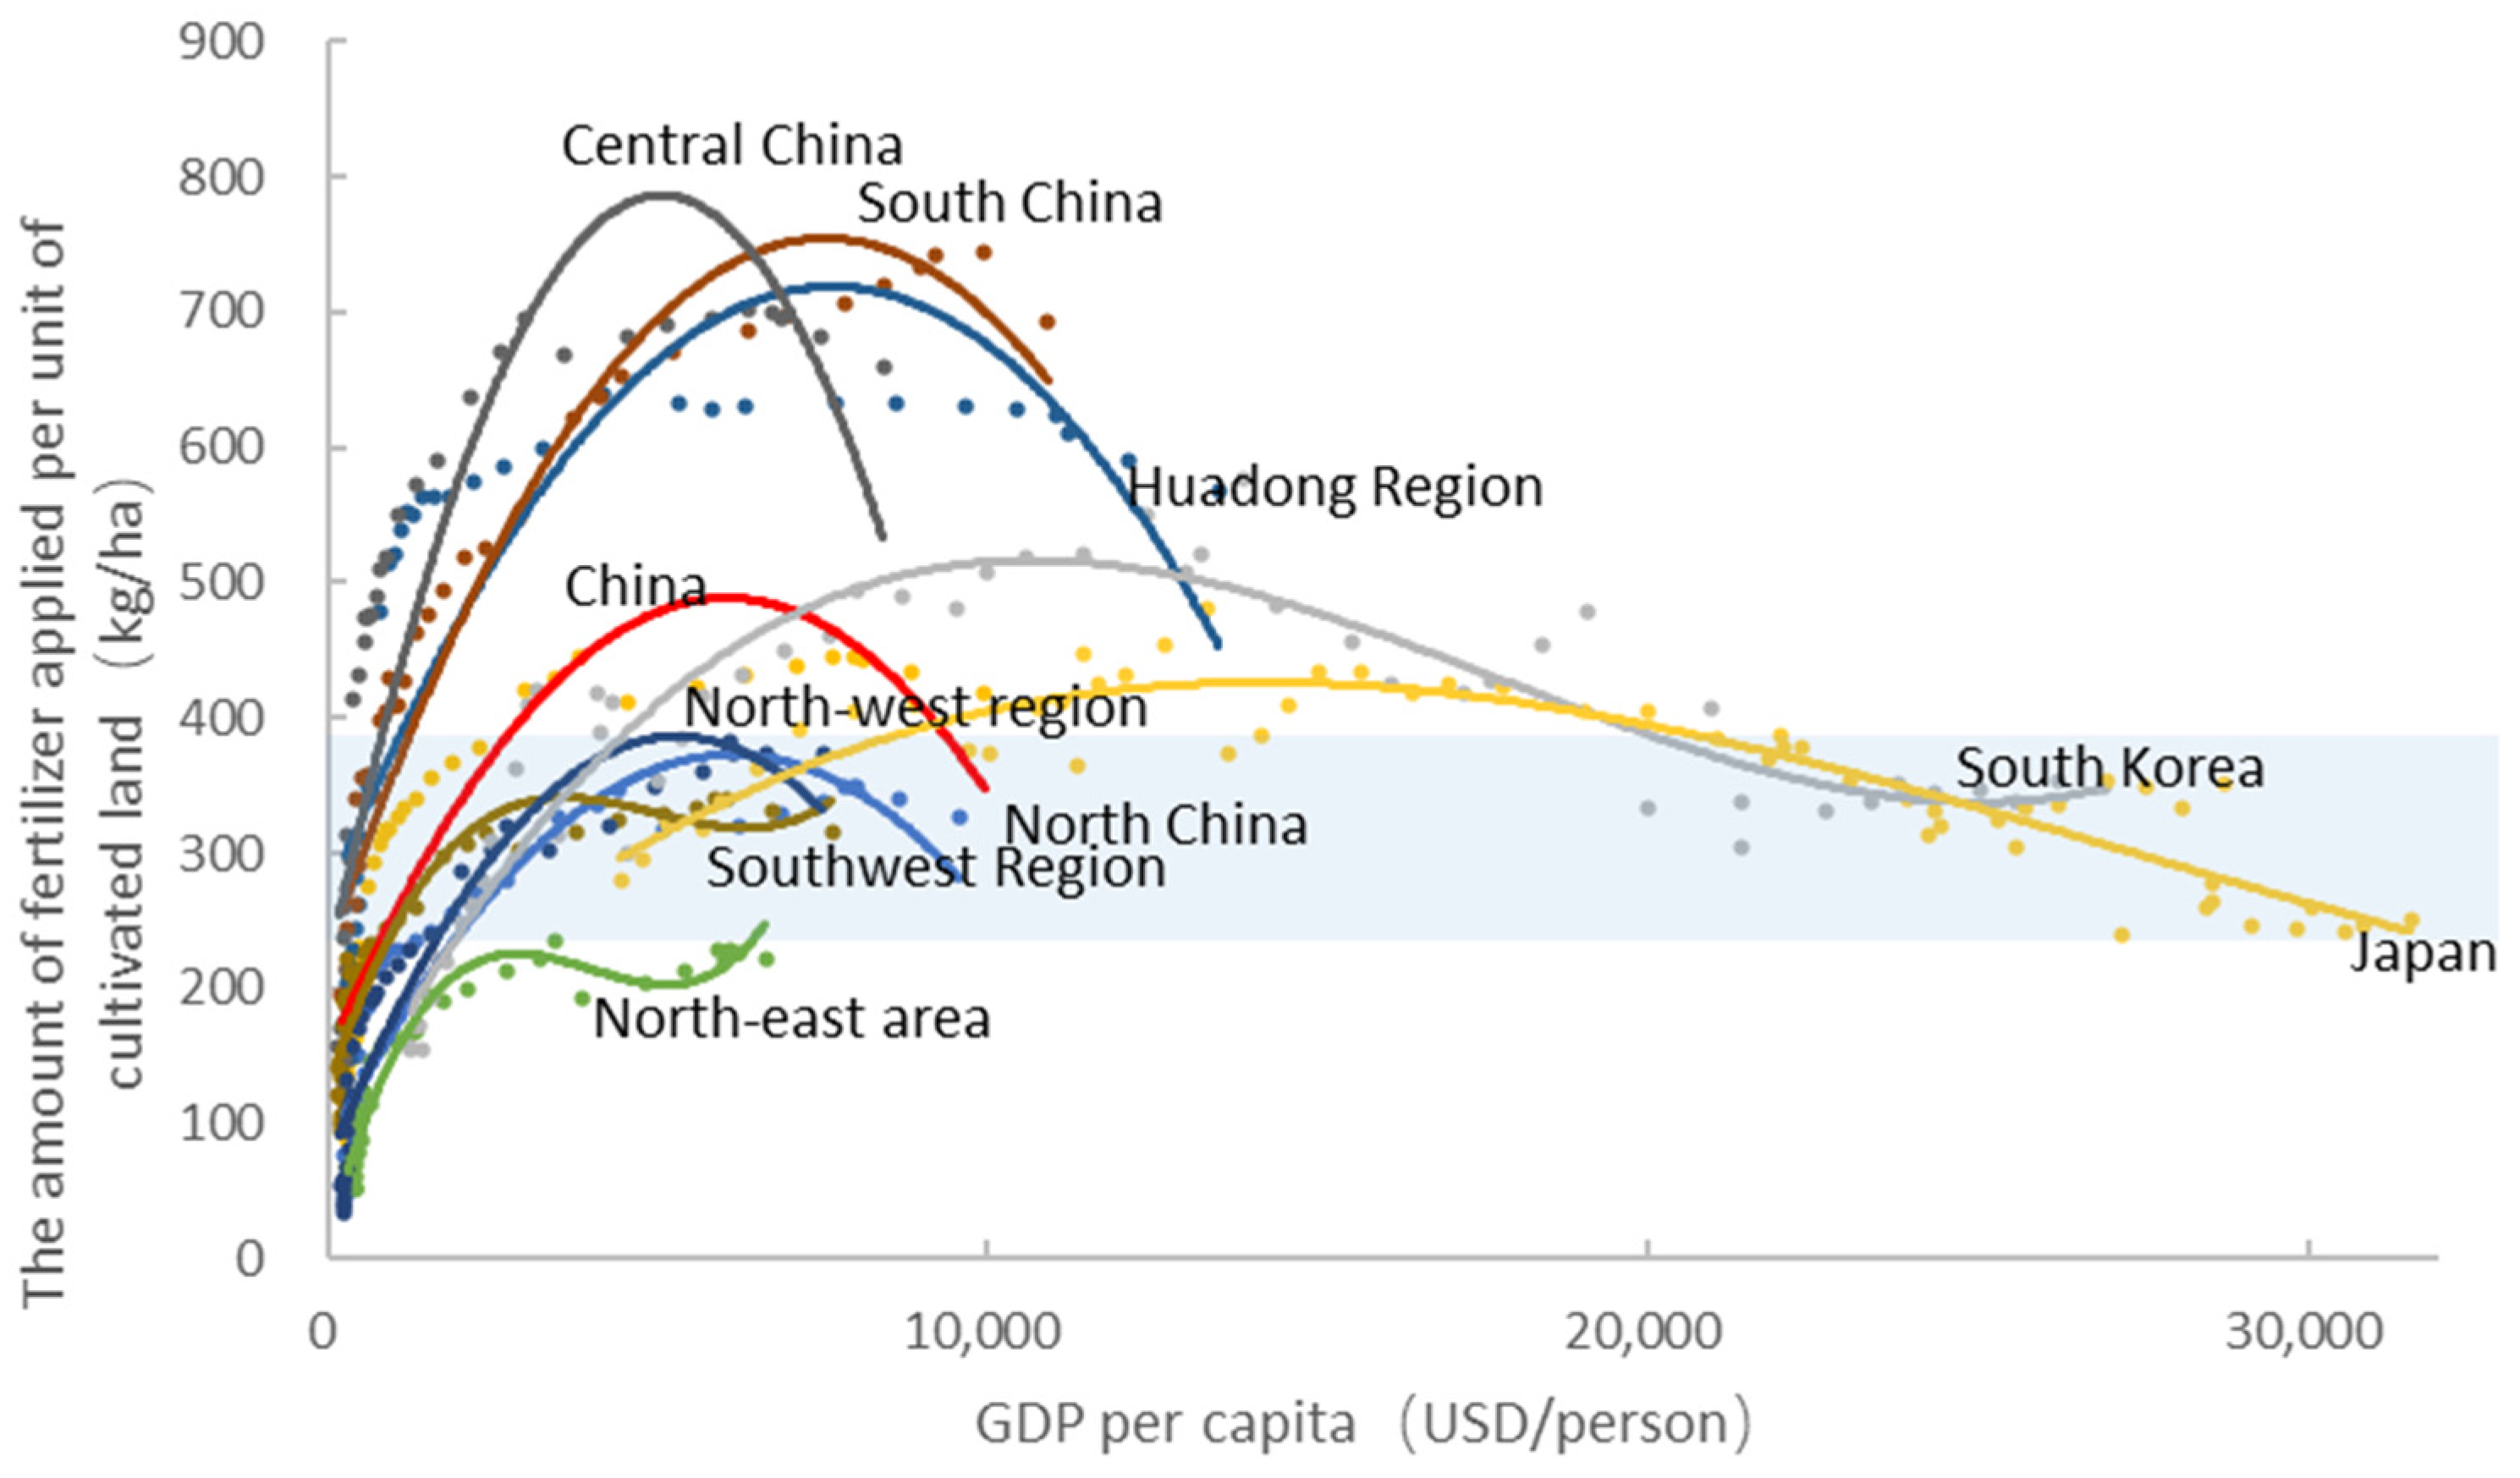
3.1. Statistical Characteristics of Fertilizer Application in China

Fertilizer consumption intensity and economic level show a trend of first increasing and then slowly declining, which is in line with the law of the Environmental Kuznets Curve (EKC) [45,46,47]. Zhang Yan (2015) [48] conducted further research on the trend of global fertilizer consumption and found that the trajectory of China’s fertilizer consumption is similar to that of Japan and South Korea and can be analyzed in reference to it. As shown in Figure 1, the fertilization intensity in Japan and South Korea shows an inverted U shape along with economic development, peaks at approximately 400–500 kg/ha, and then slowly declines to approximately 300 kg/ha. According to the trajectory curve of China, China’s fertilization intensity has generally passed its peak and began to decline, but there are significant differences between regions, showing that developed regions have basically reached their peak, while backward regions still have room for growth. The phenomenon whereby economic level restricts fertilizer consumption conforms to the EKC law.
Referring to the Japanese and Korean models, the fertilization intensity in Central, South, and East China is relatively high, while that in Northeast China is slightly lower, and that in North, Northwest, and Southwest China is at a normal level. In 2015, China began to implement the zero-growth strategy for chemical fertilizers, clearly stating that it is necessary to increase the utilization rate of chemical fertilizers and control their consumption in the eastern region and the lower reaches of the Yangtze River. According to statistics, since 2015, the consumption of chemical fertilizers in all regions of China has dropped significantly, of which that in East China and Central China has reduced by 2.15 million tons and 1.93 million tons, representing the largest declines. The implementation of zero-fertilizer policies in various regions has generally achieved remarkable results. However, the relationship between chemical fertilizer consumption and crop yield among provinces is not completely linear. For example, in provinces such as Anhui, Zhejiang and Heilongjiang, the consumption of chemical fertilizers and crop yields decrease at the same time, while provinces such as Shanxi, Shandong and Hubei have witnessed a decrease in chemical fertilizer consumption while crop yields are growing, which reflects the significant difference in fertilizer efficiency between regions.

3.2. The Coupling Relationship between China’s Fertilizer Consumption, Economic Development and Crop Output

3.2.1. China’s Overall Coupling Relationship

The authors calculated the decoupling effect between China’s fertilizer consumption, GDP and crop yield according to the Equations (1)–(3), with the results shown in Table 4. On the whole, the state of decoupling of China’s fertilizer consumption from GDP and crop yield between 1980 and 2020 can be summarized as “one stability, one change, and three fluctuations”. Stability refers to the fact that the GDP elastic effect of China’s crop production is relatively stable, always presenting as weak decoupling, its essence being the coordinated growth of China’s crop production and economic development. Change refers to the fact that the GDP elasticity effect of China’s fertilizer consumption has changed from weak decoupling to strong decoupling, with its essence being the decoupling of China’s fertilizer consumption and economic growth, which is shown by the decline of fertilizer consumption. Three fluctuations refer to the fact that the crop elasticity effect of China’s chemical fertilizer consumption fluctuates violently throughout the change of “expansive negative decoupling → weak decoupling → expansive negative decoupling → strong decoupling”, reflecting the great fluctuations in the dependence of China’s crop production on chemical fertilizers (strong dependence → weak dependence → strong dependence → no dependence).
The authors also carried out in-depth analysis of the decoupling effect between China’s fertilizer consumption, economic development and crop yield. Firstly, since 1980, the GDP elastic coefficient of China’s fertilizer consumption has shown a downward trend on the whole, decreasing from 0.45 in 1980–1985 to 0.15 in 2000–2005 and further to −0.29 in 2015–2020, causing the corresponding decoupling state to change from weak decoupling to strong decoupling. The main reason for this is that the promotion effect of economic growth on fertilizer consumption is weakening, with the deeper cause lying in the changes in factors influencing China’s crop yield growth at different economic development levels. Secondly, the GDP elastic coefficient of China’s crops is generally between 0.06 and 0.46, and the decoupling state is always weak decoupling, leading to the realization of coordinated growth between crop production and economic development. In addition, the crop yield elastic coefficient of China’s chemical fertilizer consumption has shown a downward trend on the whole, decreasing from 1.63 between 1980 and 1985 to 0.82 between 2000 and 2005 and further to the current −1.48, with the decoupling state evolving from expansive negative decoupling to the current strong decoupling. This reflects the fact that the dependence of crop production on chemical fertilizers in China has gradually weakened, and the goal of “higher efficiency with less fertilizers” has generally been achieved. China’s agriculture has begun to reduce its dependence on chemical fertilizers and move towards green and healthy development.

3.2.2. Coupling Relationship between Different Provinces

It can be seen from Table 5 that the consumption of chemical fertilizers in all provinces of China, except for Xinjiang, showed a downward trend from 2015 to 2020, and the decline in eastern provinces such as Beijing, Tianjin, Shanghai, Zhejiang and Hubei was most significant across the country, while that in Inner Mongolia, Liaoning, Guangxi, Chongqing, Ningxia and other provinces was relatively low. This phenomenon is consistent with the EKC law: provinces in East China, South China and Central China enjoy a relatively high level of economic development and have reached the inflection point of fertilizer consumption, while the western region still has room for growth in fertilizer consumption due to its relatively low level of economic development. In addition, the grain output of China showed significant differences from 2015 to 2020, with six eastern provinces including Beijing, Shanghai, Anhui, Hainan, Zhejiang and Heilongjiang witnessing a decline in crop yield, while the growth rate in provinces such as Shandong, Jiangsu, Henan, Hubei, Hunan, Shanxi, Jilin, etc., was slower than the national average. From a regional perspective, China’s grain growth from 2015 to 2020 mainly relied on North China (15.0% increase), Northwest China (14.7% increase) and South China (14.5% increase).
From the perspective of the decoupling effect, the crop effect of chemical fertilizers in Qinghai, Shanxi, Liaoning, Hubei, Jiangxi, Hebei, Shandong and other provinces presents as strong decoupling, and the decoupling effect is greater than the national average, which means that these provinces have achieved crop yield growth while reducing the use of chemical fertilizers, marking a preliminary success in the effort to achieve higher efficiency with less fertilizers. However, the crop yield effects of fertilizer in Heilongjiang, Shanghai, Zhejiang, Anhui and Hainan show a declining decoupling trend, indicating that these provinces have not been able to achieve grain production increases while implementing fertilizer reduction policies. Therefore, reducing fertilizer usage while maintaining or increasing crop yields may be challenging in these regions in the future.
Overall, the dependence of China’s agricultural production on chemical fertilizers has transformed from strong to weak and has returned from an extensive to relatively intensive form. At present, science and technology are replacing chemical fertilizers as the core driver to improve agricultural production, and agricultural development has entered a new stage of higher efficiency with less fertilizer. The study of regional differences in factors affecting China’s fertilizer consumption is of great significance for the formulation of domestic fertilizer policies and the regulation of fertilizer consumption in new situations.

3.3. Factors Driving Factors China’s Fertilizer Consumption

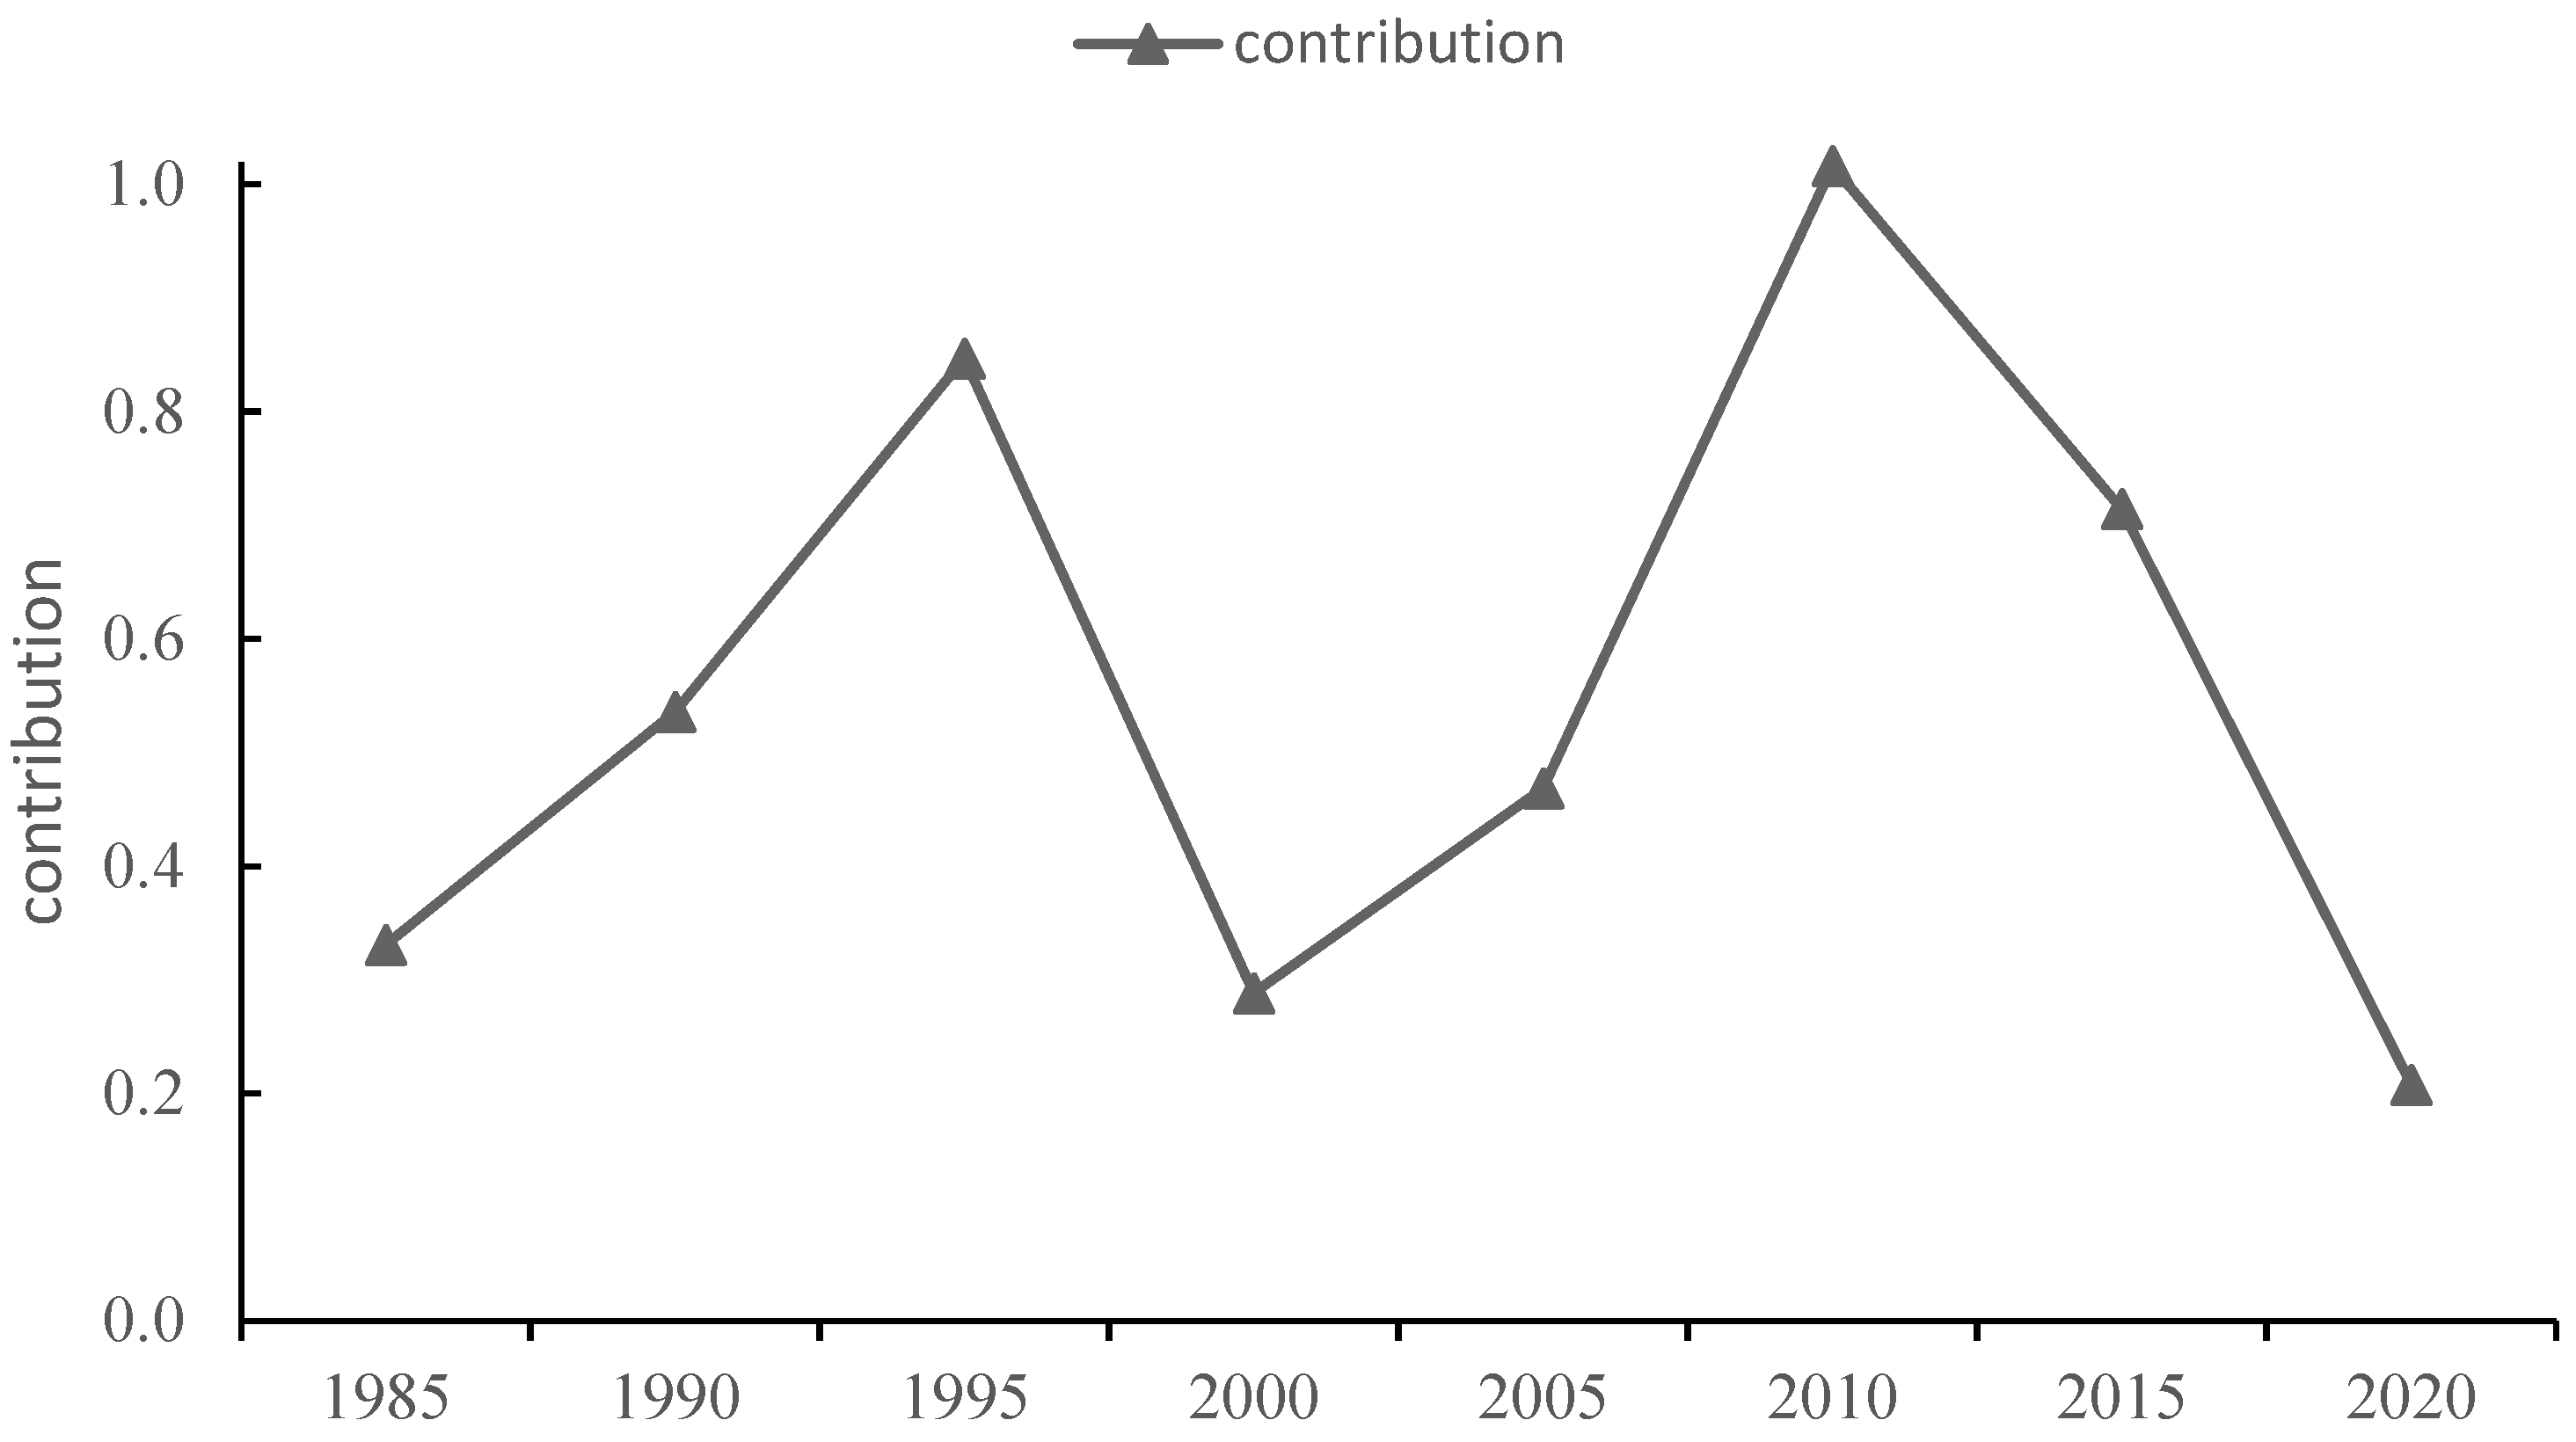
3.3.1. Factors Driving National Fertilizer Consumption

The IPAT-LMDI model is adopted to decompose the changes in China’s fertilizer consumption into nine factors, including the population size and technological level (Formulaes (4)–(16)), so as to determine the contribution degree of each factor. The contribution degree of chemical fertilizer is the ratio of the increase in chemical fertilizer consumption in a certain period to the total increase in chemical fertilizer consumption in the research period, which represents the contribution degree of the chemical fertilizer increase in this period. The change in China’s fertilizer contribution coefficient, presented in Figure 2, shows that China’s fertilizer consumption growth presents an M-shaped trend. From 1980 to 1995, the contribution coefficient increased from 0.331 to 0.847, moving up by 155.8 %, indicating a significant acceleration in the growth of fertilizer consumption. From 1995 to 2010, the contribution coefficient of China’s chemical fertilizer consumption was divided into two stages with the year 2000 as the node: from 1995 to 2000, the contribution coefficient dropped from 0.847 to 0.288, moving down by a significant 65.9% in a short period of time, indicating that willingness to consume fertilizer in China was severely lacking during the research period; however, since 2005, the contribution of fertilizer consumption in China has risen rapidly, reaching an extreme value of 1.02 in 2010. Since 2010, China’s fertilizer consumption coefficient has begun to decline, indicating that the growth rate of chemical fertilizer consumption has slowed down. The contribution rate dropped by 71.0% from 2015 to 2020, being far greater than the decline of 29.7% from 2010 to 2015. This is closely related to the implementation of China’s fertilizer zero-growth strategy, implemented since 2015, and reflects the fact that China’s fertilizer consumption has entered a new stage. Generally speaking, China’s fertilizer consumption has experienced a trend of “growth → slowdown → growth → slowdown”, but there are great differences in the influencing factors behind these two slowdowns.
Overall, factors such as economic level (Pg), crop value (Cval), fertilizer efficiency (Feff), fertilization intensity (Fein), per capita cultivated land area (Clap) and population size (P) play positive roles in promoting China’s fertilizer consumption, while factors such as the level of science and technology (Ffag), agricultural population (P1) and industrial structure (Inst) have negative inhibitory effects. The changes in the contribution coefficients of different factors (Figure 3) presented the following characteristics during 2010–2020 compared with 1995–2005: First, the effects of economic level (Pg), the crop value (Cval) and technological level (Ffag) on chemical fertilizer application greatly reduced. Second, the effects of the per capita cultivated land area (Clap) and chemical fertilizer efficiency (Feff) changed from negative to positive. Third, the effect of the industrial structure (Inst) increased significantly. This phenomenon is mainly due to the transformation of farming modes and production methods with the development of the economy and the improvement of agricultural science and technology. Since 2005, the contribution coefficient of the technological level has changed from −0.151 to −0.593, moving up by 292.5%, and it has remained at approximately −0.45, reflecting the increasing role of science and technology in the replacement of chemical fertilizers. In fact, this change is also reflected in the decoupling effect. Since 2005, the decoupling effects of chemical fertilizer consumption and crop yield have shown a trend of “expansive negative decoupling → weak decoupling → strong decoupling” (Table 2), which indicates that crop production is less reliant on chemical fertilizers, moving from the previous fertilizer-driven mode towards the technology-driven mode.

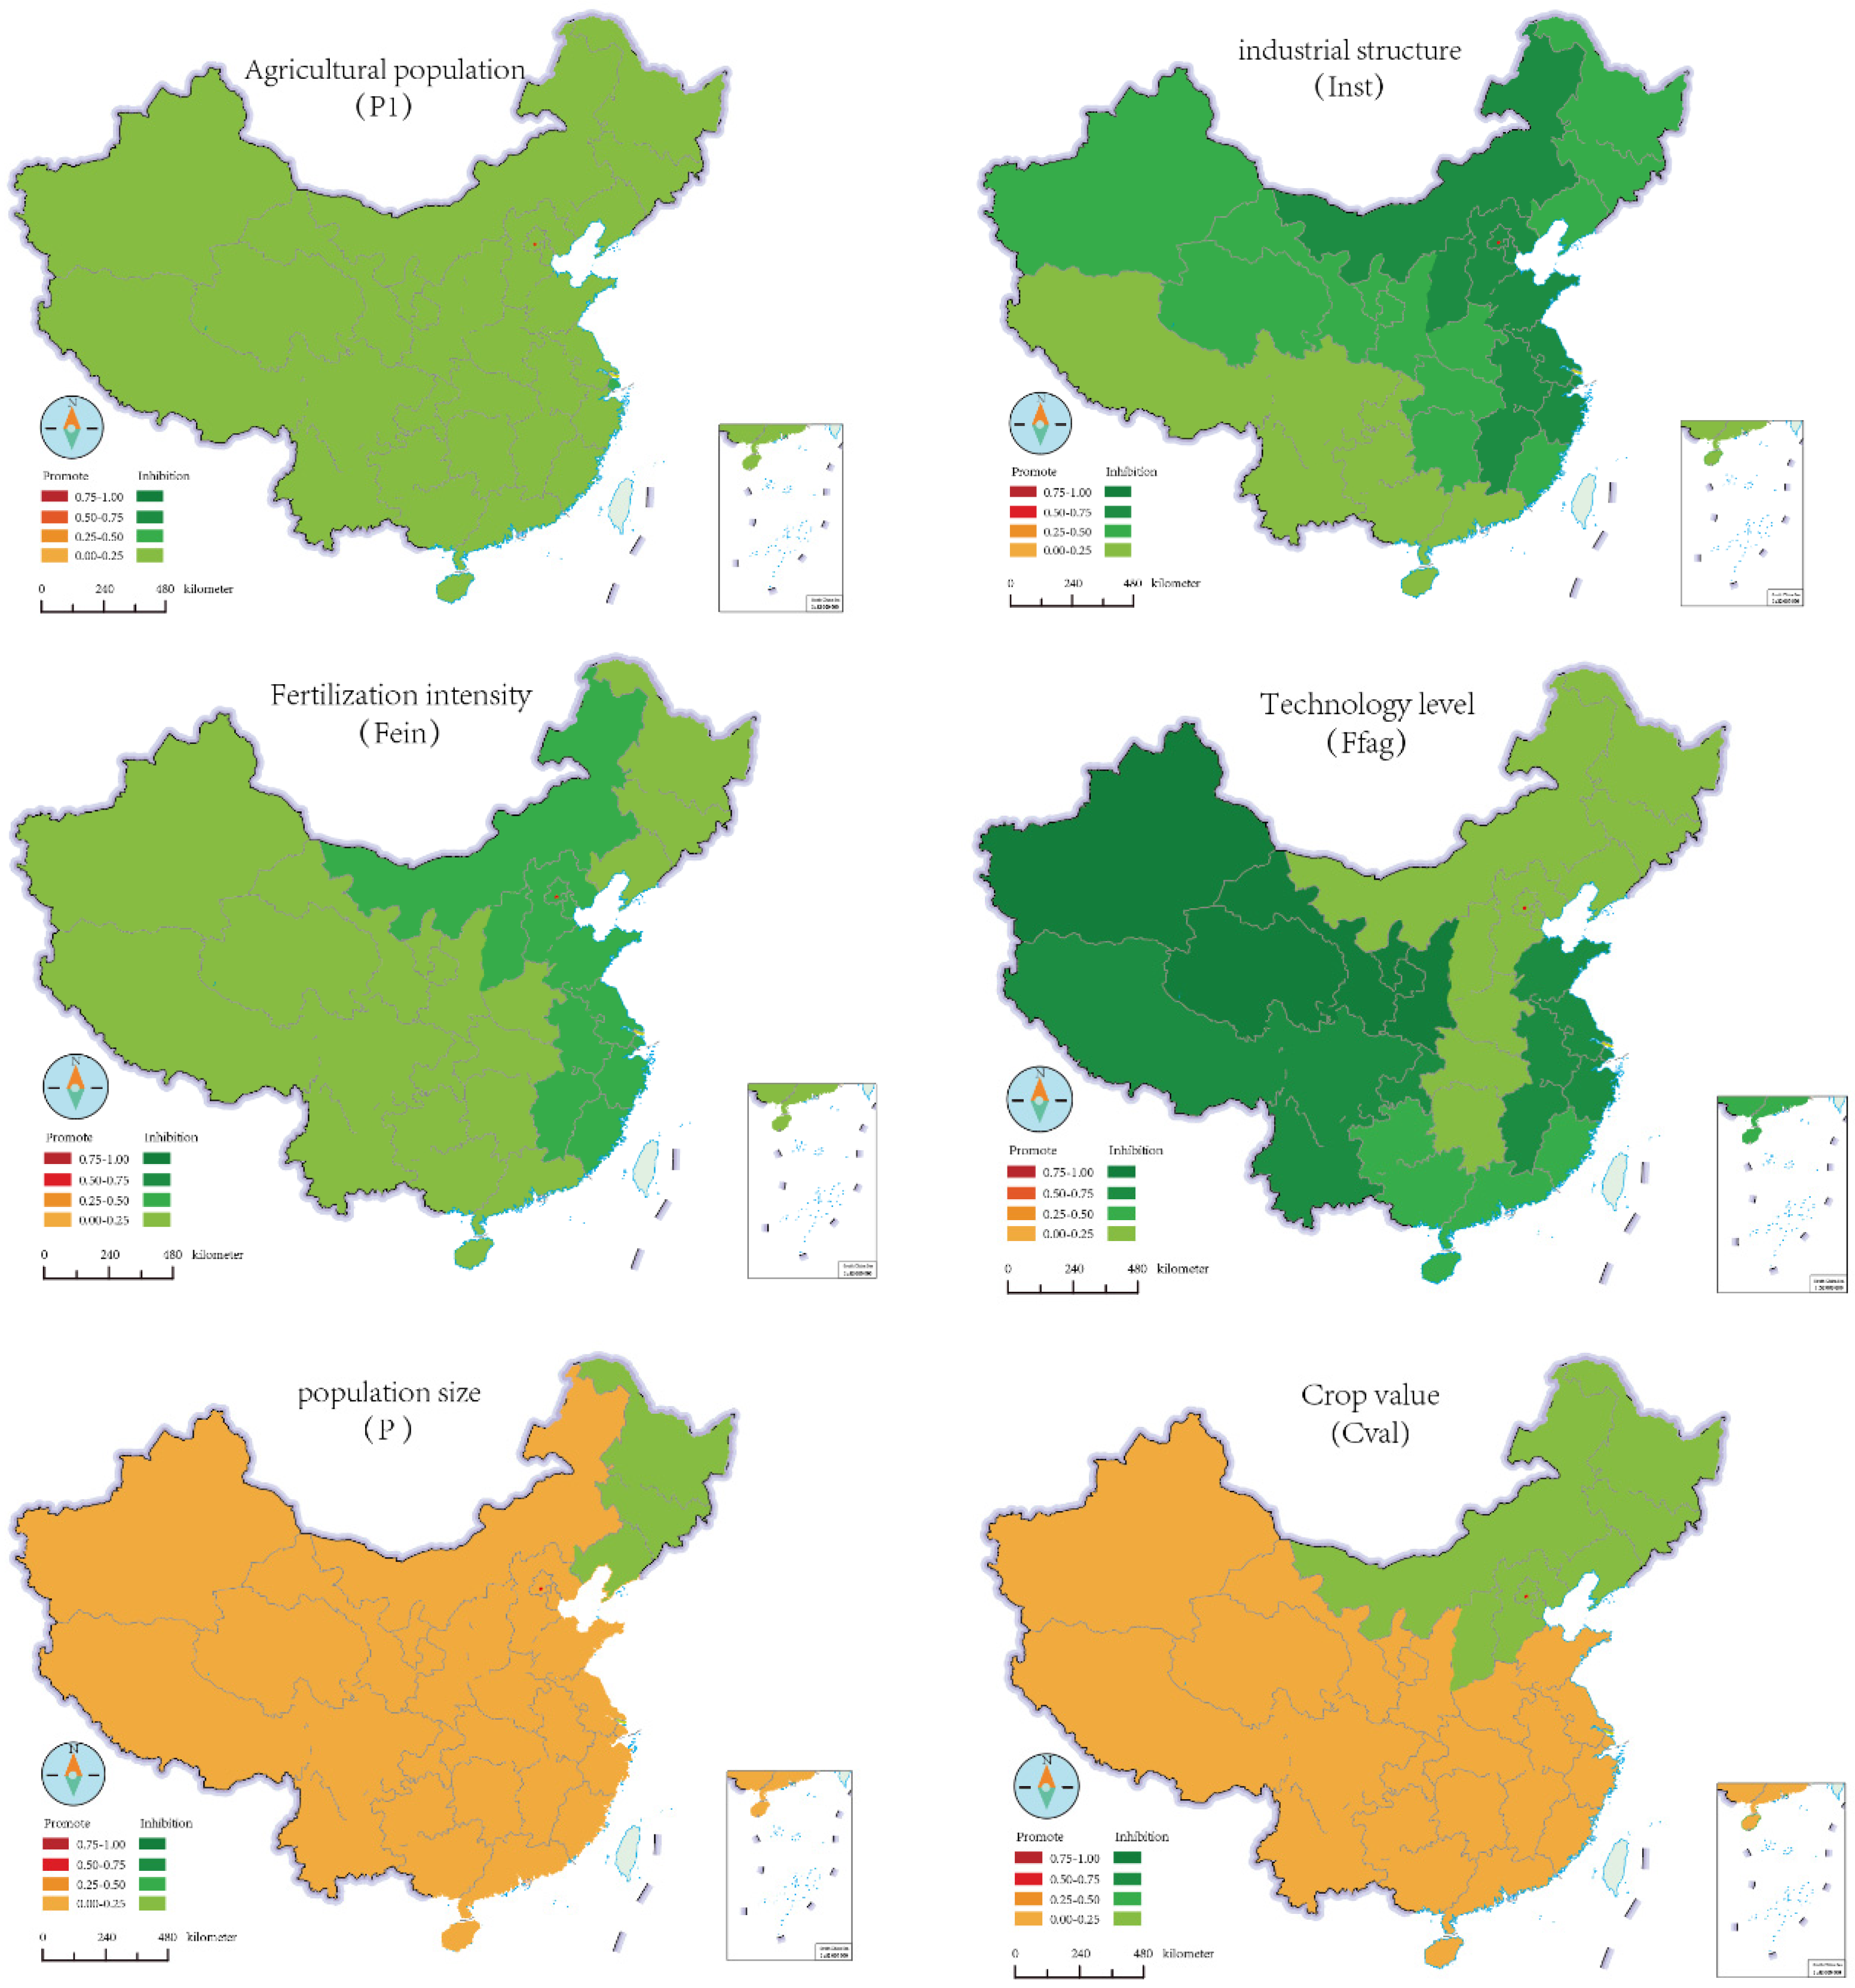
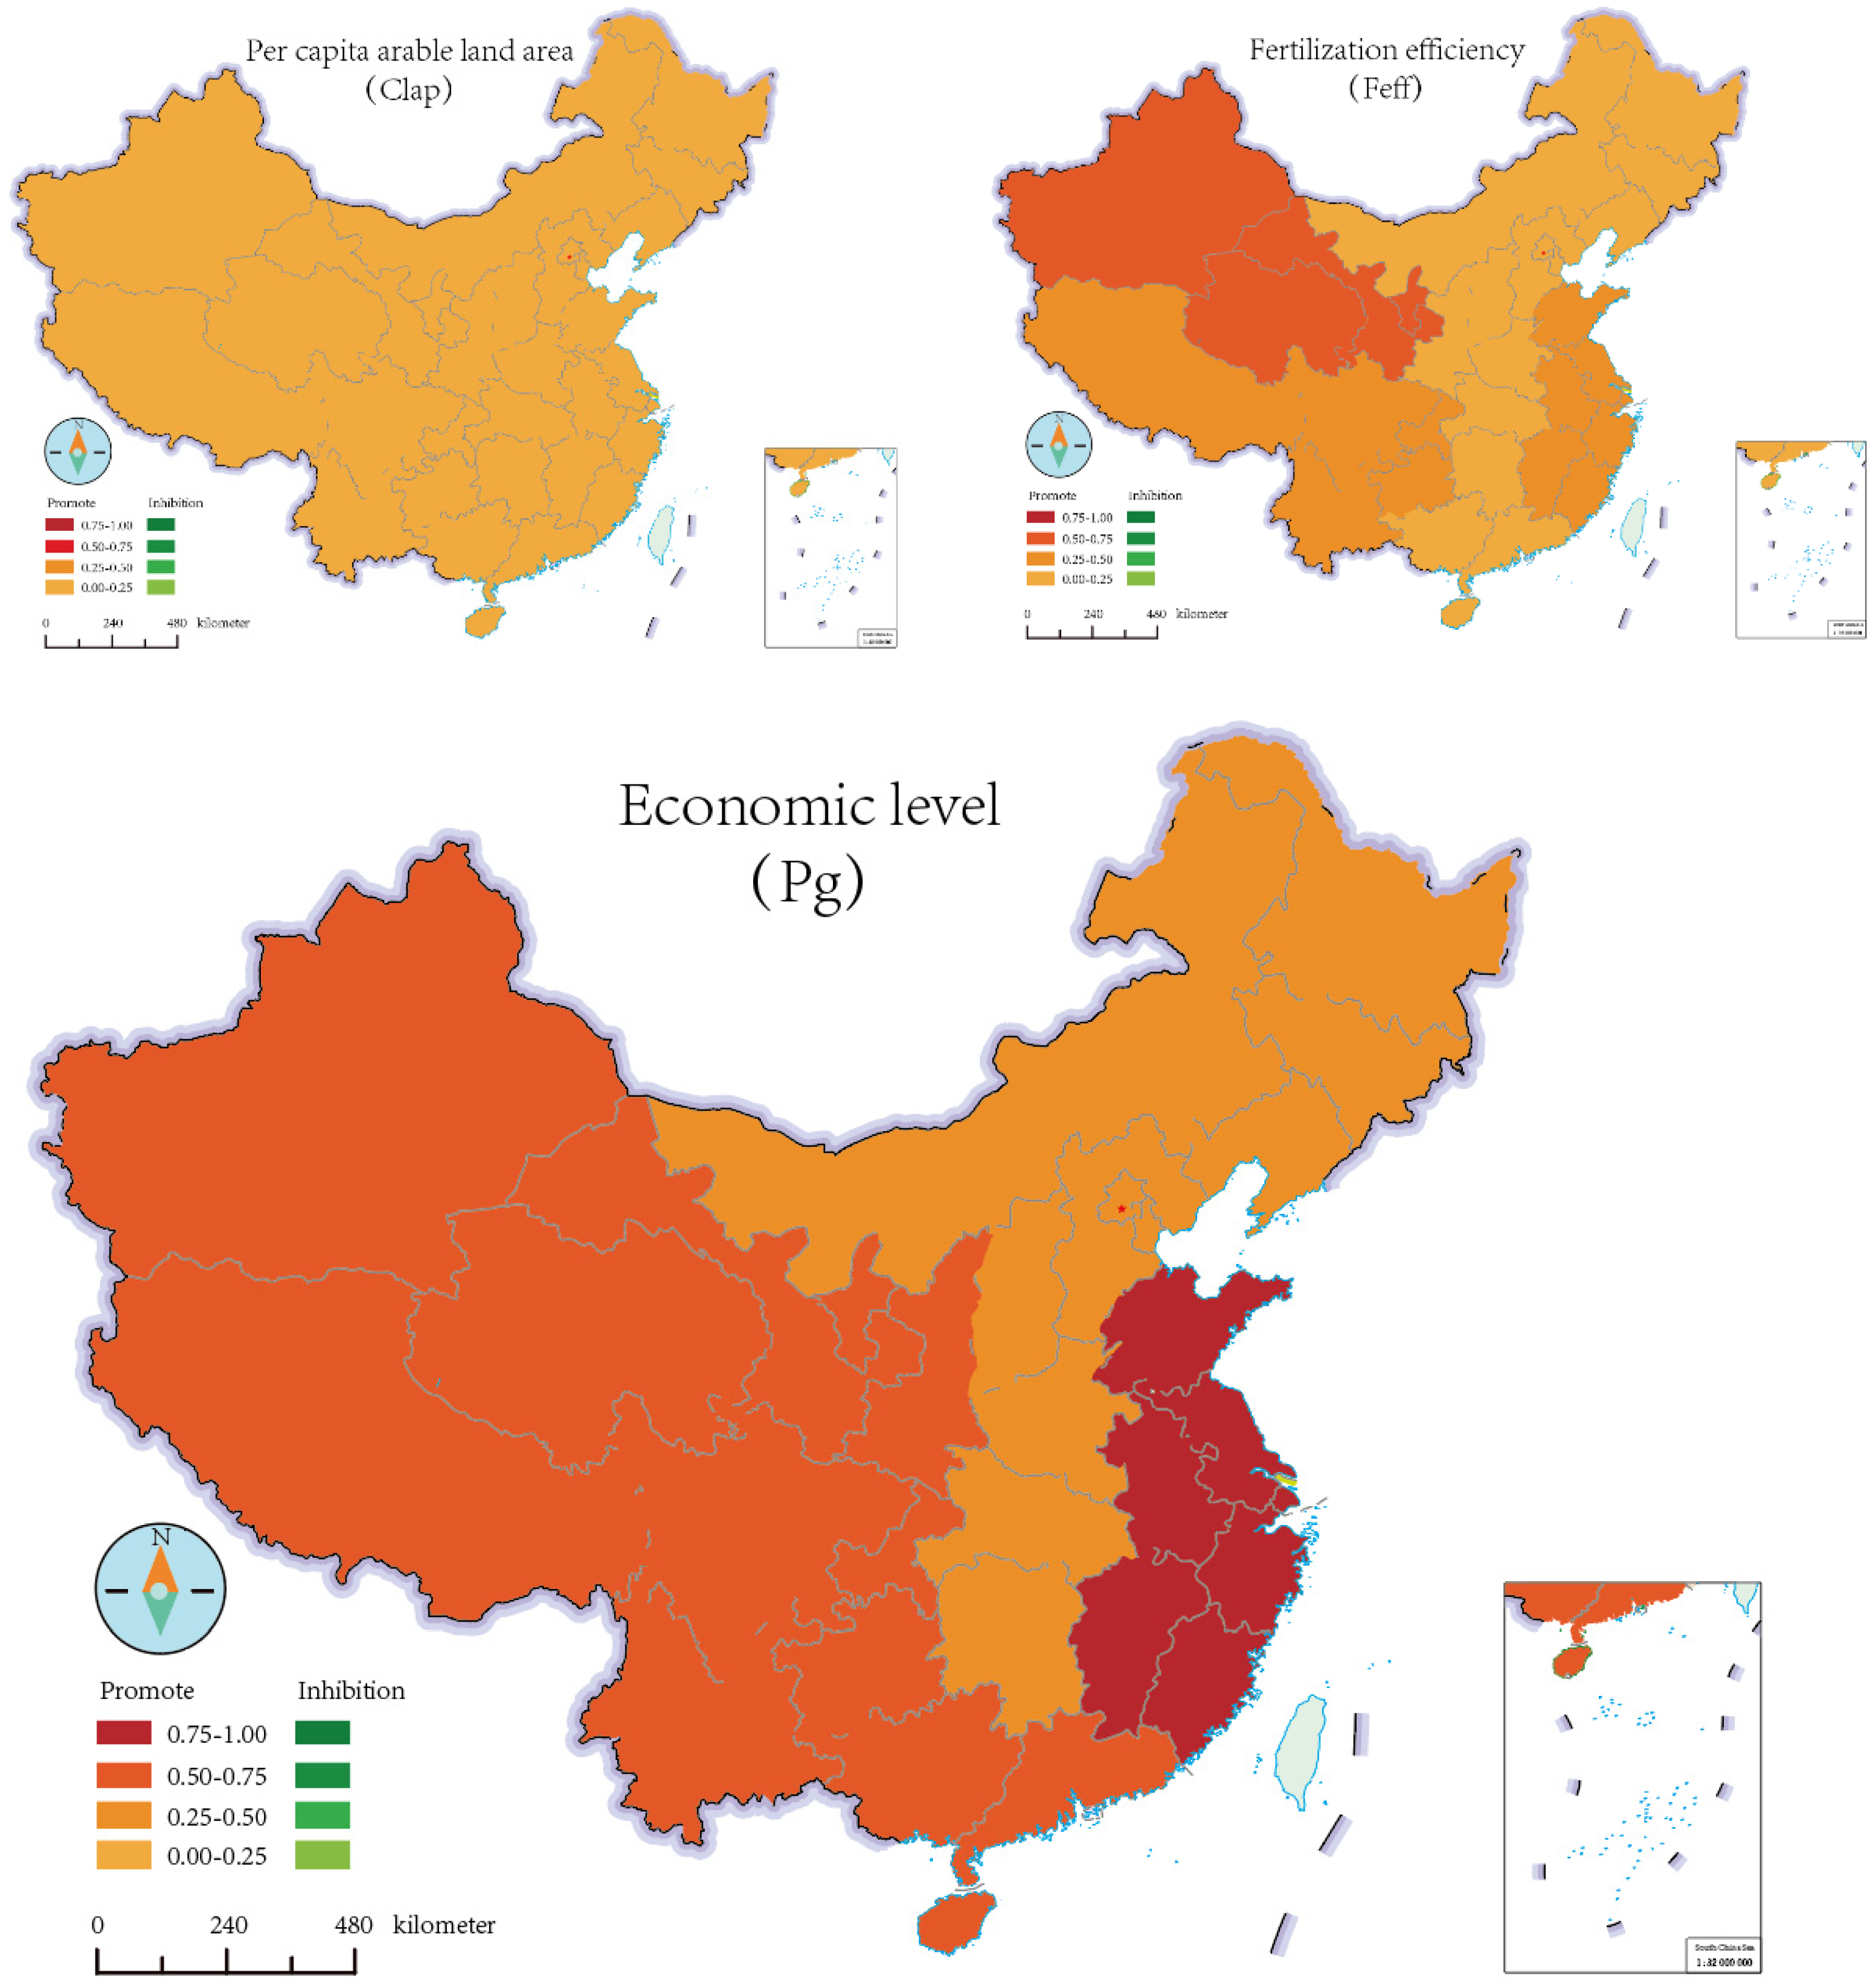
3.3.2. Factors Driving Regional Fertilizer Consumption

The authors decomposed the fertilizer consumption from 2015 to 2020 in North China, Northeast China, East China, Central China, South China, Southwest China and Northwest China with the LMDI decomposition model. The results are shown in Figure 4, where green indicates that the factor inhibits fertilizer consumption, while red indicates that it facilitates consumption. The darker the color is, the stronger the driving effect is. Overall, the driving effects of factors affecting fertilizer consumption in different regions of China are basically consistent with those at the national level, but there are significant differences between regions, mainly in two aspects. From a regional point of view, there are great differences in the driving effects of factors such as the technological level (Ffag), industrial structure (Inst), economic level (Pg) and fertilization intensity (Fein) between the eastern and western regions, reflecting differences in economic development and the level of science and technology between regions.
From the perspective of influencing factors, on the one hand, the population size and crop value have negative inhibitory effects on fertilizer consumption in Northeast China while positively promoting it in other regions. The population, as consumers and producers of social activities, directly affect the consumption of chemical fertilizers, having a significant positive effect. The statistics show that the total population of Northeast China decreased by 3.25 million and the agricultural population decreased by 5.84 million from 2015 to 2020. According to the decomposition results, this population loss in Northeast China reduced the consumption of chemical fertilizers by 910,000 tons during this period of time, and its contribution to the change in chemical fertilizers consumption was −178.6%, second only to the technology level (−312.6%), making it the second-largest factor affecting fertilizer reduction in Northeast China. The crop value is the economic content of crops, which is related to the crop planting structure. Economic crops consume more fertilizers than food crops [49]. On the other hand, there are large differences in the driving effects of different factors, and the driving effects of the technological level, economic level and industrial structure on fertilizer consumption are significantly greater than those of other factors. In fact, these differences are dynamically changing, as observed in the changes in crop value from 1985 to 1990, per capita cultivated land area from 1995 to 2000 and regional crop value from 2005 to 2010 between different regions. The industrial structure is the regional proportion of agricultural GDP. This factor is generally related to the economic level. The consumption of chemical fertilizers and GDP per capita conform to the Environmental Kuznets Curve [23]; that is, the economic level will affect the intensity of chemical fertilizer application and thus the total amount of fertilizer consumed [24].
Table 6 shows the main factors promoting and inhibiting factors chemical fertilizer consumption in different regions of China. The main promoting factors in all regions include the economic level, fertilizer efficiency, crop value and per capita cultivated land area, among which the economic level is the most important promoter. The second-largest driving factor in North China, East China, Central China and Northwest China is fertilizer efficiency, while that in Northeast China is the per capita cultivated land area, and that in South China and Southwest China is the crop value. The industrial structure, technological level and agricultural population are the main inhibitory factors for fertilizer consumption, but they display significant regional differences. In North China, Northeast China, East China and Central China, fertilizer consumption is mainly inhibited by the industrial structure, while in South China, Southwest China and Northwest China, it is inhibited by the level of science and technology. The second-largest inhibitory factors affecting fertilizer consumption between regions are also quite different. As shown in Figure 4, the crop value in North China, agricultural population in Northeast China, the level of science and technology in East and Central China, industrial structure in South China and Northwest China, and fertilization intensity in Southwest China are the second-largest factors inhibiting fertilizer consumption. This phenomenon is of great importance for developing of differentiated fertilizer policies, that is, formulating different policies according to different regional plans.

4. Conclusions and Suggestions for Policies

In order to address the negative impact of chemical fertilizer application on the environment, in this paper, with panel data from 31 provinces in China from 1980 to 2020 as the research object, we adopted the Tapio decoupling model to test the coupling relationship between chemical fertilizer application, economic development and crop yield in China and applied the IPAT-LMDI decomposition model to an empirical analysis of the factors driving China’s fertilizer application growth. The research conclusions and suggestions for policies are as follows:

4.1. Research Conclusions

(1) Since 2015, the consumption of chemical fertilizers in all major regions of China has decreased significantly, moving down by 2.15 million tons and 1.93 million tons in East China and Southwest China, respectively, and the implementation of zero-fertilizer policies has generally achieved remarkable results across the country.
(2) Since 1980, China’s crop production and economic development have achieved coordinated growth, but the decoupling relationship between chemical fertilizer consumption and economic growth has changed from weak to strong, and the dependence of China’s crop production on chemical fertilizers has gradually weakened.
(3) Economic level (Pg), crop value (Cval), fertilizer efficiency (Feff), fertilization intensity (Fein), per capita cultivated land area (Clap) and population size (P) play positive roles in promoting China’s fertilizer consumption, while the level of science and technology (Ffag), agricultural population (P1) and industrial structure (Inst) have negative inhibitory effects. These research findings are similar to those of existing studies [50,51,52].
(4) Chemical fertilizer consumption has arrived at its peak in the provinces of East China, South China and Central China, while the western region still has room for growth due to its relatively low level of economic development. Inter-provincial differences in economy and science and technology are the main factors that affect changes in fertilizer consumption. Some previous studies also expressed this view [53].

4.2. Policy Suggestions

As China is in a critical period of industrial restructuring, the proportion of agricultural output is declining, the level of urbanization is increasing, and the agricultural population continues to decrease. In the future, agriculture should follow a development trend requiring decision makers to shift the policy focus from reducing fertilization to increasing efficiency. Specifically, the consumption of chemical fertilizers can be adjusted in the following aspects: In terms of the technological level, one option is to increase investment in agricultural science and technology so as to reduce the dependence of crops on chemical fertilizers; the other is to reduce inter-regional differences in science and technology and improve the level of agricultural machinery and electrification in Northwest China. In terms of economic development, it is necessary to increase fiscal transfers to support agricultural production in the central and western regions. In terms of farming methods, land transfer should be encouraged to expand the scale of agricultural production.
In view of regional differences, different regions must formulate differentiated fertilizer policies. South China, Southwest China and Northwest China should focus on improving science and technology; North China should adjust its crop planting structure and increase the scale of grain crops so as to save water and reduce fertilization; Northeast China should optimize its farming methods, expand its farming scale and promote mechanized production; and East China, Central China and South China should focus on exploring modern technologies of agricultural production and fertilization to reduce the fertilization intensity per unit of cultivated land.

Author Contributions

Y.Z.: Conceptualization, methodology, writing—original draft. X.F.: software, writing—original draft. Y.M.: conceptualization, data curation. Y.W.: visualization, writing—reviewing and editing. X.F. and J.X.: data curation, methodology. L.W.: writing—reviewing and editing. All authors have read and agreed to the published version of the manuscript.

Funding

This research was funded by the China Geological Survey Project (No. DD20190199).

Institutional Review Board Statement

Not applicable.

Informed Consent Statement

Not applicable.

Data Availability Statement

Not applicable.

Conflicts of Interest

The authors declare no conflict of interest.

References

  1. Wang, Q.; Halbrendt, C.; Johnson, S.R. Grain production and environmental management in China’s fertilizer economy. J. Environ. Manag. 1996, 47, 283–296. [Google Scholar] [CrossRef]
  2. Xi, Z.B. On the assessment of the contribution of chemical fertilizers to crop yields. Phosphate Compd. Fertil. 2004, 3, 68–71. [Google Scholar]
  3. Edwin, D.O.; Zhang, X.L.; Yu, T. Current status of agricultural and rural non-point source Pollution assessment in China. Environ. Pollut. 2009, 158, 1159–1168. [Google Scholar]
  4. Li, G.; Bai, Y.L.; Wang, L.; Lu, Y.L.; Zhang, J.J.; Zhang, Y.J. Effects of fertilizer under different dripline spacings on summer maize in northern China. Sci. Rep. 2021, 11, 18922. [Google Scholar] [CrossRef] [PubMed]
  5. Xia, H.; Riaz, M.; Zhang, M.Y.; Liu, B.; Li, Y.X.; Desouki, Z.; Jiang, C.C. Biochar-N fertilizer interaction increases N utilization efficiency by modifying soil C/N component under N fertilizer deep placement modes. Chemosphere 2022, 286, 131594. [Google Scholar] [CrossRef]
  6. Philippe, A.; Howitt, P. A model of growth through creative destruction. Econometrica 1992, 60, 323–351. [Google Scholar]
  7. OECD (Organization for Economic Cooperation and Development). Indicators to Measure Decoupling of Environmental Pressure from Economic Growth; OECD: Paris, France, 2002. [Google Scholar]
  8. Tapio, P. Towards a theory of decoupling: Degrees of decoupling in the EU and the case of road traffic in Finland between 1970 and 2001. Transp. Policy 2005, 12, 137–151. [Google Scholar] [CrossRef]
  9. Abid, M. The close relationship between informal economic growth and carbon emissions in Tunisia since 1980: The (ir)relevance of structural breaks. Sustain. Cities Soc. 2015, 15, 11–21. [Google Scholar] [CrossRef]
  10. Lin, Y.; Yang, J.; Ye, Y. Spatial–temporal analysis of the relationships between agricultural production and use of agrochemicals in eastern China and related environmental and political implications (based on decoupling approach and LMDI decomposition analysis). Sustainability 2018, 10, 917. [Google Scholar] [CrossRef]
  11. He, R.; Shao, C.; Shi, R.; Zhang, Z.; Zhao, R. Development trend and driving factors of agricultural chemical fertilizer efficiency in China. Sustainability 2020, 12, 4607. [Google Scholar] [CrossRef]
  12. Yang, J.; Lin, Y. Spatiotemporal evolution and driving factors of fertilizer reduction control in Zhejiang Province. Sci. Total Environ. 2019, 660, 650–659. [Google Scholar] [CrossRef] [PubMed]
  13. Qu, H.; Yin, Y.; Xing, W.; Wang, W.; Zhou, C.; Li, J. Spatial-temporal characteristics and driving factors of the chemical fertilizer supply/demand correlation network in China. Environ. Sci. Pollut. Res. 2022, 29, 80532–80548. [Google Scholar] [CrossRef] [PubMed]
  14. Yang, J.; Lin, Y. Driving factors of total-factor substitution efficiency of chemical fertilizer input and related environmental regulation policy: A case study of Zhejiang Province. Environ. Pollut. 2020, 263, 114541. [Google Scholar] [CrossRef]
  15. Ji, Y.; Liu, H.; Shi, Y. Will China’s fertilizer use continue to decline? Evidence from LMDI analysis based on crops, regions and fertilizer types. PLoS ONE 2020, 15, e0237234. [Google Scholar] [CrossRef] [PubMed]
  16. Qu, H.; Han, J. Driving Factors for the Change of Fertilizer Use Intensity in China and Its Six Major Regions. Int. Bus. Res. 2021, 14, 1–71. [Google Scholar] [CrossRef]
  17. Wang, S.; Zhang, G.; Li, Q.; Li, Y. Driving factor decomposition of fertilizer application growth in China’s main grain producing areas. Res. Agric. Mod. 2017, 38, 658–665. [Google Scholar]
  18. Pan, D. The driving forces of fertilizer use intensity by crops in China: A complete decomposition model. Sci. Res. Essays 2014, 9, 229–237. [Google Scholar]
  19. Zhang, L.G.; LIU, C.; Chen, S. A Study of the Spatio-Temporal Evolution and Driving Factors of Fertilizer Application Intensity in Southern Rice Cultivation Area. J. Jiangxi Univ. Financ. Econ. 2021, 1, 104. [Google Scholar]
  20. Niu, M.; Tan, X.; Guo, J.; Li, G.C. Driving factors and growth potential of provincial carbon productivity in China. Sustainability 2021, 13, 9759. [Google Scholar] [CrossRef]
  21. Wei, Z.H.; QI, L.X.; Wang, R.M. The relationship between farm size and fertilizer use efficiency: Evidence from China. J. Integr. Agric. 2022, 21, 273–281. [Google Scholar]
  22. Zeng, Y.; Zhang, J.; He, K. Driving factors of rice farmers’ willingness to adopt organic fertilizer from the perspective of multidimensional family capital. J. Ecol. Rural. Environ. 2019, 35, 332–338. [Google Scholar]
  23. Zhang, J.; Manske, G.; Zhou, P.Q.; Tischbein, B.; Becker, M.; Li, Z.H. Factors influencing farmers’ decisions on nitrogen fertilizer application in the Liangzihu Lake basin, Central China. Environ. Dev. Sustain. 2017, 19, 791–805. [Google Scholar] [CrossRef]
  24. Gao, Y.; Song, X.; Zheng, W.; Wu, L.; Chen, Q.; Yu, X.; Zhang, M. The controlled-release nitrogen fertilizer driving the symbiosis of microbial communities to improve wheat productivity and soil fertility. Field Crops Res. 2022, 289, 108712. [Google Scholar] [CrossRef]
  25. Li, G.; Yu, W.; Meng, F.; Zhang, J.; Lu, C. Pathways and Drivers of Gross N Transformation in Different Soil Types under Long-Term Chemical Fertilizer Treatments. Agriculture 2023, 13, 300. [Google Scholar] [CrossRef]
  26. Wu, X.; Wang, R.; Hu, H.; Xiu, W.M.; Li, G.; Zhao, J.N.; Wang, X.Y. Response of bacterial and fungal communities to chemical fertilizer reduction combined with organic fertilizer and straw in fluvo-aquic soil. Huanjing Kexue 2020, 41, 4669–4681. [Google Scholar] [PubMed]
  27. Ang, B.W. Decomposition analysis for policymaking in energy: Which is the preferred method? Energy Policy 2004, 32, 1131–1139. [Google Scholar] [CrossRef]
  28. Ang, B.W. LMDI decomposition approach: A guide for implementation. Energy Policy 2015, 86, 233–238. [Google Scholar] [CrossRef]
  29. Zhao, X.; Song, L. Research on influential factors of agricultural carbon emission in Hunan Province based on LMDI model. Environ. Sci. Technol. 2018, 41, 177–183. [Google Scholar]
  30. Huang, W.; Li, H.; Chen, K.; Teng, X.; Cui, Y.; Yu, H.; Tang, Y. Improved Evaluation of Cultivation Performance for Maize Based on Group Decision Method of Data Envelopment Analysis Model. Appl. Sci. 2022, 13, 521. [Google Scholar] [CrossRef]
  31. Liu, Q.; Wu, T.Y.; Tu, W.; Pu, L. Analysis on the changes of fertilization intensity and efficiency in China’s grain production from 1980 to 2019. J. Sci. Food Agric. 2023, 103, 908–916. [Google Scholar] [CrossRef]
  32. Liu, Q.; Wu, T.Y.; Pu, L.; Sun, J. Comparison of fertilizer use efficiency in grain production between developing countries and developed countries. J. Sci. Food Agric. 2022, 102, 2404–2412. [Google Scholar] [CrossRef] [PubMed]
  33. Liu, Q.; Tu, W.; Pu, L.; Zhou, L. Regional Differences and Key Influencing Factors of Fertilizer Integrated Efficiency in China. Sustainability 2022, 14, 12974. [Google Scholar] [CrossRef]
  34. Shao, Y.H.; Chi, Y.Y.; Yush, L.C.; Ching, C.L. Agricultural Efficiency in Different Regions of China: An Empirical Analysis Based on Dynamic SBM-DEA Model. Sustainability 2023, 15, 7340. [Google Scholar]
  35. Ehrlich, P.; Holden, J. One-dimensional economy. Bull. At. Sci. 1972, 28, 16–27. [Google Scholar] [CrossRef]
  36. Commoner, B. Making Peace with the Planet; New Press: New York, NY, USA, 1992. [Google Scholar]
  37. Da Silva, B.A.; Constantino, M.; de Moraes, P.M.; Herrera, G.P.; de Oliveira, O.S.; dos Santos, S.A.L.; Kulevicz, R.A.; Porfírio, G.; da Costa, R.B. Econometric analysis of IPAT-e: A new tool for the environmental impact assessment of publicly traded companies. Environ. Impact Assess. Rev. 2021, 89, 106586. [Google Scholar] [CrossRef]
  38. Zhong, X.J.; Long, S.H. Recognition of the IPAT Model of Environmental Impact. China Popul. Resour. Environ. 2016, 26, 61–68. [Google Scholar]
  39. Qu, C.; Chen, T. Estimation and Calculation of China’s Carbon Emission Intensity Reduction Potential in 2030. China Popul. Resour. Environ. 2016, 26, 62–69. [Google Scholar]
  40. Jaruwan, C. Driving Forces of Energy-Related CO2 Emissions Based on Expanded IPAT Decomposition Analysis: Evidence from ASEAN and Four Selected Countries. Energies 2019, 12, 764. [Google Scholar]
  41. Cai, Z.; Zhang, C.C. Decomposition and Spatial Cluster Analysis of Driving Effect of China’s Per Capita Water Footprint. J. North China Univ. Water Resour. Electr. Power Nat. Sci. Ed. 2018, 39, 1–11. [Google Scholar]
  42. Zhu, J.; Liu, X.M.; Chu, Z.P. Scenario Analysis of Energy Demand and Carbon Emissions in Low-Carbon Cities. China Popul. Resour. Environ. 2015, 25, 48–55. [Google Scholar]
  43. Tian, Y.H.; Ruth, M.; Zhu, D.J. Using the IPAT identity and decoupling analysis to estimate wa-ter footprint variations for five major food crops in China from 1978 to 2010. Environ. Dev. Sustain. 2017, 19, 2355–2375. [Google Scholar] [CrossRef]
  44. Hou, M.Y.; Zhang, L.; Wang, Z.W. Estimation of fertilizer consumption for main crops in China. J. Agric. Resour. Environ. 2017, 34, 360–367. [Google Scholar]
  45. Zhang, X.; Davidson, E.A.; Mauzerall, D.L.; Searchinger, T.D.; Dumas, P.; Shen, Y. Managing nitrogen for sustainable development. Nature 2015, 528, 51–59. [Google Scholar] [CrossRef] [PubMed]
  46. Gu, B.J.; Ju, X.T.; Wu, Y.Y.; Erisman, J.W.; Bleeker, A.; Reis, S.; Sutton, M.A.; Lam, S.K.; Smith, P.; Oenema, O.; et al. Cleaning up nitrogen pollution may reduce future carbon sinks. Glob. Environ. Change 2018, 48, 56–66. [Google Scholar] [CrossRef]
  47. Wu, Y.; Xi, X.; Tang, X.; Luo, D.; Gu, B.; Lam, S.; Vitousek, P.; Chen, D. Policy distortions, farm size, and the overuse of agricultural chemicals in China. Proc. Natl. Acad. Sci. USA 2018, 115, 7010–7015. [Google Scholar] [CrossRef]
  48. Zhang, Y.; Yu, W.J.; Chen, Q.H.; Liu, Y.F.; Zhang, Y.S. Laws of fertilizer consumption and forecast of China’s demand for fertilizer and minerals. Resour. Sci. 2015, 37, 977–987. [Google Scholar]
  49. Huang, Y.Z.; Luo, X.F. Fertilizer Reduction and Substitution: Farmers’ Strategy Choice and Influencing Factors. J. South China Agric. Univ. Soc. Sci. Ed. 2020, 19, 77–87. [Google Scholar]
  50. Wang, Z.Y.; Li, G.C.; Zhou, X.S. Structure change of rural labor force, grain production and fertilizer using efficiency promotion: An empirical study based on stochastic frontier production function and Tobit model. J. China Agric. Univ. 2018, 23, 158–168. [Google Scholar]
  51. Cai, R.; Chen, P. Does agricultural machinery service improve fertilizer input efficiency: Take wheat as example. J. China Agric. Univ. 2021, 26, 265–274. [Google Scholar]
  52. Shi, C.L.; Zhu, J.F.; Luan, J. Analysis of wheat chemical fertilizer input efficiency and its influencing factors in China—Based on the 15 major wheat producing provinces in China. Agric. Technol. Econ. 2015, 11, 69–78. [Google Scholar]
  53. Cai, R.; Tao, S.M. Spatial difference and dynamic change of agricultural fertilizer input efficiency in China. J. Huazhong Agric. Univ. 2020, 6, 57–66. [Google Scholar]
Figure 1. Consumption Trajectories of Fertilizer in China, Japan and Korea.
Sustainability 15 07851 g001
Figure 2. Changes in the contribution coefficient of China’s fertilizer consumption from 1985 to 2020.
Sustainability 15 07851 g002
Figure 3. Changes in factors influencing China’s chemical fertilizer consumption and their contributions during 1980–2020.
Sustainability 15 07851 g003
Figure 4. The driving effects of chemical fertilizer consumption factors in different regions of China.
Sustainability 15 07851 g004aSustainability 15 07851 g004b
Table 1. List of recent studies on factors affecting China’s fertilizer consumption.
Influencing FactorsStudy AreaMethodologyTimeReferences
Fertilization intensity; planting structure; sowing areaChinaLMDI2020He, R. [11]
Agricultural scale; intensification; fertilizer use efficiency; labor productivityZhejiangLMDI2019Yang, J. [12]
Fertilizer-related policies; rural labor force scale; agricultural mechanization scale; agricultural planting structure; population; urbanization levelChinaGravity model2022Qu, H. [13]
Technical efficiency; substitution efficiency; comprehensive efficiencyZhejiangDEA (Data Envelopment Analysis) model, Panel Tobit model2020Yang, J. [14]
Scale effect; intensity effect; structure effectChinaLMDI2020Ji, Y. [15]
Fertilizer input–output ratio; unit labor output; unit sown area labor inputChinaExponential Decomposition Analysis (IDA) and Raspeer’s Exponential Decomposition2021Qu, H. [16]
Planting structure; fertilization intensity; sowing areaChinaFactorization2017Wang, S. [17]
Fertilizer use efficiency effect; crop structure change effect; production efficiency effectChinaComplete decomposition2014Pan, D. [18]
Per capita income of rural residents; per capita arable land area; agricultural planting structure; agricultural technologySouth part of ChinaESDA and SDM methods2021Zhang, L. [19]
Public Agricultural Extension Service (PAES)ChinaField investigation2022Lin, Y. [20]
farm sizeChinaField investigation2022Wei, Z.H. [21]
Household labor force; household economic capital; household land size; household work structure; land natural statusHubei ProvinceField investigation2020Zeng, Y. [22]
Planting structure; household income; education level; farmland productivityLiangzi Lake BasinField investigation2016Zhang, J. [23]
Soil microbial communityChinaAmplicon sequencing; co-occurrence networks2022Gao, Y. [24]
Soil type; temperature; precipitationJilin, Henan, Hunan15 N tracer method2023Li, G. [25]
Fertilization pattern; tillage patternNinghe District, TianjinField test2020Wu, X. [26]
Table 2. Tapio decoupling status and indicators.
Decoupling StatusΔFΔGIndex Range
DecouplingStrong decouplingΔF < 0ΔG > 0Index < 0
Weak decouplingΔF > 0ΔG > 00 < index < 0.8
Recessive decouplingΔF < 0ΔG < 0Index > 1.2
Strong negative decouplingΔF > 0ΔG < 0Index < 0
Negative decouplingWeak negative decouplingΔF < 0ΔG < 00 < index < 0.8
Expansive negative decouplingΔF > 0ΔG > 0Index > 1.2
CouplingExpansive couplingΔF > 0ΔG > 00.8 < exponent < 1.2
Recessive couplingΔC < 0ΔGDP < 00.8 < exponent < 1.2
Table 3. Division of provinces and regions in the study area.
AreaProvinces Contained
Northeast ChinaHeilongjiang, Liaoning, Jilin
North ChinaBeijing, Hebei, Tianjin, Shanxi, Shandong
Central ChinaHenan, Hubei, Hunan
East ChinaShanghai, Jiangsu, Anhui, Jiangxi, Zhejiang
South ChinaGuangdong, Guangxi, Fujian
Northwest ChinaXinjiang, Inner Mongolia, Jiangxi, Gansu, Ningxia, Shaanxi, Qinghai
Southwest ChinaChongqing, Sichuan, Guizhou, Yunnan, Tibet
Table 4. Decoupling effect of fertilizer consumption in China from 1980 to 2020.
TimeE (F G)E (N G)E (F N)
Elastic CoefficientDecoupling StateElastic CoefficientDecoupling StateElastic CoefficientDecoupling State
1980–19850.45Weak decoupling0.28Weak decoupling1.63Expansive negative decoupling
1985–19900.50Weak decoupling0.23Weak decoupling2.15Expansive negative decoupling
1990–19950.19Weak decoupling0.06Weak decoupling3.01Expansive negative decoupling
1995–20000.29Weak decoupling0.46Weak decoupling0.64Weak decoupling
2000–20050.15Weak decoupling0.19Weak decoupling0.82Weak decoupling
2005–20100.17Weak decoupling0.12Weak decoupling1.41Expansive negative decoupling
2010–20150.13Weak decoupling0.27Weak decoupling0.48Weak decoupling
2015–2020−0.29Strong decoupling0.20Weak decoupling−1.48Strong decoupling
Table 5. Decoupling status of chemical fertilizer consumption in different provinces in China, 2015–2020.
RegionE (F G)E (N G)E (F N)
Elastic CoefficientDecoupling StatusElastic CoefficientDecoupling StatusElastic CoefficientDecoupling State
Beijing−0.97Strong decoupling−0.81Strong decoupling1.19Recessive coupling
Tianjing−1.11Strong decoupling0.20Strong negative decoupling−5.48Strong decoupling
Hebei−0.44Strong decoupling0.11Weak decoupling−3.89Strong decoupling
Shanxi−0.23Strong decoupling0.12Weak decoupling−1.93Strong decoupling
Inner Mongolia−0.29Strong decoupling0.37Weak decoupling−0.78Strong decoupling
Liaoning−0.38Strong decoupling0.05Weak decoupling−7.42Strong decoupling
Jilin−0.09Strong decoupling−0.05Strong decoupling1.62Recessive coupling
Heilongjiang−0.56Strong decoupling−0.11Strong decoupling5.10Recessive coupling
Shanghai−0.71Strong decoupling−0.55Strong decoupling1.29Recessive coupling
Jiangsu−0.29Strong decoupling0.09Weak decoupling−3.09Strong decoupling
Zhejiang−0.54Strong decoupling−0.05Strong decoupling11.80Recessive coupling
Anhui−0.27Strong decoupling−0.12Strong decoupling2.27Recessive coupling
Fujian−0.33Strong decoupling0.27Weak decoupling−1.22Strong decoupling
Jiangxi−0.49Strong decoupling0.10Weak decoupling−4.83Strong decoupling
Shandong−0.63Strong decoupling0.20Weak decoupling−3.13Strong decoupling
Henan−0.22Strong decoupling0.18Weak decoupling−1.25Strong decoupling
Hubei−0.45Strong decoupling0.09Weak decoupling−4.82Strong decoupling
Hunan−0.22Strong decoupling0.27Weak decoupling−0.83Strong decoupling
Guangdong−0.44Strong decoupling0.50Weak decoupling−0.87Strong decoupling
Guangxi−0.11Strong decoupling0.42Weak decoupling−0.25Strong decoupling
Hainan−0.40Strong decoupling−0.13Strong decoupling3.16Recessive coupling
Chongqing−0.17Strong decoupling0.37Weak decoupling−0.46Strong decoupling
Sichuan −0.28Strong decoupling0.27Weak decoupling−1.02Strong decoupling
Guizhou−0.38Strong decoupling0.59Weak decoupling−0.63Strong decoupling
Yunnan−0.25Strong decoupling0.20Weak decoupling−1.26Strong decoupling
Tibet−0.40Strong decoupling1.25Expansive negative decoupling−0.32Strong decoupling
Shaanxi−0.31Strong decoupling0.37Weak decoupling−0.83Strong decoupling
Gansu−0.51Strong decoupling0.65Weak decoupling−0.79Strong decoupling
Qinghai−1.03Strong decoupling0.07Weak decoupling−15.57Strong decoupling
Table 6. Main Factors Influencing Fertilizer Consumption in Different Regions of China.
RegionPromoting FactorsInhibitory Factors
The Most InfluentialSecond InfluentialThe Most InfluentialSecond Influential
North ChinaEconomic levelFertilizer efficiencyIndustrial structureCrop value
Northeast ChinaEconomic levelPer capita cultivated land areaIndustrial structureAgricultural population
East ChinaEconomic levelFertilizer efficiencyIndustrial structureTechnological level
Central ChinaEconomic levelFertilizer efficiencyIndustrial structureTechnological level
South ChinaEconomic levelCrop valueTechnological levelIndustrial structure
Southwest ChinaCrop valueFertilizer efficiencyTechnological levelFertilization intensity
Northwest ChinaEconomic levelFertilizer efficiencyTechnological levelIndustrial structure
Disclaimer/Publisher’s Note: The statements, opinions and data contained in all publications are solely those of the individual author(s) and contributor(s) and not of MDPI and/or the editor(s). MDPI and/or the editor(s) disclaim responsibility for any injury to people or property resulting from any ideas, methods, instructions or products referred to in the content.

