

Two-Layer Optimization Planning Model for Integrated Energy Systems in Hydrogen Refueling Original Station

 ,
,  ,
,  and
and
Abstract
:1. Introduction
2. Integrated Energy System with Hydrogen Production Unit
- (a)
- Do all the devices in Figure 1 need to be constructed? Which of them are necessary?
- (b)
- What is the capacity of each necessary device? What is the total cost in manufacturing construction?
- (c)
- What is the operational behavior of each device? What is the total cost of operation?
- (d)
- How do I find out the total minimum cost after considering all the above issues?
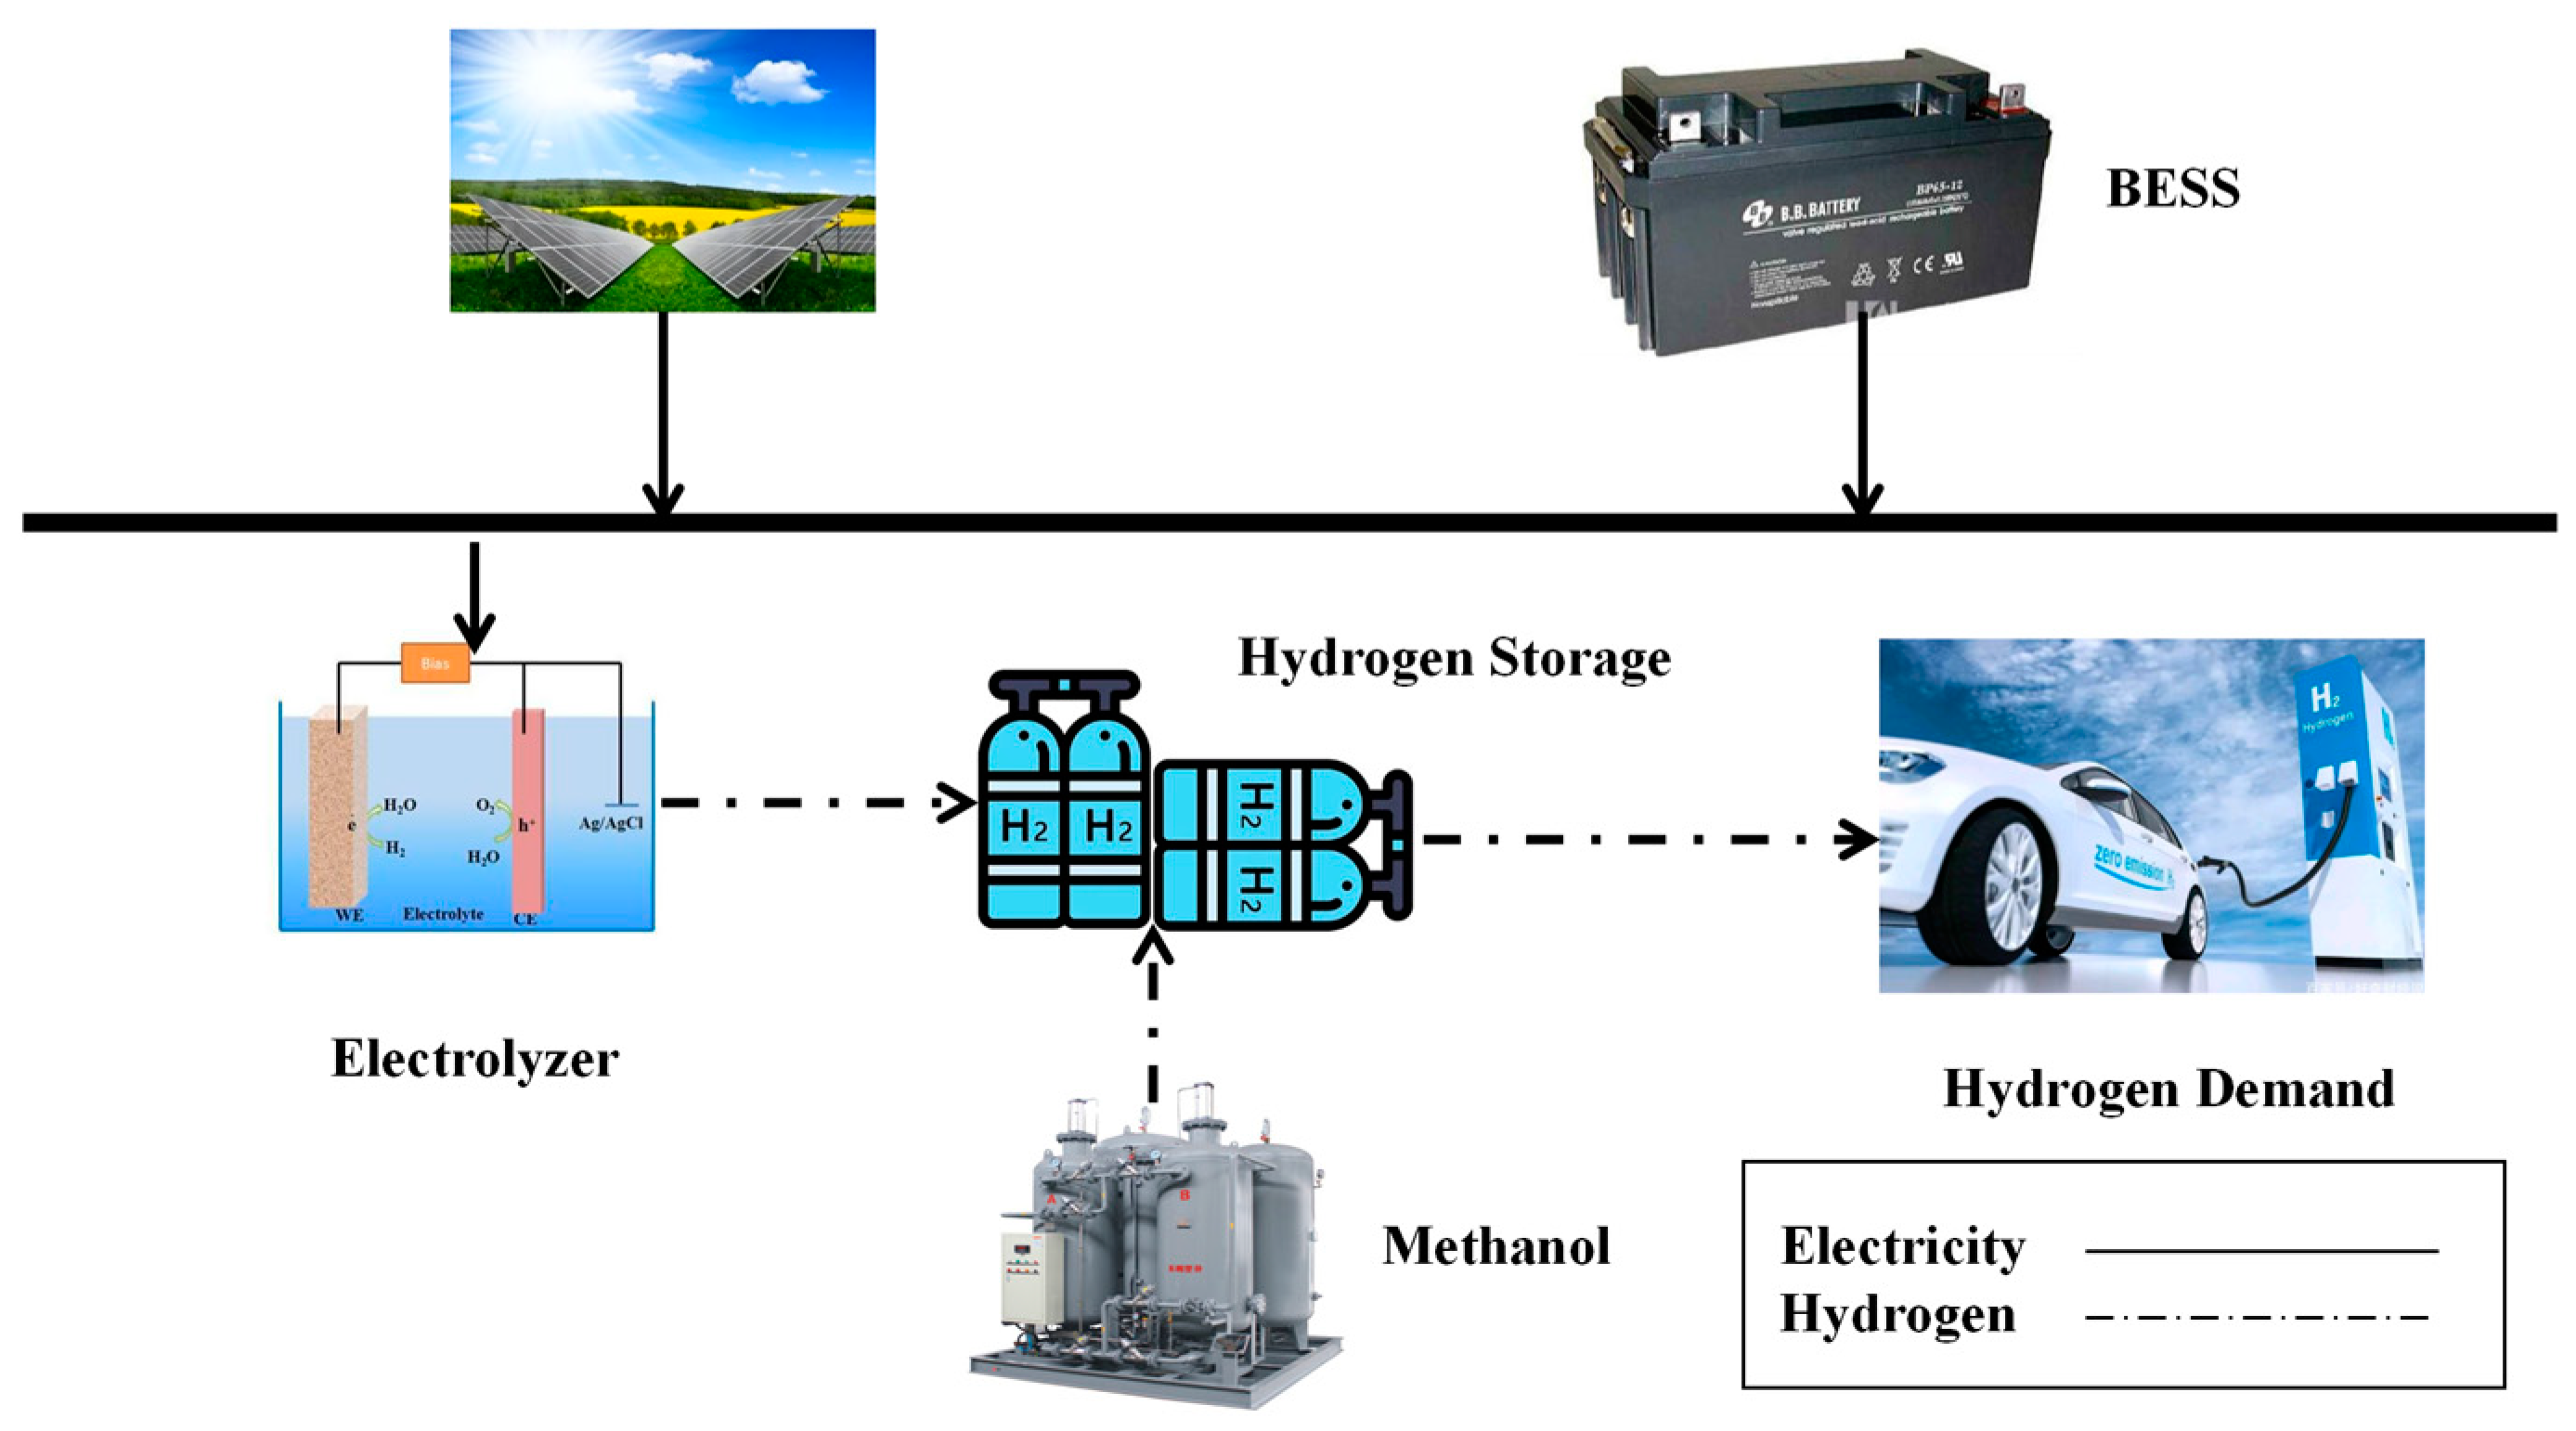
2.1. Integrated Energy System Structure
2.2. Hydrogen Production from Water-Electrolytic
2.3. Hydrogen Production by Methanol
3. Two-Layer Optimization Model of Hydrogen Energy for Integrated Energy Systems
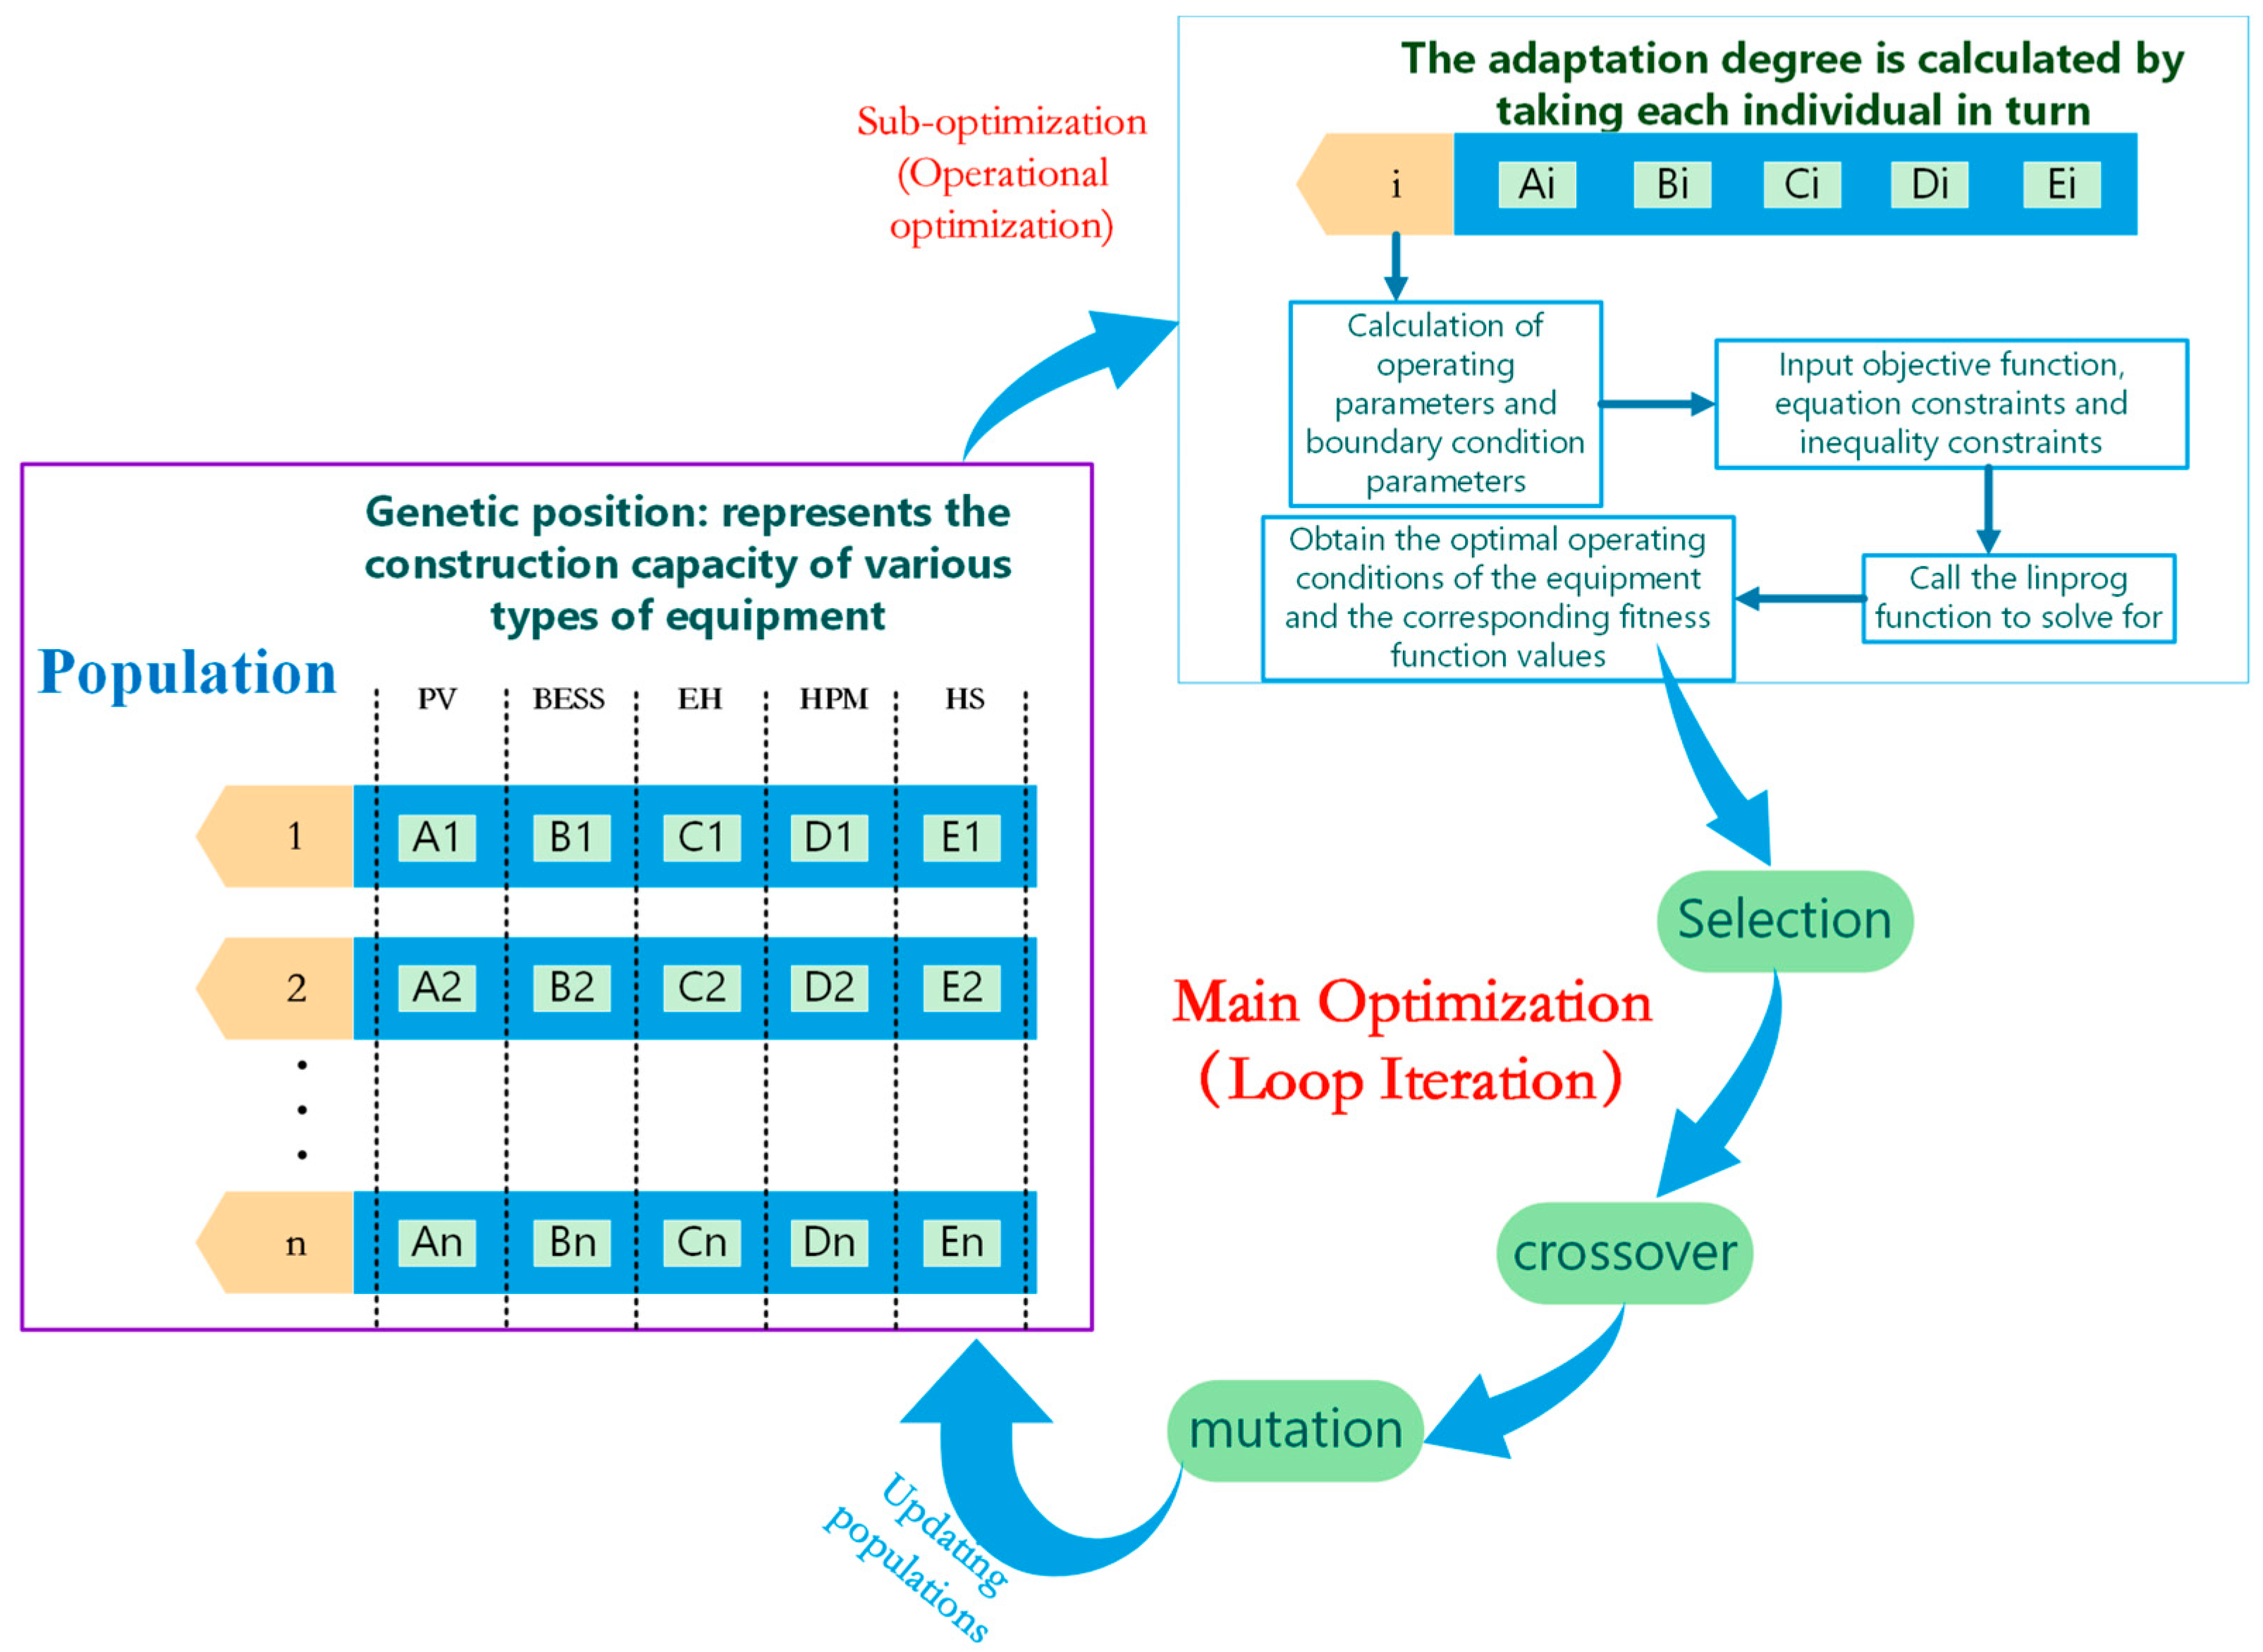
3.1. Two-Layer Optimization Model
3.1.1. Main Optimization Stage
3.1.2. Sub-Optimization Stage
3.2. Main Optimization Function
3.2.1. Objective Function
3.2.2. Optimization Constraints
3.3. Sub-Optimization Function
3.3.1. Objective Function
3.3.2. Optimization Constraints
4. Numerical Study
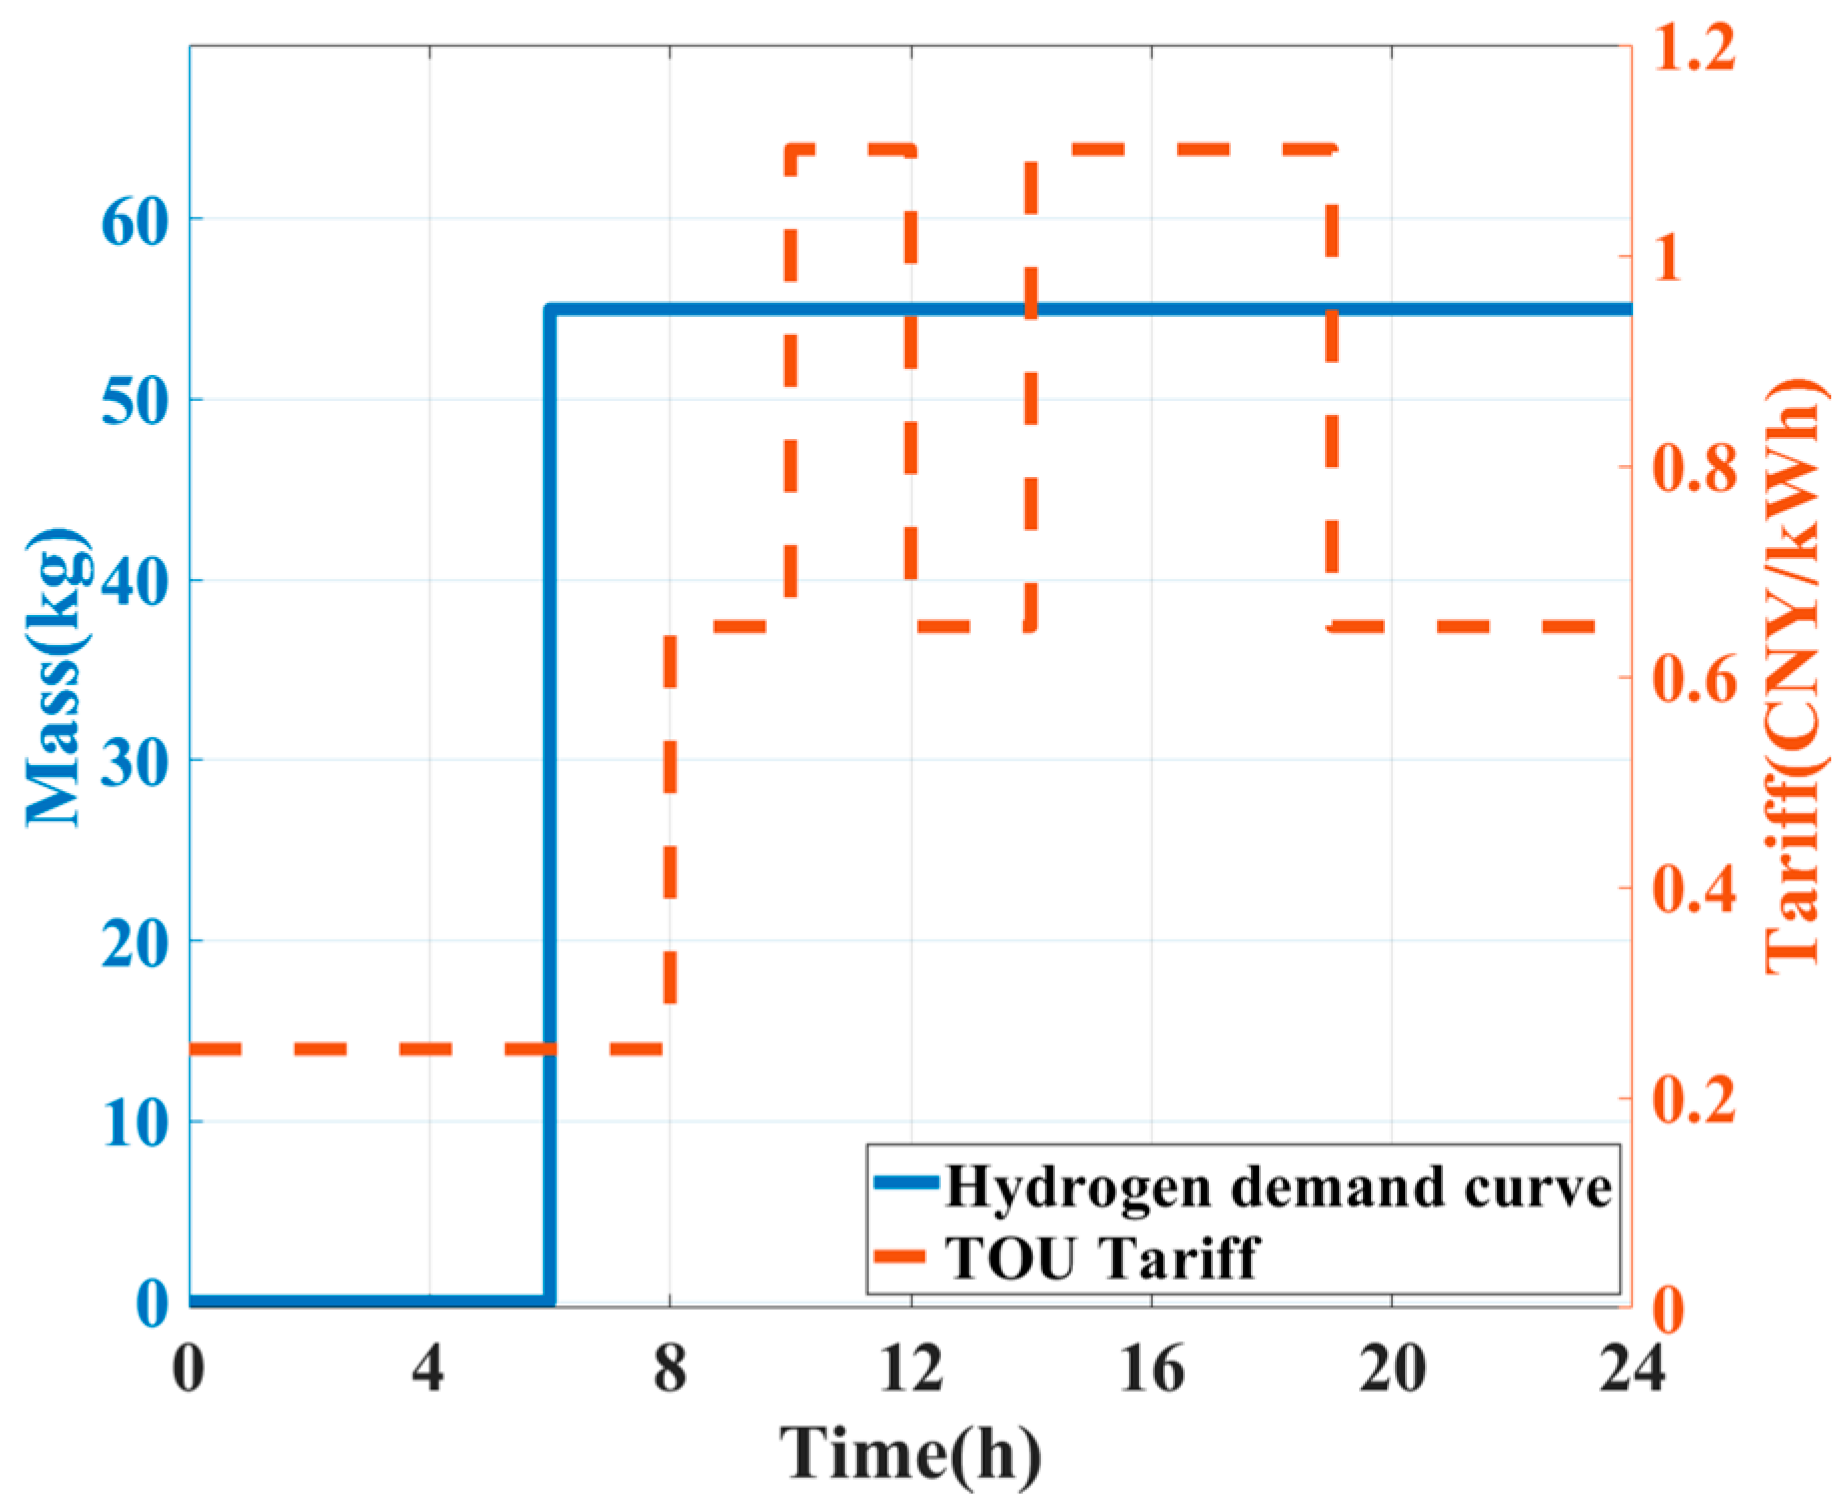
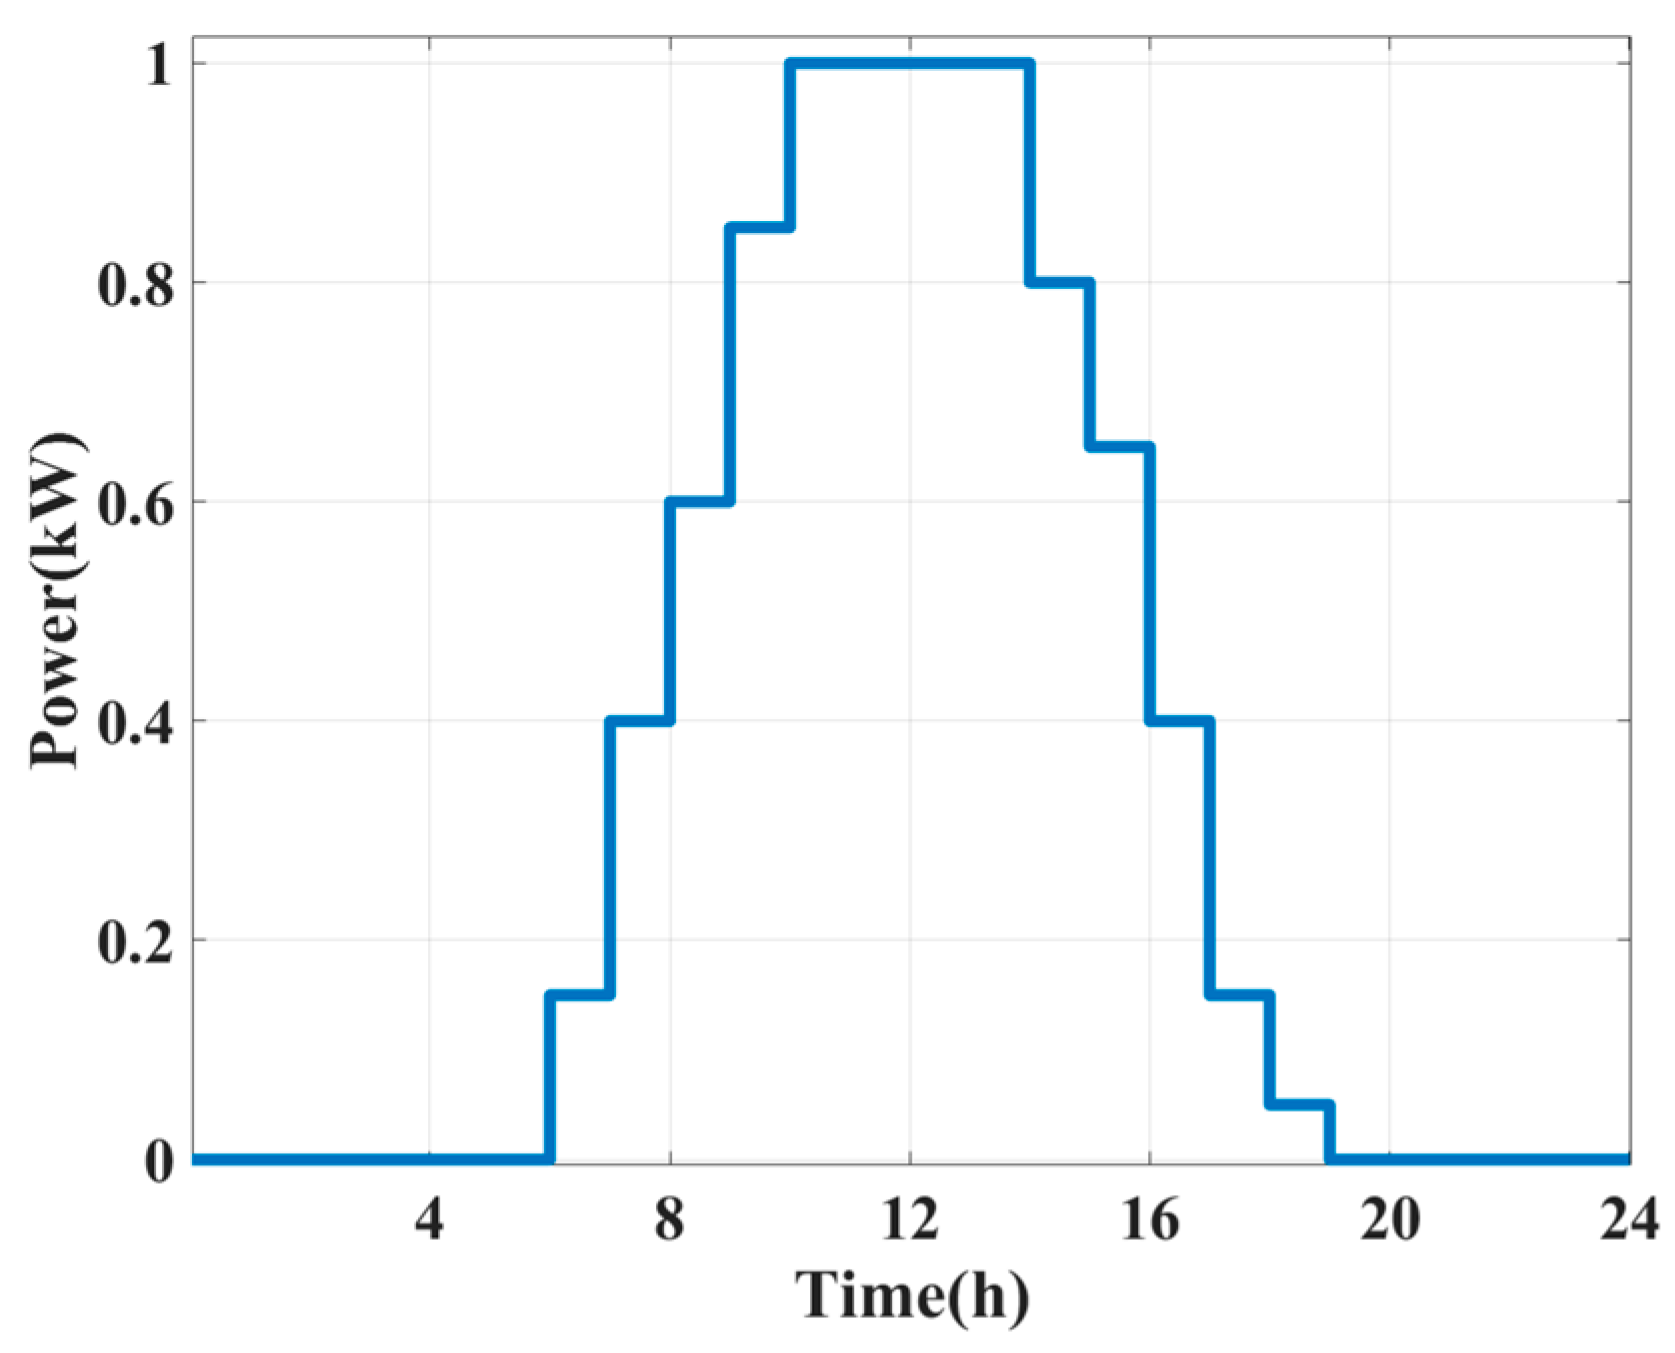
4.1. Background
4.2. Results and Feasibility Analysis
4.3. Analysis of Sensitivity Test Results
5. Conclusions
Author Contributions
Funding
Institutional Review Board Statement
Informed Consent Statement
Data Availability Statement
Conflicts of Interest
Nomenclature
| Abbreviations | |
| PV, Elz | Photovoltaic, Electrolyzer |
| BESS | Battery energy storage system |
| HS | Hydrogen storage |
| EH | Electrolysis hydrogen |
| HPM | Hydrogen Production from Methanol |
| HPWE | Hydrogen Production from Water Electrolysis |
| HPNG | Hydrogen Production from Natural Gas |
| OPEX | Operating Expense |
| CAPEX | Capital Expenditure |
| Indices and Sets | |
| The capacity of photovoltaic equipment construction (kW) | |
| Capacity for construction of electric energy storage equipment (kWh) | |
| Capacity for construction of hydrogen production equipment for water electrolysis with proton exchange membrane (kW) | |
| Capacity of methanol reforming hydrogen production equipment construction (kg) | |
| Capacity of hydrogen storage tank construction (kg) | |
| Operating cost for one dispatch cycle when the hydrogen refueling station is in optimal operating condition (CNY) | |
| The input power of the hydrogen production equipment for proton exchange membrane water electrolysis in the t-th time period (kW) | |
| The input methanol mass of the methanol reforming hydrogen plant at time t (kg) | |
| The power generated by the photovoltaic equipment in time period t (kW) | |
| The charging and discharging power of the electric energy storage equipment in time period t (kW) | |
| The total amount of electricity purchased from the grid at the hydrogen refueling station in time period t (kWh) | |
| The mass of hydrogen produced by the proton exchange membrane water electrolysis hydrogen production plant in time period t (kg) | |
| The mass of hydrogen produced by the methanol reforming hydrogen plant in the t time period (kg) | |
| Maximum charging and discharging power of the electric energy storage equipment (kW) | |
| Initial energy storage capacity of the electric energy storage equipment (kWh) | |
| Initial storage capacity of the hydrogen storage tank (kg) | |
| Minimum input power of the proton exchange membrane water electrolysis hydrogen plant (kW) | |
| The maximum input power of the water electrolysis equipment with proton exchange membrane (kW) | |
| Minimum input power of methanol reforming hydrogen plant (kW) | |
| Maximum input power of the methanol reforming hydrogen plant (kW) | |
| Basic operating parameters of a hydrogenation station for a given equipment | |
| Scheduling period (hour) | |
| Unit dispatch time (hour) | |
| Grid electricity price for the t-th period (CNY/kWh) | |
| Market price of methanol at time t (CNY/kg) | |
| Hydrogen demand at time t (kg) | |
| Power generation per unit capacity of PV equipment in time period t (kW) | |
| Basic electric load power of hydrogen refueling station in time t (kW) | |
| Electric hydrogen conversion factor (Nm3/kWh) | |
| The conversion efficiency of the water electrolysis plant with proton exchange membrane | |
| Conversion efficiency of methanol reforming hydrogen plant | |
| A coefficient for apportioning the CAPEX of equipments to each typical day | |
| Unit investment cost of photovoltaic equipment (CNY/kW) | |
| Unit investment cost of electric energy storage equipment (CNY/kWh) | |
| Proton exchange membrane water electrolysis hydrogen production equipment unit investment cost (CNY/kW) | |
| Unit investment cost of methanol reforming hydrogen production equipment (CNY/kg) | |
| Hydrogen storage tank unit investment cost (CNY/kg) | |
| , | Maximum and minimum capacity constraint for investment and construction of photovoltaic equipment (kW) |
| , | Maximum and minimum capacity constraint of electric energy storage equipment investment and construction (kWh) |
| , | Maximum and minimum capacity constraint for investment and construction of hydrogen production equipment with proton exchange membrane water electrolysis (kW) |
| , | Maximum and minimum capacity constraints for investment and construction of methanol reforming hydrogen production equipment (kg) |
| , | Maximum and minimum capacity constraints for investment and construction of hydrogen storage tanks (kg) |
References
- Yue, M.; Lambert, H.; Pahon, E.; Roche, R.; Jemei, S.; Hissel, D. Hydrogen energy systems: A critical review of technologies, applications, trends and challenges. Renew. Sustain. Energy Rev. 2021, 146, 111180. [Google Scholar] [CrossRef]
- Abe, J.O.; Popoola, A.P.I.; Ajenifuja, E.; Popoola, O.M. Hydrogen energy, economy and storage: Review and recommendation. Int. J. Hydrogen Energy 2019, 44, 15072–15086. [Google Scholar] [CrossRef]
- Sorgulu, F.; Dincer, I. A renewable source based hydrogen energy system for residential applications. Int. J. Hydrogen Energy 2018, 43, 5842–5851. [Google Scholar] [CrossRef]
- Lai, C.S.; Lai, L.L.; Lai, Q.H. Smart Energy for Transportation and Health in a Smart City; John Wiley & Sons: New York, NY, USA, 2022. [Google Scholar]
- Lai, C.S.; Lai, L.L.; Lai, Q.H. Smart Grids and Big Data Analytics for Smart Cities; Springer: Berlin/Heidelberg, Germany, 2020. [Google Scholar]
- Schrotenboer, A.H.; Veenstra, A.A.T.; uit het Broek, M.A.J.; Ursavas, E. A green hydrogen energy system: Optimal control strategies for integrated hydrogen storage and power generation with wind energy. Renew. Sustain. Energy Rev. 2022, 168, 112744. [Google Scholar] [CrossRef]
- Wang, X.; Han, L.; Wang, C.; Yu, H.; Yu, X. A time-scale adaptive dispatching strategy considering the matching of time characteristics and dispatching periods of the integrated energy system. Energy 2022, 267, 126584. [Google Scholar] [CrossRef]
- Yu, L.; Xu, Z.; Guan, X.; Zhao, Q.; Dou, C.; Yue, D. Joint optimization and learning approach for smart operation of hydrogen-based building energy systems. IEEE Trans. Smart Grid 2023, 14, 199–216. [Google Scholar] [CrossRef]
- Wu, T.; Wang, J.; Yue, M. On the integration of hydrogen into integrated energy systems: Modeling, optimal operation, and reliability assessment. IEEE Open Access J. Power Energy 2022, 9, 451–464. [Google Scholar] [CrossRef]
- Li, J.; Lin, J.; Song, Y.; Xing, X.; Fu, C. Operation optimization of power to hydrogen and heat (P2PP) in ADN coordinated with the district heating network. IEEE Trans. Sustain. Energy 2019, 10, 1672–1683. [Google Scholar] [CrossRef]
- Utomo, M.A.; Ugalde-Loo, C.E. Optimal operation of a hydrogen storage and fuel cell coupled integrated energy system. Sustainability 2021, 13, 3525. [Google Scholar] [CrossRef]
- Liu, Z.; Yang, M.; Jia, W.; Ding, T. Low-carbon economic dispatch of integrated electricity-heat-hydrogen systems considering integrated demand response. In Proceedings of the 2022 IEEE/IAS Industrial and Commercial Power System Asia (I&CPS Asia), Shanghai, China, 8–11 July 2022; pp. 1173–1177. [Google Scholar]
- Chen, M.; Shen, Z.; Wang, L.; Zhang, G. Intelligent energy scheduling in renewable integrated microgrid with bidirectional electricity-to-hydrogen conversion. IEEE Trans. Netw. Sci. Eng. 2022, 9, 2212–2223. [Google Scholar] [CrossRef]
- Yan, M.; Li, X.; Lai, L.L.; Xu, F. Energy internet in smart city review. In Proceedings of the 2017 International Conference on Wavelet Analysis and Pattern Recognition (ICWAPR), Ningbo, China, 1 July 2017. [Google Scholar]
- Sun, J.; Peng, Y.; Lu, D.; Chen, X.; Xu, W.; Weng, L.; Wu, J. Optimized configuration and operating plan for hydrogen refueling station with on-site electrolytic production. Energies 2022, 15, 2348. [Google Scholar] [CrossRef]
- Lu, D.; Sun, J.; Peng, Y.; Chen, X. Optimized operation plan for hydrogen refueling station with on-site electrolytic production. Sustainability 2022, 15, 347. [Google Scholar] [CrossRef]
- Hou, H.; Chen, Y.; Liu, P.; Xie, C.; Huang, L.; Zhang, R.; Zhang, Q. Multisource energy storage system optimal dispatch among electricity hydrogen and heat networks from the energy storage operator prospect. IEEE Trans. Ind. Appl. 2022, 58, 2825–2835. [Google Scholar] [CrossRef]
- Suer, J.; Traverso, M.; Jäger, N. Carbon footprint assessment of hydrogen and steel. Energies 2022, 15, 9468. [Google Scholar] [CrossRef]
- The Future of Hydrogen, International Energy Agency 2019. Report Prepared by the IEA for the G20, Japan. Available online: https://www.iea.org/reports/the-future-of-hydrogen (accessed on 8 May 2023).
- Yu, M.; Wang, K.; Vredenburg, H. Insights into low-carbon hydrogen production methods: Green, blue and aqua hydrogen. Int. J. Hydrogen Energy 2021, 46, 41. [Google Scholar] [CrossRef]
- Wulf, C.; Kaltschmitt, M. Life cycle assessment of hydrogen supply chain with special attention on hydrogen refuelling stations. Int. J. Hydrogen Energy 2012, 37, 21. [Google Scholar] [CrossRef]
- Pudukudy, M.; Yaakob, Z.; Mohammad, M.; Narayanan, B.; Sopian, K. Renewable hydrogen economy in Asia—Opportunities and challenges: An overview. Renew. Sustain. Energy Rev. 2014, 30, 743–757. [Google Scholar] [CrossRef]
- Liu, W.; Wan, Y.; Xiong, Y.; Gao, P. Green hydrogen standard in China: Standard and evaluation of low-carbon hydrogen, clean hydrogen, and renewable hydrogen. Int. J. Hydrogen Energy 2022, 47, 24584–24591. [Google Scholar] [CrossRef]
- Li, Z.; Zhang, W.; Zhang, R.; Sun, H. Development of renewable energy multi-energy complementary hydrogen energy system (A Case Study in China): A review. Energy Explor. Exploit. 2020, 38, 2099–2127. [Google Scholar] [CrossRef]
- Yang, H.; Zhou, M.; Wu, Z.; Zhang, M.; Liu, S.; Guo, Z.; Du, E. Exploiting the operational flexibility of a concentrated solar power plant with hydrogen production. Sol. Energy 2022, 247, 158–170. [Google Scholar] [CrossRef]
- Byun, M.; Lee, B.; Lee, H.; Jung, S.; Ji, H.; Lim, H. Techno-economic and environmental assessment of methanol steam reforming for H2 production at various scales. Int. J. Hydrogen Energy 2020, 45, 46. [Google Scholar] [CrossRef]
- Bos, M.J.; Kersten, S.R.A.; Brilman, D.W.F. Wind power to methanol: Renewable methanol production using electricity, electrolysis of water and CO2 air capture. Appl. Energy 2020, 264, 114672. [Google Scholar] [CrossRef]
- Gu, Y.; Wang, D.; Chen, Q.; Tang, Z. Techno-economic analysis of green methanol plant with optimal design of renewable hydrogen production: A case study in China. Int. J. Hydrogen Energy 2022, 48, 8. [Google Scholar] [CrossRef]
- China’s First On-Site Methanol-Based Hydrogen Refueling Station Is Put into Operation, 2023. Dalian, China. Available online: https://m.thepaper.cn/baijiahao_22367609 (accessed on 8 May 2023).
- Ban, M.; Bai, W.; Song, W.; Zhu, L.; Xia, S.; Zhu, Z.; Wu, T. Optimal scheduling for integrated energy-mobility systems based on renewable-to-hydrogen stations and tank truck fleets. IEEE Trans. Ind. Appl. 2022, 58, 2666–2676. [Google Scholar] [CrossRef]
- Dong, W.; Shao, C.; Feng, C.; Zhou, Q.; Bie, Z.; Wang, X. Cooperative operation of power and hydrogen energy systems with HFCV demand response. IEEE Trans. Ind. Appl. 2022, 58, 2630–2639. [Google Scholar] [CrossRef]
- Ding, Z.; Teng, F.; Sarikprueck, P.; Hu, Z. Technical review on advanced approaches for electric vehicle charging demand management part ii: Applications transportation system coordination and infrastructure planning. IEEE Trans. Ind. Appl. 2020, 56, 5695–5703. [Google Scholar] [CrossRef]
- El-Taweel, N.; Khani, H.; Farag, H. Hydrogen storage optimal scheduling for fuel supply and capacity-based demand response program under dynamic hydrogen pricing. IEEE Trans. Smart Grid 2019, 10, 4531–4542. [Google Scholar] [CrossRef]
- Wu, X.; Li, H.; Wang, X.; Zhao, W. Cooperative operation for wind turbines and hydrogen fueling stations with on-site hydrogen production. IEEE Trans. Sustain. Energy 2020, 11, 2775–2789. [Google Scholar] [CrossRef]
- Zhao, B.; Bao, K.; Xu, Z.; Zhang, Y. Optimal sizing for grid-connected PV-and-storage microgrid considering demand response. Proc. CSEE 2015, 35, 5465–5474. [Google Scholar]
- Li, J.; Zhang, J.; Li, C.; Chen, G.; Zhang, H. Participating in grid peak shaving configuration scheme and economic analysis of energy storage system. Trans. China Electrotech. Soc. 2021, 36, 4148–4160. (In Chinese) [Google Scholar]
- Zhou, W. Discussion on economic comparison of hydrogen production by natural gas, methanol and water electrolysis. Nat. Gas Technol. Econ. 2016, 10, 47–49+83. [Google Scholar]
- Hydrogen Refueling Station, China. Available online: https://zhuanlan.zhihu.com/p/459551693 (accessed on 10 May 2023).
- Narada: Shared Energy Storage Mode Helps New Energy Power Consumption 2022, China. Available online: https://www.naradapower.com/news/detail/id/10171.html (accessed on 8 May 2023).
- Zheng, J.; Ma, K.; Zhou, W.; Hu, J.; Gu, C.; Hua, Z. High-pressure gaseous hydrogen storage vessel for hydrogen refueling station. Press. Vessel. Technol. 2018, 35, 35–42+54. (In Chinese) [Google Scholar]


| Equipment | Minimum Capacity | Maximum Capacity |
|---|---|---|
| PV devices (kW) | 0 | 161 |
| BESS (kWh) | 0 | 2000 |
| HPWE (Nm3/h) | 0 | 2000 |
| HPM (Nm3/h) | 0 | 2000 |
| HST (kg) | 0 | 540 |
| Equipment | Cost |
|---|---|
| PV devices (CNY/kW) | 8000 [35] |
| BESS (CNY/kWh) | 5000 [36] |
| HPWE [CNY/(100 Nm3/h)] | 1,410,000 [37] |
| HPM [CNY/(200 Nm3/h)] | 2,116,000 [37] |
| HST (CNY per unit) | 500,000 [38] |
| Basic Electric Load Power Excluding PV, Power Storage and Hydrogen Producing Devices | 30 kW |
|---|---|
| Charging and discharging multiplier of electric energy storage equipment | 0.25 C [39] |
| Pressure level of HST | 45 MPa [40] |
| Equipment service life | 20 years |
| Lower limit of operating power of hydrogen production equipment | 20% of maximum capacity |
| Upper limit of operating power of hydrogen production equipment | 90% of maximum capacity |
| Initial energy storage capacity of energy storage equipment | 10% of maximum capacity |
| Electricity consumption for producing 1 Nm3 hydrogen (kWh) | 5 [37] |
| Methanol consumption for producing 1 Nm3 hydrogen (kg) | 0.72 [37] |
| Index | HPNG | HPM | HPWE | Optimal Results from the Proposed Model |
|---|---|---|---|---|
| PV capacity (kW) | 51 | 51 | 161 | 161 |
| BESS capacity (kWh) | 117 | 117 | 2000 | 258 |
| HPWE capacity (Nm3/h) | 0 | 0 | 900 | 100 |
| HPM capacity (Nm3/h) | 600 | 600 | 0 | 600 |
| HST capacity (kg) | 162 | 162 | 540 | 135 |
| OPEX (CNY/typical day) | 23,070 | 20,875 | 23,031 | 20,279 |
| CAPEX (CNY) | 13,161,000 | 10,341,000 | 33,978,000 | 12,836,000 |
| Total daily cost (CNY) | 24,873 | 22,291 | 27,686 | 22,035 |
| Equivalent hydrogen production cost (CNY/kg) | 25.12 | 22.52 | 27.97 | 22.26 |
| Payback Period(days) | 613 | 437 | 1579 | 529 |
| Methanol Prices (CNY/kg) | The Maximum Capacity of the Equipment | ||||
|---|---|---|---|---|---|
| PV Devices (kW) | BESS (kWh) | HPWE (Nm3/h) | HPM (Nm3/h) | HST (kg) | |
| 1.6 | 44 | 78 | 0 | 600 | 162 |
| 2.1 | 161 | 262 | 100 | 600 | 108 |
| 2.6 | 161 | 258 | 100 | 600 | 135 |
| 3 | 161 | 260 | 100 | 600 | 135 |
| 3.5 | 161 | 2000 | 800 | 200 | 486 |
| 4 | 161 | 2000 | 900 | 100 | 540 |
| 4.5 | 161 | 2000 | 900 | 0 | 540 |
| 6 | 161 | 2000 | 900 | 0 | 540 |
Disclaimer/Publisher’s Note: The statements, opinions and data contained in all publications are solely those of the individual author(s) and contributor(s) and not of MDPI and/or the editor(s). MDPI and/or the editor(s) disclaim responsibility for any injury to people or property resulting from any ideas, methods, instructions or products referred to in the content. |
© 2023 by the authors. Licensee MDPI, Basel, Switzerland. This article is an open access article distributed under the terms and conditions of the Creative Commons Attribution (CC BY) license (https://creativecommons.org/licenses/by/4.0/).
Share and Cite
Yan, M.; Peng, S.-E.; Lai, C.S.; Chen, S.-Z.; Liu, J.; Xu, J.; Xu, F.; Lai, L.L.; Chen, G. Two-Layer Optimization Planning Model for Integrated Energy Systems in Hydrogen Refueling Original Station. Sustainability 2023, 15, 7941. https://doi.org/10.3390/su15107941
Yan M, Peng S-E, Lai CS, Chen S-Z, Liu J, Xu J, Xu F, Lai LL, Chen G. Two-Layer Optimization Planning Model for Integrated Energy Systems in Hydrogen Refueling Original Station. Sustainability. 2023; 15(10):7941. https://doi.org/10.3390/su15107941
Chicago/Turabian StyleYan, Mengxuan, Shen-En Peng, Chun Sing Lai, Si-Zhe Chen, Jing Liu, Junhua Xu, Fangyuan Xu, Loi Lei Lai, and Gang Chen. 2023. "Two-Layer Optimization Planning Model for Integrated Energy Systems in Hydrogen Refueling Original Station" Sustainability 15, no. 10: 7941. https://doi.org/10.3390/su15107941
APA StyleYan, M., Peng, S.-E., Lai, C. S., Chen, S.-Z., Liu, J., Xu, J., Xu, F., Lai, L. L., & Chen, G. (2023). Two-Layer Optimization Planning Model for Integrated Energy Systems in Hydrogen Refueling Original Station. Sustainability, 15(10), 7941. https://doi.org/10.3390/su15107941