Abstract
Urban rail transportation is an important public transportation network for realizing the dual carbon strategy and sustainable transportation development. A top-stream station is an important node in this network. This paper focuses on 47 top-stream station sites during the peak hours of workdays from 2018 to 2020 in Beijing (26 inbound and 22 outbound, with Beijing South Station as a double-stream station) and collects and analyzes information such as station area spatial texture, spatial organization efficiency, land use function, land use mix, POI (Point of Interest) distribution and functional mix, construction intensity, and population heat distribution. Through an analysis of the network topological structure characteristics of each station area, comparison of spatial efficiency differences, analysis of land use function composition and mix characteristics, and distribution of spatial construction intensity, this paper discusses the relationship between the spatial structure, spatial function, spatial intensity characteristics and key indicators of the built environment of station areas from the perspective of urban design. The conclusion shows that there is a close relationship between the function, structure, and strength of the overall built environment of the station domain at the theoretical level. The regression test, to some extent, confirms the close relationship between key indicators and expands the indicator system for measuring the fit relationship. The comparison between general station sites and headstream station sites shows that the fit relationship of indicators for headstream station sites is not completely the same as that for general station sites, indicating that the influencing factors for headstream station sites are diverse. This reminds investment, design, construction, and management teams in practice that the measurement and planning of the built environment space structure of the station domain should be based on local conditions and be closely related to the topological structure of the station domain’s rail network and road network structure. At the same time, whether the stability of the indicator system and the specific R-squared value have differences in various cities requires further verification. This paper explores and tries to raise questions about the research methodology of the built environment space structure, the measurement of the station domain, and the concepts of station-city coordination and development.
1. Introduction
Urban Rail transit is a core component of the public transportation network that helps alleviate transportation problems in large cities and achieve sustainable transportation development. Under the guidance of the station-city integration development concept, in 2018, the Beijing Municipal Government released the “Opinions on Strengthening the Integration of Rail Transit Station and Surrounding Land Use Planning and Construction”, which clearly states that the city should integrate rail transit construction planning, take rail transit stations as regional cores, and develop an urban design based on TOD (Transit-Oriented Development) concept. The “Opinions” emphasize creating urban spatial areas that are fully integrated and interactive with rail transit stations, highly accessible, highly land-intensive, multi-functional, and with a strong sense of place and recognition. According to Beijing’s overall urban plan, comprehensive transportation plan, and actual construction situation, by the end of 2020 Beijing had 24 operating subway lines, including 428 operating stations and 64 transfer stations, with a total mileage of 727 km. Between 2010 and 2020, the subway mileage increased by 499 km, and construction was strong. In 2021, public transportation in Beijing accounted for 60% of the total trips by motorized vehicles, and rail transit accounted for 62% of public transportation trips. In the “Beijing Rail Transit Line Network Plan (2020–2035)” released in December 2021, the target for the total network scale over the next 15 years is about 2673 km.
Along with the new urbanization construction, the new development goals of the “14th Five-Year Plan”, such as transportation power, integration of the four networks, carbon neutralization, and carbon reduction, to achieve the intensive and efficient use of land factors, convenient and efficient transportation, low-carbon energy conservation in environmental governance, and to move towards world-class services, it is necessary to achieve a good development of station-city integration. As the main driving force for the construction of urban clusters and metropolitan areas, mega-cities have absorbed a large number of incoming populations, and the contradictions between the rapidly growing daily travel needs of the population and the capacity of the city’s transportation infrastructure are becoming increasingly prominent. The continuous expansion of urban space and the long-distance commuting of residents to overcome housing costs also put great pressure on the daily transportation load of mega-cities. After experiencing expansion-driven development driven by land factors, the spatial development of Beijing began to gradually shift from quality-enhancing development dominated by transportation factors. Especially in the post-epidemic era, the spatial resilience of rail transit has become increasingly apparent.
In reality, there is a complex relationship between the built environment around a station and the commuting characteristics of the station. The intensity of use of rail transit stations is directly affected by the built environment around the station. The temporal differences between urban rail transit planning, construction, operation, and residents’ commuting need result in temporary low usage efficiency or overloading problems at some stations. Therefore, focusing on the study of the deep-level impact mechanisms of the built environment around the station on the commuting characteristics of urban rail transit has become a key factor in supporting the rational layout of the urban rail transit network, improving the commuting efficiency of rail transit, and further improving residents’ work–life balance. Against this background, focusing on the research of the built environment space around congested stations of urban rail transit networks has significant theoretical value and practical significance.
From 2018 to 2020, there were 47 peak flow stations in Beijing’s rail transit during workdays, with 26 peak flow stations for boarding and 22 for alighting. Among them, Beijing South Station is a double peak flow station. This paper conducts a detailed data collection and examination analysis of the built environment, spatial texture, land use functions, spatial organization efficiency, land use mix, and construction intensity within a core area of 0.5 km radius and a radiation area of 1.25 km radius around each station. It also overlays the hotspot distribution of the commuting population and employment in the city area with peak flow stations. The main dimensions of the analysis include the extraction of network topological structure characteristics of each station, comparison of spatial efficiency differences of the station area, analysis of land use mix characteristics, and analysis of the spatial construction intensity and distribution structure characteristics of the station area. From the perspective of urban design, this paper examines the spatial organization, function, and intensity characteristics of the station area and the interlocking relationship between the key indicators and tries to put forward some thoughts and suggestions on the measurement of the spatial structure of the rail transit station area and the coordinated development of the city.
2. Residential Trip Characteristics and Spatial Distribution Pattern of Peak-Hour Stations
As of the end of 2020, the permanent population of Beijing was 21.89 million, with the population of the central urban area at 10.985 million, which decreased compared with the previous year. The population density gradually decreased from the central urban area to the suburbs. A total of 78% of the population lives within the Sixth Ring Road, and 80% of the jobs are located there. Daily commuting and travel purposes in the central urban areas have changed due to the epidemic. In 2020, the total number of daily trips in the central urban area was 36.19 million, a decrease of 8.5% compared with the previous year. The proportion of green trips in the central urban area was 73.1% in 2020, a decrease of 1% from the previous year. Due to the epidemic, residents are more likely to choose private cars for travel, and the willingness to cycle and walk has increased, while the willingness to use public transportation has decreased. In 2020, green transportation in the central city area was 14.7% for rail transit, a decrease of 1.8% compared with the previous year; 11.7% for public buses (electric), a decrease of 3.6% compared with the previous year; 15.5% for bicycles, an increase of 3.4% compared with the previous year; and 31.2% for walking, an increase of 1% compared with the previous year. According to a 2020 survey of residents’ travel patterns, the main purpose of travel for residents in the central city area was daily life, accounting for 52.6% of all trips, a decrease of 0.3% compared with the previous year. Due to the epidemic, the overall number of trips decreased significantly, and daily life trips significantly decreased compared to commuting trips, with fewer trips and an increase in online activities. Among daily life trips, leisure and fitness trips decreased the most by 4.3% compared with the previous year, and shopping trips decreased by 2.4% compared with the previous year. In terms of travel time, residents’ trips were mainly concentrated during the morning and evening peak periods, with the number of trips during this period accounting for 44.7% of the total daily trips.
Due to the impact of the epidemic, in 2020, the city’s passenger transport carried a total of 5.26 billion passenger trips, a decrease of 37.4% compared with the previous year. Among them, the highest proportion of passenger transport was reached by rail transit with 2.294 billion passenger trips, accounting for 43.6%. Bicycle passenger transport increased compared with 2019, with passenger volume reaching 730 million passenger trips, an increase of 35.2% compared with the previous year, and a proportion of 13.9% of the total city passenger transport. Suburban rail, public (electric) buses (including suburban passenger transport), and taxi passenger transport all declined compared to the previous year, with passenger volume reaching 10 million passenger trips, 20.6 billion passenger trips, and 174 million passenger trips, respectively, accounting for 0.02%, 39.2%, and 3.3% of the total city passenger transport volume.
By comparing the spatial distribution patterns (Figure 1) of the morning peak flow stations over the past three years, including the changes in flow sorting and the individual rotated peak flow stations, we found that the overall spatial distribution pattern of the morning peak flow stations has been relatively stable over the past three years. The inbound peak flow stations are located in the periphery, whereas the outbound peak flow stations are in the core area. The top 20 inbound stations have been slightly adjusted every year for the past three years. With the gradual improvement of new lines and stations and the impact of the epidemic, the flow changes have caused changes in the station ranking, and some stations have been replaced by new high-flow stations, such as in 2019, Zhu Xinzhuang, Tongzhou Beiguan, and Jiaomen West replaced Apple Park, Haidian Wuluj and Changying that were in the top 20 stations in 2018. In 2020, Changyang, Gucheng, and Jin’anqiao stations replaced Tuqiao, Jiaomen West, and Babaoshan in 2019 as the new inbound morning peak stations. The outbound stations are generally located in the city’s core area. In 2018 and 2019, with the exception of a few stations with different rankings, the top 20 stations were generally stable. In 2020, Xitucheng and Wangjing East replaced Beijing South Station and Beijing West Station to become part of the top 20 stations of that year. The reason why Beijing South Station and Beijing West Station dropped out of the top 20 flow stations in 2020 is closely related to the strict control of Beijing during the 2020 epidemic. To effectively control the epidemic in 2020, Beijing maintained control over incoming and outgoing transportation and faced a significant decrease in foreign passenger traffic, reaching 133 million people, a decrease of 57.5% year-on-year. Among them, the passenger volume of the railway was 63.83 million, a decrease of 56.7% compared with 2019; thus, the decline in passenger flow at these two railway passenger stations directly affected the ranking of Beijing South and Beijing West as top-flow stations. Overall, in the past three years, fifteen stations (Beijing South, Songjiazhuang, Shilihe, Tiantongyuan North, Tiantongyuan, Huoying, Shahe, Lishuiqiao, Huilongguan, Longze, Material Institute Road, Xingong, Caofang, Huilongguan East Street, and Beiyun River West) have maintained stability as top-flow inbound stations, while 18 stations (Xierqi, Dongzhimen, Dawang Road, Guomao, Chaoyangmen, Xizhimen, Xidan, Sanyuanqiao, Haidian Huangzhuang, Jiangtai, Dongdaqiao, Liangmaqiao, Fuchengmen, Dongdan, Suzhou Street, Jintai Xizhao, Fuxingmen, and Fengtai Science and Technology Park) have maintained stability as top-flow outbound stations.
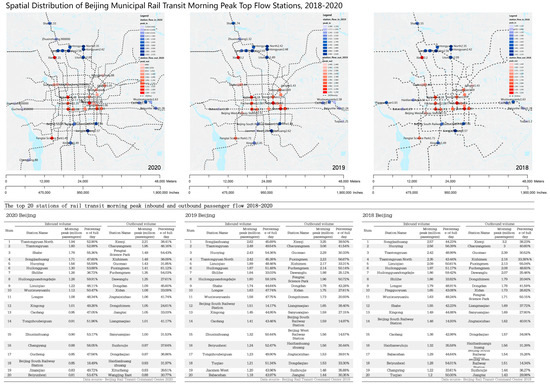
Figure 1.
Spatial distribution and passenger flow statistics of the top-flow stations during the morning peak on the Beijing municipal rail transit system, 2018–2020.
As the expansion and improvement of the rail network continues, stations outside the fourth ring road of the city are extending and expanding, and as a result, the top 20 stations for the morning peak entrance have been constantly adjusted over the past three years. Due to the impact of the epidemic, the flow and ranking pattern of new station sites have also changed. In comparison, the exit stations, located in the city center, are relatively stable due to their well-developed station network system. In Beijing, the rail transit development follows the pattern of developing the city first and then the station, which is particularly prominent in the city center. The peak flow exit stations in 2018 and 2019 were similar, and although the overall flow declined after the epidemic in 2020, the overall number of trips remained high.
Even under the influence of the epidemic, the mode of travel, the proportion, and the spatial distribution pattern of the early morning peak station in the rail transit have not been broken, on the one hand, due to the strong epidemic prevention and control measures, and on the other hand, it also shows that with the further improvement of future urban development and rail transit planning, rail transit will play a more important role in the travel of city residents.
3. Status and Progress of Research on Station Domain Built Environment Space
With the rapid development of China’s urban rail transportation, the concept of integrating stations and cities has become a new idea for the coordinated development of urban rail transportation and cities. In addition to fulfilling basic passenger transportation functions, urban railway stations are expected to create more space and social value. During the rapid development of urbanization, the construction of urban railway station space has resulted in a series of problems, such as the mismatch between the operating efficiency of the rail network structure and the urban development pattern, the spatial and temporal mismatches between the station and its surrounding space, the mismatch of functions, the lack of planning, and the separation of construction interests. The existing research has explored related aspects based on the intensity, composition, and mix of station spatial functions and accessibility.
From the perspective of station area spatial intensity, studies have shown that high-intensity land development patterns can reduce private car ownership and long-distance travel, while increasing the occupancy rate of public transportation, and have a significant impact on improving the passenger flow of rail transit [1]. As early as 1995, a follow-up study of more than 260 light rail stations in North America showed that under the premise of controlling variables, population density increased passenger flow by 6% for every 10% increase in population density [2]. Cervero R conducted a regression on the population density and passenger flow within a 1.6 km range of the Bay Area Rail Station and found that with a density of 10 households per acre, there was a 24.3% boarding rate; with a density of 20 households per acre, the boarding rate would increase to 43.4%; and with a density of 40 households per acre, the boarding rate would reach 66.6% [1]. At the same time, studies have also shown that living in the station area did not significantly increase the use of public transportation for employment [3] and that employment density has a greater impact on light rail passenger flow when employment is closer to the station than residential density [4]. Scholars have also studied the in-and-out passenger flow of the morning peak station, and the results showed that during the morning peak, for every 10% increase in commercial and administrative office areas around the station area, the outbound passenger flow increased by 6%, and for every 10% increase in population density, the inbound passenger flow increased by 7.4%, showing the impact of different intensities of land use on passenger flow at different times [5].
From the perspective of the composition and mix of station area space functions, studies have shown that the mixed use of land can enhance non-motorized travel [1], improve station passenger flow, and reduce the use of motor vehicles. Compared to density, its impact on passenger flow is small. The distribution of residential and employment spaces is the main factor affecting passenger flow at peak stations in the morning and evening. The passenger flow intensity during the peak period, location distribution, land configuration, and the spatial position of the station are related [6]. However, Cervero R et al. pointed out that the mixed use of land has a significant impact on the characteristics of passenger flow; high mixed use balances different time and space transportation demands and reduces the gap between peak and off-peak passenger flow [1]. Some studies also indicate that the mixed degree of land is unclear in its impact on urban rail transportation, and research argues that the impact of land mixed use on passenger flow is not statistically significant. Compared to the mixed use of commercial office functions, the combination of residential and non-residential is more capable of enhancing rail transportation volume, and the development and operation measures of station area spaces such as “land mixed use floor area ratio rewards” can be strengthened [7].
From the perspective of station area accessibility, most studies focus on two major aspects. On the one hand, the number of opportunities to reach a station with reasonable time and money expenditure [8], including walking accessibility, other modes of transportation connection, and internal transfer. Accessibility is considered an important factor affecting passenger flow in urban rail transit. Most scholars measure the quality of walking accessibility by measuring the density of crossroads, dead-end roads, and the number of roads guided by cars [9]. Research shows that the probability of taking rail transit for residents around station areas is 2–5 times higher than in other areas [10]. Crowley’s research suggests that a friendly walking environment has a significant impact on improving the utilization of rail transit [11]. Some studies also show that the demand for bicycles around station areas during the morning and evening peaks is far higher than the supply [12]. However, the high land prices around station areas make it difficult to provide large-scale parking facilities. With the rise of shared bicycles, bicycles also cause congestion problems while improving the accessibility of subway stations [13]. Compared with some high-density Asian cities, branch bus routes, park-and-ride facilities, transfer stations, terminal stations, and high-efficiency connections with urban rail transit play a significant role in enhancing passenger traffic intensity [9,14]. On the other hand, starting from the spatial composition features of the site itself, accessibility is quantitatively evaluated based on the topological connection of the subway network and the composition features of the ground road network. Alain Chiaradia conducted a station-city spatial analysis based on the daily average passenger flow data (entry and exit) and swipe data of each station of the London subway published on the UK government website [7,15]. The research results showed that the integration model of subway and ground roads, compared with the separate modeling of subway lines and ground roads, is better at predicting passenger flow, which was confirmed in the research results of Beijing, Tianjin, and Chongqing. The application of the analysis model was also expanded to the quantification analysis of cross-sectional flow data, thus predicting the use efficiency of the new subway line [16,17]. In the case of Shanghai, the use of the axis model to analyze the passenger flow of each subway station found that the topological selection based on the subway network has a good explanatory effect [18,19]. The spatial syntax natural movement theory states that the topological spatial structure can affect the functional distribution and traffic flow of the destination [20,21].
In recent years, complex network science, artificial intelligence, machine learning, and deep learning techniques derived from machine learning have been widely applied to urban problem research. Statistical algorithms, such as Gradient Boosting Decision Trees (GBDT), can be used to analyze the nonlinear effects between independent and dependent variables. There are studies that analyze the nonlinear mechanisms of the effects of station area facilities, built environment, economic attributes, and other factors on passenger flow and travel time through the GBDT [22]. However, based on the research in several cities, there is no unified conclusion, and even the conclusions in different cities are completely opposite.
Most existing studies focus on the relationship between spatial structure and passenger volume [23,24,25,26,27,28], and few studies involve incorporating metrics of spatial development capacity and spatial use mix into the measurement system associated with spatial structure. Research on the impact of preset planning indicators on rail transit needs further expansion, such as the relationship between station site floor area ratio, mix and spatial structure interaction, etc. [29,30,31]. Therefore, expanding the study of the structure, function, and intensity of the built environment in station areas will help reveal the spatial interaction patterns of the three dimensions of station area space and provide decision-making support for improving the quality of the built environment and designing routes [32,33,34,35,36,37], which is of great significance.
Measurement in mathematics refers to the assignment of numerical values to some subsets of a given set, which can represent the size, volume, probability, etc. Its traditional integration is expanded at an interval and then generalized to any set. The concept of measurement plays an important role in mathematical analysis and probability theory.
In this paper, “Station Area Built Environment Spatial Structure Measurement” refers to the establishment of a set of key indicators and measurement methods based on three dimensions of function, structure, and intensity for the station area built environment (Figure 2). The research focuses on 47 top-flow station sites during the Beijing 2018–2020 rush hour (26 inbound and 22 outbound, with Beijing South Station being a dual top-flow station). The station area attributes of spatial texture, spatial structure efficiency, land use function, land use mix, POI distribution and functional mix, construction intensity, and population heat distribution are compiled into a station area attribute atlas database (Figure 3). The focus is on the characteristics of the early peak top-flow station sites in terms of spatial structure, spatial function, and spatial intensity, and the key indicators are used to describe the phenomenon, find relationships, and attempt to reveal the fitting characteristics of key indicators.
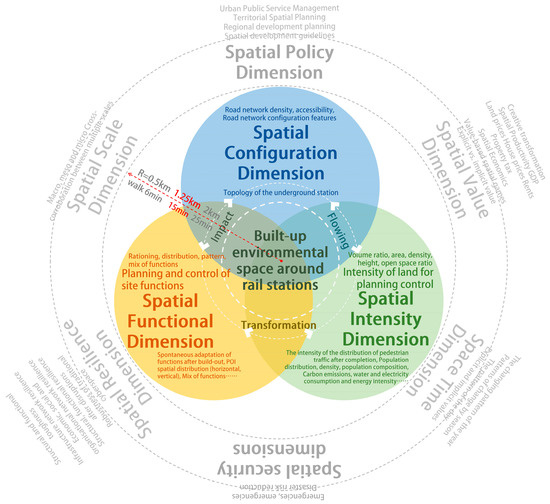
Figure 2.
Multiple dimensions for measuring the spatial structure of the built environment in the station area.
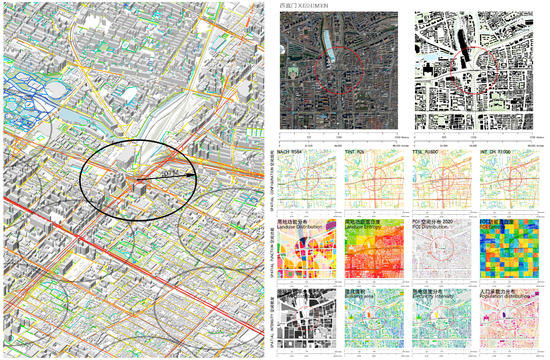
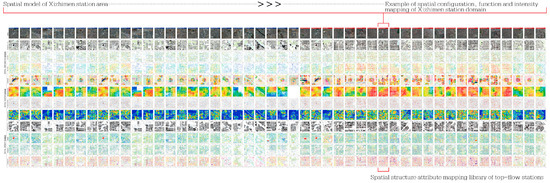
Figure 3.
Spatial structure attribute mapping library of top-flow stations.
4. Configuration Characteristics of Complex Network Structure in Station Areas
4.1. Discrete Divergence Characteristics of the Network Topology of Top-Flow Sites
The underground rail network formed by the station sites of Beijing’s current rail transit system is a typical network structure. Through the analysis of the global integration and choice distribution of over 330 stations, it can be seen that the overall distribution is non-uniform. Stations with high levels of global integration and choice include Xizhimen, Chegongzhuang, Chaoyangmen, Baishiqiao South, Liuliqiao, Military Museum, Qilizhuang, Gongzhufen, Dawanglu, Guloudajie, etc. Stations with medium levels of global integration and choice mainly include Fentaidongdajie, Baidui, Jishuitan, Fentai Technology Park, Ciqikou, Dongzhimen, Chongyang, Shangdi, Beihai North, Beida Dongmen, Liangxiang University City North, Xiyuan, Zoo, Suzhou, Caofang, Changchun Street, etc. Stations with low levels of global integration and choice mainly include Tongzhoubeiguan, Shahe, Dongdan, Beiyunhe West, Hepinglibeijie, Fangshanchengguan, Yanshan, Ciqu, Demao, Dengshikou, etc.
If these 47 peak-hour top-flow stations are highlighted (Figure 4), it can be seen that their discrete distributions can cover most of the values of the global topological selectivity and integration, and there is a clear differentiation effect. The top-flow outflow stations are more concentrated in the distribution of topological global integration than the top-flow inflow stations and occupy a high-value range, and the distribution of topological global selectivity covers a wider range. Inflow stations are more aggregated, with most of the topological global selectivity and integration being lower than that of the outflow stations region. This feature is formed by the structure of the rail station network itself. As the station expands and the rail lines gradually become denser, this topological index will change.
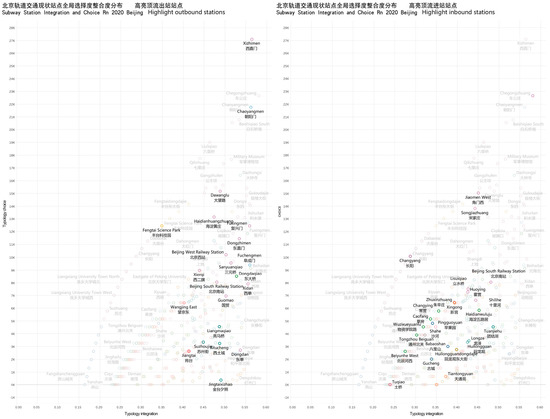
Figure 4.
Typology integration/choice of top-flow stations.
4.2. Aggregation Effect of Spatial Efficiency on Station Areas
Under the segment analysis of spatial configuration theory, there is consensus in research that regions with high composite accessibility have higher vitality. The composite accessibility at different scale ranges has become an evaluation index for evaluating the spatial pattern supporting vitality in a built-up area. In the adopted radii, Nach Rn and Nach R1000 are used to evaluate the global and local accessibility of a station, respectively (Figure 5). Overall, the distribution of all stations falls between local spatial efficiency of 0.67–1.14 and global spatial efficiency of 0.595–1.10. If the peak flow stations are highlighted (red points are inbound peak flow stations and black points are outbound peak flow stations), the global efficiency median line (0.851) and local efficiency median line (0.91) of the peak flow stations divide into four quadrants. Most of the peak flow stations are relatively concentrated in the middle area of the median line cross, with high local and global efficiency in the station space such as Dongxiaoyuan, Tian Tongyuan North, Tongzhou North Guan, Fuxingmen, Xidan, Xizhimen, Dawang Road, and Pingguoyuan; and with low local and global efficiency in the station space such as Jiaomen West, Longze, Huoying, Hulongguan East Main Street, Shahe, Haidian Wuluju, Xierqi, and Suzhou Street.
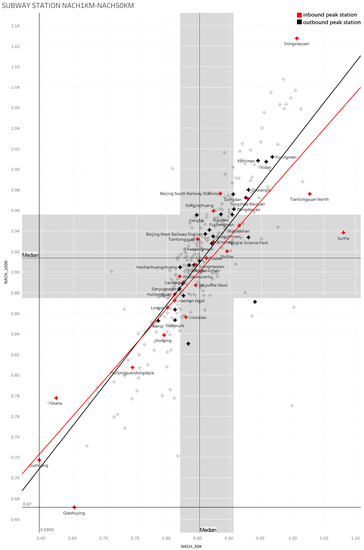
Figure 5.
NACH R 1 km–50 km of top-flow stations.
4.3. Station Domain under the Dual Influence of Spatial Topology and Spatial Efficiency
The site spatial topology can be described using global integration (HH) and global choice (CHOICE), whereas the site domain space accessibility can be described using global spatial efficiency (NACH R 50 km) and local spatial efficiency (NACH R 1 km). The combination of these results is shown in four descriptive dimensions (Figure 6).
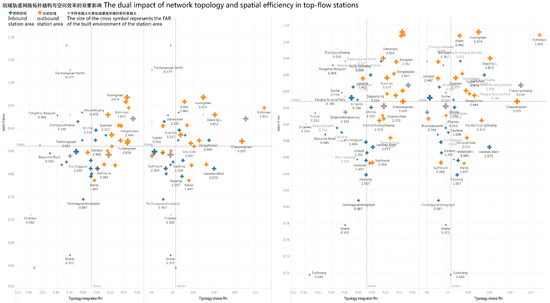
Figure 6.
The dual impact of network topology and spatial efficiency in top-flow stations.
Dimension 1: The horizontal axis represents global integration (HH), and the vertical axis represents global space efficiency (NACH R 50 km). This can be understood from the macroscopic view of the distribution pattern of the site domain space. Four quadrants are generated by dividing the median of the global space efficiency (0.8513) and the global integration (HH) (0.4251) of the top-flow sites. The site domain spaces with high global efficiency and global integration are represented by areas such as Fuxingmen, Xidan, Xizhimen, Dawanglu, Dongdaqiao, Dongdan, Shilihe, Beijing South Station, Songjiazhuang, Guomao, Dongzhimen, Chaoyangmen, Fuchengmen, Beijing West Station, etc. The site domain spaces with low global efficiency and global integration are represented by areas such as Tiantongyuan, Caofang, Wuzixueyuan Road, Hualongguandongdajie, and Shahe.
Dimension 2: The x-axis represents global choice (CHOICE), and the y-axis represents global spatial efficiency (NACH R 50 km), which can be understood as a combination of a site’s topological choice and the global choice of the ground station domain. Divided into four quadrants by the median line of global spatial efficiency (0.8513) and global choice (CHOICE) (5794) of the top-flow station, the station domains with high global efficiency (NACH) and high global choice (CHOICE) are Xidan, Dama Road, West Straight Gate, Fengtai Science Park, Dongdaqiao, Chaoyangmen, Guomao, Dongzhimen, Fuchengmen, Beijing West Station, Shilihe, Beijing South Station, Xingong, Songjiazhuang, Zhuxinzhuang, and Changyang. The station domains with low global efficiency (NACH) and low global choice (CHOICE) are Liangmaqiao, Jiangtai, Beiyunhe West, Tiantongyuan, Jintai Xizhao, Caofang, Wuzi University Road, Huilongguan, Suzhou Street, Longze, Huilongguan East Street, and Shahe. Jiangtai and Beiyunhe West have similar structural characteristics, but Jiangtai’s construction intensity (FAR = 2.442) is higher than that of Beiyunhe West (FAR = 0.545). Huilongguan and Suzhou Street have similar structural characteristics, but Huilongguan’s construction intensity (FAR = 1.694) is lower than that of Suzhou Street (FAR = 2.264). This prompts us to consider another question from another perspective: what kind of construction intensity and structure is suitable?
Dimension Three: The x-axis represents the global integration (HH), and the y-axis represents the local spatial efficiency (NACH R 1 km), which can be understood as a combination of a site’s topological integration degree and the local selectivity of the ground station domain. The four quadrants are divided based on the median local space efficiency (0.9203) of the top-flow station and the median global integration degree (0.4251). The station domains with high local efficiency (NACH) and global integration degree (HH) include Fuxingmen, Xizhimen, Xidan, Dawang Road, Dongdan, Dongdaqiao, Guomao, Fuchengmen, Beijing West Station, Dongzhimen, Chaoyangmen, Beijing South Station, and Songjiazhuang. Station domains with low local efficiency (NACH) and global integration degree (HH) include Tuqiao, Wuzixueyuan Road, Caofang, Beiyunhe West, Zhujinzhuang, Huilongguan East Great Street, and Shahe.
Dimension Four: The x-axis is the global choice (CHOICE), and the y-axis is the local spatial efficiency (NACH R 1 km), which can be understood as a comprehensive consideration of the topological selectivity of a station and the local selectivity of the ground station area. The local spatial efficiency median line (0.9203) and the global choice (CHOICE) median line (5796) are divided into four quadrants. The station areas with high local efficiency (NACH) and high global choice (CHOICE) include Xizhimen, Fuxingmen, Xidan, Dawang Road, Dongdaqiao, Guomao, Fuchengmen, Beijing West Station, Dongzhimen, Fengtai Science Park, Chaoyangmen, Beijing South Station, and Songjiazhuang. The station areas with low local efficiency (NACH) and low global selectivity (CHOICE) include Liangmaqiao, Jintai Xizhao, Suzhou Street, Tuqiao, Wuzi University Road, Beiyunhe West, Caofang, Huilongguan, Longze, Huilongguan East Street, and Shahe.
Based on the analysis of these four dimensions, the stations that often appear in the “high-high” dimension are Xidan, Xizhimen, Dawang Road, Dongdaqiao, Dongdan, Shilihe, Beijing South Station, Songjiazhuang, Guomao, Dongzhimen, Chaoyangmen, Fuchengmen, and Beijing West Station; the stations that often appear in the “low-low” dimension are Caofang, Materials Institute Road, Huilongguan East Avenue, and Shahe.
We see that this dual structure of above-ground and underground has an impact on the station area space. In addition to bringing in passenger flow, it is more important to provide structural support to the station area space, similar to the collective impact of multiple networks on space. In the second-dimension analysis, we found that some station area space structures are similar, but there is a difference in the overall construction strength of the station area. This prompts us to think about another question: is there a fitting relationship between construction strength and structure? What kind of construction strength and structure match in further detail? These will be expanded in the following sections.
5. Distribution, Composition, and Mixing of Station Domain Spatial Functions and Their Fitting to the Spatial Configuration
5.1. Macroscopic Perspective on the Trend of Station Domain Function Distribution
To describe the spatial functionality of station domains, it is necessary to consider the relationship between functional distribution and spatial scale. In other words, the resolution and emphasis on functionality vary at different spatial scales. This study uses three different scales to describe the functional characteristics of the built environment of station domains: the macro scale of 40 km × 40 km to describe the overall functional distribution covering all peak flow stations (Figure 7); the meso scale of R = 1250 m to describe the functional distribution within a 15 min walking radius (as shown in the spatial function sub-items in Figure 3, station domain attribute chart); and the micro scale of R = 500 m to describe the land use function distribution within a 6 min walking radius centered on each station (Figure 8a). Moreover, we employ intuitive classification and land use mix calculations to describe the mixing situation at all scales, taking into account the differences between different scales.
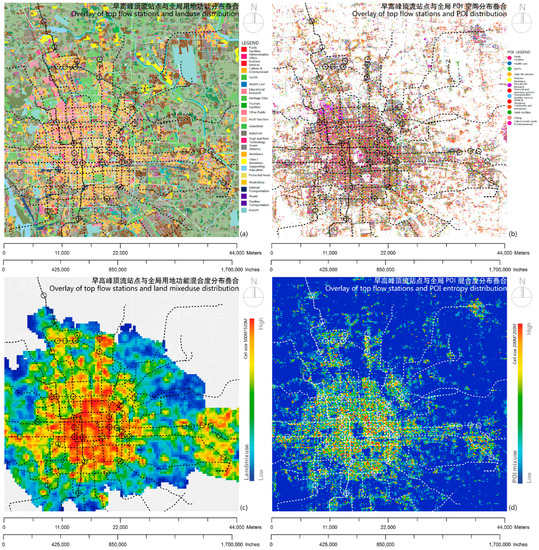
Figure 7.
Macro-spatial distribution of top-flow sites under the functionality and mixiness context.
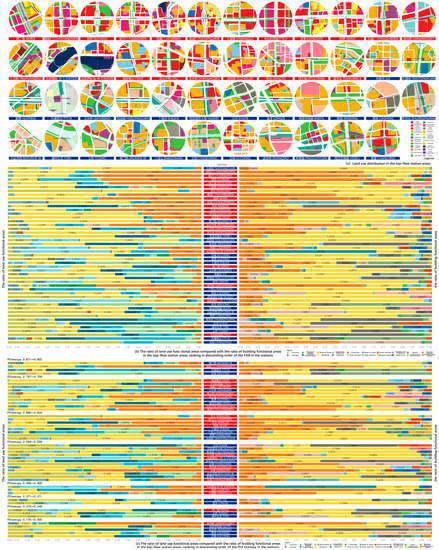
Figure 8.
(a) Land use distribution in the top-flow station areas. (b) The ratio of land use functional areas compared with the ratio of building functional areas in the top-flow station areas: ranking in descending order of the FAR in the stations. (c) The ratio of land use functional areas compared with the ratio of building functional areas in the top-flow station areas: ranking in descending order of the POI entropy in the stations.
For the study of the land use type mixture degree in the station domain space, the study adopts the calculation method of information entropy to calculate the mixture degree of land use. The formula is as follows:
K represents the number of land use types in space i; Pk,i represents the proportion of the area of the kth type of land in space i; and the “landmixuse” value indicates the mix of land use types in a certain space and ranges from zero to one. The value closer to 0 indicates that the land use in the space is less mixed and the allocation of land is more single, while the value closer to one indicates that the land use in the space is more mixed and the allocation of functions is more balanced. This can also be used to calculate the mix of POIs.
In previous research on urban spaces, the degree of mixing is closely related to the vitality of the space. The functional mix can be understood as the weighted average of the functions in a unit area of land use. The POI mix is represented as a two-dimensional diagram, but in reality, it represents a mix of functions in a three-dimensional space projected onto a two-dimensional space. The calculation unit used in this paper is 200 m × 200 m precision, and compared to the description of planning land use functions, the POI mix expresses a more realistic mix of functions.
As shown in the macro spatial distribution map of the peak flow stations during the early peak period under the background of function and mix degree (Figure 7), the study adopts the macro spatial distribution display of the peak flow stations during the early peak period under different spatial feature analysis backgrounds: (a) represents the distribution of the peak flow stations in the background of the land use function; (b) represents the distribution of the peak flow stations in the background of the POI function; (c) represents the distribution of the peak flow stations in the background of the land use function mix degree; (d) represents the distribution of the peak flow stations in the background of the POI function mix degree.
Macroscopically, the relationship between the stations and the distribution of functional land and POI spaces in Figure 7a,b is not obvious, and it appears as an overlapping state in a mixed state. If this not-so-obvious distribution feature is transformed into a description of the overlap state under a mix degree, it will be much more intuitive, as shown in Figure 7c,d.
We found that most of these top-down flow sites are located in areas where land use is relatively mixed and POI is relatively mixed. If we simply compare the background of Figure 7c,d, one represents the global land use mix, and the other represents the global POI mix. However, due to the difference in the calculation of sample grain 500 m × 500 m and 200 m × 200 m, macroscopically, it can be understood that Figure 7d is a finer description of Figure 7c, but the distribution of the mixing hot spots shows local differences. We see that the central city’s land use function mix shows a high degree of mixing within the third ring, and the parts outside the third ring show a cluster mixing state, which is basically in line with our daily city experiences and feelings. In the process of calculating the mixing degree, the scale of land use grain is clearly larger than that of the POI. In the calculation of land use function mixing, our sample unit is cell 500 m × 500 m. For the calculation of POI spatial mixing, this paper is based on 62,000 functional points from 13 major categories, so in order to show the high resolution of POI grains, the POI mixing degree calculation sample unit we adopted is cell 200 m × 200 m. After reducing the scale of the sample unit, it can be understood macroscopically as further refining the functional mixing, but at the intermediate scale, the land use function mixing and POI function mixing are not completely consistent. From Figure 3, we find that each site has a difference between land use mixing and POI mixing. In theory, it seems that POI mixing should be a further high-precision analysis of land use mixing and should be basically in line with the trend of hot and cold shown by land use function mixing. However, after the calculation is completed, we find that, as shown in the spatial functional module of Figure 3, within the 15 min life cycle centered on the station, the center of land use function mixing and the center of POI mixing will deviate, especially at the top-down flow outflow station, which is more obvious.
5.2. Functional Distribution and Proportional Land Use and Built-Up Area around the Station Area
At the scale of the daily life circle, we compared and observed 47 sites. Regardless of whether it is a land use function mix or a POI function mix, the overall mix degree of the outbound station domain is higher than that of the inbound station domain. After comparing the land use function mix and POI function mix within the station domain itself, we found that, overall, each station has similarities between the two, but the POI function mix is not a direct translation and refinement of the sampling unit of the land use function mix. On the contrary, the core distribution of the POI function mix in the station domain sometimes does not completely correspond to the center of the land use function mix.
So, how can we understand this difference? We can think about the differences in the source of these two types of functional representations. The land use function mix comes from upper planning, while the POI function mix comes from the functional space self-organization under the influence of existing regulations and market laws. This difference can be initially explained as a “top-down policy (upper planning) and bottom-up countermeasures (functional self-organization)” during the functional space distribution process. These re-functionalized POIs actually rely on existing physical buildings, which makes it necessary to explore the land use function presets in upper planning and the related types of built buildings. A large number of existing studies will explore the land use planning layout around the station site, and use the proportion of functional land use as a classification of station types, such as residential, office, commercial and service, hub, mixed, undeveloped, etc. Due to the impact of the floor area ratio, there will be a difference between the proportion of functional land use in the station domain and the proportion of functional building built, so the proportion of functional building area can truly reflect the proportion of functional area in the station domain. The spatial distribution of a POI is occupied by the functional space of these entities. We initially considered the station as the core at a micro scale with a 500 m radius and examined the proportion of land use functional area and the built-up area in the station domain.
As shown in Figure 8a in the 500 m range of the peak flow station in the early morning, we can see that the land blocks in the station area of the peak flow are more fragmented than those in the station area of the peak flow, and there are more commercial service properties. The station area of the peak flow contains a significant proportion of residential land. If the construction volume rate of the peak flow station area is arranged in descending order of height (as shown in Figure 8b), the overall construction volume rate of the peak flow station area is higher than that of the station area. As the construction intensity gradually decreases, the station area gradually accounts for the majority; whether it is the land area or built-up area, the commercial service functional area gradually decreases, and the residential functional area occupies a high proportion. In some sites, such as Wuzi University Road and Changying Station, residential functions have absolute dominant advantages. Comparing the station area land function area ratio and building function area ratio, there is a very intuitive finding that, generally speaking, in the building function area ratio, the residential function area accounts for absolute dominance, while in the land function area ratio chart, this absolute advantage is not so obvious. From another aspect, this illustrates that simply examining the station area land function area ratio is effective and has become a paradigm in a large number of studies, but if the station area construction volume rate is taken into consideration, it is likely to change our understanding of the functional area ratio pattern of the station area, relying on this volume rate index. The functional proportion ratio established is volume-based, which is the premise for the distribution of POI.
Additionally, when we re-sort the hidden ranking of the top-flow stations according to the POI mix degree of the station domain from high to low (Figure 8c), the previously obvious patterns, such as the gradual decrease in business and service functional areas, become not so easily noticeable, and the number of top-flow stations in different mix degree sections is also inconsistent. There are four top-flow stations with POI-entropy between 0.871 and 0.802, which are Jiaomen West, Chaoyangmen, Tiantongyuan North, and Xingong, among which only Chaoyangmen is a top-flow outbound station, whereas the others are top-flow inbound stations. There are ten top-flow stations with POI entropy between 0.797 and 0.709, of which seven are outbound stations and three are inbound stations. There are eight top-flow stations with POI entropy between 0.686 and 0.604, with four outbound and four inbound stations. There are twelve top-flow stations with POI entropy between 0.594 and 0.509, of which five are outbound stations and seven are inbound stations. There are three top-flow stations with POI entropy between 0.498 and 0.405, all of which are outbound stations. There are ten top-flow stations with POI entropy between 0.371 and 0.000, of which two are outbound stations and eight are inbound stations. The combination pattern of land and building functional areas in different mix degrees of station domains is not obvious, which can be understood as a land and building functional area proportion pattern that supports this mix degree.
5.3. Fitting Trend of the Correlation between POI Entropy and Each Index of Spatial Configuration
In the previous section, we mentioned the representation of the differences in a mixture, and we also conducted a preliminary analysis of the cause of these differences. However, in the end, what is the relationship between the functional mixture of POIs and the spatial structure? Is it possible to find a universally representative fit that can prove that the spatial structure affects the distribution of POIs to some extent? Following this idea, we selected a series of structural indicators and a mixture for regression fitting.
There are a total of 47 top-flow stations in this paper. In order to obtain more universal regression results and compare them with the regression trend of top-flow stations in the experiment of fitting the mixture degree and spatial structure, this paper extracted the mixture degree and spatial structure indicators of all station domains for regression fitting. The spatial structure indicators are divided into three categories: one is road network density (TTSL_R 1.6 km); one is station topology structure, including the global integration (HH) and global choice (CHOICE) of the urban rail network topology; one is ground structure indicators, including station domain road network integration (TINT_R 2 km), station domain road network global depth (TTD_R 5 km), station domain road network spatial influence (INT_CHR 1 km), station domain road network CHOICE (TCH_R1600 and TCH_L500 Segment Length 0.5 km as weight), station domain global spatial efficiency (NACH_50 km), and station domain local spatial efficiency (NACH_1000 m).
As shown in Figure 9a, in the correlation detection of all station domain group structure indicators and functional mixing degree, all regression analysis p-values are less than 0.001, and all ten indicators of the three categories passed the significance test, indicating that there is a significant correlation between these spatial group structure indicators and POI functional mixing degree. The highest R-square value is 0.301, which is the fit between the POI mixing degree and TTSL_R1600 and can be roughly understood as a close relationship between the POI functional mixing degree and road network density. The second highest correlation R-square value is 0.296, which is TINT_R2K, i.e., the integration degree within a radius of two kilometers. The third highest correlation R-square value is 0.279, which is HH, i.e., the global integration degree of the rail network topology. The first of the three relatively high fit indicators corresponds to the fragmentation of the land blocks within the station domain, the second corresponds to the spatial accessibility of the station domain location, and the third corresponds to the centrality feature of the station site itself in the network. Additionally, the R-square value between the mixing degree and the construction intensity FAR of the station site is 0.247, which also passed the significance test. In conclusion, the mixing degree is closely related to the fragmentation of the station domain landform, spatial accessibility and topological centrality of the location, and the construction intensity of the station domain.
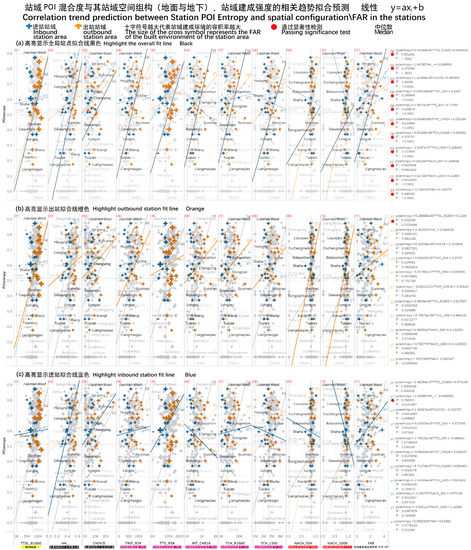
Figure 9.
Correlation trend prediction between station POI entropy and spatial configuration\FAR in the stations.
Additionally, by highlighting the top-flow stations and fitting the POI mixture and spatial structure indices separately for the top-flow station domain, it was found that for the top outbound station domain (Figure 9b), only TTSL_R1600 passed the significance test (p-value less than 0.05); for the top inbound station domain (Figure 9c), only the global integration (HH) of the rail network topology passed the significance test (p-value less than 0.05). Therefore, from another perspective, this global fitting trend is not completely synchronized with the fitting trend of top-flow stations, and there is a significant difference.
Based on this fitting trend of the POI mixture and spatial structure indices for the top-flow station domain, the study further expanded the regression fitting of the relationship between the global construction intensity and spatial structure, and a preliminary comparison showed that the fitting trend of “intensity-structure” for the global station domain is different from the fitting trend of “mixture-structure,” which also shows to some extent that the potential factors affecting the real functional distribution are not only the spatial structure but intensity also has an impact. The following section will further discuss the potential connection between intensity and structure.
6. Multi-Sense, Mutual Representation of Station Domain Spatial Intensity and Its Fitting to Spatial Configuration
The connection between structure and function was described above. In addition to function, the station domain spatial intensity, as an important representation of the station domain built environment, represents the capacity of space to a certain extent. The following discussion mainly focuses on the multiple meanings of station domain spatial intensity, the mutual representations of spatial intensity, and the fitting of station domain spatial intensity with spatial structure.
6.1. Multiplicity and Mutual Representation of Spatial Intensity of Station Areas
Spatial intensity is a very intuitive indicator. From the time dimension, the intensity indicator is closely related to the construction and operation cycles, and there are differences between high and low frequency and long and short cycles. For example, the floor area ratio is a typical intensity indicator, and it is clearly specified at the very beginning of development; from the type of dimension, intensity can be divided into construction intensity, pedestrian flow intensity, energy intensity, value intensity, employment intensity, and even innovation intensity. For example, the most commonly used intensity indicators in the planning and construction stages are floor area ratio, density, height, green area ratio, etc., most of which are restrictive indicators and are subject to the preset of the urban master plan, local district regulations, and urban design guidelines. These are a type of restrictive and guiding intensity indicators that come from top-level design. The intensity of space usage is also reflected in the operational stage, such as low-frequency intensity changes, such as the age of the built environment, and the life span of the surrounding building; and high-frequency intensity changes, such as the recognition and highlighting of human dynamic flow and gathering intensity patterns with the widespread use of open-source mobile signaling data and spatial detection equipment. This is accompanied by the use of energy intensity, such as the consumption of resources such as electricity and heating. In the past, a large number of studies focused on these high-frequency, short-term changes in order to find patterns in space usage. However, there are also voices of skepticism that the distribution of space heat is simply a result of recording, and does not help in finding causes and patterns. Essentially, if there is no space capacity, there would be no so-called heat distribution and no “post-recorded skepticism”. Therefore, these high-frequency, short-term flow heat patterns are a short-term dynamic representation of space usage based on built-in intensity and are closely related to space capacity and volume ratios.
In addition, there is built-up space as a commodity attribute for sale or lease prices, which can be understood as a kind of spatial value intensity. There are generally two ways of measuring this intensity: one is the absolute value of rent or sale price projected into space, such as the price intensity of Beijing Station Domain, which is roughly a growth trend that is constantly refreshed over time; and the other is the rent-sale ratio of the station domain property, which represents the potential return on investment to a large extent. Compared with these, most of the top-stream stations are not within these investment potential ranges; besides the convenient-to-measure intensity, there are some that are not easily measurable, such as the employment intensity based on the station domain that causes talent aggregation, and the potential GDP or innovation value intensity. Of course, there are also alternative measurement methods, such as research on the quantitative representation of this index based on articles, patents, production ratios, or even IPO ratios.
Based on different analysis granularities, this paper selects several intensity cases, such as population heat, floor area ratio (FAR), gross floor area (GFA), electricity intensity, and population carrying capacity, and visualizes each of them, and tries to express the relationship between the average floor area ratio (FAR) of the station domain and the structure of the station domain space intensity.
6.2. Visual Representation of Multiple Intensities and Their Mutual Characterization
Under the 250 m granularity resolution, let us first look at the population heat situation. Based on Baidu Map location services and mobile operators’ cell phone data consolidated into a 250 m grid to form population distribution heat, as shown in Figure 10a, the overlay of the 2019 Beijing rush hour peak flow station and the spatial heat distribution of the urban commuting population, as shown in Figure 10b, is the overlay of the rush hour peak flow station and the spatial heat distribution of the residential population of the urban commuting population. A very intuitive feeling is that all the rush hour top-flow stations basically overlap with the hot areas of the population heat. The outbound station and the spatial heat distribution of the employment space of the commuting population are more overlapped, and the inbound station and the spatial heat distribution of the commuting population’s place of residence are more overlapped. This phenomenon can be seen as a mutual representation of the human flow concentration intensity.
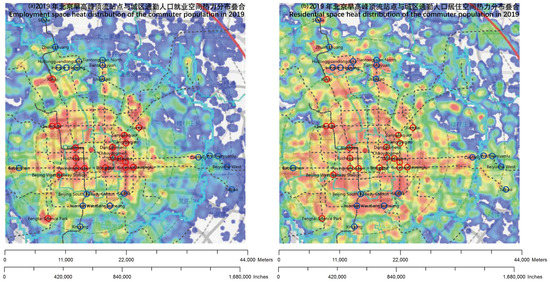
Figure 10.
Employment and residential space heat distribution of the commuter population in 2019.
If based on the land block granularity analysis, as shown in Figure 3 of the atlas database, the built-up volume ratio distribution can be seen. In general, the division of land for outbound station domains is more fine-grained compared to the volume ratio of the land blocks for inbound station domains. Furthermore, when we reach the granularity of building units, we can see the spatial strengths of more delicate aspects, such as building area, electrical usage intensity distribution, and population carrying capacity. However, these reflect the actual state and seem to differ from the ideal distribution of the station domain layer volume ratios (gradually decreasing from the center) shown by a large number of theoretical studies. At the same time, there is a multiplicative constant relationship between building areas, electrical usage intensity distribution, and population carrying capacity that can be converted between each other, which is also a common perspective used to judge resource balance when conducting detailed planning.
6.3. The Fitting Relationship between Spatial Configuration and Spatial Intensity
In this paper, a total of 47 top-flow stations were studied. In order to obtain more universal regression results in the regression experiment of building strength and spatial structure, and to compare with the regression trend of top-flow stations, this paper extracted more than 300 station areas’ built-up strength and spatial structure indices for regression and fitting. The spatial structure index is divided into three categories: one is road network density (TTSL_R 1.6 km); one is station topology structure, including the global integration (HH) and global choice (CHOICE) of the urban rail network topology; one is ground structure indicators, including station domain road network integration (TINT_R 2 km), station domain road network global depth (TTD_R 5 km), station domain road network spatial influence (INT_CHR 1 km), station domain road network CHOICE (TCH_R1600 and TCH_L500 Segment Length 0.5 km as weight), station domain global spatial efficiency (NACH_50 km), and station domain local spatial efficiency (NACH_1000 m).
As shown in Figure 11a, in all correlation tests between the spatial configuration indices and built-up intensity, all regression analysis p-values are less than 0.001, and all ten indices of the three categories passed significance tests, indicating that there is a significant correlation between these spatial configuration indices and built-up intensity. The highest R-square is 0.449, which is the fit between the built-up intensity and TTSL_R1600 and can be understood as a closer relationship between the built-up intensity and the road network density. The second-high correlation R-square is 0.417, which is TINT_R2K, i.e., integration within a radius of two kilometers. The third-high correlation R-square is 0.396, which is HH, i.e., the global integration of the rail network topology. These three relatively high fitting indices correspond to three factors as follows: one is the fragmentation of the built-up land blocks within the station area, the second is the spatial accessibility of the station location, and the third is the network centrality characteristics of the station itself. Furthermore, the R-square between built-up intensity and the functional mix is 0.247, which also passed the significance test. In conclusion, the built-up intensity has a closer correlation with the fragmentation of station area land forms, the spatial accessibility of location, and the centrality of topology than with the functional mix.
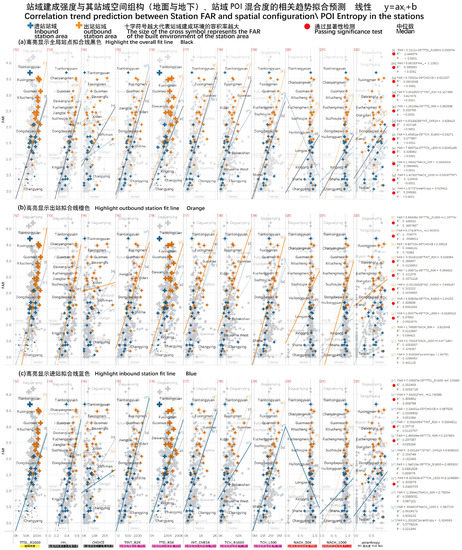
Figure 11.
Correlation trend prediction between station FAR and spatial configuration/POI entropy in the stations.
In addition, by highlighting the top-flow stations and fitting the built intensity and spatial structure indicators of the top-flow station domains separately, it was found that for the top-flow outbound station domains (Figure 11b), most of the relevant indicators passed the significance test (p-value less than 0.05), and only the global CHOICE (CHOICE), NACH_50K, NACH_1K, and POI entropy did not pass the significance test. For the top-flow inbound station domains (Figure 11c), only the global CHOICE of the rail network topology (CHOICE), INT_CHR1K, TCH_R1600, NACH_50K, NACH_1K, POI entropy, and station the POI mixture degree failed to pass the significance test. Therefore, it can be explained from another perspective that even if the relevant tests of the global indicators pass the significance test, the fitting correlation measurements of the top-flow stations may not all pass the significance test.
Based on the fitting trend of the built intensity and spatial structure indicators of the top-flow station domains, this study further expands the regression fitting of the relationship between the global construction intensity and spatial structure, and the preliminary comparison shows that the fitting trend of “intensity-structure” of the global station domains is similar to that of “mixing degree-structure”, both of which are related and pass the significance test. However, the fitting trend of the top-flow stations studied separately is not completely synchronized with the global station domains, indicating that the potential factors affecting the real intensity distribution are not only the spatial structure but also the functional mixing degree.
7. Conclusions
Urban rail transportation is an important public transportation network that contributes to the implementation of a dual-carbon strategy and the sustainable development of transportation. The hub stations are crucial nodes in this network. This paper focuses on 47 stations of Beijing’s urban rail transportation during the 2018–2020 working day peak hours (26 stations for entering and 22 stations for exiting, including the Beijing South Station as a double-hub station). Detailed data collection and analysis were conducted on the spatial texture, spatial structure efficiency, land use function, land use mix, POI spatial distribution, POI functional mix, construction intensity, and population heat distribution within the core area of 0.5 km radius and the radiation area of 1.25 km radius around each station. The paper mainly discusses the network topology characteristics, spatial efficiency differences, land use function mix characteristics, spatial construction intensity, and distribution structure characteristics of the station areas through various dimensions. It examines the interrelated fitting relationship between the key indicators of the spatial structure, spatial function, and spatial intensity of the station area built environment from the perspective of urban design.
Firstly, the relationship between the top-flow stations and general stations is discussed in this paper. Focusing on peak flow stations from the perspective of traffic flow over a three-year period, the peak flow station area is highlighted against the background of the entire station area. The discussion between the special and the general takes place within the context of the entire station area space, further expanding the understanding of the measurement methods for the spatial structure of the station environment.
Secondly, the relationship between the controllable index system and the spatial configuration is also discussed. The study constructs the fitting relationship between the commonly used planning indicators and multiple indicators of spatial configuration in the construction process (Figure 12) and selects some fitting relationships suitable for Beijing. In guiding the update or new construction of the station domain space, the function, intensity, and structure can achieve good adaptation in the spatial configuration system of the entire city. This fitting relationship can play a role in assisting decision making in future rail transit station domain space planning and spatial update and also shows that it is difficult to achieve a high statistical fit between factors (the highest fitting R-square is only 0.50), indirectly demonstrating the diversity and complexity of factors affecting the station domain space and the limited effectiveness of spatial configuration and controllable indicators in the station domain space.
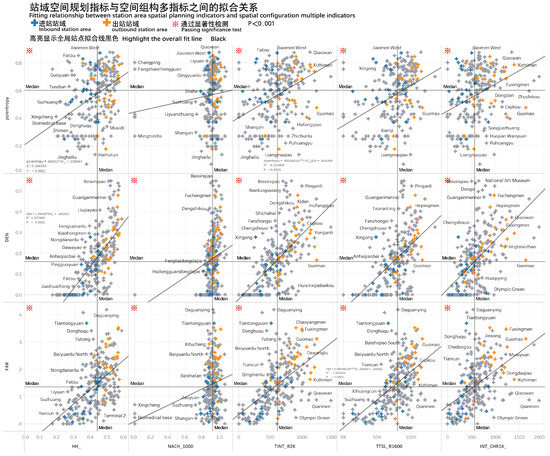
Figure 12.
Fitting relationship between station area spatial planning indicators and spatial configuration multiple indicators.
Thirdly, a more detailed discussion was carried out in three dimensions. Starting from the spatial flow, the study explores the spatial structure of the station area built environment and its impact on the potential of functional land. From the perspective of station area urban design, the study has three insights. Firstly, the station area space is affected by dual restructuring; whether it is strengthened or weakened, the spatial pattern has a far-reaching impact on the surrounding areas of the station area from the perspective of space. Secondly, the self-adjustment of station area functions and the planning and degree of mixing of functional land in the station area show a new functional POI distribution and gathering pattern under the influence of restructuring. This is not only a further subdivision of business format but also a game and spatial distribution self-organization of function under limited conditions (space carrying capacity, economic benefits, and public efficiency balance), further demonstrating the interaction between top-down guidance planning and bottom-up spatial game in shaping urban space form and expressing complexity and diversity dependent on spatial structure. Finally, the effect of intensity adaptation, based on spatial capacity and function, leads to the gathering effect, which in turn leads to the flow intensity and use intensity of various resources, repeated cyclically, and the resulting social mapping (the institutional logic of spatial governance and organizational framework) and cultural crystallization (cultural symbols and the consensus of intergenerational transmission) as manifestations.
In conclusion, the relationship between the function, structure, and strength of the built environment in the station domain is closely related at the theoretical level. To some extent, the regression tests confirm the close relationship between the key indicators and expand the indicator system for measuring the fit of the relationship (Figure 9, Figure 11 and Figure 12). A comparison between general and top-flow stations shows that the fit of the indicators for top-flow stations is not completely in sync with that of general stations, indicating that the factors affecting top-flow stations are from multiple sources. At the same time, it reminds the design and management teams in practice that the measurement and planning of the built environment in the station domain should be adapted to local conditions and closely related to the topological structure of the rail network and the structure of the road network. Furthermore, the stability of the indicator system and whether the R-value has differences in different cities are yet to be further tested. This paper explores the research methodology of the measurement of the built environment in the station domain and the concepts of the station-city integration development.
This paper contributes to the existing knowledge and practices in several aspects. Firstly, it proposes a new method for measuring the impact of site domain spatial configuration on the sustainable development of public transportation systems and deeply explores the correlation between factors such as spatial structure, function mix, and building intensity within the site domain. Secondly, it reveals the differences in the spatial characteristics and spatial efficiency of different types of sites through specific case studies, providing valuable references and guidance for future site domain planning and design. Thirdly, it proposes a new spatial configuration index system, setting more specific requirements for site domain spatial planning and design, and makes significant contributions to the realization of sustainable transportation development and urban spatial sustainable development.
Additionally, the paper also emphasizes the importance of considering local conditions and the topology of rail and road networks in spatial configuration, as well as the challenges and complexities of site domain spatial planning. These findings contribute to better guiding urban planners and policymakers in formulating sustainable urban designs, transportation policies, and implementation measures.
Author Contributions
Conceptualization, B.W. and T.Y.; Methodology, B.W. and T.Y.; Software, X.Z.; Validation, X.Z.; Investigation, X.Z. and Y.S.; Writing—original draft, B.W.; Writing—review & editing, B.W.; Supervision, T.Y.; Project administration, B.W.; Funding acquisition, B.W. All authors have read and agreed to the published version of the manuscript.
Funding
This research was funded by the Humanities and Social Science Program sponsored by the Ministry of Education of China (20YJCZH148).
Institutional Review Board Statement
Not applicable.
Informed Consent Statement
Not applicable.
Data Availability Statement
Data is contained within the article.
Conflicts of Interest
The authors declare no conflict of interest.
References
- Cervero, R.; Kockelman, K. Travel demand and the 3Ds: Density, diversity, and design. Transp. Res. Part D Transp. Environ. 1997, 2, 199–219. [Google Scholar] [CrossRef]
- Cervero, R.; Ferrell, C.; Murphy, S. Transit-oriented development and joint development in the United States: A literature re-view. TCRP Res. Results Dig. 2002, 144. [Google Scholar]
- Kwoka, G.J.; Boschmann, E.E.; Goetz, A.R. The impact of transit station areas on the travel behaviors of workers in Denver, Colorado. Transp. Res. Part A Policy Pract. 2015, 80, 277–287. [Google Scholar] [CrossRef]
- Jun, M.J.; Choi, K.; Jeong, J.E.; Kwon, K.H.; Kim, H.J. Land use characteristics of subway catchment areas and their influence on subway ridership in Seoul. J. Transp. Geogr. 2015, 48, 30–40. [Google Scholar] [CrossRef]
- Chan, S.; Miranda-Moreno, L. A station-level ridership model for the metro network in Montreal, Quebec. Can. J. Civ. Eng. 2013, 40, 254–262. [Google Scholar] [CrossRef]
- Choi, J.; Lee, Y.J.; Kim, T.; Sohn, K. An analysis of Metro ridership at the station-to-station level in Seoul. Transportation 2012, 39, 705–722. [Google Scholar] [CrossRef]
- Sung, H.; Oh, J.T. Transit-oriented development in a high-density city: Identifying its association with transit ridership in Seoul, Korea. Cities 2011, 28, 70–82. [Google Scholar] [CrossRef]
- Handy, S.L.; Niemeier, D.A. Measuring accessibility: An exploration of issues and alternatives. Environ. Plan. A 1997, 29, 1175–1194. [Google Scholar] [CrossRef]
- Sohn, K.; Shim, H. Factors generating boardings at metro stations in the Seoul metropolitan area. Cities 2010, 27, 358–368. [Google Scholar] [CrossRef]
- Cervero, R. Transit-based housing in California: Evidence on ridership impacts. Transp. Policy 1994, 1, 174–183. [Google Scholar] [CrossRef]
- Crowley, D.F.; Shalaby, A.S.; Zarei, H. Access walking distance, transit use, and transit-oriented development in North York City Center, Toronto, Canada. Transp. Res. Rec. 2009, 2110, 96–105. [Google Scholar] [CrossRef]
- Gutiérrez, J.; Cardozo, O.D.; García-Palomares, J.C. Transit ridership forecasting at station level: An approach based on dis-tance-decay weighted regression. J. Transp. Geogr. 2011, 19, 1081–1092. [Google Scholar] [CrossRef]
- Pucher, J.; Buehler, R. Integrating bicyling and public transport in North America. J. Public Transp. 2009, 12, 79–104. [Google Scholar] [CrossRef]
- Zhao, J.; Deng, W.; Song, Y.; Zhu, Y. What influences Metro station ridership in China? Insights from Nanjing. Cities 2013, 35, 114–124. [Google Scholar] [CrossRef]
- Chiaradia, A.; Moreau, E.; Raford, N. Configurational exploration of public transport movement networks: A case study, the London Underground. In Proceedings of the 5th International Space Syntax Symposium, Delft, The Netherlands, 13–17 June 2005; pp. 541–552. [Google Scholar]
- Law, S.; Chiaradia, A.; Schwander, C. Toward a Multi-Model Space Syntax Analysis. A Case Study of the London Street and Underground Network. In Proceedings of the 8th International Space Syntax Symposium, Santiago, Chile, 3–6 January 2012. [Google Scholar]
- Sheng, Q.; Xia, H.; Liu, X. Space syntax analysis of passenger flow data between metro stations: A case study of Beijing, Tianjin, and Chongqing. City Plan. Rev. 2018, 57–67. [Google Scholar]
- Sheng, Q.; Yang, T.; Hou, J. Continuous Movement and Hyper-lLink Spatial Mechanisms—A Large-Scale Space Syntax Analysis on Chongqing’s Vehicle and Metro Flow Data. J. Hum. Settl. West China 2015, 30, 16–21. [Google Scholar]
- Zhang, L.; Chiaradia, A.; Zhuang, Y. A configurational accessibility study of road and metro network in Shanghai, China. In Recent Developments in Chinese Urban Planning; Springer: Cham, Switzerland, 2015; pp. 219–245. [Google Scholar]
- Zhang, L.; Zhuang, Y.; Ye, Y. A Correlation Analysis of Transport Accessibility and Spatial Performance Aiming for Synergistic Development in Rail Transit Station Areas: A Case Study of Central Shanghai. New Archit. 2019, 2019, 114–118. [Google Scholar]
- Hillier, B.; Penn, A.; Hanson, J.; Grajewski, T.; Xu, J. Natural movement: Or, configuration and attraction in urban pedestrian movement. Environ. Plan. B Plan. Des. 1993, 20, 29–66. [Google Scholar] [CrossRef]
- Hillier, B. Cities as movement economies. Urban Des. Int. 1996, 1, 41–60. [Google Scholar] [CrossRef]
- Shao, Q.; Zhang, W.; Cao, X.; Yang, J.; Yin, J. Threshold and moderating effects of land use on metro ridership in Shenzhen: Implications for TOD planning. J. Transp. Geogr. 2020, 89, 102878. [Google Scholar] [CrossRef]
- Chen, X.; Zhou, X.; Qiao, Y. Coordination and Optimization of Multilevel Rail Transit Network and Multi-Scale Spatial Layout: A Case Study of Shanghai Metropolitan Area. Urban Transp. China 2017, 15, 20–30. [Google Scholar]
- Meng, B. The Spatial Organization of the Separation between Jobs and Residential Locations in Beijing. Acta Geogr. Sin. 2009, 64, 1457–1466. [Google Scholar]
- Wei, H.; Zhao, H.; Xiao, T. A Study on The Characteristics and Influencing Factors of Spatial Mismatch Between Housing and Employment in Beijing. Urban Dev. Stud. 2017, 24, 43–51. [Google Scholar]
- Wang, B.; Wang, L.; Liu, Y.; Yang, B.; Huang, X.; Yang, M. Characteristics of jobs-housing spatial distribution in Beijing based on mobile phone signaling data. Prog. Geogr. 2020, 39, 2028–2042. [Google Scholar] [CrossRef]
- Ding, L.; Niu, X.; Song, X. Urban Spatial Studies with Big Data of Mobile Location: A Progress Review. Urban Plan. Int. 2015, 30, 53–58. [Google Scholar]
- Wang, Y. International Studies on the Interaction Between Urban Rail Transit and Land Use of Station Areas. Urban Plan. Int. 2018, 33, 111–118. [Google Scholar] [CrossRef]
- Cui, X.; Zhao, W.; Yu, B. Space Planning Technology and Policy for Station-City Integration: Rethinking on the Subject of Urban Planning. Archit. Tech. 2019, 26–29. [Google Scholar]
- Guo, Y.; Li, L.; Li, G.; Zhang, H. Overview of Interaction between Urban Land Use and Transportation. Urban Plan. Int. 2015, 30, 29–36. [Google Scholar]
- Yang, S.; Zhang, L.; Zhuang, Y. Relations between Function Distribution and Vitality within Railway Station Areas from Perspective of Station-City Synthetic Development: Case Studies on Four Principal Chinese Stations. Shanghai Urban Plan. Rev. 2021, 106–112. [Google Scholar]
- Ye, Y.; Zhuang, Y. The Raising of Quantitative Morphological Tools in Urban Morphology. Urban Des. 2016, 4, 56–65. [Google Scholar]
- Xia, H.; Wan, B.; Liu, X. Theoretical Research on Rail Transit and Urban Spatial Network Based on Digital Technology. Huazhong Archit. 2021, 39, 74–78. [Google Scholar]
- Yang, T. A study on spatial structure and functional location choice of the Beijing city in the light of Big Data. In Proceedings of the 10th Space Syntax Symposium, London, UK, 13–17 July 2015; p. 119. [Google Scholar]
- Wan, B.; Yang, T. A Preliminary Study on The Characteristics of Spatial Form of Contemporary Beijing School District. In Proceedings of the 12th International Space Syntax Symposium, Beijing, China, 8–13 July 2019. [Google Scholar]
- Wang, H.-F. Logic of spatial distribution of urban density: Taking Shenzhen City for example. Urban Probl. 2015, 22–32. [Google Scholar]


Disclaimer/Publisher’s Note: The statements, opinions and data contained in all publications are solely those of the individual author(s) and contributor(s) and not of MDPI and/or the editor(s). MDPI and/or the editor(s) disclaim responsibility for any injury to people or property resulting from any ideas, methods, instructions or products referred to in the content. |
© 2023 by the authors. Licensee MDPI, Basel, Switzerland. This article is an open access article distributed under the terms and conditions of the Creative Commons Attribution (CC BY) license (https://creativecommons.org/licenses/by/4.0/).