Article

Comparison of Two Hydrological Models, the HEC-HMS and Nash Models, for Runoff Estimation in Michałówka River

Department of Land Improvement, Environmental Development and Spatial Management, Poznań University of Life Sciences, Piątkowska 94, 60-649 Poznań, Poland
*
Author to whom correspondence should be addressed.
Sustainability 2023, 15(10), 7959; https://doi.org/10.3390/su15107959
Submission received: 23 March 2023 / Revised: 4 May 2023 / Accepted: 10 May 2023 / Published: 12 May 2023

Abstract

:
Floods are among the most devastating natural disasters in small suburban catchments. These phenomena, causing loss of life and massive property damage, pose a serious threat to the economy. Hydrological modeling is extremely important in terms of climate change, and the use of appropriate modeling can be a useful tool for flood risk prevention and mitigation. Rainfall–runoff modeling requires the selection of an appropriate hydrological model in order to obtain satisfactory results. Hydrological models are used in water resource planning and management to estimate catchment runoff. Small uncontrolled catchments play a particularly important role in hydrological phenomena, since changes in them affect flows in the recipient. Hydrologists are particularly interested in developing hydrological models that can be made with a minimum of data and parameters. Nash models and the Hydrologic Engineering Center-Hydrologic Modeling System (HEC-HMS) are examples of simple and most practical hydrologic models. These models were used in this paper to study geographic and qualitative changes in precipitation runoff due to land cover changes. The modeling was carried out for two spatial aspects relating to the years 1940 and 2018. The model allowed for the simulation of the river flow that can occur under different rainfall probabilities. The analysis of the results was used to evaluate the hydrological models used. The hundred-year flow modeled with the Nash model for 1940 was 13.4 m3∙s−1, whereas the second model gave slightly lower flow values. In addition, modeling the flow for 2018 (after changing the land cover) highlighted the increase in the flow value for both models, where again the flow volume was slightly higher for the Nash model and amounted to about 19 m3∙s−1. The flow differences for individual models were not too large. This made it possible to conclude that the simulated outflow hydrographs are in good agreement, and this means that the models accurately reproduce the flow of the Michałówka River. The study showed that rapid urbanization adversely affects hydrological processes. In addition, the study showed that a well-distributed model can outperform a global flood forecasting model, especially in terms of magnitude, as in the current study example.

1. Introduction

Hydrology, a science that deals with different phases of the Earth’s water, is essential in the water resource planning, development, and operation of various schemes; rainfall–runoff relationship studies; accurate estimation of the basin’s hydrologic response; primary concerns over any infrastructural development; and causes of uncertainty, a source of over- and under-estimation. Researchers have created various modeling frameworks to model the hydrological process [1,2,3]. Quantification of hydraulic components is crucial for effective water resource planning and management. Most hydrologic systems are exceedingly complicated, and we need help comprehending them fully. As a result, abstraction is required to understand or regulate any parts of their behavior [4]. The process of abstraction entails replacing the system under examination with a model with a similar but simpler structure. The use of hydrologic models for prediction is primarily motivated by the scarcity of hydrologic data. Measuring and collecting hydrological and meteorological data is the starting point for any hydrological inquiry, such as rainfall–runoff estimation, which is the very first stage in the design of water-related scientific research and initiatives. However, as in other developing countries, the quality and quantity of gauging stations available in the country are insufficient, and some of the public stations, according to experts, are not functioning correctly due to a lack of well-experienced technicians to operate and maintain the existing instruments [5], necessitating the use of an alternative hydrological model that allows for a reasonable estimate of the required input data. The unit hydrograph is one of the most widely used black-box models of the rainfall–runoff interaction. The black-box models are based on rainfall–runoff data analysis. These models were developed in the 1960s and 1970s in response to an increased need for numerical water quality and quantity forecasting due to environmental regulations in the United States and the United Kingdom [6]. Hydrologic models, in general, are simplified simulations of complex hydrologic systems [7]. In particular, rainfall–runoff modeling and flood forecasting can be mentioned in hydrologic hazard prediction to avoid hazards and minimize risks [8,9]. The described rainfall–runoff modeling fulfills this goal by using a flexible framework that allows inclusion representations with different degrees of approximation of each included physical process. Rainfall–runoff models are widely used for climate risk assessment by predicting changes in runoff and other hydrologic processes due to expected anthropogenic climate change, climate variability, and land management [10]. Modeling runoff can help understand, control, and monitor the quality and quantity of water resources. However, hydrological models are rarely used to predict flow in uncontrolled catchments due to the inability to compare forecast data with observed data. Detailed hydrological studies are challenged due to the scarcity of data and complexity of hydrological systems [11,12].
Since the eighteenth century, urbanization has been the most intense type of land-cover change in most developed places [13], with estimates for the coming decades indicating continued urban growth in developing countries [14]. Growing populations and migration to constructed areas are pushing land use change in the form of urbanization worldwide, with 70% of the world’s population anticipated to reside in cities by 2050 [15]. Applying hydrological models has yielded well-known evidence on the long-term hydrological implications of urbanization [16]. Such models make it easier to manipulate temporal and spatial physical changes to determine the effects on the simulated hydrological response, particularly the impact of land-use change and impervious cover increase. As urbanization grows, impermeable surfaces increase, limiting infiltration during storm events and increasing direct runoff, which eventually modifies urban hydrologic processes [17,18,19]. Many studies have been conducted to assess the influence of urbanization on direct surface runoff using field measurements, experimental watersheds, and statistical modeling [20,21,22,23]. However, for large ungauged watersheds, predicting surface runoff quantity and velocity is an intrinsically complex and time-consuming task [24]. The Soil Conservation Service curve number (SCS-CN, U.S. Department of Agriculture, Bronx, NY, USA) approach is one of the most extensively used empirical hydrologic models for determining the volume of direct surface runoff among all hydrologic models. The primary unit for hydrological studies was the urban functional zone (UFZ). The hydrological changes in runoff were investigated by determining the difference in the runoff between the current and pre-urbanization conditions. The curve number (CN) method, developed by the Soil Conservation Service [25] and commonly accepted by the Natural Resources Conservation Service (NRCS) of the U.S. Department of Agriculture (USDA), is probably the most widely used in hydrology and environmental engineering for determining the amount of direct runoff from a rainfall event [26]. When examining the rainfall–runoff reaction in uncontrolled catchments, many models are used that are based on CN.
Hydrological modeling is now the best method for ensuring sustainability and watershed management, as well as guarding against extremal events in catchment. Several free modeling software programs have been developed and spread during the last two decades, of which the most commonly used for small catchments are the Nash model and HEC-HMS [27].
One of these simple yet powerful models is the Nash model, used in this study to determine its two parameters using mathematical and statistical methods. Since Nash’s first proposal, several Nash cascade-based models have been developed (1957). Nash proposed a model for deriving the instantaneous unit hydrograph (IUH) for a natural watershed in 1957 based on a cascade of equal linear reservoirs. The Nash approach appeared capable of predicting the catchment’s direct runoff hydrographs. Many Nash cascade-based models have been developed to model the rainfall–runoff process, such as the urban parallel cascade model [28], the hybrid and extended hybrid models [29,30], the two-reservoir variable storage coefficient model [31], and the cascade of the submerged reservoir model [32]. Most of these models introduced the Nash model—a cascade of linear reservoirs. The Nash model also applies to river flow routing [33], independently accomplished by Kalinin G. P. and Milyukov et al. (1957) [34], also known as the characteristic reach technique.
On the other hand, the HEC-HMS model is one of the hydrological models that requires little input data and provides a reliable result [35]. The HEC-HMS consists of seven hydrologic elements that form a basin model network. The sub-basin element represents a drainage basin where rain falls, infiltration occurs, and surface runoff may occur. The HEC-HMS model can explore urban flooding, flood warning system development, reservoir capacity, river restoration, and others [36]. The HEC-HMS model has been used successfully in river basins worldwide for watershed modeling [37,38]. The literature on hydrological modeling for uncontrolled catchments is sparse.
Rarely are articles developed on flow variability as a result of different precipitation totals occurring in an uncontrolled catchment with different precipitation probabilities. However, for example, Derdour et al. [39] used precipitation data with different probabilities of occurrence for analysis for the Breidj and Tirkount catchments, and modeling was done in HEC-HMS. Another work using the Nash model is that of Kozlov and Ghebrehiwot [40], where the response of a catchment to precipitation in the form of water runoff is presented.
More often, however, modeling is done for controlled catchments, where model data are used for comparison with observed data, as presented in his work by Yan [41] for the Qingjiang River and Jennifer et al. [27] for the Irawan Watershed. The HEC-HMS model has gained popularity in recent years due to the full automation of the model as opposed to the Nash model. Nevertheless, the HEC-HMS model is most often used to simulate the flow and then compare it with measured data. With this in mind, this manuscript helps to fill the knowledge gap in this area.
The current study’s primary goal is to investigate a model capable of representing the hydrological operation of the area of Michałówka river through the testing and implementation of specific hydrological models that have demonstrated their robustness and performance on an international scale on a pilot zone of the basin, intending to generalize the retained model to the entire basin. The investigation aims to predict the response catchment of the Michałówka river with an area of 47 km2, using two hydrological models, the HEC-HMS and Nash models, with impacts of land cover change, in runoff estimation. This research is intended to fill the gap regarding hydrological data in relation to the catchment of the Michałówka river because this type of hydrological analysis has not been performed for it. This is particularly important because it is an uncontrolled catchment, and there are no data on this river in hydrological resources. The diagnosis of the condition of the Kleszczewo commune showed the need for water retention in this area due to local flooding [42]. These situations mostly concern post-agricultural areas transformed into residential areas. In local newspapers, there is information showing that, as a result of investments carried out in the vicinity, the drainage system was damaged, which caused flooding in the catchment area [43]. The runoff-recorded data are a severe problem for the area’s effective planning and sustainable management. Considering the current issue of limited data, rainfall–runoff modeling was carried out in the Michałówka catchment using two hydrologic models—Nash and HEC-HMS. Finally, the results were compared, and the best model was selected for this catchment. In this work, for the first time, such an analysis of the comparison of two models, such as the Nash model and the HEC-HMS model, was made. So far, no comparison of the aforementioned models has been made, especially in the context of the uncontrolled catchment.

2. Material and Methods

2.1. Study Area

The present study was conducted in a lowland river catchment in Central Europe. This catchment is ideal for assessing the impact of land cover changes due to urbanization on flow because it has undergone significant changes in land cover over the past 80 years. The study area is the Michałówka River, located in the central-western part of Poland, in Greater Poland Province, on the outskirts of Poznań (52°18′50″ N 17°01′19″ E) (Figure 1). With a length of 16.3 km, the Michałówka River is a tributary of the Kopla river and is fed by two watercourses (the Spławka River and the Świątnica River with a length of less than 8 km). The Michałówka River is characterized by natural water flow without damming devices. The total catchment area is 47.64 km2, and the altitude range is from 68.47 to 101.09 m above sea level (Figure 1). More than 60% of the catchment area of the Michałówka River is located within the administrative boundaries of the city of Poznań. More than 60% of the catchment area of the Michałówka River is located within the administrative boundaries of the city of Poznań; the rest of the catchment area is located in the suburban area (Figure 1).
The Michałówka River catchment is an uncontrolled catchment, so there are no data on the river’s basic hydrological parameters, such as water level and water flow. The literature also lacks any data on the river, such as multi-year average flow or multi-year maximum flow.

2.2. Data Collection

We obtained the following cartographic products that served as the basis for the study (all data are open access):
The Map of the Hydrographic Division of Poland (MPHP), scale 1:10,000, developed by the Institute of Meteorology and Water Management (IMGW = Pol. Instytut Meteorologii I Gospodarki Wodnej).
The Raster Hydrographical Map of Poland, scale 1: 50,000 (provided by the Head Office of Geodesy and Cartography (GUGiK = Pol. Główny Urząd Geodezji i Kartografii).
The Topographic Map Messtischblatt, scale 1:25,000, data from 1940 (downloaded from the Archive of Maps of Western Poland (Pol. Archiwum Map Zachodniej Polski).
CORINE Land Cover (CLC) vector layers for 2018, obtained from the Copernicus Land Monitoring Service.
Digital elevation model (DEM) of the mesh size of at least 5 m for Poland provided by GUGiK. We adopted a DEM to verify the Michałówka River catchment’s boundaries, study the land surface’s topography, and create the model in HEC-HMS.
The overall strategy consisted of pre-selecting the models to be studied and applying them to the zone relays in acquiring and preparing the essential data while creating a space database under a geographical information system (GIS). The quality of available and collected information was examined to determine the data used in the study. The second phase involved the execution of the HEC-HMS and Nash hydrological models on the Michałówka River. The final stage involved analysis and evaluation.
In the work, we analyzed flow modulation using two models. This analysis included two extreme scenarios (for 1940 and 2018). These years were selected on the basis of the information that a large change in land cover had occurred in the catchment area during this time.

2.3. Methodology

The catchment area of Michałówka River was delineated on the basis of the Map of the Hydrographic Division of Poland (scale 1:10,000) in Arc GIS 10.8.1 software. Spatial and physiographic parameters of the catchment area were determined on the basis of information layers: a topographic map and a hydrographic map. Characterization of changes in the catchment’s land use from 1940 to 2018 was carried out on the basis of the Messtischblatt Map in raster for 1940 (the Archive of Maps of Western Poland) and CORINE Land Cover (CLC) vector layers for 2018. The catchment’s soil conditions were characterized on the basis of a hydrographic map. The cartographic materials collected this way served as input material for creating a numerical database of the Michałówka River catchment. Then, modeling was carried out using two models (model Nash and in the HEC-HMS 4.8) using data on land use structure and soil species (the necessary parameters). Both models used in the manuscript allow for the modeling of uncontrolled catchments based on the same parameters (2). The simulation was carried out in two variants for land use in 1940 and 2018 and in two variants of atmospheric precipitation (p = 1% and p = 10%). The flow rate in a watercourse depends on the amount of precipitation that feeds its catchment area and the land use of the catchment area, which determines the inflow. The input data for both models were rainfall and catchment parameters (Figure 2).
Maximum rainfall with a duration of one hour and a probability of occurrence of 10% and 1% was used as input in both models, using Bogdanowicz–Stachý’s empirical formula [44]. The catchment of the Michałówka River is a small uncontrolled catchment, so the SCS-CN method was used to model the flow rate. This method depends on soil species, land use, and soil moisture content before precipitation. The dimensionless CN parameter captures the interaction of factors, which takes values from 0 to 100. Calculations of maximum precipitation, CN, and maximum potential retention were calculated according to the methodology [45]. The amount of adequate precipitation in successive time steps Pj was determined using Formula (1).
P j = l = 1 j Δ P l = P j 0.2 · S 2 P j + 0.8 · S 0 g d y     P j 0.2 · S 0 g d y     P j 0.2 · S > 0
where P j is effective precipitation from t0 to tj ( P j = l = 1 j Δ P j ) (mm), P j is precipitation from t0 to tj ( P j = l = 1 j Δ P l ) (mm), Δ P l , is partial precipitation in the time interval l (mm), Δ P l is partial effective precipitation over the time interval l (mm), and S is maximum potential retention of the catchment area (mm).
The first model in this work was the Nash model. The Nash model’s instantaneous unit hydrograph (IUH) portrays the river as a cascade of n equal linear reservoirs, each with the same storage constant K. The downstream outflow is calculated by combining the upstream input with the IUH function. More information on the initial state is commonly considered inconsequential in river flood predictions since its effect will fade over a sufficiently long simulation time. However, the beginning condition significantly impacts short-term prediction circumstances, such as identifying the impulse-response function and real-time forecasting. Nash’s linear reservoir method has always been used to produce runoff data from rainfall data in ungauged catchments. Empirical equations can estimate the Nash IUH properties, such as time to peak and peak value [46]. In the Nash model, on the basis of instantaneous unit hydrogen, the ordinates were calculated using a two-parameter gamma function based on Formula (2).
u t = 1 k · Γ N · t k N 1 · e x p t k
where u t is the ordinates of the instantaneous unit hydrogram, t is time from the beginning of the coordinate system ( h ), k is the reservoir retention parameter (h), N is the number of reservoirs (-), and Γ N is the gamma function whose value for the total number of tanks is Γ N = N 1 !   .
As in most small catchments in Poland, no hydrometric measurements were taken in the Michałówka watercourse catchment, so the outflow lag time ( L A G ) and reservoir retention parameter k were calculated using the relationship [47] (Formulas (3) and (4)). Meanwhile, the number of reservoirs N of the Nash model was determined as the ratio of the lag time ( L A G ) to the reservoir retention parameter ( k ) (Formula (5)).
L A G = 1.28 · A 0.46 · 1 + U 1.66 · P 0.27 · D 0.37
k = 0.56 · A 0.39 · 1 + U 0.62 · P 0.11 · D 0.22
N = L A G k
where L A G is lag time ( h ), k is reservoir retention parameter ( h ), A is catchment area (km2), U is share of impervious surface of the catchment area (−), P is effective precipitation amount (mm), and D   is effective precipitation duration ( h ).
The second model used the HEC-HMS model, a semi-distributed conceptual hydrological model that simulates flow and runoff. The model requires spatial catchment data to simulate runoff. The HEC-HMS model consists of components such as a catchment model, a meteorological model, specifications, and input data (time-series data). Direct runoff is transformed to stream flow by a user-selected transform method. In this study, the elective transformation method was the SCS Unit Hydrograph because of our catchment data. The HEC-HMS model setup consists of four main model components: the basin model, the meteorological model, control specifications, and input data. This model calculates lag time using Formula (3).

3. Results

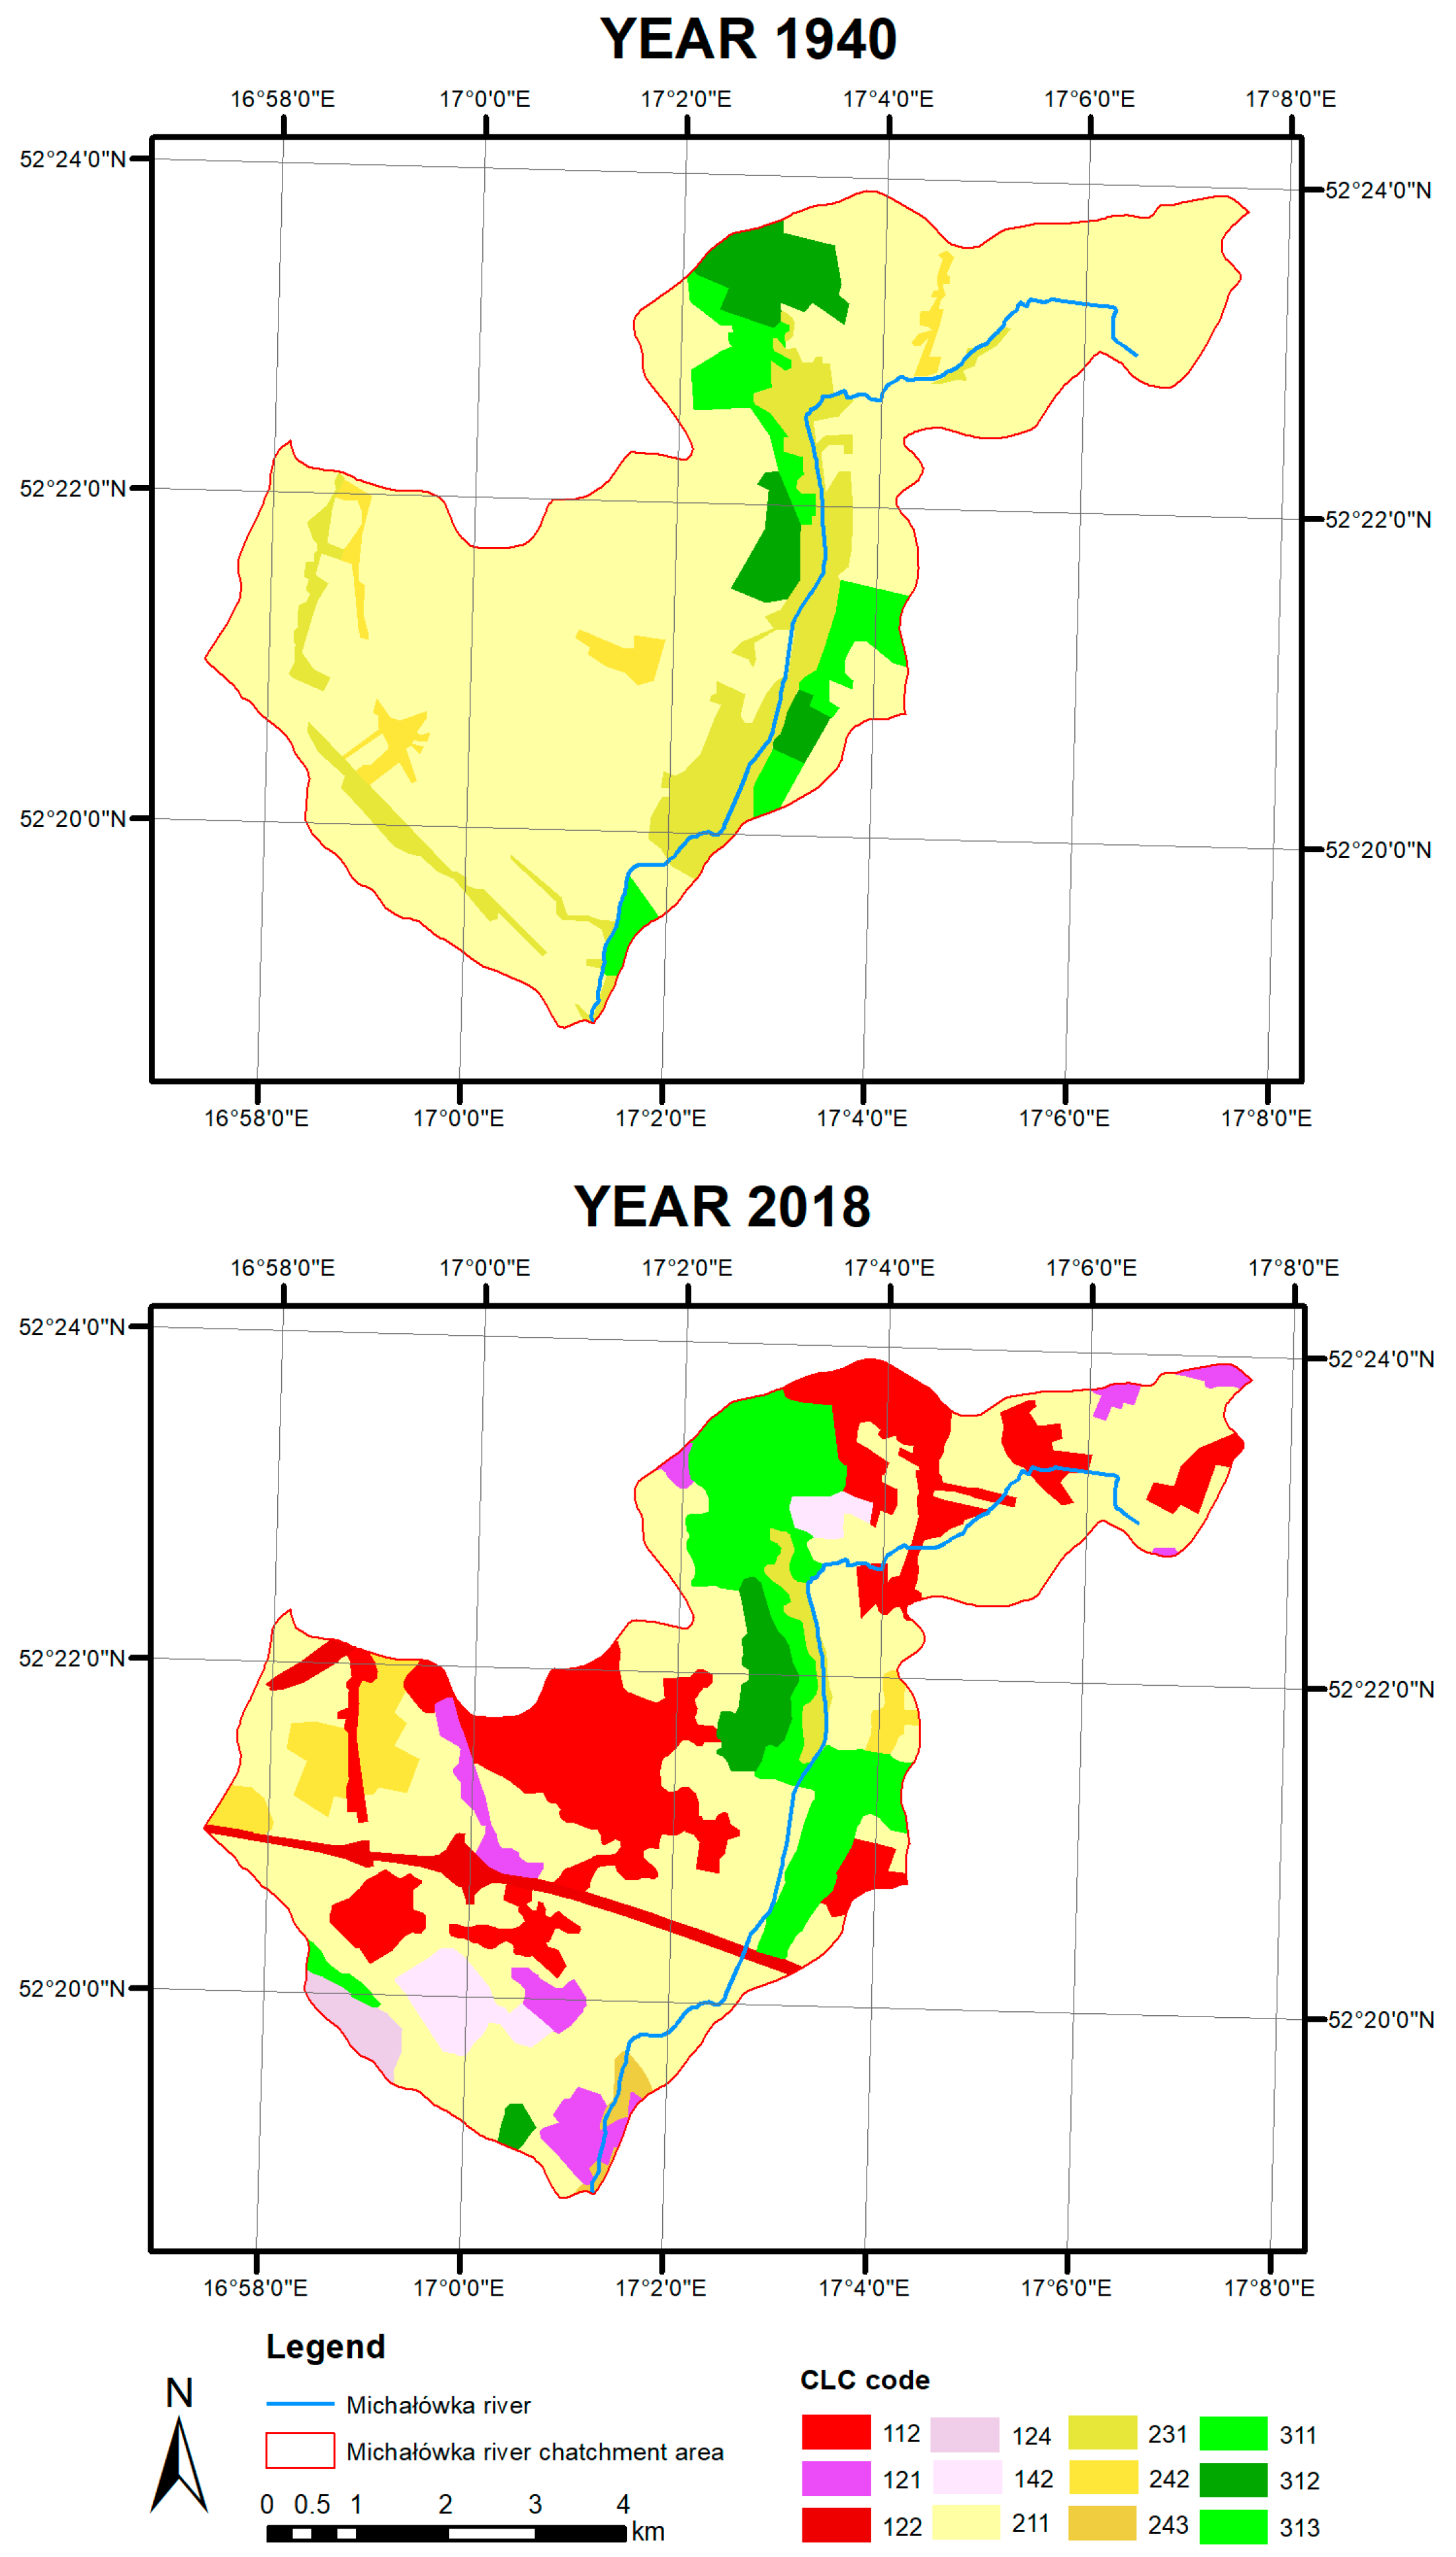
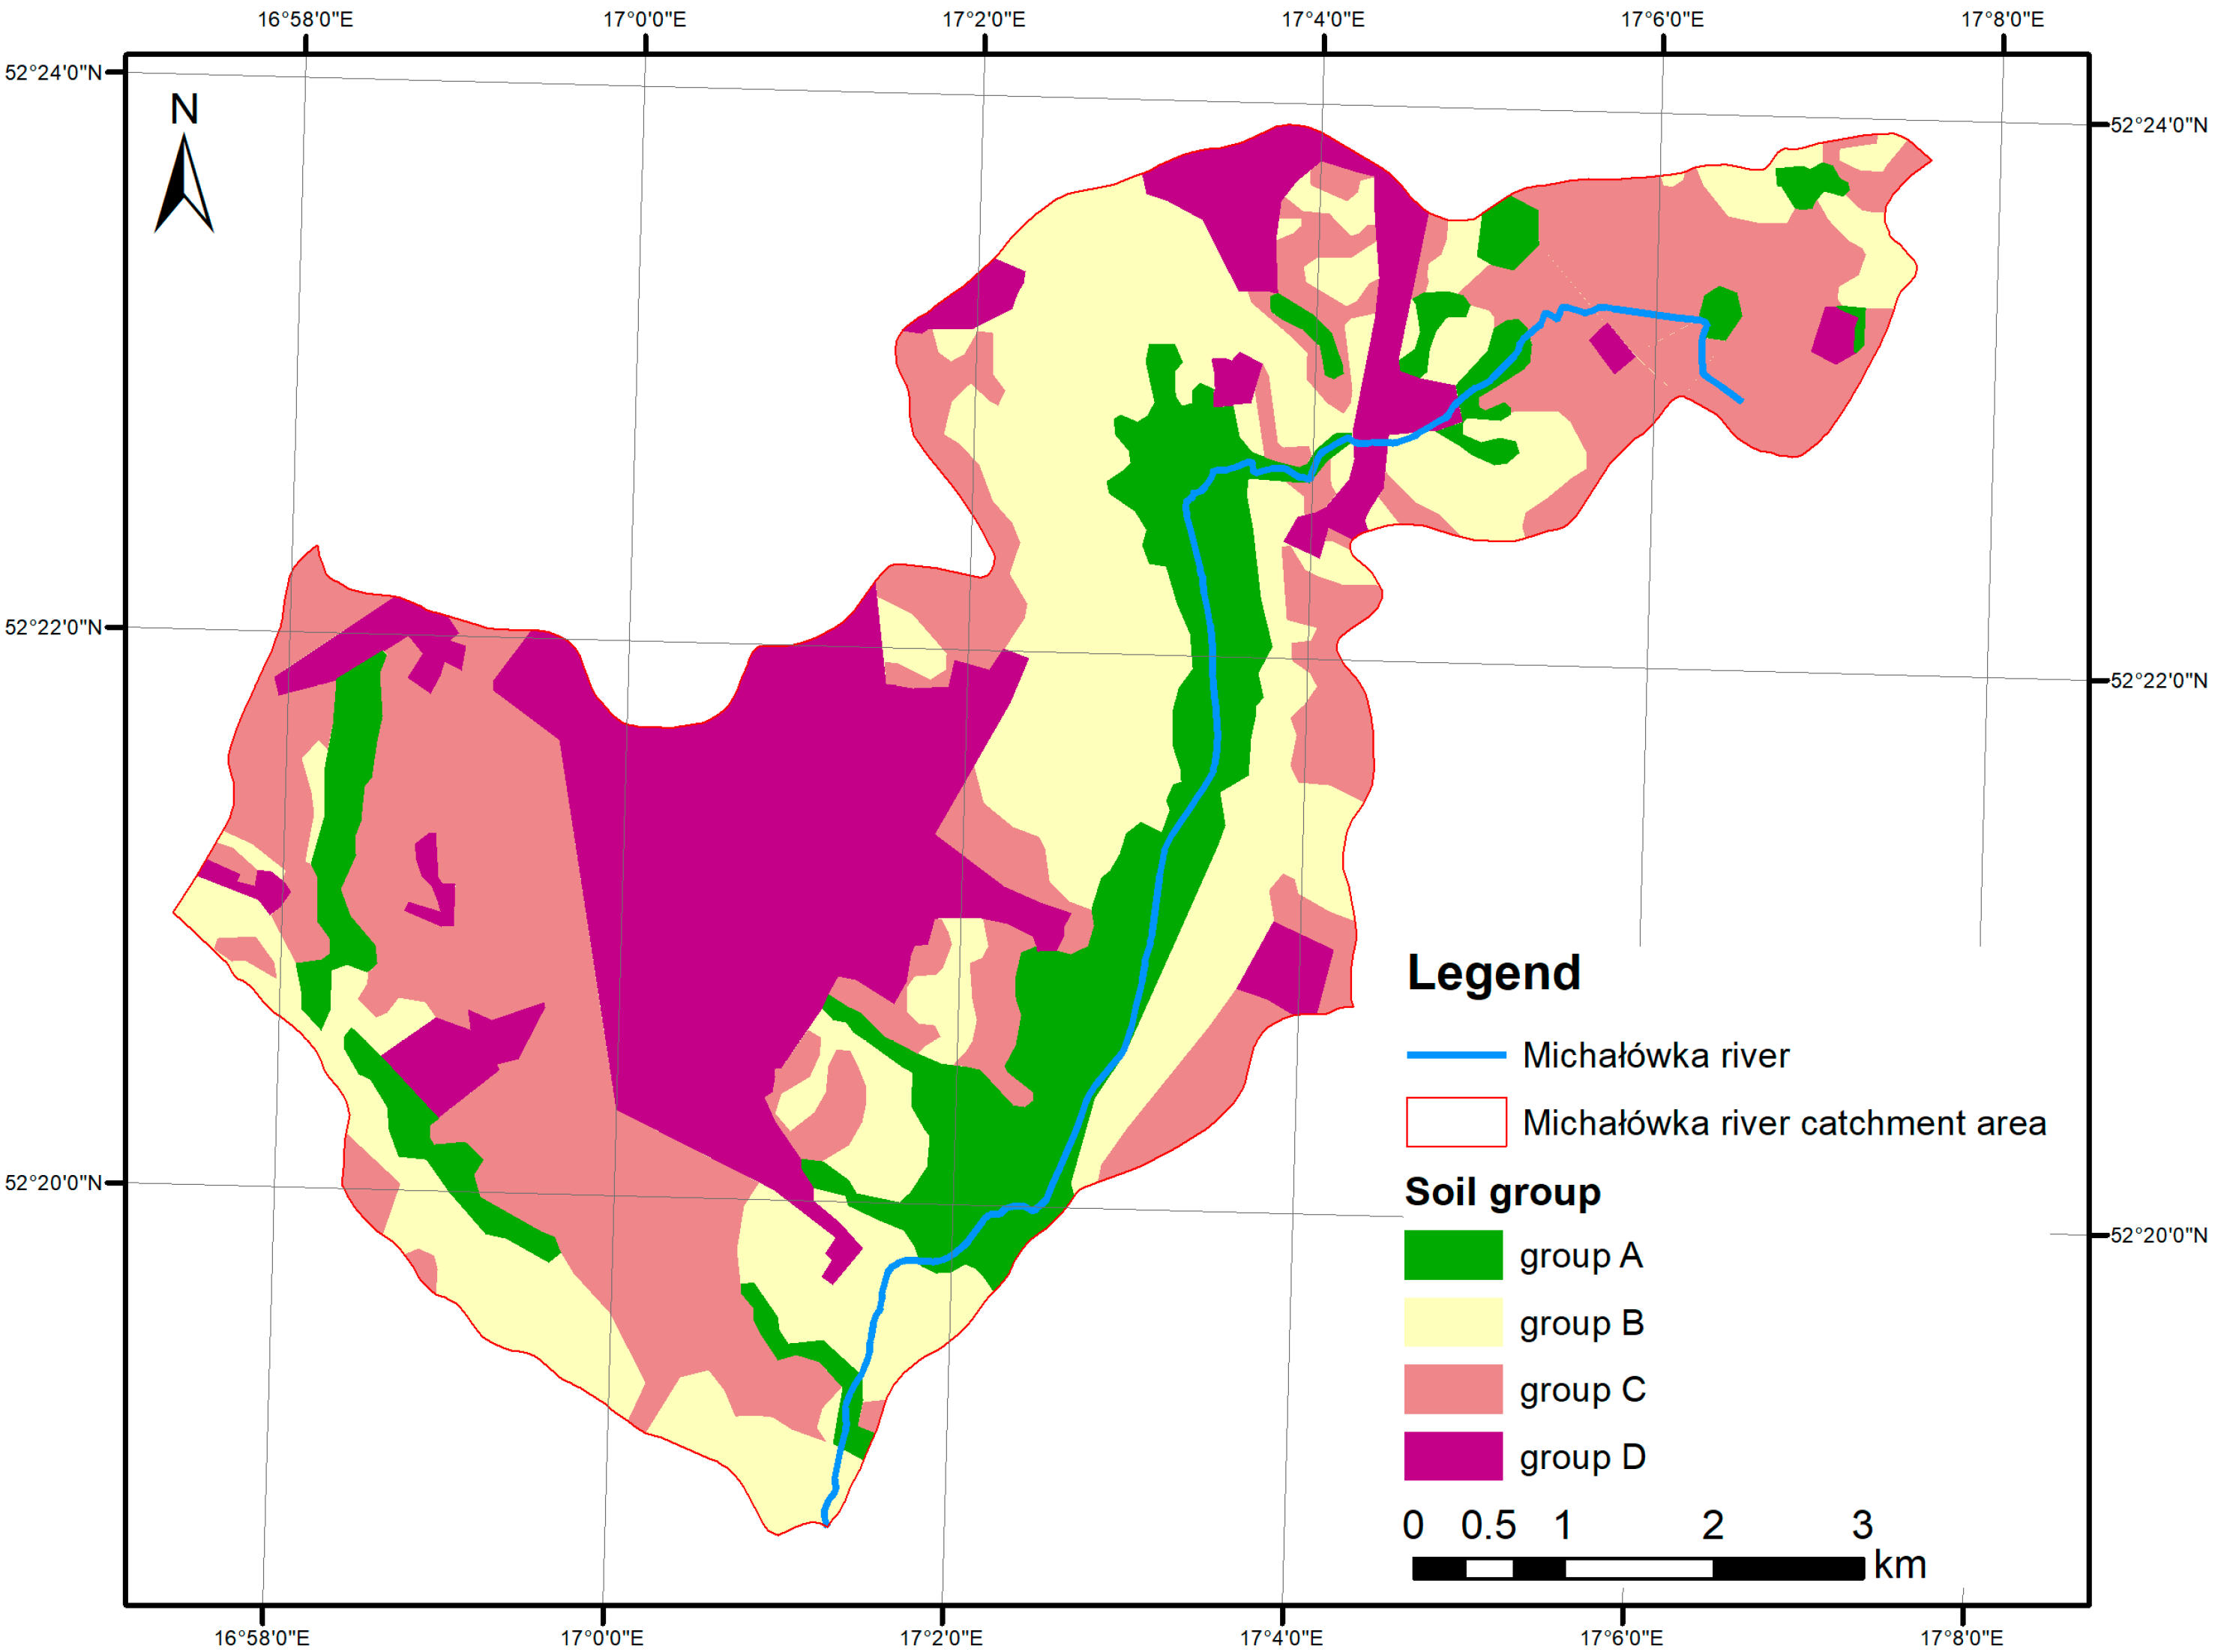
3.1. Characteristics of the Catchment Area

Analysis of the land use map of the Michałówka River catchment from 1940 showed that the catchment use was typically agricultural. In the 1940s, no built-up areas were within the Michałówka catchment area. Only four areas of scattered settlement were identified, with a total area of 0.88 km2 (1.84%), which, according to the CLC methodology, were classified as land with complex cultivation patterns (code 242). The catchment areas were used primarily as non-irrigated arable land (code 211), occupying more than three-quarters of the area. The second largest area in the catchment was the pastures covering (code 231) 10.72% (5.11 km2) of its area. The catchment’s forest cover was expressed in a comparable percentage, amounting to 9.83% at the time. At that time, mixed (313) and coniferous forest (312) dominated, covering 1.97 km2 and 1.94 km2, respectively (Figure 3).
In 2018, arable land still dominated the catchment area, accounting for 50.35% of its total area. As a result of intensive urbanization processes, the vast majority of land with a complex system of crops and plots has been converted to discontinuous urban fabric (code 112). Communication areas related to road and rail networks and associated land (code 122) have also been developed. Industrial or commercial units (code 121), previously absent, have appeared in the catchment area, covering 3.83% of the catchment area. Other anthropogenic areas, such as airports (code 124), have also increased. No significant changes occurred among biologically active areas (after arable land). The area of forests within the catchment area has decreased slightly (3).
Using the cartographic visualization of the land permeability of the Michałówka catchment, it was found that out of four classes of permeability distinguished in the catchment, there was no clear dominance of any of them. Almost the same share, about 30%, was characterized by medium- and low-permeability soils (group B and group C). A not much smaller share, 22.12%, was characteristic of soils from group D with different permeability, which occurred on anthropogenic soils transformed by human activity. Easily permeable soils (group A) constituted 13.69% of the catchment area (Figure 4).

3.2. Input Parameters Necessary for Modeling

Changes in the land use of the catchment area that occurred over the 78 years analyzed significantly affected the infiltration and retention conditions of the catchment, which directly affected the change in the intensity of flows in the Michałówka flow caused by precipitation with a probability of exceeding 1 and 10%. According to the methodology, the maximum precipitation values were 47.0 (P1%) and 33.1 mm (P10%) (Table 1).
The analysis of the change in land use and soil types for the Michałówka River catchment showed a powerful impact on the value of the CN parameter. The value of the CN parameter for 1940 was 72.2. However, after almost 80 years of changing land use of the catchment, an increase in the CN parameter was observed, which was 75.5. The increase in CN contributed to reducing the maximum potential retention in the catchment from 97.8 mm to 82.4 mm.
On the basis of the calculations, it was found that the retention capacity of the catchment is essential for the formation of surface runoff. During hourly rainfall with a probability of exceeding 10%, in 1940, the adequate rainfall amounted to 1.6 mm. In 2018, when the catchment’s retention capacity decreased, the same amount of rainfall forming surface runoff occurred before 30 min. In 2018, the amount of precipitation forming runoff after one hour of its duration was 2.8 mm. In addition, an increase in the proportion of sealed areas caused a smaller difference between the adequate rainfall of 1% and 10% (Table 2).
The response of the catchment to the amount of effective precipitation was checked by transforming it into surface runoff. The transformation was conducted using two models—Nash and HEC-HMS. The transformation with the Nash model was conducted, for which the parameters were calculated according to Equations (3)–(5), and the results are summarized in Table 3.
The performed modeling of the amount of water flow that can occur in the Michałówka River due to precipitation with probabilities of occurrence (1% and 10%) differed between the two study years of 1940 and 2018 (Figure 5 and Figure 6). The modeling revealed differences due to spatial changes. Namely, in the case of 2018, characterized by the higher sealing of the catchment area, higher flows were observed than in 1940, which can occur due to the same amount of precipitation. Analyzing the modeling results for 1940, a difference of 3 m3∙s−1 between the maximum flow values was observed for a probability of 1%. Higher flow values were obtained for the Nash model, which reached 13.4 m3∙s−1.
Along with the size of the flows, the time of concentration of the flood wave also changed. In this case, it was observed that the time of the culmination of the surge fell in the third hour (Nash) and fifth hour (HEC-HMS) of observation. On the other hand, for a probability of 10%, the values of the observed flow were 2.7 and 2.6 m3∙s−1 for Nash and HEC-HMS, respectively. The flow differences were lower, while the culmination time increased by 3 h (Figure 6).
As a result of changes in land use that occurred over 78 years, an increase in the value of the flow occurring with a probability of 1 and 10% was observed. In the case of the 1% probability, the increase was observed at an average of 5.6 m3∙s−1. In the case of a probability of 10%, for the Nash model, the observed increase was 0.3 m3∙s−1, while for HEC-HMS, it was 2 m3∙s−1. The HEC-HMS model was found to be more sensitive to catchment changes at the probability of 10% (Figure 6).

4. Discussion

The analysis of the impact of changes in the catchment cover on the volume of flows in the Michałówka River, using a precipitation-outflow hydrological model, is confirmed both in the global and national literature [45,48,49,50,51]. Nash and HEC-HMS models are often used for small uncontrolled river basins to analyze catchment after precipitation. Due to the type of catchment (uncontrolled catchment), it was impossible to compare the modeling results with the actual flow values found in the river. However, many authors in their studies indicate that the Nash and HEC-HMS models reproduce reality well. In this work, as in previous research [52], the size of the CN parameter was determined on the basis of the CLC database [53] state that choosing the structure of use on the basis of CLC to build the SCS-CN model is more efficient than orthophoto map analysis. In addition, the frequency of updates more accurately determines the changes’ dynamics. The SCS-CN model is a frequently used model. In recent years, this model has been used on the application of methods for hydrogram estimation and flood modelling [54]. However, other hydrological models are also used for controlled catchments [55]. Transformations in the use of the catchment area over the analyzed years because of urbanization processes resulted in a decrease in the catchment absorptive capacity. With it, the maximum potential retention decreased. For CN = 72.2, the retention was 97.8 mm, and for CN = 75.5, it was 82.4 mm. Similar values were obtained by Sojka et al. [51] for the Różny Potok watercourse in the study of the impact of the catchment sealing degree on its reaction to heavy precipitation, as well as by Kanclerz et al. [56] for the Przeźmierki catchment, determining the impact of urbanization in the suburban area on water relations in the catchments of small watercourses. Moreover, in the study by Janicka and Kanclerz [45], the impact of changes in the use of the Wirynka river basin on the size of the flood wave was observed. Modeling performed for this catchment revealed differences in the flow rate for different precipitation probabilities. Similar conclusions were reached by Alfy [57], who attended an increase in the flow volume in the river due to changes in land cover. On the other hand, [58] used the Nash model to check the catchment response to precipitation. The analysis allowed us to conclude that it allows easy modeling of water flow velocity formed in response to the amount of precipitation. On the other hand, a study by Yan [33] using the Nash model for the Qingjiang River proved that the simulated flow values stayed within the actual data. The authors concluded that in the case of forecasting hydrological phenomena, this model could be used. Due to the availability of accurate data, [33] undertook the task of determining the Nash–Sutcliffe efficiency coefficients. The values of this parameter were highly satisfactory, making the Nash model a good tool for flow forecasting. Becker [59] used the Nash model in modeling the runoff occurring in the Danube River in Austria. The authors found that the linear (Nash) modeling results were in good agreement with the observed runoff. In addition, Sahoo et al. [60] analyzed 20 flood events occurring on the Tiber River in the Umbria region of central Italy. In order to check the accuracy of the model, the authors conducted uncertainty and sensitivity analyses of model results with actual ones. The uncertainty analysis of the Nash model revealed that, at the 90% confidence interval, the Nash model solution almost matches the observed solution. In addition, Derdour et al. [39] conducted modeling using HEC-HMS for the Ain Sefra River. This modeling was performed for rainfall with 10%, 5%, 1%, and 0.1% probabilities. They observed slight differences between simulated and observed runoff due to the modeling, which may have been related to the topographic conditions of the catchment area. Yan et al. [41] state that modeling is always subject to error, and the prediction error is inevitable. However, Chen et al. [58] pointed out that this modeling may be subject to error due to data implementation and the omission of field surveys and geomorphological elements.
The model flow values obtained in this study for the two models do not show significant differences between the river water flow values, which indicates the accuracy of the models used. Unfortunately, due to the lack of archival data on the flows of the Michałówka River, it is impossible to say which of the models better represents reality.
This manuscript attempts for the first time to compare the two models of Nash and HEC-HMS. Given the lack of hydrometric data for this uncontrolled catchment, obtaining any hydrological information is extremely important. Data on 100-year or 10-year water flows are extremely important to avoid floods and major disasters in an area.

5. Conclusions

The gamma distribution is a good model for the unit hydrograph. This study investigated the gamma model’s suitability for modeling the watershed response further. It focused on the Nash and HEC-HMS as a technique for creating short-duration unit hydrographs from a parent unit hydrograph of considerable duration.
The performance of the HEC-HMS model and the Nash model for continuous runoff simulation of the Michałówka River was examined in this study. According to the sensitivity study, curve number and wave travel time were the most sensitive factors, while channel storage coefficient and lag time were moderately sensitive. During the model evaluation, the values of statistical tests of error functions revealed that the simulated runoff hydrographs were in good agreement. It implies that the model accurately predicted Michałówka watershed runoff. However, due to the nature of the catchment area (uncontrolled catchment), the project could be complemented by conducting field studies (installing a flowmeter) to compare model data with actual data, which is planned as the next step in this study area. The current project covered the years 1940 to 2018.
Nevertheless, this work fills a certain gap in the access to hydrological data of uncontrolled catchments. Modeling the flow is in this case the only possibility to obtain data for the river (in the absence of hydrometric measurements). This work can be used to model flow for other rivers. The modeling performed in this work has never been analyzed in the context of this river. This made it possible to supplement the hydrological information about the catchment area of the Michałówka River. This paper is a comparison of two Nash and HEC-HMS models, and it should be emphasized that no comparison of these models has been made so far, especially in the context of the uncontrolled catchment.

Author Contributions

Conceptualization, E.J. and J.K.; methodology, E.J. and J.K.; software, E.J. and K.G.; validation, E.J. and K.G.; formal analysis, E.J., J.K. and K.G.; investigation, E.J.; resources, E.J. and K.G.; data curation, E.J.; writing—original draft preparation, E.J. and T.A.; writing—review and editing, E.J. and T.A.; visualization, E.J.; supervision, E.J. and T.A.; project administration, E.J.; funding acquisition, J.K. All authors have read and agreed to the published version of the manuscript.

Funding

The publication was co-financed/financed within the framework of the Ministry of Science and Higher Education program “Regional Initiative Excellence” in the years 2019–2022, project no. 005/RID/2018/19.

Institutional Review Board Statement

Not applicable.

Informed Consent Statement

Not applicable.

Data Availability Statement

The datasets used and analyzed during the current study are available from the corresponding authors upon reasonable request.

Conflicts of Interest

The authors declare no conflict of interest. The funders had no role in the design of the study; in the collection, analyses, or interpretation of data; in the writing of the manuscript; or in the decision to publish the results.

References

  1. Sood, A.; Smakhtin, V. Global hydrological models: A review. Hydrol. Sci. J. 2015, 60, 549–565. [Google Scholar] [CrossRef]
  2. Dong, C. Remote sensing, hydrological modeling and in situ observations in snow cover research: A review. J. Hydrol. 2018, 561, 573–583. [Google Scholar] [CrossRef]
  3. Dhami, B.S.; Pandey, A. Comparative Review of Recently Developed Hydrologic Models. J. Indian Water Resour. Soc. 2013, 33, 34–41. [Google Scholar] [CrossRef]
  4. Nega, H. Regionalization of mean annual flow for ungauged catchments (Case study: Abbay River Basin). Model. Earth Syst. Environ. 2019, 7, 341–350. [Google Scholar] [CrossRef]
  5. Mulugera, M. Runof estimation by Giuh based Clark and Nash Model for Shaya River 58, 2 [Addis Ababa University, AAIT]. 2013. Available online: http://etd.aau.edu.et/bitstream/handle/123456789/9863/Mulugeta%20Mussie.pdf?sequence=1&isAllowed=y (accessed on 28 January 2023).
  6. Lemma, M. Sediment yield modeling using swat, case study of Upper Awash Basin. Master’s Thesis, Addis Ababa University, Addis Ababa, Ethiopia, 2018. [Google Scholar]
  7. Behailu, S. Stream Flow Simulation for Stream Flow Simulation for. Master’s Thesis, Addis Ababa University, Addis Ababa, Ethiopia, 2004. [Google Scholar]
  8. Won, Y.M.; Lee, J.H.; Moon, H.T.; Moon, Y.I. Development and Application of an Urban Flood Forecasting and Warning Process to Reduce Urban Flood Damage: A Case Study of Dorim River Basin. Seoul Water 2022, 14, 187. [Google Scholar] [CrossRef]
  9. Schanze, J.; Hutter, G.; Offert, A.; Penning-Rowsell, E.C.; Parker, D.; Harries, T.; Koniger, P. Systematisation, Evaluation and Context Conditions of Structural and Non-Structural Measures for Flood Risk Reduction. CRUE Funding Initiative on Flood Risk Management Research. 2008. Available online: https://discovery.dundee.ac.uk/en/publications/systematisation-evaluation-and-context-conditions-of-structural-a (accessed on 13 April 2023).
  10. Youssef, A.M.A.; Ibrahem, S.M.M.; El Sayed, A.N.; Masoud, M.H.Z. Assessment and management of water resources in Wadi El-Deeb using geophysical, hydrological and GIS techniques-Red Sea. J. Afr. Earth Sci. 2020, 164, 103777. [Google Scholar] [CrossRef]
  11. Guduru, J.U.; Jilo, N.B.; Rabba, Z.A.; Namara, W.G. Rainfall-runoff modeling using HEC-HMS model for Meki River watershed, rift valley basin, Ethiopia. J. Afr. Earth Sci. 2023, 197, 104743. [Google Scholar] [CrossRef]
  12. Masseroni, D.; Cislaghi, A.; Camici, S.; Massari, C.; Brocca, L. A reliable rainfall–runoff model for flood forecasting: Review and application to a semi-urbanized watershed at high flood risk in Italy. Hydrol. Res. 2017, 48, 726–740. [Google Scholar] [CrossRef]
  13. Orenstein, D.E.; Bradley, B.A.; Albert, J.; Mustard, J.F.; Hamburg, S.P. How much is built? Quantifying and interpreting patterns of built space from different data sources. Int. J. Remote Sens. 2011, 32, 2621–2644. [Google Scholar] [CrossRef]
  14. World Urbanization Prospects. 2014. Available online: https://population.un.org/wup/publications/files/wup2014-report.pdf (accessed on 28 January 2023).
  15. United Nations. United Nations Expert Group Meeting on Population Distribution, Urbanization, Internal Migration and Development. United Nations Population Division. 2008. Available online: https://sustainabledevelopment.un.org/content/documents/2529P01_UNPopDiv.pdf (accessed on 13 April 2023).
  16. Fletcher, T.D.; Andrieu, H.; Hamel, P. Understanding, management and modelling of urban hydrology and its consequences for receiving waters: A state of the art. Adv. Water Resour. 2013, 51, 261–279. [Google Scholar] [CrossRef]
  17. Du, S.Q.; Van Rompaey, A.; Shi, P.J.; Wang, J.A. A dual effect of urban expansion on flood risk in the Pearl River Delta (China) revealed by land-use scenarios and direct runoff simulation. Nat. Hazards 2015, 77, 111–128. [Google Scholar] [CrossRef]
  18. Richert, E.; Bianchin, S.; Heilmeier, H.; Merta, M.; Seidler, C. A method for linking results from an evaluation of land use scenarios from the viewpoint of flood prevention and nature conservation. Landsc. Urban Plan. 2011, 103, 118–128. [Google Scholar] [CrossRef]
  19. Li, C.; Liu, M.; Hu, Y.; Gong, J.; Xu, Y. Modeling the quality and quantity of runoff in a highly urbanized catchment using storm water management model. Pol. J. Environ. Stud. 2016, 25, 1573–1581. [Google Scholar] [CrossRef] [PubMed]
  20. Miller, J.D.; Kim, H.; Kjeldsen, T.R.; Packman, J.; Grebby, S.; Dearden, R. Assessing the impact of urbanization on storm runoff in a peri-urban catchment using historical change in Impervious Cover. J. Hydrol. 2014, 515, 59–70. [Google Scholar] [CrossRef]
  21. Ebrahimian, A.; Gulliver, J.S.; Wilson, B.N. Effective impervious area for runoff in Urban Watersheds. Hydrol. Process. 2016, 30, 3717–3729. [Google Scholar] [CrossRef]
  22. Zhang, B.A.; Xie, G.D.; Zhang, C.Q.; Zhang, J. The economic benefits of rainwater-runoff reduction by urban green spaces: A case study in Beijing, China. J. Environ. Manag. 2012, 100, 65–71. [Google Scholar] [CrossRef]
  23. Brezonik, P.L.; Stadelmann, T.H. Analysis and predictive models of stormwater runoff volumes, loads, and pollutant concentrations from watersheds in the twin cities metropolitan area, Minnesota, USA. Water Res. 2002, 36, 1743–1757. [Google Scholar] [CrossRef]
  24. Fan, F.; Deng, Y.; Hu, X.; Weng, Q. Estimating composite curve number using an improved SCS-CN method with remotely sensed variables in Guangzhou, China. Remote Sens. 2013, 5, 1425–1438. [Google Scholar] [CrossRef]
  25. USDA-SCS (Soil Conservation Service). National Engineering Handbook. Sec. 4; Hydrology: Washington, DC, USA, 1972. [Google Scholar]
  26. ASCE—American Society of Civil Engineers. Curve Number Hydrology: State of the Practice; Hawkins, R.H., Ward, T.J., Woodward, D.E., Van Mullem, J.A., Eds.; American Society of Civil Engineers: Reston, VI, USA, 2009. [Google Scholar]
  27. Cacal, J.C.; Austria, V.C.A.; Taboada, E.B. Extreme Event-based Rainfall-runoff Simulation Utilizing GIS Techniques in Irawan Watershed, Palawan, Philippines. Civ. Eng. J. 2023, 9, 220–232. [Google Scholar] [CrossRef]
  28. Diskin, M.H.; Ince, M.; Kwabena, O.N. Parallel cascades model for urban watersheds. J. Hydraul. Div. 1978, 104, 261–276. [Google Scholar] [CrossRef]
  29. Bhunya, P.K.; Ghosh, N.C.; Mishra, S.K.; Ojha CS, P.; Berndtsson, R. Hybrid model for derivation of synthetic unit hydrograph. J. Hydrol. Eng. 2005, 10, 458–467. [Google Scholar] [CrossRef]
  30. Singh, P.K.; Bhunya, P.K.; Mishra, S.K.; Chaube, U.C. An extended hybrid model for synthetic unit hydrograph derivation. J. Hydrol. 2007, 336, 347–360. [Google Scholar] [CrossRef]
  31. Bhunya, P.K.; Singh, P.K.; Mishra, S.K.; Panigrahy, N. A variable storage coefficient model for rainfall–runoff computation. Hydrol. Sci. J. 2008, 53, 338–352. [Google Scholar] [CrossRef]
  32. Kurnatowski, J. Technical note: Cascade of submerged reservoirs as a rainfall–runoff model. Hydrol. Earth Syst. Sci. 2017, 21, 4649–4661. [Google Scholar] [CrossRef]
  33. Yan, B.; Guo, S.; Liang, J.; Sun, H. The generalized Nash model for river flow routing. J. Hydrol. 2015, 530, 79–86. [Google Scholar] [CrossRef]
  34. Kalinin, G.P.; Milyukov, P.I. On the computation of unsteady flow in open channels. Met. Gidrol. 1957, 10, 10–18. [Google Scholar]
  35. Ramesh, V. Application of the HEC-HMS Model for Runoff Simulation in the Krishna Basin. Master’s Thesis, National Institute of Technology Karnataka, Karnataka, India, 2017. [Google Scholar] [CrossRef]
  36. US Army Corps of Engineers. Hydrologic Modeling System (HEC-HMS) Applications Guide: Version 3.1.0; Institute for Water Resources, Hydrologic Engineering Center: Davis, CA, USA, 2008.
  37. Halwatura, D.; Najim, M. Application of the HEC-HMS model for runoff simulation in a tropical catchment. Environ. Model. Softw. 2013, 46, 155–162. [Google Scholar] [CrossRef]
  38. Hoogestraat, G.K. Flood Hydrology and Dam-Breach Hydraulic Analyses of Four Reservoirs in the Black Hills, South Dakota; Scientific Investigations Report for U.S. Geological Survey: Reston, VA, USA, 2011; p. 37. Available online: https://pubs.usgs.gov/sir/2011/5011/pdf/sir2011-5011.pdf (accessed on 15 January 2023).
  39. Derdour, A.; Bouanani, A.; Babahamed, K. Modelling rainfall runoff relations using HEC-HMS in a semi-arid region: Case study in Ain Sefra watershed, Ksour Mountains (SW Algeria). J. Water Land Dev. 2018, 36, 45–55. [Google Scholar] [CrossRef]
  40. Kozlov, D.V.; Ghebrehiwot, A.A. Efficacy of digital elevation and Nash models in runoff forecast. Mag. Civ. Eng. 2019, 3, 103–122. [Google Scholar] [CrossRef]
  41. Yan, B.; Huo, L.; Liang, J.; Yang, W.; Zhang, J. Discretization of the generalized Nash model for flood routing. J. Hydrol. Eng. 2019, 24, 04019029. [Google Scholar] [CrossRef]
  42. Diagnosis of the State of the Commune. Study of Conditions and Directions of Spatial Development of the Kleszczewo Commune. Diagnoza Stanu Gminy. Studium Uwarunkowań I Kierunków Zagospodarowania Przestrzennego Gminy Kleszczewo. Available online: http://bip.kleszczewo.pl/?p=document&action=show&id=9644&bar_id=4674 (accessed on 13 April 2023). (In Polish).
  43. Local Government. Newspaper of the Residents of the Kleszczewo Commune. Samorząd. Gazeta Mieszkańców Gminy Kleszczewo. Available online: https://docplayer.pl/207106622-Nr-1-2-203-styczen-luty.html (accessed on 13 April 2023). (In Polish).
  44. Licznar, P.; Kotowski, A.; Siekanowicz-Grochowina, K.; Oktawiec, M.; Burszta-Adamiak, E. Empirical Verification of Bog-danowicz-Stachý’s Formula for Design Rainfall Intensity Calculations. Ochr. Środowiska 2018, 40, 21–28. (In Polish) [Google Scholar]
  45. Janicka, E.; Kanclerz, J. Assessing the Effects of Urbanization on Water Flow and Flood Events Using the HEC-HMS Model in the Wirynka River Catchment. Water 2023, 15, 86. [Google Scholar] [CrossRef]
  46. Sikorska, A.; Banasik, K. Parameter identification of a conceptual rainfall-runoff model for a small urban catchment. Ann. Warsaw Univ. Life Sci. SGGW. Land Reclam. 2010, 42, 279–293. [Google Scholar] [CrossRef]
  47. Rao, R.A.; Delleur, J.W.; Sarma, B.S. Conceptual hydrologic models for urbanizing basins. J. Hydraul. Div. 1972, 98, 1205–1220. [Google Scholar] [CrossRef]
  48. McColl, C.; Aggett, G. Land-use forecasting and hydrologic model integration for improved land-use decision support. J. Environ. Manag. 2007, 84, 494–512. [Google Scholar] [CrossRef]
  49. Manan, E.A.; Hassan, A.J. Correlation between runoff volume and land use changes using SCS-CN method for Sungai Gombak catchment. IOP Conf. Ser. Earth Environ. Sci. 2020, 476, 12120. [Google Scholar] [CrossRef]
  50. Hassan, S.; Sebastian, S.; Maharjan, S.; Lesha, A.; Carpenter, A.M.; Liu, X.; Zarrinpar, A. Liver-on-a-chip models of fatty liver disease. Hepatology 2020, 71, 733. [Google Scholar] [CrossRef]
  51. Sojka, M.; Murat-Błażejewska, S.; Wróżyński, R. Prognoza wpływu realizacji zapisów miejscowych planów zagospodarowania przestrzennego na wzrost przepływów wezbraniowych, Monografia Komitetu Gospodarki Wodnej. Monogr. Kom. Gospod. Wodnej Pol. Akad. Nauk. 2014, 20, 155–164. (In Polish) [Google Scholar]
  52. Holeksa, S.; Raciok, M.; Absalon, D. Wpływ urbanizacji na zmiany hydrogramu odpływu w zlewni żylicy (beskidy zachodnie), Badania Fizjograficzne. Geogr. Fiz. 2017, 68, 149–157. (In Polish) [Google Scholar]
  53. Borowicz, E.; Kozak, M.; Madzia, M. Wpływ metody pozyskiwania informacji o zagospodarowaniu terenu na wartość wyznaczonego opadu efektywnego. Nauka Przyr. Technol. 2011, 5, 65. (In Polish) [Google Scholar]
  54. Tufano, R.; Guerriero, L.; Annibali Corona, M.; Cianflone, G.; Di Martire, D.; Ietto, F.; Calcaterra, D. Multiscenario flood hazard assessment using probabilistic runoff hydrograph estimation and 2D hydrodynamic modelling. Nat. Hazards 2023, 116, 1029–1051. [Google Scholar] [CrossRef]
  55. Rashid, A.A.; Liang, Q.; Dawson, R.J.; Smith, L.S. Calibrating a high-performance hydrodynamic model for broad-scale flood simulation: Application to Thames Estuary, London, UK. Procedia Eng. 2016, 154, 967–974. [Google Scholar] [CrossRef]
  56. Kanclerz, J.; Murat-Błażejewska, S.; Dragon, K.; Birk, S. Wpływ urbanizacji w strefie podmiejskiej na stosunki wodne w zlewniach małych cieków. Ecol. Eng. 2016, 46, 94–99. (In Polish) [Google Scholar]
  57. El Alfy, M. Assessing the impact of arid area urbanization on flash floods using GIS, remote sensing, and HEC-HMS rainfall–runoff modeling. Hydrol. Res. 2016, 47, 1142–1160. [Google Scholar] [CrossRef]
  58. Chen, Y.; Shi, P.; Qu, S.; Ji, X.; Zhao, L.; Gou, J.; Mou, S. Integrating XAJ model with giuh based on Nash model for rainfall-runoff modelling. Water 2019, 11, 772. [Google Scholar] [CrossRef]
  59. Becker, A.; Kundzewicz, Z.W. Nonlinear flood routing with multilinear models. Water Resour. Res. 1987, 23, 1043–1048. [Google Scholar] [CrossRef]
  60. Sahoo, B.; Perumal, M.; Moramarco, T.; Barbetta, S.; Sahoo, S. A multilinear discrete Nash-cascade model for stage-hydrograph routing in compound river channels. Hydrol. Sci. J. 2020, 65, 335–347. [Google Scholar] [CrossRef]
Figure 1. Location of the Michałówka River catchment area.
Sustainability 15 07959 g001
Figure 2. Methodology flow chart for modeling.
Sustainability 15 07959 g002
Figure 3. Land use of the Michałówka catchment of two years (1940 and 2018).
Sustainability 15 07959 g003
Figure 4. Soil types for the Michałówka River catchment area.
Sustainability 15 07959 g004
Figure 5. Hydrograph of the Michałówka River flows caused by precipitation with the probability of exceeding 1 and 10% in the year 1940.
Sustainability 15 07959 g005
Figure 6. Hydrograph of the Michałówka River flows caused by precipitation with the probability of exceeding 1 and 10% in the year 2018.
Sustainability 15 07959 g006
Table 1. Amount of forecasted rainfall.
Time of PrecipitationPrecipitation P1%Precipitation P10%
ΔP (mm)Sum ∆P (mm)ΔP (mm)Sum ∆P (mm)
P1 (15 min)7.8 7.8 5.5 5.5
P2 (30 min) 25.1 32.9 17.6 23.1
P3 (45 min) 7 39.9 5 28.1
P4 (60 min) 7 47 5 33.1
Table 2. The amount of adequate precipitation with the probability of exceeding 1% and 10% of the catchment area of the Michałówka watercourse for the years 1940 and 2018.
Time of
Precipitation
Effective Precipitation P1%Effective Precipitation P10%
ΔP (mm) Sum ΔP (mm) ΔP (mm) Sum ΔP (mm)
The year 1940
P1 (15 min) 1.0 1.0 0.3 0.3
P2 (30 min) 3.2 4.2 0.9 1.2
P3 (45 min) 0.9 5.1 0.2 1.4
P4 (60 min) 0.9 6.0 0.2 1.6
The year 2018
P1 (15 min) 1.4 1.4 0.5 0.5
P2 (30 min) 4.4 5.8 1.5 2.0
P3 (45 min) 1.2 7.0 0.4 2.4
P4 (60 min) 1.2 8.3 0.4 2.8
Table 3. Calculated parameters of the Nash model for the catchment area of the Michałówka watercourse for the years 1940 and 2018.
P1%, 60 minP10%, 60 min
1940 2018 1940 2018
LAG (h) 4.39 4.03 6.23 5.4
k (h) 2.03 1.96 2.33 2.21
N (-) 2.16 2.06 2.66 2.45
Disclaimer/Publisher’s Note: The statements, opinions and data contained in all publications are solely those of the individual author(s) and contributor(s) and not of MDPI and/or the editor(s). MDPI and/or the editor(s) disclaim responsibility for any injury to people or property resulting from any ideas, methods, instructions or products referred to in the content.

