
Evaluation of Railway Systems: A Network Approach


1
Department of Statistics and Quantitative Methods, University of Milano-Bicocca, Via Bicocca degli Arcimboldi 8, 20126 Milano, Italy
2
Department of Law, Economics and Cultures, Università degli Studi dell’Insubria, Via Sant’Abbondio 12, 22100 Como, Italy
*
Author to whom correspondence should be addressed.
†
These authors contributed equally to this work.
Sustainability 2023, 15(10), 8056; https://doi.org/10.3390/su15108056
Submission received: 14 April 2023
/
Revised: 11 May 2023
/
Accepted: 11 May 2023
/
Published: 15 May 2023
(This article belongs to the Section Sustainable Transportation)
Abstract
:Resilience and the efficiency of transportation systems are crucial for the economic development of geographical areas, and network analysis applied to railways can provide insight into the importance of branch lines and their impacts on the entire system. This paper explores the behavior of the ERC measure, a local robustness measure, on the railway network in Lombardy, Italy, and analyzes the impacts of deactivating stations or journeys on the network’s robustness. Changes in the topological properties of the network were studied by simulating potential external disturbances and analyzing the impact of deleting the most connected stations or railway lines. The numerical results show how the measures provided effectively identify critical stations and journeys within the network structure and outperform classical topological metrics. Since ERC measures take into account all of the alternative paths present in the network, they can provide valuable information for rerouting traffic along alternative paths in case of failures or disruptions. The paper’s original contribution lies in demonstrating the effectiveness of the ERC measure in identifying critical stations and journeys within the network structure.
1. Introduction
Railway networks are complex systems that are vulnerable to disruptions caused by natural disasters, human errors, and deliberate attacks. Given the critical role played by railway networks in transporting people and goods, ensuring their resilience is of utmost importance. In general, resilience refers to a system’s ability to cope with, adapt to, and recover from disruptions, disturbances, and failures, while maintaining essential functions. The resilience assessment can be conducted through various methods, including mathematical optimization, data-driven approaches, and network science-based quantification. Moving on to the latter framework, many measures have been proposed for assessing resilience by looking at the network topology. Some of these measures include degree centrality, betweenness centrality, clustering coefficient, and the average path length, which provide insights into different aspects of network structures and functions. Such metrics present some limitations because they only consider the shortest connections between nodes within the network, without taking into account potential alternative routes or modes of transport. Moving in such a framework, this paper proposes an assessment of railway network resilience by means of a local robustness measure, called the effective resistance centrality () of an edge or a vertex, which is able to capture the effect of either a specific vertex or a specific edge on the network’s robustness. In fact, both stations and tracks can be put out of service due to natural, technical, or social hazards, and the use of allows us to provide a comprehensive importance measure method in order to assess the relevance of railway lines and stations. Since the degree to which a networked system continues to function typically depends on the integrity of the underlying network, the topic of system robustness is usually addressed by analyzing how the network structure changes as vertices (or edges) are removed.
The proposed approach allows for identifying critical vertices (or edges) and it can be useful for planning response plans, such as rehabilitation or restoration of the disrupted links. In this paper, we perform an empirical application and explore the behaviors of measures by using the railway network of Lombardy, the Italian region with the most diffused rail network in the country. We focus our attention on Lombardy because of the high volume of data and because this region has the highest number of train journeys in Italy. The analysis is based on official rail performance data derived from Viaggiatreno.it (accessed on 10 May 2023), the Italian official website that presents a live timeline of the railways; to present a complete picture of this reality with the actual number of journeys, the data are related to the period October–November 2020. The data-selection process for the Lombardy railway network involved gathering information from official channels and maps provided by Trenord ([1]) and Rete Ferroviaria Italiana (RFI) ([2]). The analysis is based on stations (vertices) and journeys (edges) that are effectively present in the official documents of the regional and national railway transport companies. The selection of the specific vertex under scrutiny is derived from the vertices present on the railway map used, and, therefore, it cannot be defined as an exhaustive representation of the entire regional network (considering all stations) due to the fact that the official network provides a partial representation of all the vertices. Moreover, as explained in a subsequent paragraph of this work, we categorized all of the vertices (following the official Italian classification) and calculated the effective number of journeys (for both directions), for a working day, between the considered vertices. The study’s research questions were formulated based on the rationale mentioned above:
- How effective is the proposed ERC measure, compared to classical topological metrics, in identifying critical stations and journeys within a railway network?
- What are the most important station and railway line connections that contribute to the overall efficiency and resilience of the Lombardy railway network?
The study shows that the ERC measure can provide useful insights into the robustness of railway networks and it highlights the importance of considering geographical positions in a network analysis. This offers a more comprehensive and integrated approach to measuring the importance of railway network components, filling a research gap in the literature. The main results show how the provided measure enables the identification of critical stations and journeys within the network structure. Additionally, we find consistency with the classification provided by the network manager (as sustained in the report [3]). Furthermore, the geographical positions of some less relevant stations are critical for the connection of the overall network, and their disconnections can compromise the stability and communication of a significant portion of the Lombardy railway stations. Considering the limitations, it is possible to highlight two factors: the first is the geography aspect, which is not fully representative of the entire set of railway stations of Lombardy (more than 400), and the second is represented by data availability, which limits the concentration of the Milan node in only two stations.
The remainder of this paper is organized as follows. In Section 2, a literature review is provided. In Section 3, some preliminaries on the graph theory and an overview of the effective resistance centrality are presented. In Section 4, the implemented methodology is described. We provide a structural description of the Lombardy railway network in Section 5. In Section 6, based on 2020 data, the role and significance that stations play in maintaining the structure of the entire network are investigated. A consistent comparison with several well-known topological measures is provided by assessing the vertex importance in order to show how the proposed measure seems to be more sensitive at capturing the network’s behavior after removing the vertices or edges (topological changes in the structure). Conclusions, further developments, and limitations follow.
2. Literature Review
The vulnerability and resilience of transportation networks, especially railways, have received significant attention in recent literature due to the potential for disruptions and degraded functionality that negatively impact urban areas and associated communities, causing severe economic damages (see, among others, [4,5,6,7,8,9,10,11,12]). Previous research has predominantly focused on the vulnerability of railway networks during incidents, as measured by the susceptibility to incidents that result in a significant reduction in network serviceability [13]. For an exhaustive literature review, see [14]. Studies have used the complex network theory to explore the vulnerability of railway networks under topological changes. These studies have proposed a variety of measures to quantitatively assess network topology and evaluate the impacts of removing vertices and edges from the network. Moreover, they compared the pre-disaster values to those in degraded states ([15,16,17,18]). These measures include centrality measures (e.g., degree, betweenness, closeness), regularity measures (e.g., transitivity, clustering coefficients), efficiency measures (e.g., efficiency, costs), connectivity measures (e.g., connectivity, number of clusters, cluster size), residual closeness, and spectral graph measures. Another measure suitable in this context is the residual closeness, provided in [19], which captures the results of actions (deleting vertices or edges), even if they are small enough not to disconnect the graph. Moreover, spectral graph measures are exploited in this setting by looking at the connection between the eigenvalues of a matrix associated with a graph and the corresponding structures of a graph (see [20,21]). However, there is no general method to measure the importance of railway network components. For instance, in [22], only edge importance is measured, while only vertex importance is measured in [13]. Indeed, there is limited research specifically focused on local robustness measures for railway networks. Within this context, the effective resistance centrality has been proposed as a local indicator for assessing robustness in the network analysis. This centrality metric has been shown to be suitable, with respect to classical metrics, such as betweenness and degree centrality, and in terms of its ability to capture the local properties of networks. Specifically, effective resistance centrality can catch the localized impact of the node or edge removal on network resilience, providing a more nuanced understanding of network robustness. Overall, the use of effective resistance centrality as a local indicator has contributed to a deeper analysis of network robustness and the potential impacts of damage or disruptions in specific parts of the network. Furthermore, since is not based on the shortest paths, such as classical metrics, but takes into account all of the alternative paths present in the network, it could be informative in order to reroute traffic along alternative paths, in case of failure or disruption. The analysis of backup possibilities is crucial in designing and evaluating resilient networks. Therefore, the development of a general method for measuring the importance of individual components of a railway network remains an area of active research. Overall, recent literature has highlighted the critical nature of transportation networks, particularly railways, and the need for ongoing efforts to assess and enhance their resilience in the face of potential disruptions.
3. Theoretical Background
3.1. Some Preliminaries on Graph Theory
Let us firstly recall some standard definitions and results about the graph theory (for more details, see [23,24,25]).
A graph involves a pair of sets , where is the set of vertices and E is the set of edges. Let us consider graphs with fixed-order and fixed-size .
An undirected graph is a graph in which if , then , whereas a directed graph (digraph) is a graph in which each edge (arc) is an ordered pair of vertices. The edge connecting vertices i and j is denoted by . Two vertices are called adjacent if they are connected by an edge. A loop is a degenerate edge of a graph, which joins a vertex to itself (also called a self-loop). Multiple edges are two or more edges connecting the same two vertices i, j. In the sequel, we will not consider self-loops and multiple edges. Moreover, we have a weighted graph when each edge is assigned a weight . Furthermore, the so-called strength of a vertex i, denoted by , is equal to the sum of the weights of the edges adjacent to it.
A simple graph is an unweighted, undirected graph containing no graph loops or multiple edges. A path is a sequence of distinct adjacent vertices from vertex i to vertex j. The distance between i and j is the length of the shortest path joining them when such a path exists, and it is set to , otherwise. A graph G is connected if there is a path between every couple of vertices. A subgraph = of G is a graph, such that and . A particular class of subgraphs is one of the induced subgraphs. A subgraph of G is induced by when implies , for each vertex .
A maximal connected subgraph of is called the connected component of G.
A graph is connected if it has exactly one connected component.
A connected graph G is said to be k-edge-connected if it remains connected whenever fewer than k edges are removed. A connected graph G is said to be k-vertex-connected (or k-connected) if it has more than k vertices and remains connected whenever fewer than k vertices are removed.
A cut vertex is a vertex whose deletion increases the number of components. Similarly, an edge is called a bridge (or cut edge) if its deletion increases the number of components.
Let us denote the degree sequence of G as arranged in a non-increasing order, such that , with being the degree of vertex i.
We can associate a non-negative n-square matrix to the graph, representing the adjacency relationships between vertices of G, which is called the adjacency matrix; the off-diagonal elements of are equal to 1 if vertices i and j are adjacent, and 0 otherwise; if the graph has self-loops, the corresponding diagonal elements of A are equal to 1. Given the diagonal matrix of vertex degrees, the Laplacian matrix of G is defined as . Considering a graph G with non-negative edge weights , we denote by the weighted adjacency matrix and the weighted Laplacian matrix by , where is the diagonal matrix of strengths, with elements . To summarize, the elements of the weighted Laplacian are given by
Since the weighted Laplacian matrix is symmetric, positive semidefinite, and the rows sum up to 0, this entails that its eigenvalues are real, non-negative, and the smallest eigenvalue is zero. Hence, we can order the eigenvalues and denote them as for , such that .
3.2. Robustness Indicators
As we already mentioned throughout the paper, a very important issue regarding complex networked systems is indeed the robustness of the overall system to the failure of its constituent parts (see [26]). Recently, a graph measure called the effective graph resistance, also known as the Kirchhoff index, denoted by (for more details, see [27,28,29]), has received growing interest in network robustness research. In [30], the authors provide a novel robustness measure called effective resistance centrality, based on the Kirchhoff index. In particular, the effective resistance centrality of a vertex (or an edge) is defined as the relative drop of the Kirchhoff index induced by the deletion of this vertex (edge) from the network. This measure is a local robustness measure that is able to capture the effect of either a specific vertex or a specific edge on the network robustness.
Let us now briefly recall the definitions of the edge-based effective resistance centrality and vertex-based effective resistance centrality, as well as some of their properties.
3.2.1. Edge-Based Effective Resistance Centrality
Let be a k-edge-connected graph (with ) of n vertices and m edges, and be the graph obtained by removing the edge , connecting vertices i and j, from G.
The effective resistance centrality of the edge is defined as
It is noteworthy to say that, if G is a 1-edge-connected graph, then the resulting subgraph can be disconnected. In this case, when is a bridge, we have that . displays monotonicity with respect to edge removal.
3.2.2. Vertex-Based Effective Resistance Centrality
Let be a connected graph of n vertices and m edges and be the graph obtained by removing the vertex and all of its related connections from G.
The effective resistance centrality of the vertex is defined as
is defined by considering the numerator to be the drop of the normalized Kirchhoff index, denoted by (see, for more details, see [29]). The quantity is not always positive, because it depends on the importance of the specific vertex in the network. On the one hand, this measure enables the identification of strategic vertices whose failure could significantly impact the network’s resilience. On the other hand, it can also be utilized to identify potential vertices whose removal could enhance the robustness of the network.
4. Methodology
The aim of this work is to analyze how a vertex (station) or edge (railroad line) removal can affect the whole system. This allows us to evaluate how the Lombardy railway network is able to perform in case of the failure of a specific station or railroad line (journey). In order to investigate the effects of the changes in the topological structure of the network, we make use of the effective resistance centrality applied to both unweighted and weighted networks with characteristics that we will explain in Section 6. For the vertex-based analysis, we computed and by deactivating each station one at a time; we provided a separate analysis for those stations whose removals did not disconnect the network, and for cut vertex systems, whose deactivation led to network disconnection. We then computed and by deleting each journey (railroad line) one at a time. In what follows, we briefly summarize the steps performed in order to compute indicators for the weighted case. We:
- Compute the weighted adjacency matrix associated with the whole network;
- Calculate the weighted Laplacian matrix as indicated in formula (1);
- Compute the weighted Laplacian eigenvalues of the matrix ;
- Calculate the weighted normalized Kirchhoff index;
- Calculate the weighted normalized Kirchhoff index when a vertex or an edge is deactivated;
- Compute the weighted vertex-based , , or edge-based , ;
- Detect the most strategic stations or journeys by ranking and .
For the unweighted case, it is sufficient to use the unweighted matrices associated with the network and the normalized Kirchhoff index.
5. Research Materials
5.1. Search Strategy and Data Collection
From an overall point of view, in Italy, the lines are divided into three categories (for further information, see [31]):
- The main lines (6131 km): They have high traffic and good infrastructure quality; they include all of the main lines between the main cities of the country.
- Complementary lines, which have less traffic and are responsible for connecting medium or small regional centers. Most of these lines are single tracks and some are not electrified.
- Junction lines (936 km): Connecting complementary and essential lines near metropolitan areas.
It is important to clarify the role of lines controlled by other companies (FNM, FER, and FSE) because this work will partially deal with smaller regional lines; in the Italian railway network, these regional lines account for nearly 3000 km (see [32]). Approximately 50,000 passengers use the Intercity train every day on national connections, while 170,000 passengers utilize high-speed trains provided by Trenitalia and Italo. The numbers are increasing, but with important differences. Regarding the Intercity, between 2010 and 2018, there was a reduction of 46% in the number of passengers; on the high-speed railway operated by Trenitalia and Italo, there was an increment of 114%, according to the most recent available data (as reported by [33]). In our specific case, the data-selection process is based on the official Trenitalia website (see [34]), the official website of Trenord, which is the railway management company of the Lombardy region ([35]), the official timetable from November 2020, and the Viaggia Treno website ([36]), which provides official performance data for all daily railway journeys in Italy. It is necessary to clarify that during the current historical period, railway journeys on both the RFI lines (Trenitalia) and Ferrovie Nord lines (North Railways/FNM) have experienced decreases. The companies estimate a 12% reduction in the standard service offer (see [37]) due to the reduced flow of users, which is estimated to be around 70%. For these reasons, the current analysis is considered exhaustive for this period but does not fully represent the capabilities of the network in pre-COVID-19 pandemic times. The data-selection procedure was carried out manually; the main vertices of the railway network of the Lombardy region were analyzed by crossing these elements with the current daily railway flow (of a working day) for each considered section. It should be noted that this network is not to be considered exhaustive from a national perspective but only from a regional perspective; in fact, as we will show later, there are vertices where the lines continue to other destinations, but considering the data availability, we decided to focus our attention (and the target analysis of this paper) only on the Lombardy network, with some vertices outside of the region (under the responsibility of the Lombardy region, Trenord, and RFI), which is consistent with the geographic target, in order to have a complete and exhaustive picture of the geographical area.
To obtain a graphical picture of the network, the official map published by the official Trenitalia website (Viaggiatreno.it) was considered in order to identify the same vertices that are considered relevant by the railway company to implement this network. Figure 1 shows the official version of the network (with reference to the Lombardy region) and the work faithfully replicates, with the limitations already mentioned, this transport network.
The choice of the Lombardy region is linked to the high number of commuters and the extension of its regional railway network.
5.2. Characteristics of the Network
The Lombardy railway network has more than 1700 km of track and about 400 stations, of which, 95 serve as interchange points (see [38] for more details). In more depth, the railway lines are divided into the main lines (573 km), complementary lines (955 km), and junction lines (212 km). Furthermore, there are 859 km of double-track lines and 881 km of single-track lines. In Lombardy, the number of people who travel by train daily has reached 802,000; this represents an increase of +6.9% since 2018 and +43.4% compared to 2009, when the number was 559,000 (for further information, see [3,38]). Finally, it should be pointed out that the city of Milan is certainly the most important in Italy, considering the number of people and commuters who travel via the railway stations every day. In fact, in this region, over 800,000 people travel by train every day for work and study purposes, and a large part of these people go to Milan. These numbers are impressive and constantly growing; according to Istat, the capital is experiencing total commuting flows of 650,000 people per day (as reported by [39]). This analysis has led us to represent the city of Milan via a single large vertex. This decision was based on two primary reasons—simplicity and the availability of data. By representing the city as a single vertex, we can simplify the model, making it easier to work with, and accommodate the limited data available. While this approach may not provide a high level of granularity, it will enable us to gain valuable insights into the overall dynamics of the city. The represented network is consistent with the model provided by the official websites of the Lombardy region; in fact, we only considered the 81 railway stations that are present on the official map, rather than including all 400 railway stations that represent the entirety of the Lombardy region.
The network is symmetrized by considering, as edge weight, the exact number of trains passing through a station or originating from a station. For each vertex, the railway journeys passing through or originating from it are considered in the same way. Consequently, for each edge that connects two railway stations, both the trains passing through the two vertices, and those originating from one of the two, are considered and used for this analysis. To justify the choice of symmetrization, we applied the scaled S measure, proposed in [40], to assess whether an empirically observed network is sufficiently symmetric to justify an undirected network analysis. In our case, we have a negative value of S, providing that the network is only weakly asymmetric and an undirected network analysis is justified.
This network structure was selected due to the data availability and to have a precise representation of the network proposed by the rail carrier. Additionally, the weights were normalized by dividing them by the maximum observed value (i.e., ). To summarize, with this modality, our network has the same structure as the official Trenitalia and Trenord documents, and can be defined as comparable. The network is made up of and ; we can display a picture of our network on the map in Figure 2.
Classical indicators of the network’s structure are reported in Table 1. In particular, it could be observed that the network is very sparse. The density is very low and very few triangles are present in the network (as the average clustering coefficient shows). On average, each station is connected to another two to three stations. It is also interesting to see that although some central stations are present in the network (such as Milan, Brescia, and Pavia), there is no connection preference between high-degree and low-degree vertices. This behavior is also justified by the fact that the volatility of the degree distribution is very low with a limited range between minimum and maximum degrees (equal to 1 and 5, respectively).
5.3. Railway Services Classification
In Italy, public transport rail services are divided into four types, according to the classification provided by the RFI network manager (as sustained in the official RFI document [31,42]). Considering Lombardy, it is as follows:
- International transport: This is carried out by Trenitalia in collaboration with foreign railways, as well as by other companies, such as SNCF Voyages Italia, with the aim of connecting large international cities. EuroCity (of the Thello company) departs from Milano Centrale station and heads to Nice and Marseille; Eurocity (of SBB/FFS) departs from Milano and Venezia and heads to Geneve, Basel, and Zurich.
- Long-distance transport: This is carried out by Trenitalia with Intercity, Eurocity, Frecciabianca, Frecciargento, Frecciarossa, and Italo, in order to connect large cities.
- Regional transport: This is provided by various companies; it is based on service contracts that are stipulated by the region, partially subsidizing the costs and determining the tariffs.
- Suburban service: This is a subset of regional transport; it intends to guarantee regular journeys between Milan, the centers of its metropolitan area, and other important nearby cities, such as Lecco, Lodi, Mariano Comense, Novara, Saronno, Treviglio, and Varese.
A tender was launched for the SUB5 service, which assigned its operation to a temporary business association (ATI) comprising Trenitalia, LeNord, and ATM, which took over from Trenitalia on 1 July 2008 (for the official history, see [43]). In May 2011, an M&A took place between the Regional Passenger Division of Trenitalia and LeNord; as a result, the ATI (a temporal alliance of companies) is now made up of Trenord and ATM (as explained in [44]). The suburban and regional networks and the Milan metro network form the rail transport system of the Milanese metropolitan area. The different transport networks are distinct and recognizable outside of the stations and various stops thanks to the specific luminous signs indicating M, SUB, and R, which significantly facilitate interchange between the different systems. In our analysis, we consider only the SUB (suburban) or R (regional) railway journeys. The regional and suburban services are carried out by Trenord on RFI and FNM regional lines. It is possible to obtain a visual representation of the situation depicted in Figure 3.
Finally, to evaluate the significance attributed to the railway stations by the Italian railway network (RFI) and Ferrovie Nord (FN), four official parameters are used (for further information, see [31,42,45]):
- Dimensions of the station: The set of areas and surfaces accessible and frequented by the traveler/user.
- Attendance: The number of travelers and simple frequenters who engage IN the railway system on a daily basis (from a predetermined station).
- Interchange capacity: The attitude of a railway plant to connect, interact, and operate in an integrated manner with other public transport systems.
- Level of the commercial offer: The quality of the passenger service offered by the system to customers in terms of railway traffic.
5.4. Railway Vertices Classification
The combination of parameters explained in the previous section leads to the four different levels of railway stations that are recognized by RFI:
- PLATINUM: This category includes large railway installations characterized by very high attendance (>25,000 average visitors/day) and high-quality passenger services for long, medium, and short distances.
- GOLD: This category includes medium-/large-sized railway facilities characterized by high attendance (>10,000 average visitors/day approximately) and high-quality passenger services for long, medium, and short distances.
- SILVER: This category includes systems characterized by medium/small dimensions, often without a ’travelers building’. It is only equipped with regional/metropolitan services characterized by high and consistent attendance (in some cases, >4000 average visitors/day), or stations and stops characterized by consistent attendance (>2500 average visitors/day approximately).
- BRONZE: This category includes small stations characterized by low attendance (generally <500 average visitors/day), without a travelers’ building; it is equipped with services for regional/local traffic.
As a result, we will use these levels as parameters in our work, considering them as distinctive elements for our nodes, which will also be analyzed in terms of their official importance provided by the railway network operator.
In conclusion, with these parameters, in this network, there are 5 PLATINUM stations, 27 GOLD stations, 38 SILVER stations, and 11 BRONZE stations. Considering the strengths and the number of connections between these railway stations, the greatest journey and connection numbers are in the PLATINUM stations and the least are in the BRONZE stations. This element is very important to confirm the classification proposed by Trenitalia, which is also valid for this paper; in fact, when the level of importance of the railway station increases, the number of journeys increases.
6. Numerical Results and Discussion
As previously explained, using the websites Viaggiatreno.it, Trenord.it, Trenitalia.it, it was possible to obtain a complete picture of the journeys between the vertices proposed by the official Trenitalia map. Consequently, the number of journeys to and from a determined vertex was calculated to obtain a complete dataset containing the exact number of journeys between the vertices themselves in a working day in November 2020. Furthermore, all vertices were classified using the parameters by RFI (the Italian railway network; in Italian, this is known as Rete Ferroviaria Italiana) in order to evaluate their importance. For each edge, the exact number of passing trains (in both directions) in one working day in October–November 2020 was calculated. The weighted calculations are, therefore, based on the data obtained from the Trenord and Viaggia Treno sites.
We compute the normalized Kirchhoff index for the whole network and compare it with the values of , derived by generating a network with the same characteristics and by using different well-known network models. As reported in Table 2, we obtain a value of . It is worth noting that this value is greater than the values of derived by generating a network with the same characteristics, by applying some well-known simulation models. In fact, we exploit the homogeneous structure of the random graph of the Erdős–Rényi model (see [46,47]), the heterogeneous structure of the scale-free graph of the Barabási–Albert model ([48]), and the small-world graph provided by Watts and Strogatz (see [49]). In this case, simulated networks show a higher robustness than the Lombardy railway network (note that simulated networks were derived by randomly generating 1000 graphs, with the ER, WS, and BA models, respectively. The number of vertices and edges is kept equal to the number of vertices and edges of the Lombardy railway network).
We now focus on the most relevant values of effective resistance centrality, considering the first ten elements for each category for both unweighted and weighted networks; none of the classical network models can fully describe the entire structure of this transport network.
Table 3 shows the stations with the highest vertex-based for both unweighted and weighted networks. In this table, we do not consider stations that, if removed, would result in the disconnection of the network. A dedicated focus on these stations is presented in Table 4.
The first interesting element that emerges from Table 3 involves the presence of eight stations, which are relevant in both the unweighted and weighted networks.
Firstly, from a transportation point of view, considering these data, we find relevant stations (with a large number of trains and passengers per weekday) and some less relevant railway stations. Beginning with the unweighted side, the first element is the Codogno station; it is categorized as Gold and can be defined as a station of good importance; however, compared to the others present in this table, it is certainly an unexpected result. Checking the graph, however, its strategic position emerges within the regional railway network. In fact, it is a vertex through which several lines pass and, even if it is not a cut vertex, its elimination would create strong connection problems between the two sides of the network. Moving on to the Ponte SP station, we have a silver-level station (medium importance), which is a strategic one for the province to which it belongs, since most of the trains of that quadrant and the three railway lines pass through that station. Subsequently, a station not far from Ponte SP is Bergamo; in third place, this is a platinum railway station in one of the most relevant cities of Lombardy. Moreover, we focus our attention on Rho Fiera and Busto Arsizio, these two vertices are connected to each other, are situated in the northwest of the region, and are strategic for journeys from that part of the region. Their importance is, therefore, a confirmation of the network’s structure; eliminating these vertices would have strong repercussions on the overall rail traffic. Finally, analyzing the vertices of the unweighted network, Albate and Cava Carbonara appear in this classification. The first station is important for the city of Como and the nearby border with Switzerland; the second is a station that three railway lines use to pass through and enter (albeit, with a very low frequency). On the weighted side of the table, the first railway station is Ponte SP; in this station, although the number of trains is not at its maximum level, many routes pass through, making these vertices very important. The same reasoning applies to Bergamo; as already mentioned, it is a platinum-level station, and the number of trains passing through it is important, although the number is not very high. On this side of the table, after Codogno, three relevant vertices with very high weights emerge. In fact, Busto, Rho Fiera, and Milano Rogoredo are three hubs that overlook the city of Milan. Most of the trains coming from the northwest and south of the Milan hub pass through them. Milano Rogoredo, in particular, is the second busiest vertex in the network. This station serves as a hub for numerous long-distance and high-speed services, with trains passing through and stopping at this location. To conclude, in the previous table, two other stations (Brescia and Carnate) are considered relevant for weighted and unweighted sides. Monza (on the weighted side) is a station with a high number of trains and is close to Milan, while Desenzano, an important tourist station, joins the Brescia Verona line.
Table 4 presents the analysis of the stations that, if removed, result in a disconnection of the network for the unweighted and weighted railway networks, respectively.
If these stations are eliminated, the network becomes disconnected. It is possible to check whether the situation is rather similar, considering the weighted and unweighted scenarios. In fact, four of the first five, with different rankings, are the same for both columns (Cremona, Pavia, Piadena, and Milan). Among them, there are some busy vertices from a transportation point of view, such as Milan (regional central hub) and Pavia. Pavia is situated on a line towards Liguria and the port of Genoa. There are two other less important stations (from a transportation perspective) but they are geographically situated in the central part of the graph. In fact, Cremona and Piadena (south of the Lombardy region) are two important hubs of the network, albeit with less rail traffic. To conclude, the focus should be mandatory for Treviglio, which is in the second position on the side of the weighted cut vertices. In fact, this is a station with great importance because it is the final station of two suburban lines to and from Milan; moreover, it is located on the directrix for Verona (and, subsequently, Venice); for these reasons (also due to the number of circulating trains), its position in this ranking is not surprising.
In Table 5, edge-based values are presented for both unweighted and weighted networks. In this case, the railroad lines are analyzed. The results expressed in the following table can help us to understand the actual importance of edges through the value of the index.
Regarding the unweighted network, there are strategic lines (Bergamo–Ponte SP, Busto–Gallarate, Milan–Milan Rogoredo, Novara–Rho Fiera), which can be considered as very relevant for the regional transportation railway network. Without them, there would be heavy repercussions on rail traffic for relevant parts of the regional and suburban lines passing through these edges and vertices. Furthermore, some parts of the network do not seem to be strategically relevant, but they are linked to crucial stations where numerous lines nearly intersect (e.g., Codogno–Cremona, Mantova–Piadena, and Mortara–Novara). The computation of highlights the presence of the station of Treviglio, which appears in the first two considered edges. It is relevant because this station serves as both a junction for several lines and a transit section for trains coming from the east of the region. Subsequently, three edges include the stations already mentioned in previous analyses, although not altogether relevant from the transport point of view, in this analysis, these vertices have assumed high importance. In fact, Bergamo–Ponte SP, Mantova–Piadena, and Codogno–Cremona are crucial points in the analyzed network. Moreover, we observe the significance of the Milan hub and the routes coming from the northwest of the region (Busto–Gallarate and Rho Fiera–Novara), where the daily number of railway journeys is particularly relevant. Finally, let us consider the east side of the network, where the railway station of Desenzano is situated. It is a significant vertex that connects two sections of the graph (Brescia–Desenzano and Desenzano–Verona) and is located on the same east–west route as Treviglio, suggesting the strategic importance of that part of the network.
In Figure 4, we shed light on the most critical edges, as shown in the aforementioned analysis.
In Table 6, the stations (both cut vertices and non-cut vertices) ranked with different centrality measures are reported.
It is noteworthy that the most relevant stations, according to the classification provided by Trenitalia, are detected by , while the other measures classify some of them in the bottom ranking. In fact, there are only three “platinum” stations in Lombardy, and they are all included in the top 15 stations by , while betweenness centrality, eigenvector centrality, and residual closeness do not consistently provide clear distinctions among them.
In order to highlight this aspect, in Figure 5, we report the correlation between the rankings of the above-mentioned measures. It is worth pointing out that has a weak correlation with the other measures, as shown in Table 6, while the residual closeness has a positive strong correlation with betweenness centrality, indicating a similar classification of the station importance/centrality. Finally, residual closeness has a negative correlation with eigenvector centrality.
It is noteworthy to highlight that, in this classification, all of the platinum stations in the Lombardy region are presented. Moreover, stations in Bologna and Verona, classified as platinum by Trenitalia, belong to the network, but these stations do not appear in the top ranks. This is explained by the fact that only trains that start or end in Lombardy were considered; therefore, Bologna and Verona, which fall outside of the region, have limited effects on the resilience of the network.
Table 7 summarizes the average values for different centrality measures for the groups identified by Trenitalia classification. It can be seen that the ranking provided by follows the exact same ordering.
The results that emerge from this analysis can be used for a variety of purposes. One important use of the analysis is to identify topological vulnerabilities in the network, which can help with decisions about where to allocate resources for maintenance and upgrades. This can help reduce the risk of disruptions in the transportation sector and improve overall efficiency and reliability. Another important use of the analysis is to identify potential choke points or critical nodes in the network, which can help with emergency planning and response. By understanding the network’s resilience, emergency responders can more effectively prepare for and respond to disruptions, minimizing the impacts on passengers and freight. Finally, an understanding of network resilience can also contribute to more sustainable and environmentally friendly transportation systems. This is because a more resilient network can lead to reduced energy consumption and emissions, as disruptions and delays can lead to increased fuel consumption and emissions. Overall, the results of the resilience analysis can be a valuable tool for optimizing the performance and reducing the risk of disruptions in the transportation sector. The analysis provides valuable insights that can help decision-makers make informed decisions about maintenance and upgrades, emergency planning, response, and environmental sustainability.
7. Conclusions
The issue of mobility is one of the most complex dilemmas in contemporary society. In fact, the growing desire for mobility is offset by the aim to reduce the negative impact that is based on the utilization of environmental and natural resources. The improvement of quality of life and health, along with the sustainable utilization of the territory, are the primary objectives in the current discourse on this topic. It is feasible to make a significant contribution to the reduction of pollution and climate change impacts by enhancing the proportion of journeys that exhibit high environmental performances, such as rail transport, collective road transport, or shared systems. For the rail transport sector, it is imperative to adopt measures that promote energy efficiency, renewable energies, and modal shifts towards eco-friendly transportation. To achieve an optimal and productive rail transport system, it is necessary to establish a network structure that organizes all stations with varying commuter flows, taking into account the previous elements. This study focuses on evaluating the robustness of the rail network in the Lombardy region, particularly the significance of stations located on primary and secondary lines serviced by Trenord and Trenitalia. Hierarchical classifications suggested by network managers (RFI-FNM) were also utilized in the assessment. This analysis was carried out using a local robustness measure, the effective resistance centrality, which enabled us to catch the peculiar characteristics and the strategic roles of different stations and journeys in the Lombardy railway network. The results offer several elements to analyze the structure of the network in terms of the sensitivity of the network to critical edges (journeys) and vertex (station) deletions. Firstly, when we examine the hierarchical classification of the stations established by network managers, a correlation can be observed between the number of trains and the level of significance. Additionally, we emphasize the importance of a station’s placement in the railway network, regardless of how it is perceived by the network manager as strategically valuable or not, such as with Codogno. This is because a station may be situated on multiple lines, and its removal could result in significant adverse impacts on the communication between different parts of the network. Finally, we provide a comparison with other measures frequently used in the literature to assess the robustness of the networks, in order to show how the effective resistance centrality classifies the station according to the ranking provided by Trenitalia. One area that could benefit from future research is the identification of key nodes and links in transportation networks. Such an analysis could inform policymakers on where to allocate resources in times of crisis in order to maintain the network’s functionality.
8. Further Developments and Limitations
The future of railway systems is a topic of great interest, especially as society is becoming increasingly aware of the environmental and economic benefits of sustainable transportation. In order to meet the growing demand for rail travel, railway systems will need to continue to evolve and improve their infrastructure and operations. In this context, it is important to underline the possible developments of this work. Thus, it is essential that the scientific community allocate resources and research every facet of railway resilience. Railway operators can respond and recover quickly and effectively from disruptions by concentrating on short-term operational modifications. Railway companies can swiftly and efficiently manage and overcome disturbances by focusing on temporary adjustments to their operations. Moreover, the approach employed in this study could be applied to other modes of transportation, such as subways or trams, and serve as a foundation for implementing similar measures in other railway systems. Additionally, studying how different types of disruptions, such as natural disasters or cyber attacks, affect the transportation network’s resilience, can provide valuable insights for network management. In this context, the implementation of new technologies and the development of new policies to strengthen the network’s robustness are relevant steps. In terms of limitations, there are two important factors to consider. Firstly, the geography aspect must be highlighted, as the model utilized in this study is based solely on the data provided by RFI, FS, and Regione Lombardia. While the model can be applied to other regions, the results should not be regarded as conclusive for the entire Italian railway system. Secondly, the Lombardy network used in this study is not fully representative, as there are numerous stations in the region, and the network examined includes nodes that extend beyond Lombardy, into Piedmont and Veneto. Moreover, the data availability limited our results, particularly regarding the concentration of the Milan node in only two stations.
Author Contributions
Conceptualization, A.C. and D.G.; methodology, A.C.; software, D.G.; validation, A.C. and D.G.; formal analysis, A.C.; data curation, A.C. and D.G.; writing—original draft preparation, A.C. and D.G.; writing—review and editing, A.C. and D.G.; All authors have read and agreed to the published version of the manuscript.
Funding
This research received no external funding.
Institutional Review Board Statement
Not applicable.
Informed Consent Statement
Not applicable.
Data Availability Statement
Data available on request.
Conflicts of Interest
The authors declare no conflict of interest.
References
- Trenord. Trenord Website. Available online: https://www.trenord.it (accessed on 1 December 2020).
- RFI. Rete Ferroviaria Italiana. Available online: https://www.rfi.it/ (accessed on 1 December 2020).
- Pendolaria. Pendolaria 2018. Available online: https://www.pendolaria.it/wp-content/uploads/2020/02/Rapporto-Pendolaria-2018-completo.pdf (accessed on 1 December 2020).
- Bešinović, N.; Ferrari Nassar, R.; Szymula, C. Resilience assessment of railway networks: Combining infrastructure restoration and transport management. Reliab. Eng. Syst. Saf. 2022, 224, 108538. [Google Scholar] [CrossRef]
- Bhatia, U.; Kumar, D.; Kodra, E.; Ganguly, A.R. Network Science Based Quantification of Resilience Demonstrated on the Indian Railways Network. PLoS ONE 2015, 10, e0141890. [Google Scholar] [CrossRef] [PubMed]
- Cats, O.; Krishnakumari, P. Metropolitan rail network robustness. Physical A 2020, 549, 124317. [Google Scholar] [CrossRef]
- Ding, R.; Ujang, N.; Hamid, H.B.; Manan, M.S.A.; Li, R.; Albadareen, S.S.M.; Nochian, A.; Wu, J. Application of Complex Networks Theory in Urban Traffic Network Researches. Netw. Spat. Econ. 2019, 19, 1281–1317. [Google Scholar] [CrossRef]
- Erath, A.; Löchl, M.; Axhausen, K.W. Graph-theoretical analysis of the Swiss road and railway networks over time. Netw. Spat. Econ. 2009, 9, 379–400. [Google Scholar] [CrossRef]
- Ghosh, A.; Boyd, S.; Saberi, A. Minimizing effective resistances of a graph. SIAM Rev. 2008, 50, 37–66. [Google Scholar] [CrossRef]
- Khadilkar, H. Data-Enabled Stochastic Modeling for Evaluating Schedule Robustness of Railway Networks. Transp. Sci. 2016, 51, 1161–1176. [Google Scholar] [CrossRef]
- Monechi, B.; Gravino, P.; Di Clemente, R.; Servedio, V.D. Complex delay dynamics on railway networks from universal laws to realistic modelling. EPJ Data Sci. 2018, 7, 35. [Google Scholar] [CrossRef]
- Szymula, C.; Bešinović, N. Passenger-centered vulnerability assessment of railway networks. Transp. Res. Part B 2020, 224, 30–61. [Google Scholar] [CrossRef]
- Berdica, K. An introduction to road vulnerability: What has been done, is done and should be done. Transp. Policy 2002, 9, 117–127. [Google Scholar] [CrossRef]
- Bešinović, N. Resilience in railway transport systems: A literature review and research agenda. Transp. Rev. 2020, 40, 457–478. [Google Scholar] [CrossRef]
- Derrible, S.; Kennedy, C. The complexity and robustness of rail networks. Physica A 2010, 389, 3678–3691. [Google Scholar] [CrossRef]
- Dimitrov, S.; Ceder, A. A method of examining the structure and topological properties of public-transport networks. Physica A 2016, 451, 373–387. [Google Scholar] [CrossRef]
- Slater, P.J. Locating central paths in a graph. Transp. Sci. 1982, 16, 1–18. [Google Scholar] [CrossRef]
- Zhang, X.; Miller-Hooks, E.; Denny, K. Assessing the role of network topology in transportation network resilience. J. Transp. Geogr. 2015, 46, 35–45. [Google Scholar] [CrossRef]
- Dangalchev, C. Residual closeness. Physica A 2006, 365, 556–564. [Google Scholar] [CrossRef]
- Bonacich, P.; Loloyd, P. Eigenvector-like measures of centrality for asymmetric relations. Soc. Netw. 2001, 23, 191–201. [Google Scholar] [CrossRef]
- Ellens, W.; Spieksma, F.; Van Mieghem, P.; Jamakovic, A.; Kooij, R. Effective graph resistance. Linear Algebra Its Appl. 2011, 435, 2491–2506. [Google Scholar] [CrossRef]
- Bababeik, M.; Khademi, N.; Chen, A.; Nasirie, M.M. Diversity of graphs with highly variable connectivity. Transp. Res. Procedia 2017, 22, 275–284. [Google Scholar] [CrossRef]
- Bollobás, B.; Erdös, P. Graphs of extremal weights. Ars Comb. 1998, 50, 225–233. [Google Scholar] [CrossRef]
- Grone, R.; Merris, R. The Laplacian spectrum of a graph II. SIAM J. Discret. Math. 1994, 7, 221–229. [Google Scholar] [CrossRef]
- Harary, F. Graph Theory; Addison-Wesley Publishing Company: Boston, MA, USA, 1969. [Google Scholar]
- Albert, R.; Jeong, H.; Barabási, A. Error and attack tolerance of complex networks. Nature 2000, 406, 378–382. [Google Scholar] [CrossRef] [PubMed]
- Feng, L.; Gutman, I.; Yu, L. Degree resistance distance of unicyclic graphs. Trans. Comb. 2010, 1, 27–40. [Google Scholar]
- Klein, D.J.; Randić, M. Resistance Distance. J. Math. Chem. 1993, 12, 81–95. [Google Scholar] [CrossRef]
- Zhu, H.Y.; Klein, D.J.; Lukovits, I. Extensions of the Wiener number. J. Chem. Inf. Comput. Sci. 1996, 36, 420–428. [Google Scholar] [CrossRef]
- Clemente, G.; Cornaro, A. A novel measure of edge and vertex centrality for assessing robustness in complex networks. Soft Comput. 2020, 24, 13687–13704. [Google Scholar] [CrossRef]
- RFI. Rete Ferroviaria Italiana, la Rete Oggi. Available online: https://www.rfi.it/it/rete/la-rete-oggi.html (accessed on 1 December 2020).
- Intini, M.; Larosa, V.; Tangari, L. Regolazione ferroviaria tra gestione pubblica e liberalizzazione: Lo stato dell’arte in Europa e in Italia. Riv. Econ. Politica Trasp. 2020, 2, 1–33. [Google Scholar]
- Cascetta, E.; Cartenì, A.; Henke, I.; Pagliara, F. Economic growth, transport accessibility and regional equity impacts of high-speed railways in Italy: Ten years ex post evaluation and future perspectives. Transp. Res. Part A Policy Pract. 2020, 139, 412. [Google Scholar] [CrossRef]
- Trenitalia. Trenitalia Official Website. Available online: https://www.trenitalia.com (accessed on 1 December 2020).
- Trenord. Linee ed Orari. Available online: www.trenord.it/linee-e-orari (accessed on 1 December 2020).
- Trenitalia. Viaggiatreno. Available online: http://www.viaggiatreno.it/viaggiatrenonew/index.jsp (accessed on 1 December 2020).
- Trenord. Trenord COVID-19. Available online: https://trenord-europe-trenord-endpoint-prd.azureedge.net/fileadmin/contenuti/TRENORD/3-News/Trenord_Informa/Comunicati_stampa/2020/COVID_19/trenord_200301_ns_modifiche_circolazione_def.pdf (accessed on 1 December 2020).
- Pendolaria. Pendolaria 2019. Available online: https://www.pendolaria.it/wp-content/uploads/2020/02/Rapporto-Pendolaria-2019-completo.pdf (accessed on 1 December 2020).
- Istat. Report Mobilità ISTAT. Available online: https://www.istat.it/it/files/2018/11/Report-mobilità-sostenibile.pdf (accessed on 1 December 2020).
- G., F. Directed or Undirected? A New Index to Check for Directionality of Relations in Socio-Economic Networks. arXiv 2006, physics/0612017. Available online: http://xxx.lanl.gov/abs/physics/0612017 (accessed on 10 October 2022).
- Das, K.; Samanta, S.; Pal, M. Study on centrality measures in social networks: A survey. Soc. Netw. Anal. Min. 2018, 8, 13. [Google Scholar] [CrossRef]
- Ministero dei Trasporti. Regolamento (UE) N. 1300/2014 Della Commissione del 18 Novembre 2014 Relativo alle Specifiche Tecniche di Interoperabilità (STI) per L’accessibilità del Sistema Ferroviario Dell’unione per le Persone con Disabilità e le Persone a Mobilità Ridotta. Available online: https://ec.europa.eu/transport/sites/transport/files/rail-nip/nip-prm-tsi-italy.pdf (accessed on 1 December 2020).
- Beria, P.; Debernardi, A.; Campisi, E.; Tolentino, S.; Filippini, G. Rapporto Indipendente su Trenord 2010–2019. Offerta, Produttività e Qualità; TRASPOL Report 3/21; Politecnico di Milano, META s.r.l.: Milano, Italy, 2021. [Google Scholar]
- Trenord. Social Balance Trenord. Available online: https://www.trenord.it/fileadmin/contenuti/TRENORD/Pagine_di_servizio/Chi_siamo/Bilancio_di_sostenibilita/bilancio_sociale_2018.pdf (accessed on 1 December 2020).
- Istat. Atlante Statistico dei Comuni. Available online: https://www.istat.it/it/archivio/227189 (accessed on 1 December 2020).
- Erdős, P.; Rényi, A. On Random Graphs I. Publ. Math. 1959, 6, 290–297. [Google Scholar] [CrossRef]
- Erdős, P.; Rényi, A. On the evolution of random graphs. Publ. Math. Inst. Hung. Acad. Sci. 1960, 5, 17–61. [Google Scholar]
- Albert, R.; Barabasi, A. Statistical mechanics of complex networks. Rev. Mod. Phys. 2002, 74, 47. [Google Scholar] [CrossRef]
- Watts, D.J.; Strogatz, S.H. Dynamics of ‘Small World’ Networks. Nature 1998, 393, 440–444. [Google Scholar] [CrossRef] [PubMed]
Figure 1.
Lombardy rail network.

Figure 2.
Lombardy railway network under study.

Figure 3.
Milan network (rail and underground). Source: https://giromilano.atm.it (accessed on 9 May 2023).
Figure 3.
Milan network (rail and underground). Source: https://giromilano.atm.it (accessed on 9 May 2023).
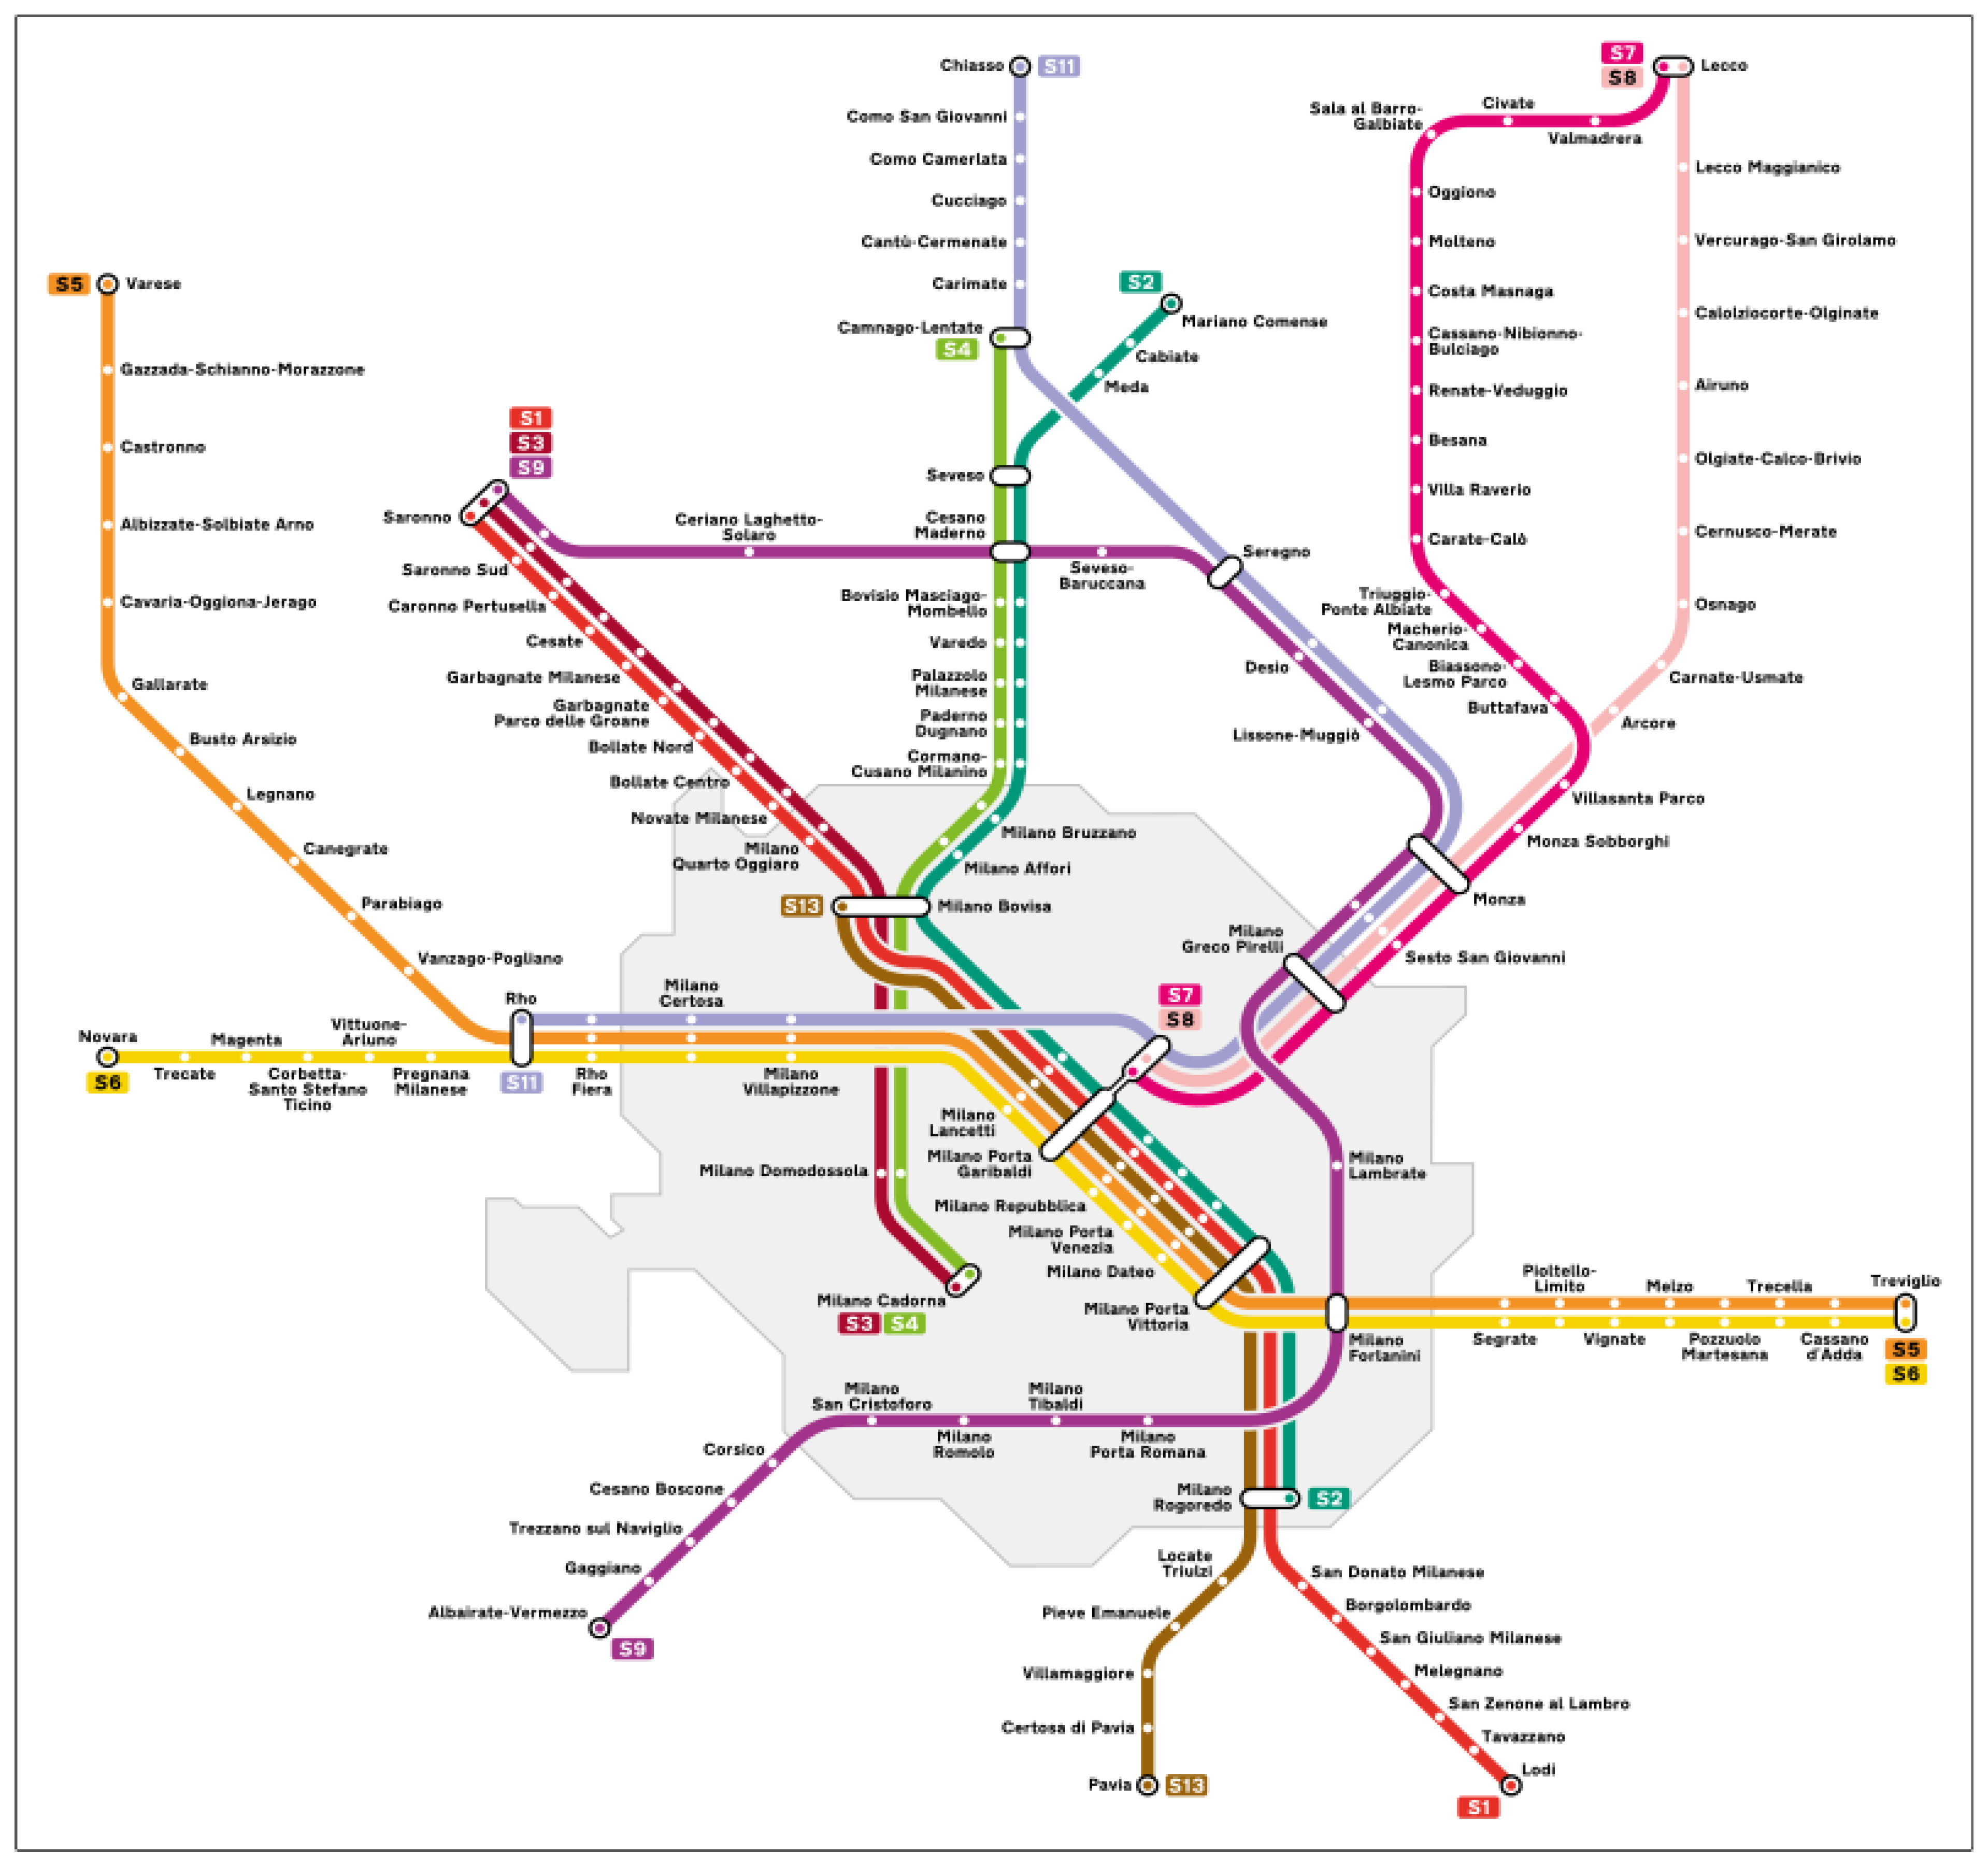
Figure 4.
Lombardy railway network and the most critical edges.

Figure 5.
Correlation between rankings obtained by , betweenness centrality, eigenvector centrality, and residual closeness.
Figure 5.
Correlation between rankings obtained by , betweenness centrality, eigenvector centrality, and residual closeness.


Table 1.
Classical network indicators (see, among others, [41]).
Table 1.
Classical network indicators (see, among others, [41]).
| Density | 0.03 |
| Assortativity | 0.005 |
| Average degree | 2.5 |
| Average clustering | 0.1 |
Table 2.
Normalized weighted Kirchhoff index for the Lombardy railway network and average normalized weighted Kirchhoff index for simulated networks.
Table 2.
Normalized weighted Kirchhoff index for the Lombardy railway network and average normalized weighted Kirchhoff index for simulated networks.
| Network | |
|---|---|
| Lombardy Railways | 3.53 |
| ER | 2.16 |
| WS | 1.63 |
| BA | 1.97 |
Table 3.
Vertex-based analysis.
| STATION | Deg | STATION | Strength | ||
|---|---|---|---|---|---|
| CODOGNO | 30.39% | 4 | PONTE SP | 22.2% | 158 |
| PONTE SP | 24.75% | 3 | BERGAMO | 21.9% | 183 |
| BERGAMO | 24.74% | 3 | CODOGNO | 20.4% | 172 |
| BUSTO | 20.63% | 3 | MILANO ROGOREDO | 17.9% | 915 |
| RHO FIERA | 12.73% | 3 | RHO FIERA | 16.4% | 648 |
| BRESCIA | 12.64% | 5 | BUSTO | 15.8% | 401 |
| ALBATE | 11.79% | 3 | MONZA | 14.6% | 761 |
| MILANO ROGOREDO | 10.14% | 3 | BRESCIA | 11.0% | 295 |
| CAVA CARBONARA | 9.76% | 3 | DESENZANO | 10.6% | 157 |
| CARNATE | 7.29% | 4 | CARNATE | 9.7% | 266 |
Table 4.
Vertex-based Unweighted and Weighted analyses on cut vertices.
| Cut-Vertices | Cut-Vertices | ||
|---|---|---|---|
| Station | Station | ||
| CREMONA | 26.38% | MILANO | 20.26% |
| PAVIA | 16.5% | TREVIGLIO | 20.14% |
| PIADENA | 16.30% | CREMONA | 19.73% |
| MILANO | 8.14% | PIADENA | 14.47% |
| COMO | 4.81% | PAVIA | 13.59% |
| VARESE | 3.21% | PALAZZOLO | 2.88% |
| MORTARA | 2.48% | SARONNO | 1.62% |
| SARONNO | 1.95% | VARESE | 1.01% |
| PALAZZOLO | 1.94% | COMO | 0.80% |
| TREVIGLIO | 1.76% | VOGHERA | 0.79% |
Table 5.
Edge-based analysis.
| JOURNEY | JOURNEY | Numtrain | ||
|---|---|---|---|---|
| CODOGNO–CREMONA | 26.6% | CASSANO-TREVIGLIO | 34.9% | 100 |
| BERGAMO–PONTE SP | 24.2% | TREVIGLIO-TREVIGLIO OVEST | 34.3% | 56 |
| BUSTO–GALLARATE | 17.9% | BERGAMO–PONTE SP | 21.5% | 88 |
| MANTOVA–PIADENA | 17.2% | MANTOVA–PIADENA | 18.1% | 28 |
| ALBATE-COMO | 10.7% | CODOGNO–CREMONA | 16.1% | 35 |
| CAVA CARBONARA-PAVIA | 10.2% | MILANO-MILANO ROGOREDO | 15.8% | 584 |
| MILANO-MILANO ROGOREDO | 9.2% | BUSTO–GALLARATE | 14.6% | 203 |
| NOVARA–RHO FIERA | 8.2% | BRESCIA–DESENZANO | 14.1% | 78 |
| GALLARATE-VARESE | 8.1% | NOVARA–RHO FIERA | 10.8% | 120 |
| MORTARA–NOVARA | 7.3% | DESENZANO-VERONA | 10.5% | 79 |
Table 6.
The top 15 stations in terms of . Additionally, the ranking provided by betweenness centrality, eigenvector centrality, and residual closeness is provided together with the RFI and FN classifications.
Table 6.
The top 15 stations in terms of . Additionally, the ranking provided by betweenness centrality, eigenvector centrality, and residual closeness is provided together with the RFI and FN classifications.
| Station | Rank | Rank Betweenness | Rank Eigenvector Centrality | Rank Residual Closeness | Classification |
|---|---|---|---|---|---|
| PONTE SP | 1 | 9 | 27 | 16 | Silver |
| BERGAMO | 2 | 8 | 39 | 8 | Platinum |
| CODOGNO | 3 | 2 | 20 | 11 | Gold |
| MILANO | 4 | 24 | 1 | 71 | Platinum |
| TREVIGLIO | 5 | 31 | 51 | 10 | Gold |
| CREMONA | 6 | 4 | 38 | 6 | Gold |
| MILANO ROGOREDO | 7 | 53 | 2 | 62 | Gold |
| RHO FIERA | 8 | 16 | 4 | 49 | Gold |
| BUSTO | 9 | 19 | 10 | 55 | Gold |
| MONZA | 10 | 36 | 3 | 52 | Gold |
| PIADENA | 11 | 1 | 53 | 1 | Silver |
| PAVIA | 12 | 3 | 6 | 15 | Gold |
| BRESCIA | 13 | 5 | 61 | 3 | Platinum |
| DESENZANO | 14 | 53 | 65 | 37 | Gold |
| CARNATE | 15 | 49 | 11 | 17 | Silver |
Table 7.
Average values for different centrality measures according to the RFI classification.
| RFI Classification | N Stations | Av. | Av. Betweenness | Av. Eigenvector Centrality | Av. Strength | Av. Residual Closeness |
|---|---|---|---|---|---|---|
| Platinum | 5 | 11.04% | 399.20 | 0.20 | 470.20 | 53.67 |
| Gold | 26 | 4.83% | 306.50 | 0.09 | 256.62 | 52.12 |
| Silver | 37 | 0.31% | 178.41 | 0.02 | 107.08 | 50.69 |
| Bronze | 13 | −0.37% | 224 | 0.00 | 76.385 | 55.83 |
| Total | 81 | 2.31% | 240.47 | 0.050 | 172.57 | 52.15 |
Disclaimer/Publisher’s Note: The statements, opinions and data contained in all publications are solely those of the individual author(s) and contributor(s) and not of MDPI and/or the editor(s). MDPI and/or the editor(s) disclaim responsibility for any injury to people or property resulting from any ideas, methods, instructions or products referred to in the content. |
© 2023 by the authors. Licensee MDPI, Basel, Switzerland. This article is an open access article distributed under the terms and conditions of the Creative Commons Attribution (CC BY) license (https://creativecommons.org/licenses/by/4.0/).
Share and Cite
MDPI and ACS Style
Cornaro, A.; Grechi, D. Evaluation of Railway Systems: A Network Approach. Sustainability 2023, 15, 8056. https://doi.org/10.3390/su15108056
AMA Style
Cornaro A, Grechi D. Evaluation of Railway Systems: A Network Approach. Sustainability. 2023; 15(10):8056. https://doi.org/10.3390/su15108056
Chicago/Turabian StyleCornaro, Alessandra, and Daniele Grechi. 2023. "Evaluation of Railway Systems: A Network Approach" Sustainability 15, no. 10: 8056. https://doi.org/10.3390/su15108056
Note that from the first issue of 2016, this journal uses article numbers instead of page numbers. See further details here.