
Urban Stream Corridors and Forest Patches—The Connections: A Case Study of Bloomington, IN

Abstract
:1. Introduction
Research Questions
- 1.
- (a) Where and when have Bloomington streams been channelized and/or buried over time?
- (b) How have these modifications altered channel connectivity to nearby UFPs?
- 2.
- (a) Where and when have Bloomington UFPs changed over time?
- (b) How have these changes in the UFP area altered their impact on streams?
2. Materials and Methods
2.1. Study Area
2.2. Spatial Data Sources
2.3. Visual Inspection
2.4. Estimate of UFP Ecosystem Services
3. Results
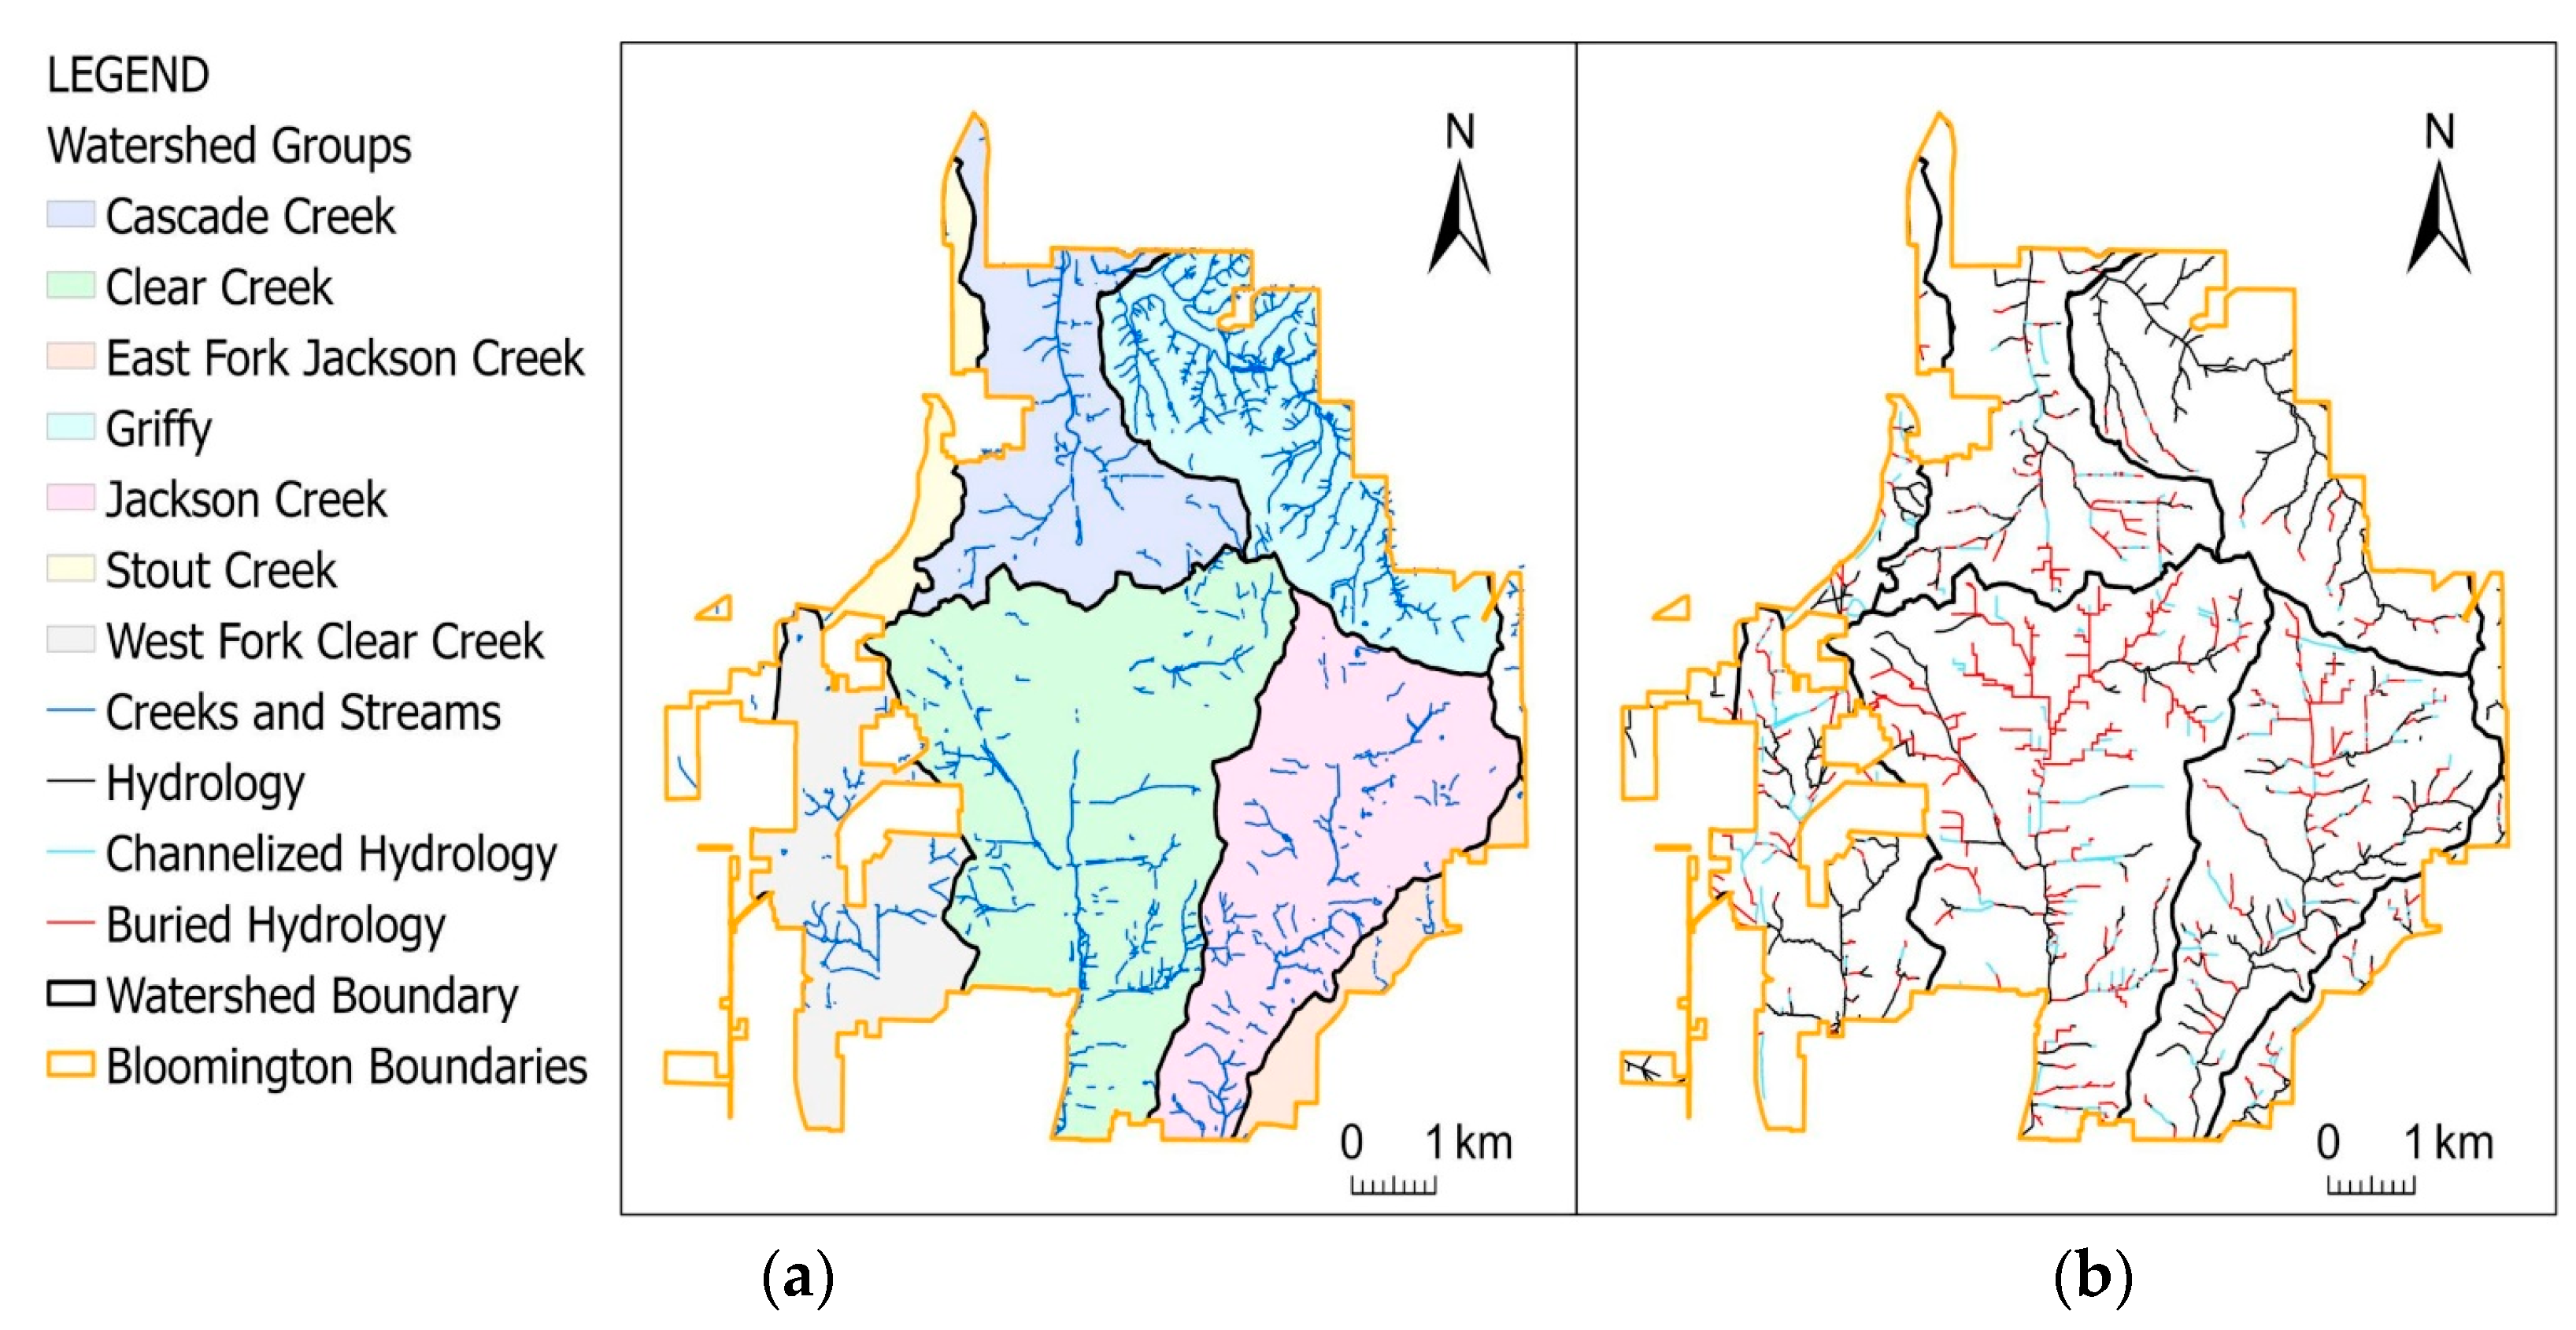
3.1. Channelization and Burial of Bloomington Streams over Time
3.2. Stream Channel Connectivity to UFPs
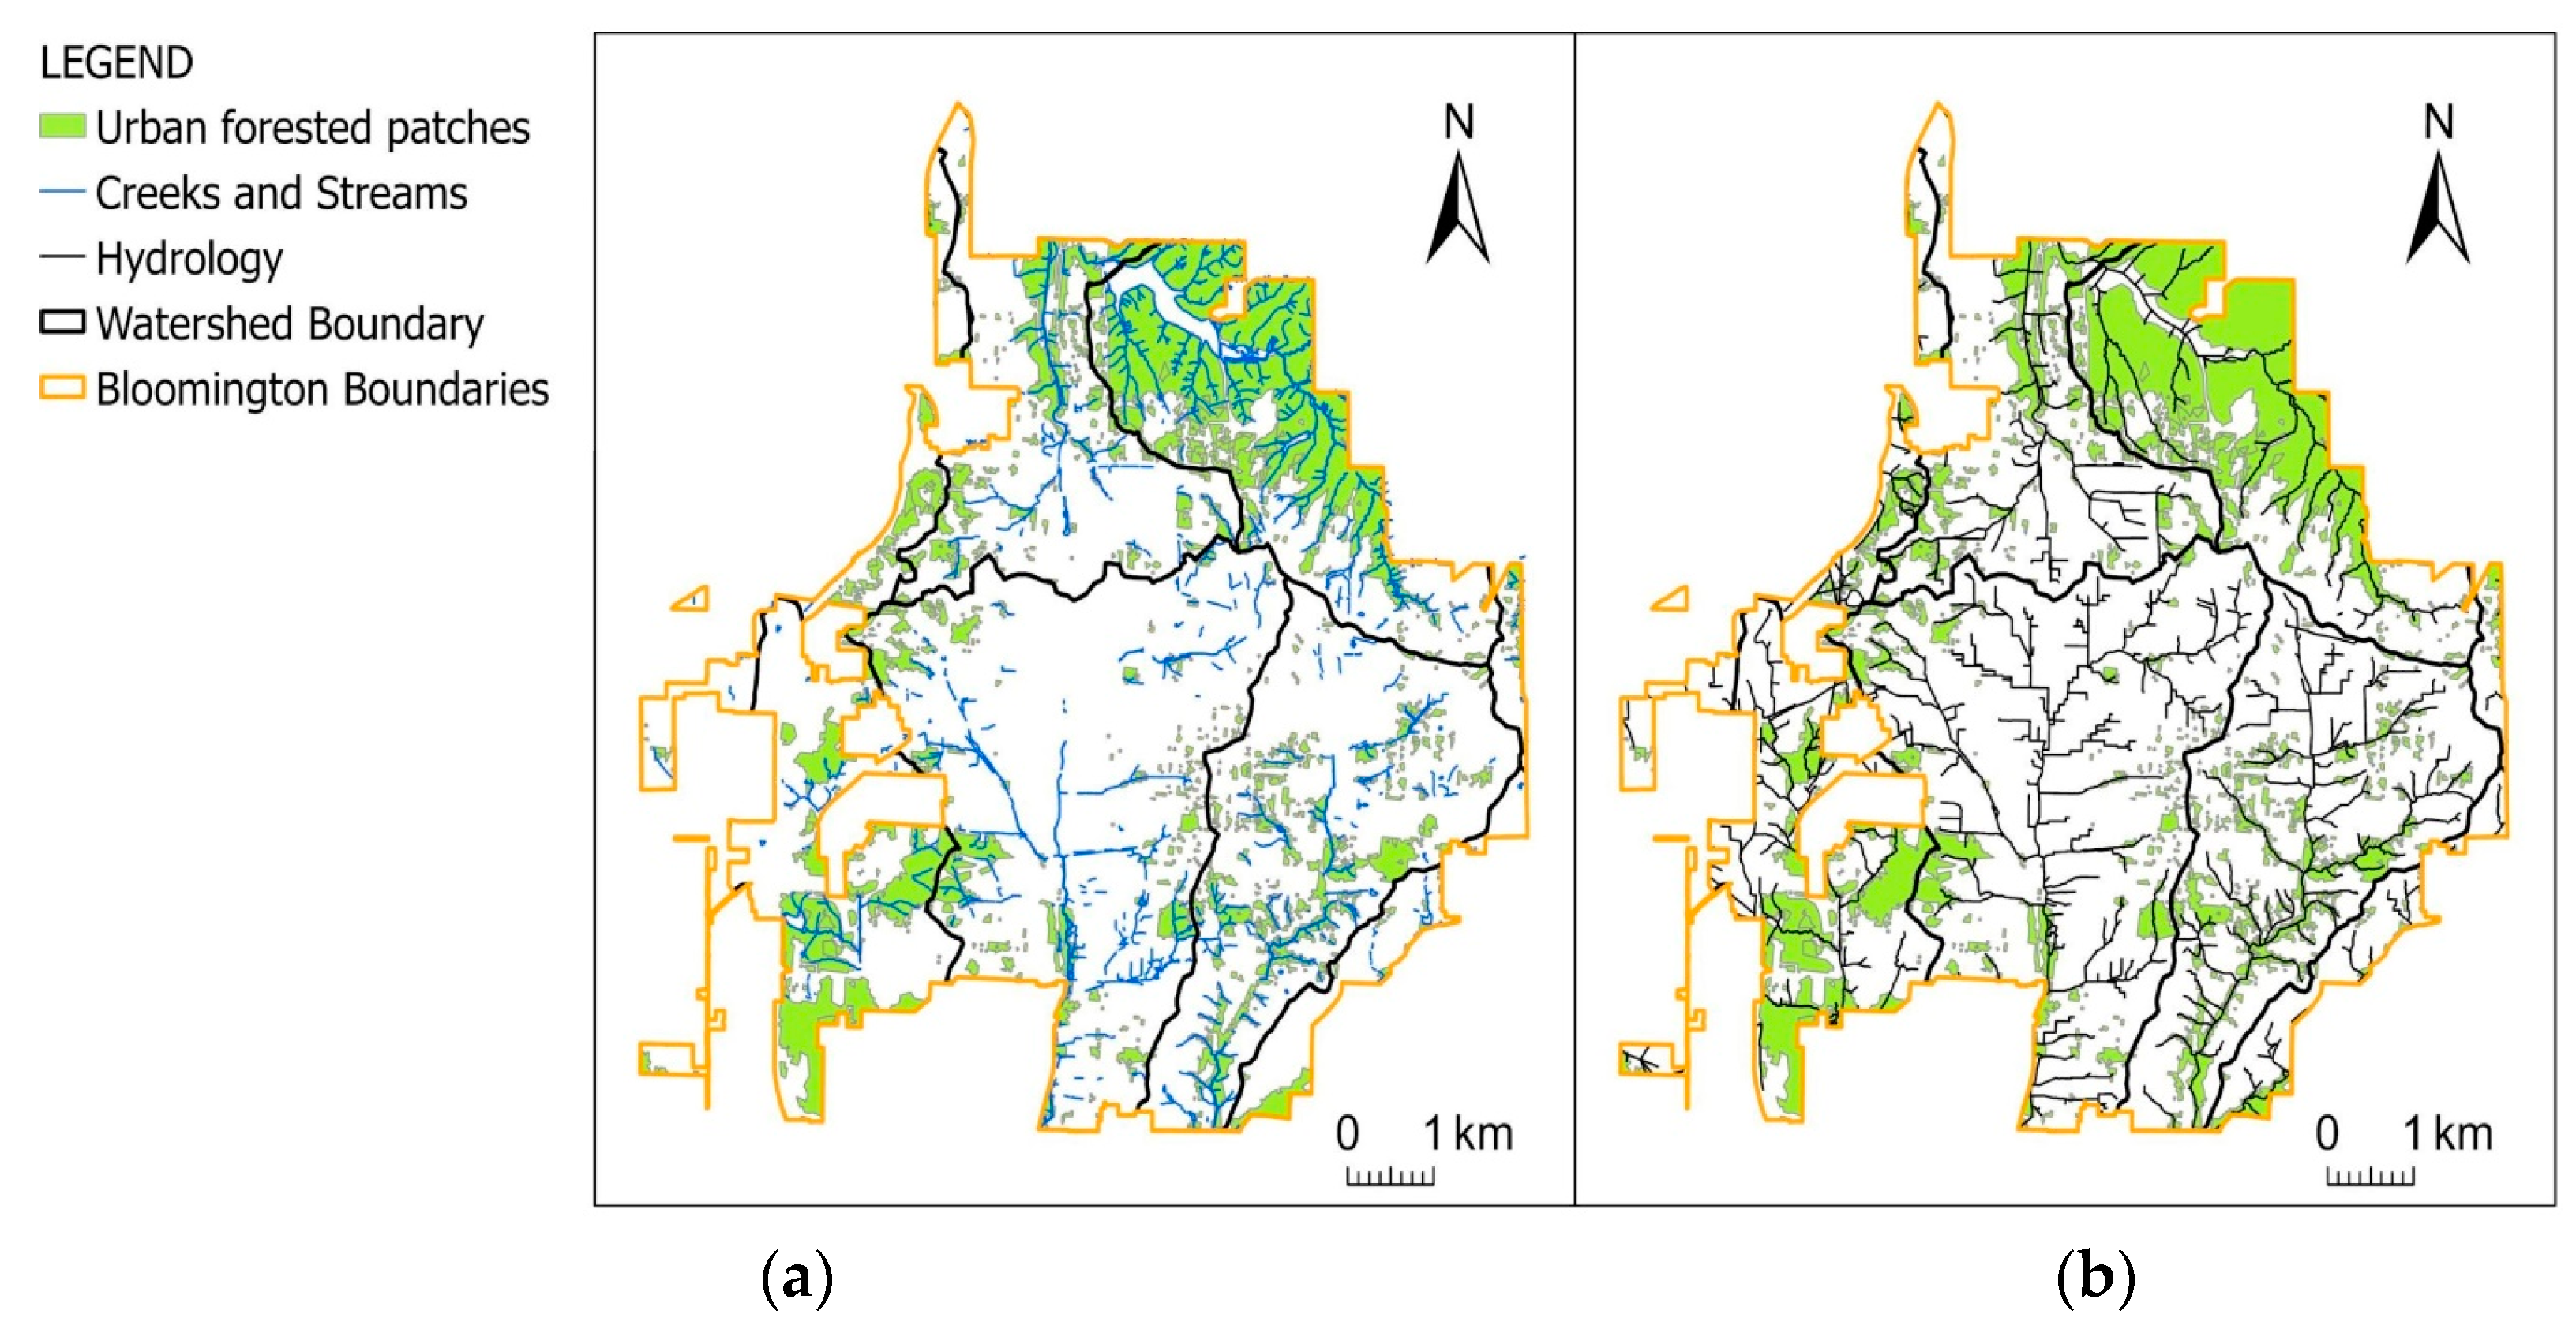
3.3. Urban Forest Patch Change over Time
3.4. Stream and Urban Forest Patch Connectivity over Time
4. Discussion
4.1. Stream and Urban Forest Patch Locations
4.2. Importance of Connectivity
4.3. Improving Connectivity between UFPs and Streams
5. Conclusions
Supplementary Materials
Author Contributions
Funding
Institutional Review Board Statement
Informed Consent Statement
Data Availability Statement
Acknowledgments
Conflicts of Interest
References
- Bolund, P.; Hunhammar, S. Ecosystem services in urban areas. Ecol. Econ. 1999, 29, 293–301. [Google Scholar] [CrossRef]
- Paul, M.; Meyer, J. Streams in the Urban Landscape. Annu. Rev. Ecol. Syst. 2001, 32, 333–365. [Google Scholar] [CrossRef]
- Grove, J.M.; Cadenasso, M.L.; Pickett, S.T.A.; Machlis, G.E.; Burch, W.R., Jr. The Baltimore School of Urban Ecology Space, Scale, and Time for the Study of Cities; Yale University Press: New Haven, CT, USA; London, UK, 2015. [Google Scholar]
- Walsh, C.J.; Roy, A.H.; Feminella, J.W.; Cottingham, P.D.; Groffman, P.M.; Morgan, R.P. The urban stream syndrome: Current knowledge and the search for a cure. Freshw. Sci. 2005, 24, 706–723. [Google Scholar] [CrossRef]
- Forman, R.T.T.; Godron, M. Patches and Structural Components for a Landscape Ecology. BioScience 1981, 31, 733–740. [Google Scholar] [CrossRef]
- Costanza, R.; d’Arge, R.; de Groot, R.; Farber, S.; Grasso, M.; Hannon, B.; Limburg, K.; Naeem, S.; O’Neill, R.V.; Paruelo, J.; et al. The value of the world’s ecosystem services and natural capital. Nature 1997, 387, 253–260. [Google Scholar] [CrossRef]
- Escobedo, F.J.; Giannico, V.; Jim, C.Y.; Sanesi, G.; Lafortezza, R. Urban forests, ecosystem services, green infrastructure and nature-based solutions: Nexus or evolving metaphors? Urban For. Urban Green. 2019, 37, 3–12. [Google Scholar] [CrossRef]
- Vilhar, U. Water Regulation and Purification. The Urban Forest: Cultivating Green Infrastructure for People and the Environment. In The Urban Forest: Cultivating Green Infrastructure for People and the Environment; Springer International: Cham, Switzerland, 2017; Volume 7, pp. 41–47. [Google Scholar]
- Pickett, S.T.A.; Cadenasso, M.L.; Grove, J.M.; Nilon, C.H.; Pouyat, R.V.; Zipperer, W.C.; Constanza, R. Urban Ecological Systems: Linking Terrestrial Ecological, Physical, and Socioeconomic Components of Metropolitan Areas. Annu. Rev. Ecol. Syst. 2001, 32, 127–157. [Google Scholar] [CrossRef]
- Pickett, S.T.A.; Cadenasso, M.L.; Grove, J.M.; Boone, C.G.; Groffman, P.M.; Irwin, E.; Kaushal, S.S.; Marshall, V.; McGrath, B.P.; Nilon, C.H.; et al. Urban ecological systems: Scientific foundations and a decade of progress. J. Environ. Manag. 2011, 92, 331–362. [Google Scholar] [CrossRef]
- Du, E.; Xia, N.; Guo, Y.; Tien, Y.; Li, B.; Liu, X.; de Vries, W.A. Ecological effects of nitrogen deposition on urban forests: An overview. Front. Agric. Sci. Eng. 2022, 9, 445–456. [Google Scholar] [CrossRef]
- Du, E.; Xia, N.; Tang, Y.; Guo, Z.; Guo, Y.; Wang, Y.; de Vries, W.B. Anthropogenic and climate shaping of soil nitrogen properties across urban-rural-natural forests in the Beijing metropolitan region. Geoderma 2022, 406, 15524. [Google Scholar] [CrossRef]
- Lauriks, F.; Salomón, R.L.; Steppe, K. Temporal variability in tree responses to elevated atmospheric CO2. Plant Cell Environ. 2021, 44, 1292–1310. [Google Scholar] [CrossRef] [PubMed]
- Berland, A.; Shiflett, S.A.; Shuster, W.D.; Garmestani, A.S.; Goddard, H.C.; Herrmann, D.L.; Hopton, M.E. The role of trees in urban stormwater management. Landsc. Urban Plan. 2017, 162, 167–177. [Google Scholar] [CrossRef]
- Roy, A.H.; Faust, C.L.; Freeman, M.C.; Meyer, J.L. Reach-scale effects of riparian forest cover on urban stream ecosystems. Can. J. Fish. Aquat. 2005, 62, 2312–2329. [Google Scholar] [CrossRef]
- Gollin, D.; Jedwab, R.; Vollrath, D. Urbanization with and without industrialization. J. Econ. Growth. 2016, 21, 35–70. [Google Scholar] [CrossRef]
- de la Fuente, B.; Mateo-Sánchez, M.C.; Rodríguez, G.; Gastón, A.; Pérez de Ayala, R.; Colomina-Pérez, D.; Melero, M.; Saura, S. Natura 2000 sites, public forests and riparian corridors: The connectivity backbone of forest green infrastructure. Land Use Policy 2018, 75, 429–441. [Google Scholar] [CrossRef]
- Kuehler, E.; Hathaway, J.; Tirpak, A. Quantifying the benefits of urban forest systems as a component of the green infrastructure stormwater treatment network. Ecohydrology 2017, 10, e1813. [Google Scholar] [CrossRef]
- Phillips, T.H.; Baker, M.E.; Lautar, K.; Yesilonis, I.; Pavao-Zuckerman, M.A. The capacity of urban forest patches to infiltrate stormwater is influenced by soil physical properties and soil moisture. J. Environ. Manag. 2017, 246, 11–18. [Google Scholar] [CrossRef]
- Piedelobo, L.; Taramelli, A.; Schiavon, E.; Valentini, E.; Molina, J.-L.; Nguyen Xuan, A.; González-Aguilera, D. Assessment of Green Infrastructure in Riparian Zones Using Copernicus Programme. Remote Sens. 2019, 11, 2967. [Google Scholar] [CrossRef]
- Weber, T.; Wolf, J. Maryland’s Green Infrastructure-Using Landscape Assessment Tools to Identify a Regional Conservation Strategy. Environ. Monit. Assess. 2000, 63, 265–277. [Google Scholar] [CrossRef]
- Brooker, M.P. The Ecological Effects of Channelization. Geogr. J. 1985, 151, 63–69. [Google Scholar] [CrossRef]
- Wenger, S.J.; Roy, A.H.; Jackson, C.R.; Bernhardt, E.S.; Carter, T.L.; Filoso, S.; Gibson, C.A.; Hession, W.C.; Kaushal, S.S.; Marti, E.; et al. Twenty-six key research questions in urban stream ecology: An assessment of the state of the science. J. N. Am. Benthol. Soc. 2009, 28, 1080–1098. [Google Scholar] [CrossRef]
- Johnson, L.R.; Johnson, M.L.; Aronson, M.F.J.; Campbell, L.K.; Carr, M.E.; Clarke, M.; D’Amico, V.; Darling, L.; Erker, T.; Fahey, R.T.; et al. Conceptualizing social-ecological drivers of change in urban forest patches. Urban Ecosyst. 2020, 24, 633–648. [Google Scholar] [CrossRef]
- Roy, A.H.; Freeman, M.C.; Freeman, B.J.; Wegner, S.J.; Ensign, W.E.; Meyer, J.L. Importance of Riparian Forests in Urban Catchments Contingent on Sediment and Hydrologic Regimes. Environ. Manag. 2006, 37, 523–539. [Google Scholar] [CrossRef]
- Slonecker, E.T.; Tilley, J.S. An Evaluation of the Individual Components and Accuracies Associated with the Determination of Impervious Area. GIsci. Remote Sens. 2004, 41, 165–184. [Google Scholar] [CrossRef]
- Ladwig, B. Census Bureau Reports Bloomington down 1200 Residents Since 2010. The Harald-Times. 2021. Available online: https://www.heraldtimesonline.com/story/news/local/2021/08/12/census-bureau-reports-bloomington-down-1-200-residents-since-2010/8114189002/ (accessed on 9 October 2022).
- Souch, C.A.; Souch, C. The Effect of Trees on Summertime Below Canopy Urban Climates: A Case Study Bloomington, Indiana. Arboric. Urban For. 1993, 19, 303–312. [Google Scholar] [CrossRef]
- Hasenmueller, N.R.; Packman, D.M. Karst Features in Indiana. Indiana Geological & Water Survey Indiana University. Available online: https://igws.indiana.edu/Bedrock/Karst (accessed on 31 July 2022).
- White, W.B.; Culver, D.C.; Herman, J.S.; Kane, T.C.; Mylroie, J.E. Karst Lands. Am. Sci. 1995, 83, 450–459. [Google Scholar]
- McGerr, P. Downtown Bloomington Businesses, Area Residents Deal with Flooding Damage. The Herald-Times. 2021. Available online: https://www.heraldtimesonline.com/story/news/2021/06/19/weather-bloomington-indiana-flooding-kirkwood-flood-damage/7755070002/ (accessed on 22 April 2023).
- Staff Reports. Flash Flood Leaves City Awash. The Harald-Times. 2008. Available online: https://www.heraldtimesonline.com/story/news/2008/06/05/flash-flood-leaves-city-awash/117883090/ (accessed on 22 April 2023).
- IU Office of the Bicennential. University Lake: IU’s Silent. Partner Since 1911. 2019. Available online: https://www.myiu.org/stories/pride-and-tradition/university-lake-ius-silent-partner-since-1911/ (accessed on 22 April 2023).
- US Census Bureau. 2020 U.S. Gazetteer Files. Available online: https://www2.census.gov/geo/docs/maps-data/data/gazetteer/2020_Gazetteer/2020_gaz_place_18.txt (accessed on 6 June 2022).
- Schnoebelen, D.J.; Fenelon, J.M.; Martin, J.D.; Bayless, E.R.; Jacques, D.V.; Crawford, C.G. Environmental Sensing and Natural Factors and Human Influences Affecting Water Quality in the White River Basin, Indiana; U.S. Geological Survey: Indianapolis, India, 1999; pp. 3–7. [Google Scholar]
- Storm Outfalls Map. Stormwater Outfalls within the Bloomington City Limits. City of Bloomington Utility Maps & Service Area Maps. 2019. Available online: https://bloomington.in.gov/sites/default/files/2019-07/2019_OUTFALL_MAP.pdf (accessed on 6 June 2022).
- Stier, M. Bloomington Municipal Boundary GIS Data. Shapefile. City of Bloomington. 2015. Available online: https://data.bloomington.in.gov/dataset/Bloomington-Municipal-Boundary/apcz-492v (accessed on 15 March 2022).
- Stier, M. Natural Drainage Basins GIS Data. Shapefile. City of Bloomington. 2019. Available online: https://data.bloomington.in.gov/Utilities-Water/Natural-Drainage-Basins/c2d8-xnz4 (accessed on 20 April 2022).
- Stier, M. Hydrology GIS Data. Shapefile. City of Bloomington. 2016. Available online: https://data.bloomington.in.gov/Utilities-Water/Waterlines/sd79-67aw (accessed on 15 March 2022).
- Ersi, National Aeronatics and Space Administration, National Geospatial-Intelligence Agency, U.S. Geological Survey. World Imagery. Satellite Imagery. Ersi. 2022. Available online: https://www.arcgis.com/apps/mapviewer/index.html?layers=10df2279f9684e4a9f6a7f08febac2a9 (accessed on 15 March 2022).
- US Geological Survey, U.S. Environmental Protection Agency. HYDROGRAPHY_LOCALRES_WATERBODYLINEAR_NHD_IN: Rivers, Inundation Areas, Canals, Submerged Streams, and Other Linear Waterbodies in Watersheds of Indiana. Shapefile. U.S. Geological Survey. 2019. Available online: https://maps.indiana.edu/metadata/Hydrology/Water_Bodies_Rivers_LocalRes.html (accessed on 15 March 2022).
- Indiana Geological Survey. IGS Map: IHAPI. Indiana University. 2011. Available online: https://igws.indiana.edu/IHAPI/Map/ (accessed on 16 March 2022).
- US Forest Service. NLCD 2016 Tree Canopy Cover (CONUS). Raster digital data. U.S Geological Survey. 2019. Available online: https://www.mlrc.gov/data/nlcd-2016-usfs-tree-canopy-cover-conus (accessed on 15 March 2022).
- US Geological Survey; Dewitz, J. National Land Cover Database (NLCD) 2019 Products; Remote-sensing imagery; U.S. Geological Survey: Reston, GA, USA, 2021. [Google Scholar]
- Ellingsworth, D.; Binkley, M.; Maco, S.; Nowak, D.J.; USDA Forest Service; Davey Tree Expert Company; National Arbor Day Foundation; Society of Municipal Arborists; International Society of Arboriculture; Casey Trees; et al. i-Tree Software Suite. i-Tree Canopy Cover. Assessment and Tree Benefits Report. 2022. Available online: https://canopy.itreetools.org/report (accessed on 8 June 2022).
- History of Lawerence and Monroe Counties, Indiana: Their People, Industries, and Institutions; BF Bowen & Co, Inc.: Indianapolis, India, 1914; pp. 380–381.
- Ogden, L.A.; Aoki, C.; Grove, J.M.; Sonti, N.F.; Hall, W.; Locke, D.; Pickett, S.T.A.; Avins, M.; Lauter, K.; Lagrosa, J. Forest ethnography: An approach to study the environmental history and political ecology of urban forests. Urban Ecosyst. 2019, 22, 49–63. [Google Scholar] [CrossRef]
- Lu, D.; Weng, Q. Use of impervious surface in urban land-use classification. Remote Sens. Environ. 2006, 102, 146–160. [Google Scholar] [CrossRef]
- Wickham, J.; Stehman, S.V.; Sorenson, D.G.; Gass, L.; Dewitz, J.A. Thematic accuracy assessment of the NLCD 2016 land cover for the conterminous United States. Remote Sens. Environ. 2021, 257, 112357. [Google Scholar] [CrossRef]
- Sung, C.Y.; Yi, Y.; Li, M.H. Impervious surface regulation and urban sprawl as its unintended consequence. Land Use Policy 2013, 32, 317–323. [Google Scholar] [CrossRef]
- Hilderbrand, R.H.; Utz, R.M.; Stranko, S.A.; Raesly, R.L. Applying thresholds to forecast potential biodiversity loss from human development. J. N. Am. Benthol. Soc. 2010, 29, 1009–1016. [Google Scholar] [CrossRef]
- Schiff, R.; Benoit, G. Effects of Impervious Cover at Multiple Spatial Scales on Coastal Watershed Streams. J. Am. Water Resour. Assoc. 2007, 43, 712–730. [Google Scholar] [CrossRef]
- Sangkapitux, C.; Neef, A.; Nunthasen, K.; Yothapakdee, T. An Assessment of Water Security and Livelihoods of Highlanders in the North of Thailand: A Case Study of Mae Sa Watershed, Chiang Mai Province. 2006. Available online: https://www.researchgate.net/publication/267256705_An_assessment_of_water_security_and_livelihoods_of_highlanders_in_the_North_of_Thailand_A_case_study_of_Mae_Sa_Watershed_Chiang_Mai_province (accessed on 22 April 2023).
- Gong, C.; Yu, S.; Joesting, H.; Chen, J. Determining socioeconomic drivers of urban forest fragmentation with historical remote sensing images. Landsc. Urban Plan. 2013, 117, 57–65. [Google Scholar] [CrossRef]
- Van Loon, A.F. Hydrological drought explained. Wiley Interdiscip. Rev. Water. 2015, 2, 359–392. [Google Scholar] [CrossRef]
- Booth, D.B.; Roy, A.H.; Smith, B.; Capps, K.A. Global perspectives on the urban stream syndrome. Freshw. Sci. 2016, 35, 412–420. [Google Scholar] [CrossRef]
- Avni, N.; Teschner, N. Urban Waterfronts: Contemporary Streams of Planning Conflicts. J. Plan. Lit. 2019, 34, 408–420. [Google Scholar] [CrossRef]
- Booth, D.B.; Hartley, D.; Jackson, R. Forest Cover, Impervious-Surface Area, and the Mitigation of Stormwater Impacts. J. Am. Water Resour. Assoc. 2002, 38, 835–845. [Google Scholar] [CrossRef]
- Capotorti, G.; De Lazzari, V.; Alós Ortí, M. Local Scale Prioritisation of Green Infrastructure for Enhancing Biodiversity in Peri-Urban Agroecosystems: A Multi-Step Process Applied in the Metropolitan City of Rome (Italy). Sustainability 2019, 11, 3322. [Google Scholar] [CrossRef]
- Rai, A.; Minsker, B.; Sullivan, W.; Band, L. A novel computational green infrastructure design framework for hydrologic and human benefits. Environ. Model. Softw. 2019, 118, 252–261. [Google Scholar] [CrossRef]
- Camarasa-Belmonte, A.M.; Soriano-García, J. Flood-risk assessment and mapping in periurban Mediterranean environments using hydrogeomorphology. Application to ephemeral streams in the Valencia. region (eastern Spain). Landsc. Urban Plan. 2012, 104, 189–200. [Google Scholar] [CrossRef]
- Kowarik, I.; Hiller, A.; Planchuelo, G.; Seitz, B.; von der Lippe, M.; Buchholz, S. Emerging Urban Forests: Opportunities for Promoting the Wild Side of the Urban Green Infrastructure. Sustainability 2019, 11, 6318. [Google Scholar] [CrossRef]
- Piana, M.R.; Pregitzer, C.C.; Hallet, R.A. Advancing management of urban forested natural areas: Toward an urban silviculture? Front. Ecol. Environ. 2021, 19, 526–535. [Google Scholar] [CrossRef]
- Langenheim, N.; White, M. Green Infrastructure and Urban-Renewal Simulation for Street Tree Design Decision-Making: Moderating Demands of Stormwater Management, Sunlight and Visual Aesthetics. Int. J. Environ. Res. Public. Health 2022, 19, 8220. [Google Scholar] [CrossRef] [PubMed]
- Miller, J.D.; Kim, H.; Kjeldsen, T.R.; Packman, J.; Grebby, S.; Dearden, R. Assessing the impact of urbanization on storm runoff in a peri-urban catchment using historical change in impervious cover. J. Hydrol. 2014, 515, 59–70. [Google Scholar] [CrossRef]
- Hale, R.L.; Scoggins, M.; Smucker, N.J.; Suchy, A. Effects of climate on the expression of the urban stream syndrome. Freshw. Sci. 2016, 35, 421–428. [Google Scholar] [CrossRef]

| Term | Definition |
|---|---|
| Channelization | Anthropogenic modifications to an urban stream that control erosion, drain wetlands, and reduce the retention time of water within the basin. Common technologies used to channelize stream corridors include concrete banks and rip-rap [22]. |
| Buried Stream Segment | A section of a stream that has been funneled through a buried pipe to channelize the stream and increase constructible surface area [23]. |
| Channelized Stream Segment | A section of a stream that has been modified to control erosion and reduce retention time. Includes sections of streams that have cement banks or have been lined with rip-rap [23]. |
| Urban Forest Patch | A self-established ecosystem within city limits that includes enough plants to establish a canopy and an understory. Understories consist of a shrub and a ground cover layer [24]. |
| Connectivity | The ability of surface or underground waters to move between forest and basin [25]. |
| Impervious Surface Cover | Land cover that reduces the ability of water to infiltrate the ground. ISC includes buildings, roads, sidewalks, driveways, and other manufactured surfaces [26]. |
| Larger Watershed | Watersheds |
|---|---|
| Lower White River | Cascade Creek, Griffy Creek, and Stout Creek [35,36]. |
| Lower East Fork White River | Clear Creek, Jackson Creek, East Fork Jackson Creek (EFJC), West Fork Clear Creek (WFCC), Stephens Creek (not included), Sinking Creek (not included), and Leonard Springs (not included) [35,36]. |
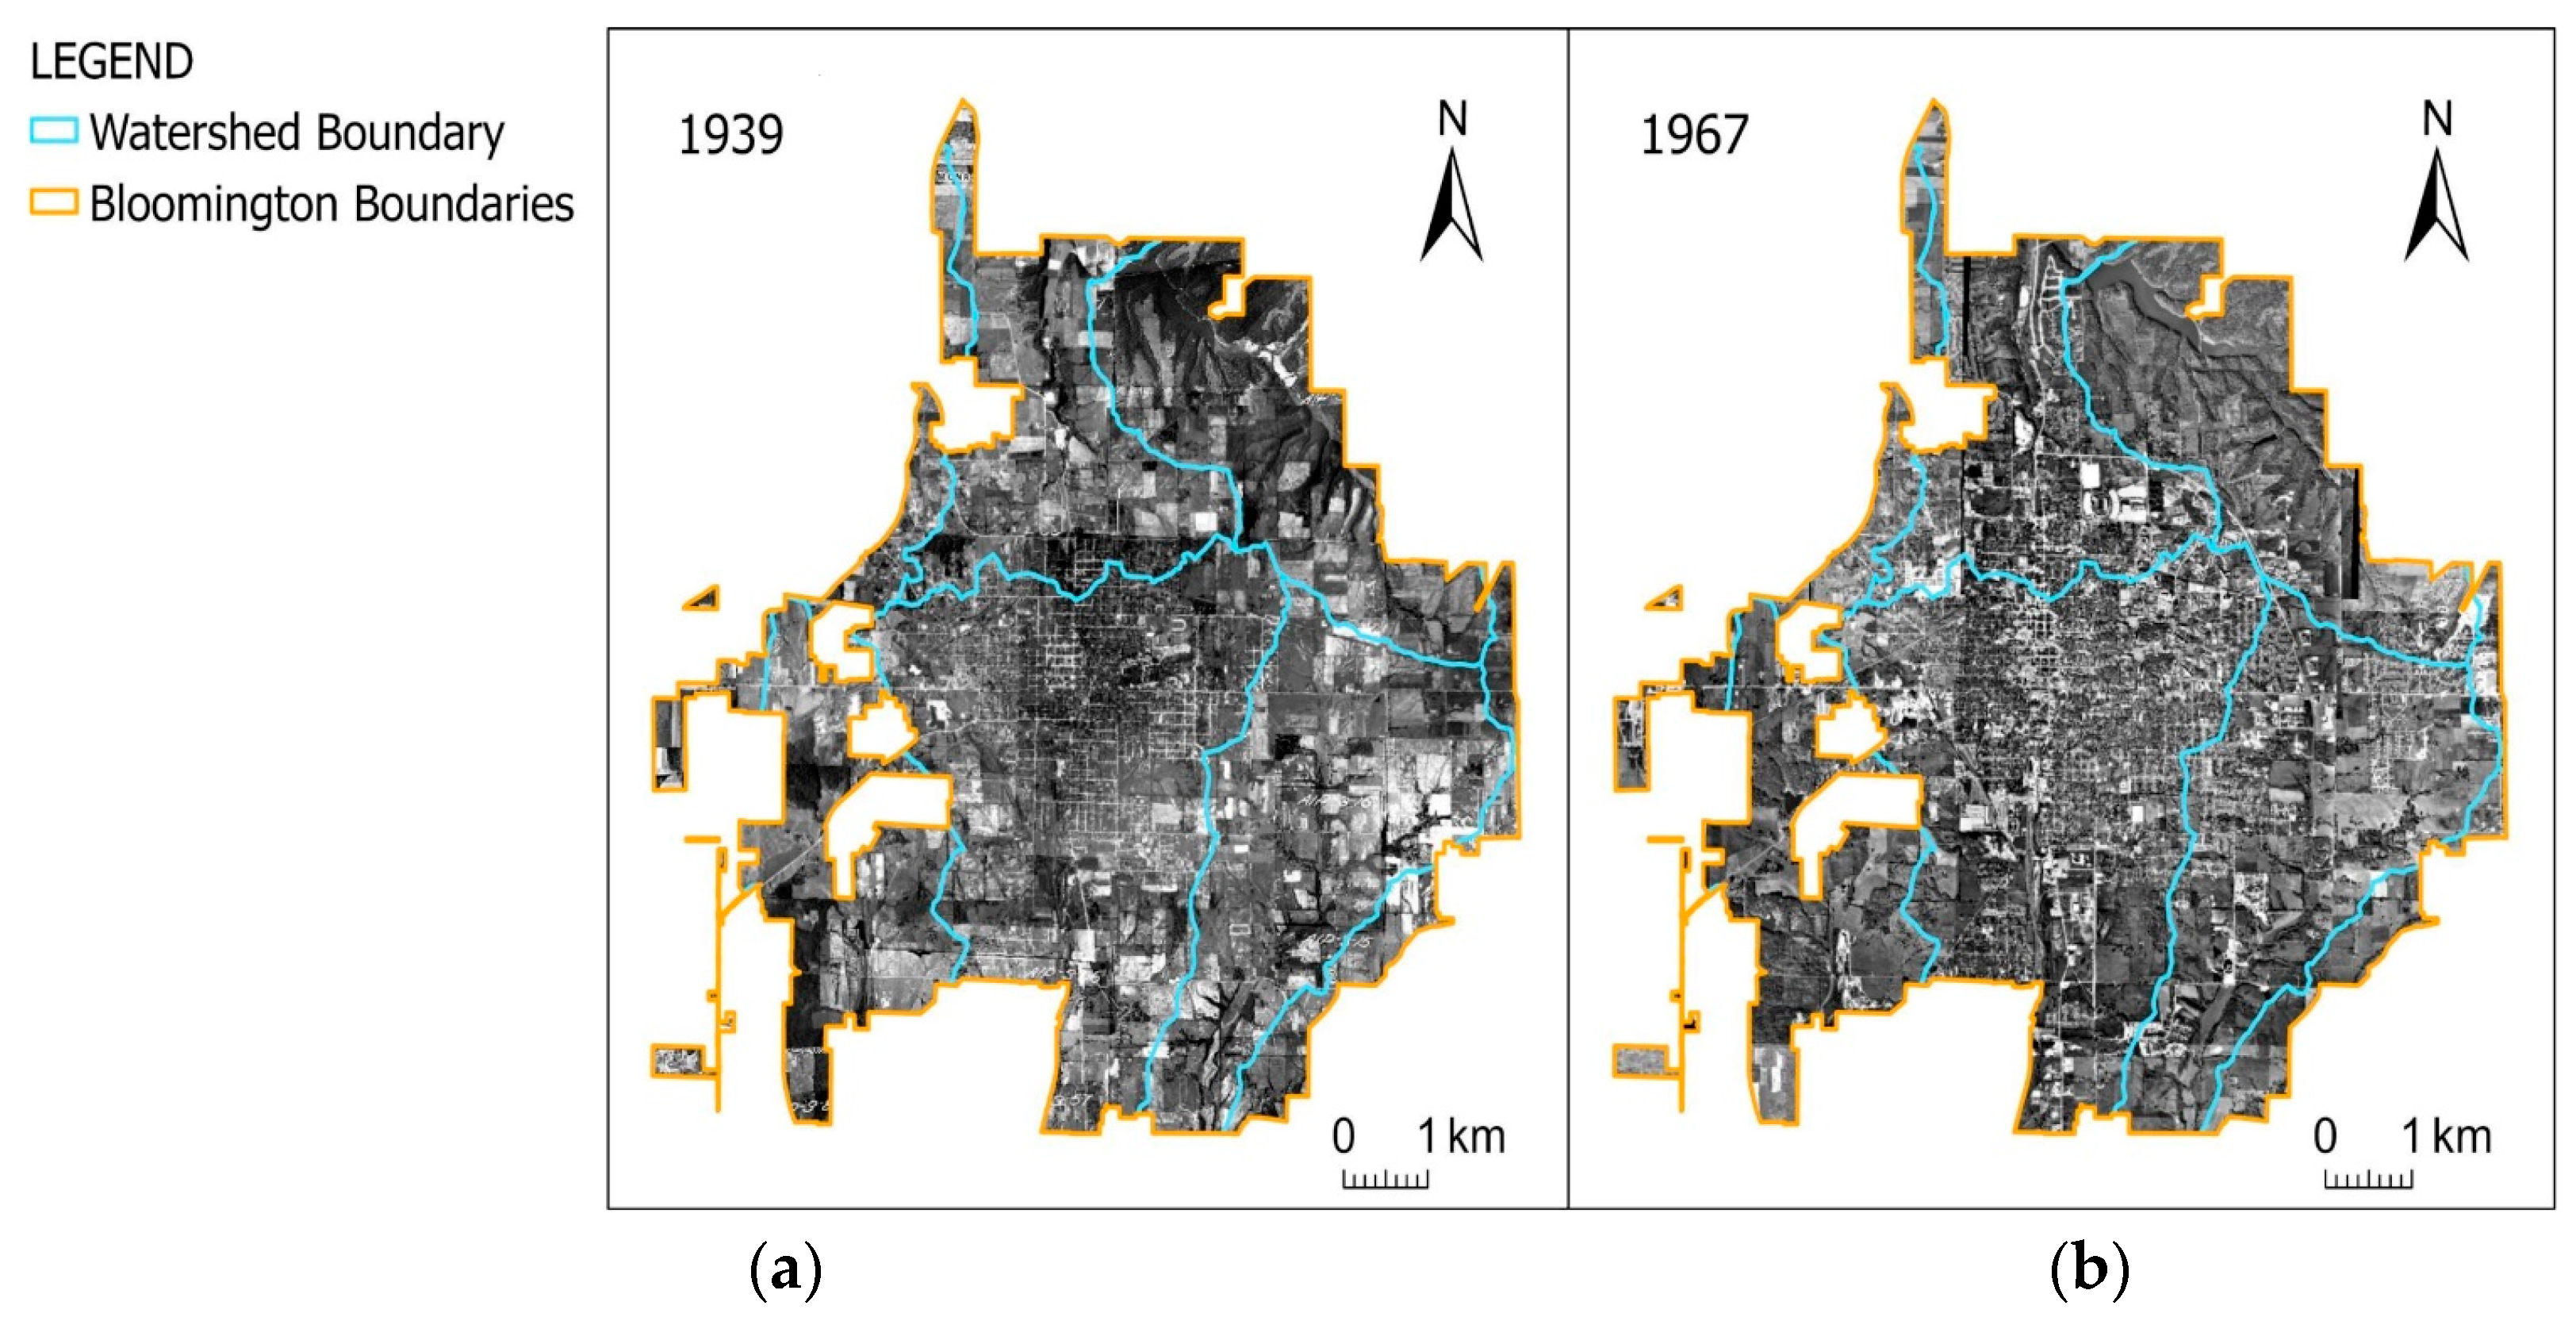
| Basin | 1939 Urban Area | 1967 Urban Area |
|---|---|---|
| Griffy Creek | no | yes |
| WFCC | no | no |
| Stout Creek | no | yes |
| Jackson Creek | no | yes |
| EFJC | no | no |
| Cascade Creek | yes | yes |
| Clear Creek | yes | yes |
| Basin | Percent Buried Streams (PBS) | Percent Channelized Streams (PCS) |
|---|---|---|
| Griffy Creek | 10% | 3% |
| WFCC | 20% | 26% |
| Stout Creek | 17% | 34% |
| Jackson Creek | 28% | 18% |
| EFJC | 23% | 20% |
| Cascade Creek | 29% | 22% |
| Clear Creek | 52% | 20% |
| Benefit | Amount Kiloliter | ±SE |
|---|---|---|
| Avoided Runoff | 127.01 | ±6.59 |
| Evaporation | 2852.13 | ±147.93 |
| Interception | 2870.69 | ±148.89 |
| Transpiration | 2700.73 | ±140.07 |
| Basin | Percent Forested Hydrology (PFH) | Percent Forested Stream (PFS) |
|---|---|---|
| Griffy Creek | 66% | 82% |
| WFCC | 32% | 61% |
| Stout Creek | 42% | 56% |
| Jackson Creek | 33% | 54% |
| EFJC | 30% | 50% |
| Cascade Creek | 27% | 49% |
| Clear Creek | 12% | 29% |
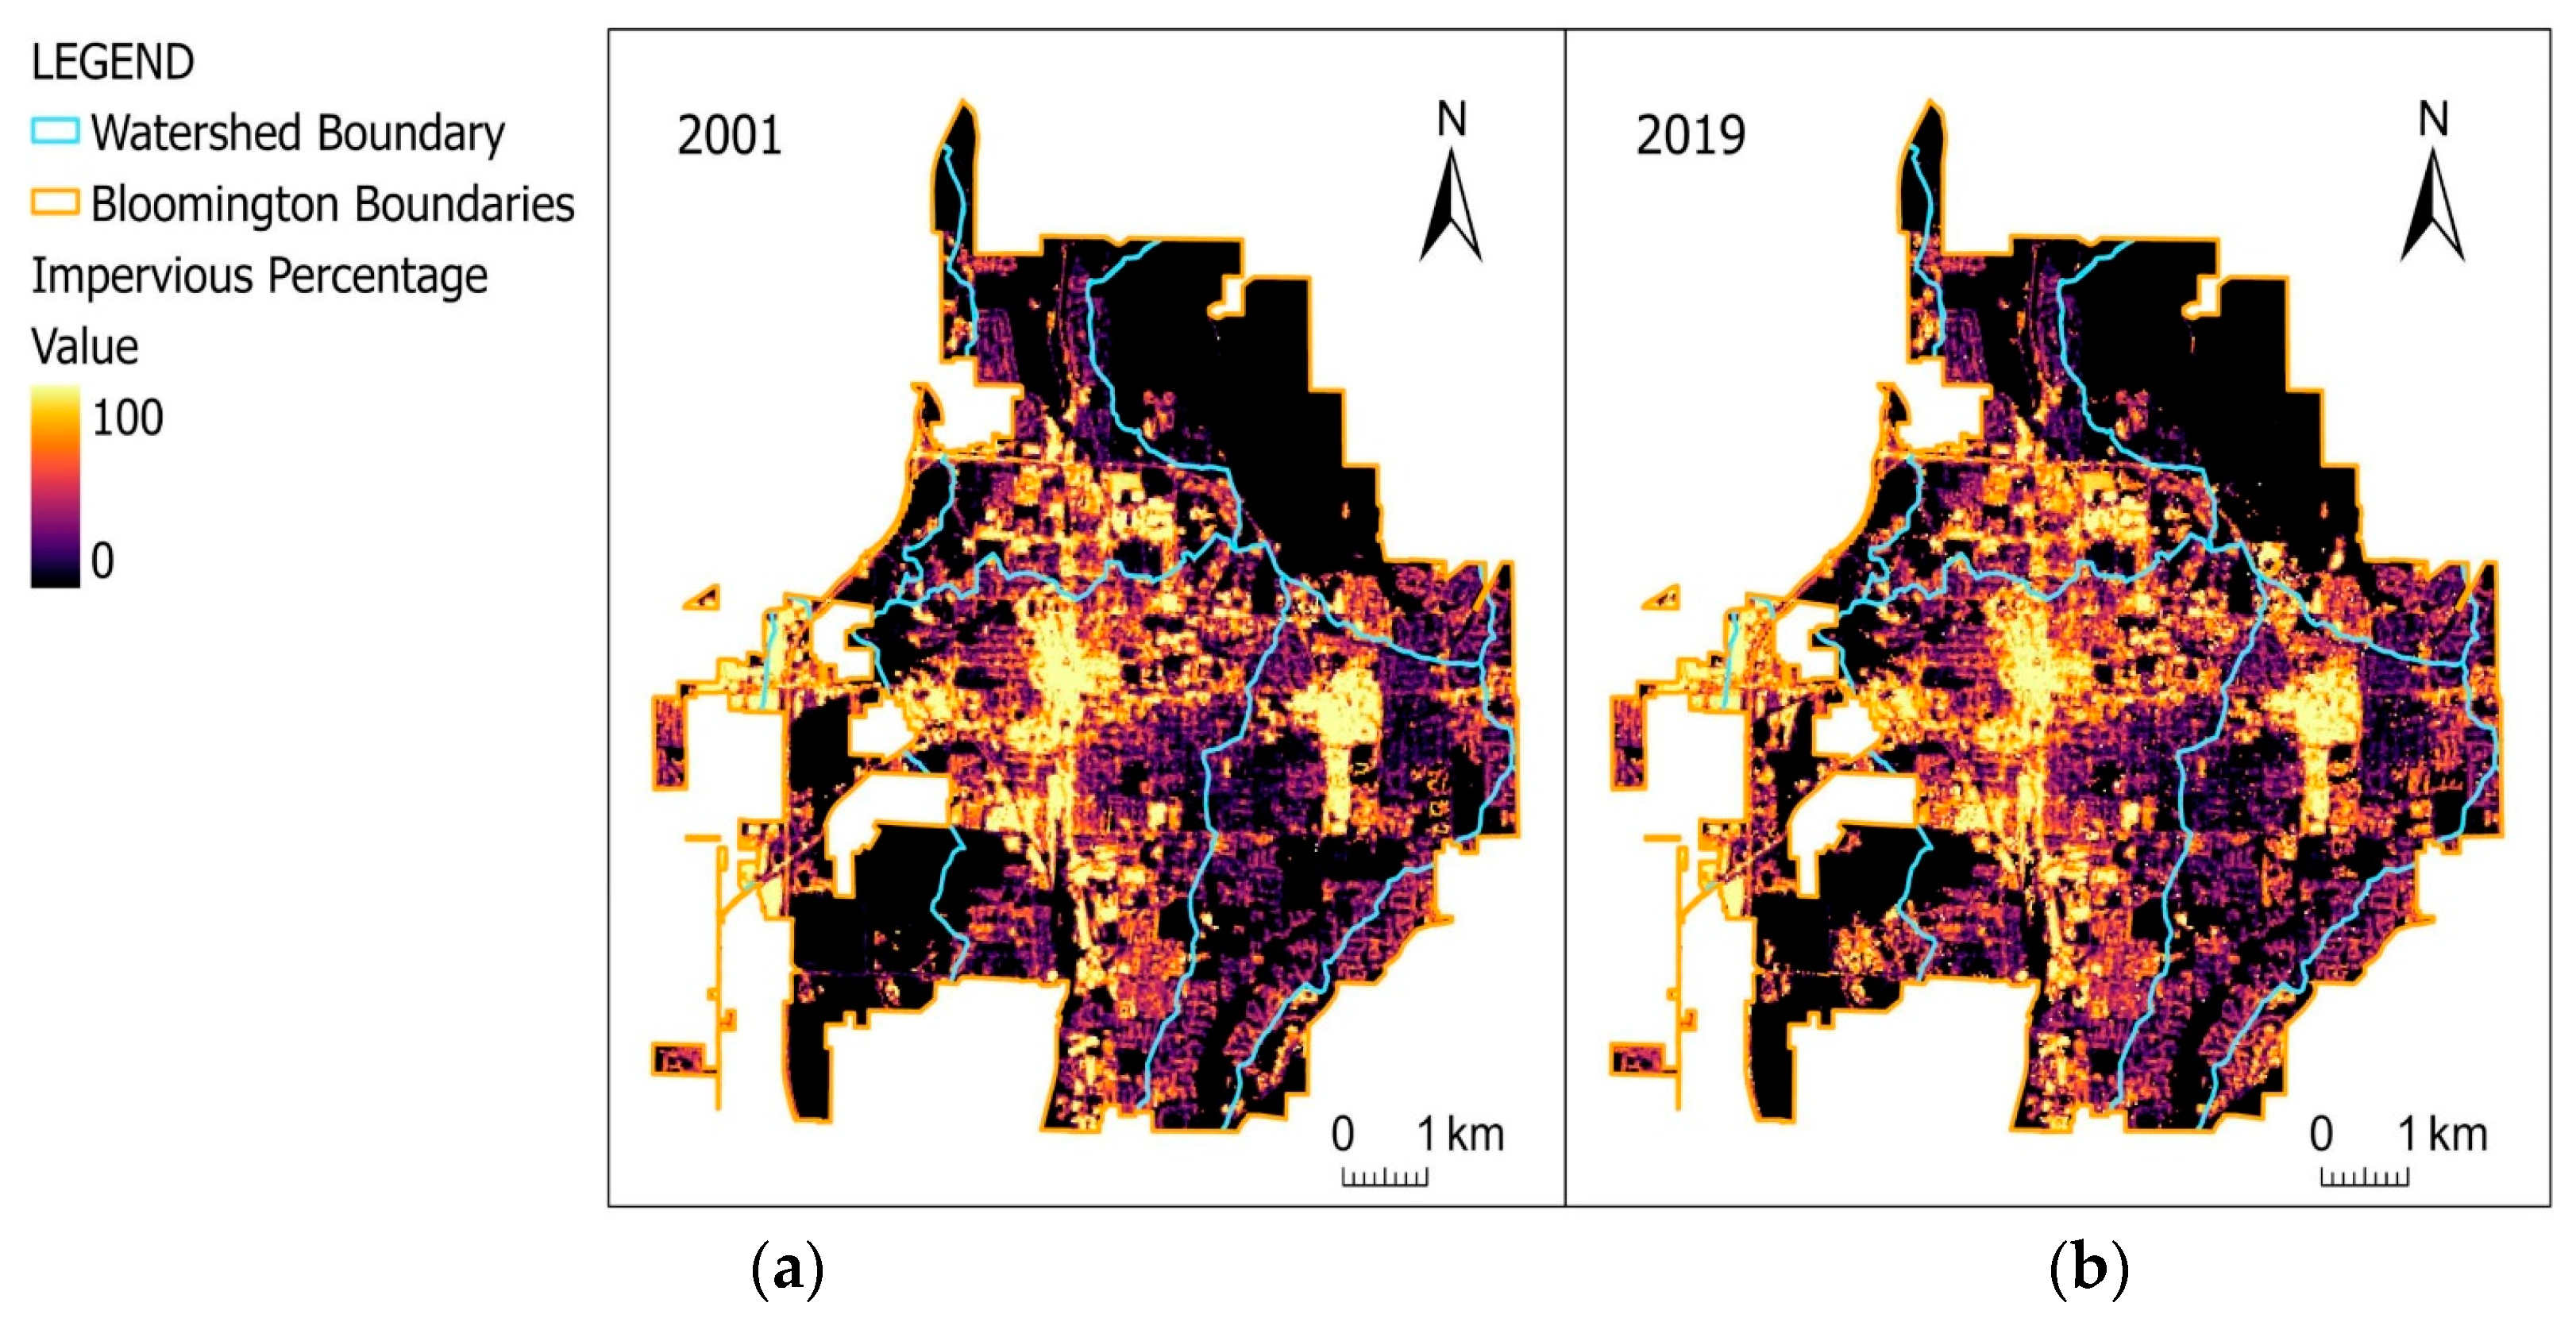
| Basin | Percent UFP Cover | 2001 Average Percent ISC | 2019 Average Percent ISC |
|---|---|---|---|
| Griffy Creek | 59% | 7% | 9% |
| WFCC | 33% | 18% | 25% |
| Stout Creek | 26% | 20% | 24% |
| Jackson Creek | 17% | 23% | 27% |
| EFJC | 12% | 22% | 27% |
| Cascade Creek | 19% | 26% | 29% |
| Clear Creek | 9% | 37% | 40% |
| Basin | 1939 Urban Area | 1967 Urban Area | PBS | PCS | PFH | PFS | Percent UFP Cover | 2001 Average Percent ISC | 2019 Average Percent ISC | Score |
|---|---|---|---|---|---|---|---|---|---|---|
| Griffy Creek | 0 | 1 | 1 | 1 | 1 | 1 | 1 | 1 | 1 | 8 |
| WFCC | 0 | 0 | 3 | 5 | 4 | 2 | 2 | 2 | 3 | 21 |
| Stout Creek | 0 | 1 | 2 | 6 | 2 | 3 | 3 | 3 | 2 | 22 |
| Jackson Creek | 0 | 1 | 5 | 2 | 3 | 4 | 5 | 5 | 4 | 29 |
| EFJC | 0 | 0 | 4 | 3 | 5 | 5 | 6 | 4 | 4 | 31 |
| Cascade Creek | 1 | 1 | 6 | 4 | 6 | 6 | 4 | 6 | 5 | 39 |
| Clear Creek | 1 | 1 | 7 | 3 | 7 | 7 | 7 | 7 | 6 | 46 |
Disclaimer/Publisher’s Note: The statements, opinions and data contained in all publications are solely those of the individual author(s) and contributor(s) and not of MDPI and/or the editor(s). MDPI and/or the editor(s) disclaim responsibility for any injury to people or property resulting from any ideas, methods, instructions or products referred to in the content. |
© 2023 by the authors. Licensee MDPI, Basel, Switzerland. This article is an open access article distributed under the terms and conditions of the Creative Commons Attribution (CC BY) license (https://creativecommons.org/licenses/by/4.0/).
Share and Cite
Luchauer, G.M.; Freeman-Day, S.; Fischer, B.C. Urban Stream Corridors and Forest Patches—The Connections: A Case Study of Bloomington, IN. Sustainability 2023, 15, 8064. https://doi.org/10.3390/su15108064
Luchauer GM, Freeman-Day S, Fischer BC. Urban Stream Corridors and Forest Patches—The Connections: A Case Study of Bloomington, IN. Sustainability. 2023; 15(10):8064. https://doi.org/10.3390/su15108064
Chicago/Turabian StyleLuchauer, Gretchen M., Stephanie Freeman-Day, and Burnell C. Fischer. 2023. "Urban Stream Corridors and Forest Patches—The Connections: A Case Study of Bloomington, IN" Sustainability 15, no. 10: 8064. https://doi.org/10.3390/su15108064