Article

A Novel Two-Phase Approach for Optimization of the Last-Mile Delivery Problem with Service Options

by
Nima Pourmohammadreza
and
Mohammad Reza Akbari Jokar
*
Department of Industrial Engineering, Sharif University of Technology, Tehran 1458889694, Iran
*
Author to whom correspondence should be addressed.
Sustainability 2023, 15(10), 8098; https://doi.org/10.3390/su15108098
Submission received: 18 April 2023 / Revised: 11 May 2023 / Accepted: 13 May 2023 / Published: 16 May 2023
(This article belongs to the Special Issue A Sustainable Approach to Delivery Logistics)

Abstract

:
As the growth of e-commerce continues to accelerate, there is a need for new and innovative strategies in last-mile delivery to meet the changing demands of customers. The main objective of this study is to address this need by optimizing the last-mile delivery problem with service options (LMDPSOs) through a novel two-phase approach that considers various delivery options such as home delivery, self-pickup, and delivery at different prices. This original approach enables simultaneous optimization of the selection of the most appropriate pickup and delivery points and determination of the most efficient vehicle routing. The LMDPSOs reduces overall costs, minimizes environmental impact, and considers customer satisfaction levels by determining the most appropriate trips according to the available service options. This research employs a two-phase methodology for decision making. The first phase determines the value of the proposed locations through a novel multi-criteria decision-making (MCDM) approach that incorporates sustainability criteria. In the second phase, a tailored mathematical model is proposed for vehicle routing with service options. The model is coded in the CPLEXsoftware version 12.6 in various dimensions. We evaluate the potential and advantages of diverse delivery choices, illustrating that aggregating orders at pickup and delivery points can reduce delivery costs and minimize environmental impact. Additionally, this paper directs managers in selecting the most appropriate delivery method for last-mile delivery, considering environmental, social, and economic factors.

1. Introduction

A majority of factories distribute their products in urban areas as well as to wholesalers and retailers using vehicle routing optimization methods. As fuel prices continue to rise and environmental concerns become increasingly prominent, optimizing distribution efficiency will not only have a significant impact on product costs [1] but will also contribute to the reduction in greenhouse gas emissions and promote sustainable urban logistics. This will make it possible to remain competitive with other manufacturing plants while addressing growing sustainability concerns.
On the other hand, indications suggest that e-commerce is poised for sustained rapid growth as a prevalent mode of conducting business. The ability to purchase products over electronic networks applies to all types of products [2]. Over the past fifteen years, mobile software and applications, as well as technological advances in computer science and information technology, have significantly increased the impact of e-commerce. According to Eurostat analysis and reports, more than 2 billion people bought goods or services online for their personal needs as of 2020, and the number of people ordering or purchasing online is on the rise in the European Union between the ages of 16 and 74 [3].
An expedited delivery process and the convenience of online shopping serve to simplify the lives of consumers; thus, online shopping will become more popular in the future. It is also possible for e-commerce retail shops to offer their services in any corner of the country with minimum delivery time and at a reasonable price, which also increases future demand [4]. This growing trend of e-commerce intensifies the importance of sustainable last-mile delivery solutions, as it presents both challenges and opportunities for reducing the environmental impact of logistics operations.
Based on statistical reports that the distribution of goods for the final customer has changed and e-commerce has grown despite time and place limitations, as well as the volume and number of postal items [4], it is crucial for online retailers to determine the best routing and sequence of customer service calls while considering the environmental, social, and economic aspects of last-mile delivery. In distribution and logistics, the vehicle routing problem (VRP) represents a major challenge that needs to be addressed [5].
The most common form of last-mile delivery is home delivery (HD), where a fleet of carriers delivers packages to the customer’s home or workplace. HD services provide customers with the opportunity to receive physical and personal home delivery [6]. However, the operational efficiency of this method decreases when the number of orders is high, causing the probability of losing customers to increase at such times, and as a result, operational costs and environmental impacts increase [7]. There is another type of service called customer pickup (CP) or self-pickup (SP) that has recently been adopted by companies. This approach improves efficiency and maintains customer satisfaction while reducing the environmental impact of multiple delivery attempts [8].
Considering the growing importance of sustainability, this research aims to incorporate environmental and social aspects into the evaluation and optimization of distribution systems. In the first phase, crucial criteria for evaluating pickup and delivery points (PDPs), including sustainability factors, are introduced and analyzed using the step-wise weight assessment ratio analysis (SWARA) approach. The combined compromise solution (COCOSO) scoring approach is then employed to evaluate locations.
After determining the most appropriate PDPs, the second phase involves developing a novel model for the VRP with service options (SOs), combining home delivery (HD), delivery options (DOs), and shared delivery locations (SDLs) based on customer preferences and determined PDPs from the first phase. The model is referred to as VRPSO, which addresses the issue of last-mile delivery in a more effective and sustainable manner.
In summary, this research introduces a novel two-phase approach to optimize the last-mile delivery problem with service options (LMDPSOs) by incorporating sustainability criteria and providing a comprehensive solution for businesses to enhance cost savings, customer satisfaction, and environmental performance in the competitive e-commerce landscape. Furthermore, this approach is expected to facilitate more informed decision making for businesses, enabling them to better align their strategies with customer preferences and achieve short-term and long-term success in the e-commerce industry.
There are four main contributions of this paper:
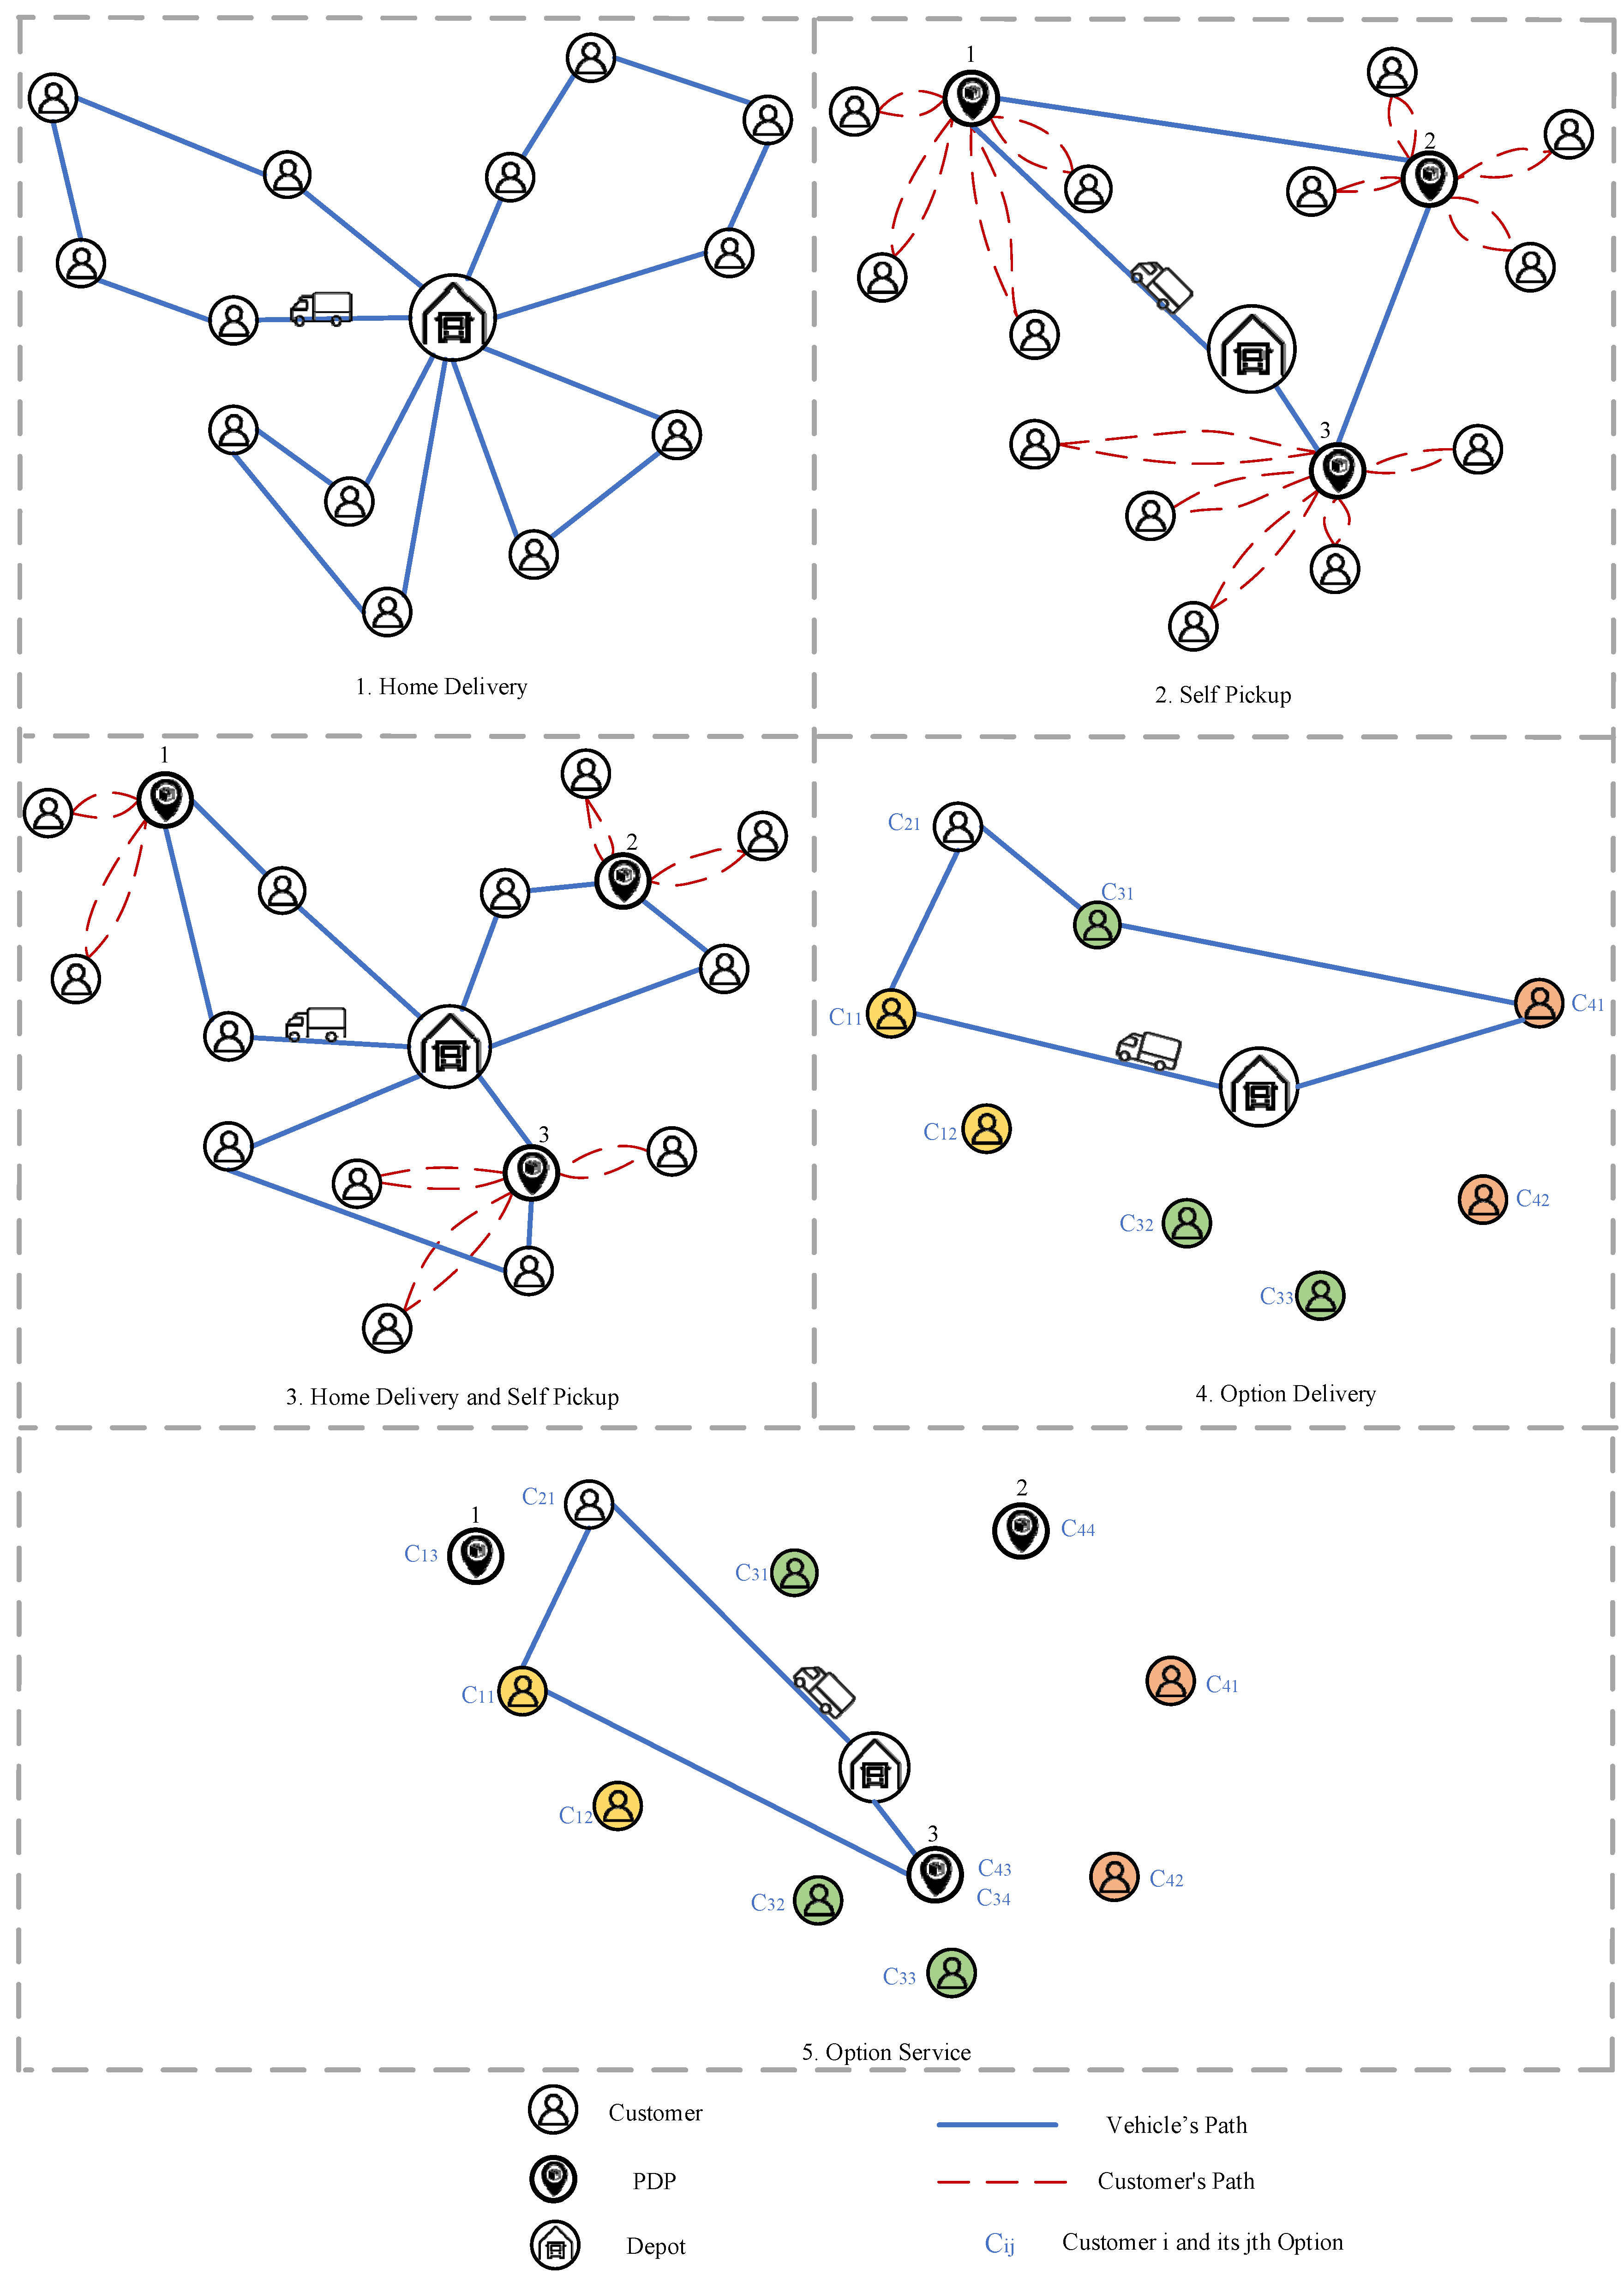
  • Introduction of a novel variation in the VRP: proposing an LMDP with service options (LMDPSOs) by considering home delivery, self-pickup, and delivery options at different prices. In the LMDPSOs, we also consider pickup and delivery simultaneously.
  • The proposed approach enables customers to select different service options based on their priorities and service costs. In this article, the level of customer satisfaction is measured and analyses are performed on the results.
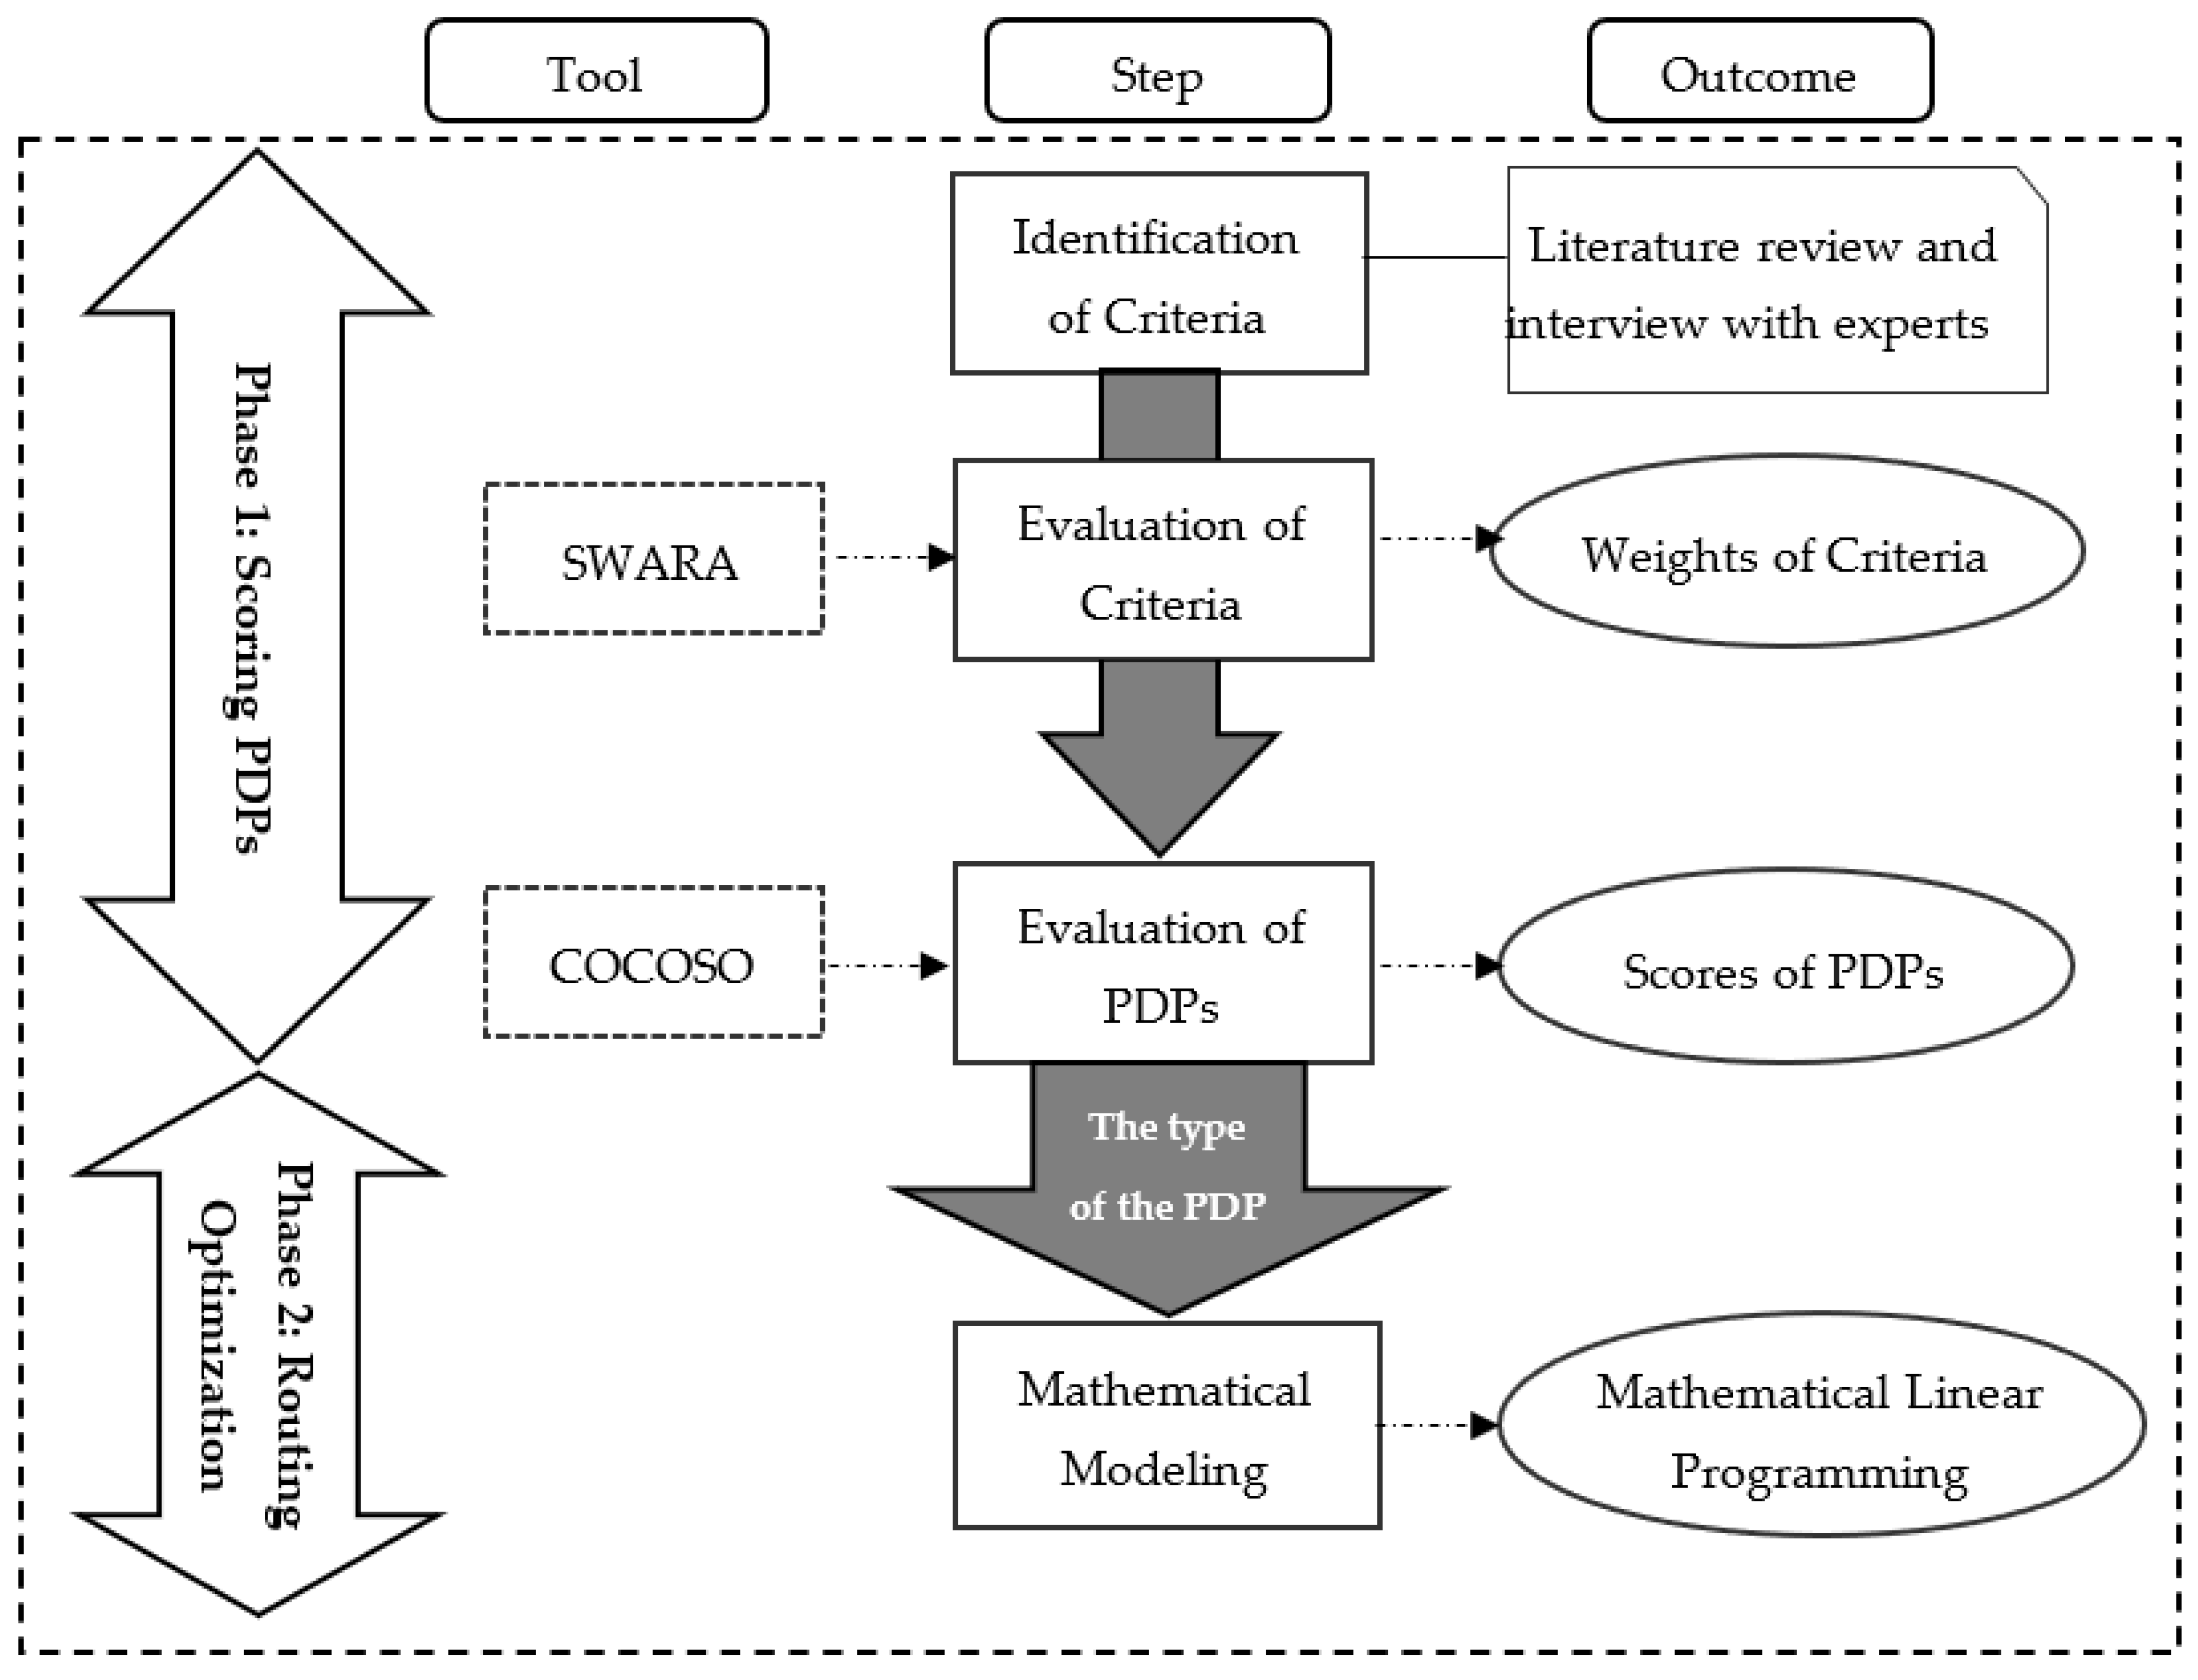
  • We propose a novel strategic and operational approach to VRP problems. An MCDM model (SWARA-COCOSO) is proposed for rating and selecting pickup and delivery points considering economic, environmental, and social criteria, and then developing a tailored mixed-integer linear programming in the second phase based on the outcome of the MCDM model.
  • This paper provides a systematic and efficient approach to simultaneously consider different delivery options (home delivery, self-pickup, and other locations) and customer preferences with a focus on sustainability. This approach can lead to significant cost savings, increased customer satisfaction, and improved environmental performance, thereby enhancing a company’s competitiveness in the marketplace and contributing to sustainable development in the logistics sector.
This paper is structured as follows: Section 2 provides a review of the pertinent literature. Section 3 identifies the options, selects PDPs, and defines the problems and assumptions. Section 4 discusses the case study, numerical results, and analysis of solution performance. Managerial insights are presented in Section 5, and finally, the conclusion and suggestions for future research are discussed in Section 6.

2. Literature Review

Research on vehicle routing problems has been one of the most popular fields in optimization and logistics. This field minimizes costs and finds the optimal route and sequence for serving different customers in different geographical locations by vehicles. The VRP is known as a method of combination optimization for transportation problems. Because of its wide application in providing goods and services to customers, this optimization method has drawn the attention of many researchers and logistics managers looking to reduce costs. Due to the applicability of this problem, many studies have been conducted in this field, and extensive modeling and solution methods have been developed in this area. Dantzig et.al first addressed the traveling salesman problem (TSP), which can be considered the first article in the routing field [9]. Then, Clarke and Wright examined and addressed the issue of multiple vehicles, which can be viewed as the first article in the literature addressing the subject of vehicle routing [10]. The field has undergone extensive research since then, and it has been developed for more than 60 years. In a review article, Mor and Speranza (2022) discussed the classification and development of VRPs [11]. The VRPSO, which will be introduced in detail in Section 3, is a VRP that provides pickup and delivery simultaneously with OD and CP.
Increasing the demand for online shopping has led to higher levels of customer satisfaction by taking advantage of various delivery options depending on the customer’s preferences. Two problems described as the vehicle routing problem with delivery options (VRPDO) and the vehicle routing problem with roaming delivery locations (VRPRDL) have been discussed recently. Savelsbergh and Van Woensel (2016) examined the current and future threats and opportunities associated with city logistics [12]. They mention pickup-point systems as one of the critical concepts for creating reliable last-mile delivery systems. The issue of parcel delivery to the customer’s location, which could be unfixed, was first mentioned in an article by Reyes et al. In his study, Reyes introduced “The Vehicle Routing Problem with Roaming Delivery Locations” and presented an innovative algorithm using dynamic programming as a solution [13]. In VRPRDL, the objective is to find the best route for a fleet of vehicles to deliver goods and parcels to a car, regardless of where the vehicle is parked, based on the (known) travel itinerary of the customer. They formulated the problem as a set-covering problem and solved it with a branch-and-price algorithm [13,14]. These are the first two articles published on the topic of the VRPRDL.
In addition to the mentioned papers, several studies considered real-world conditions in their assumptions; for example, Lombard, Tamayo-Giraldo, and Fontane (2018) and Sampaio et al. (2019) examined the VRPRDL with stochastic travel times [15]. In the VRPRLD, the customer shares some information (e.g., traffic information), whereas in the VRPDO, the location can be anywhere customers choose. HD and SDL are examined together by [16]. After the customer selects their preferred delivery locations, the model determines routes and delivery locations based on the model’s constraints and objectives. The authors of [17] considered dynamic customers in the case of providing dual service, and in the case of customer absence, the objective function considers the waiting time. The authors of [18] introduced the vehicle routing problem involving both private and shared delivery locations, where customers have two options: they can be serviced at home according to their schedules, or they can pick up the delivery themselves from a depot. They proposed two metaheuristics to solve large instances. In these papers, customers select one preferred location; however, in real-world situations, they may have different options with the same or different levels of priorities. In general, providing a greater variety of choices to customers can lead to increased cost efficiency in the routing process.
Consideration of pickup and delivery together could reduce shipping costs for specific industries. The authors of [5] proposed alternative delivery points for simultaneous pickup and delivery problems. They also considered penalties for delivery to alternative locations. Time windows were not considered at either the customer’s location or at alternative delivery locations. Their research is extended by the addition of time windows [19]. The authors of [20] extended the VRPRDL with pickup and delivery and non-overlapping and overlapping time windows. They also solved the problem with an MS-ALNS (multi-start, adaptive, large neighborhood search). As a result, they found that their researched methods and approaches for the VRP could provide cost benefits for logistics companies.
The authors of [21] studied VRPDO with a limited number of vehicles. There were two different types of vehicles: one used for HD and the other for servicing lockers. They solved the model for 75 customers and 10 lockers, along with a metaheuristic based on variable neighborhoods. The authors of [22] considered VRPDO with locker boxes that can be used for pickup and delivery. The goal of this article was to minimize total travel costs. In order to solve this problem, two simulated annealing (SA) algorithms were developed and formulated as mathematical models. In addition, the authors of [23,24] considered pickup and delivery together, but they did not take locker boxes into account. The authors of [25] proposed a model that indicates the number of parcel lockers and the route of the vehicles and assigns the parcels to the vehicles to minimize the travel cost, vehicle cost, and penalty cost for undelivered goods. They presented two metaheuristic algorithms for addressing the problem. The authors of [26] examined the VRP with heterogeneous locker boxes. A mathematical model is put forth with the aim of minimizing the overall cost. Compensation and routing costs are included, along with the packing of parcels into lockers. In addition, a metaheuristic solution method is proposed to minimize the total cost. The authors of [27] considered mobile locker boxes in their article. The location of the locker boxes could be changed during the day to make them more accessible to customers. This problem involves minimizing locker boxes while satisfying all customers.
By using pickup points, last-mile delivery methods have become more diverse, customer satisfaction has increased, delivery costs have decreased, and an effective delivery mechanism has developed. Therefore, the use of pickup points for last-mile delivery is essential [28,29,30]. There are numerous models in the related literature about the location of centers that can be used in the context of the position of parcel lockers [31,32,33].
Despite the diverse range and volume of pickup point problem (PPP) studies, only a few provide practical guidance for decision makers in selecting a PDP. There is a limited body of research specifically addressing PPPs. This work aims to enhance the applicability of models in this context by identifying factors that influence the location of pickup points and subsequently optimizing the vehicle routing problem to minimize travel costs.
In conclusion, to the best of our knowledge, there is no comprehensive study in the existing literature that simultaneously addresses the various aspects of VRPDO and VRPRDL. An overview of the related literature on the VRP with delivery options and self-pickup is provided in Table 1. Columns 2 and 3 indicate the availability of delivery options and self-pickup points, respectively. Column 4 specifies whether pickup and delivery are considered simultaneously. Column 5 denotes whether customer preferences are modeled in the papers. Columns 6 and 7 indicate whether the selection of locations and service costs are considered. Finally, the last column presents the methods employed in the papers. In this research, as shown in the last row of Table 1, the customers can select different locations based on their priorities and also choose self-pickup delivery from a PDP. Based on the related literature, it seems there is no comprehensive study for selecting delivery locations in the context of VRPDO. In this study, we address an approach for rating and selecting pickup points, which is a strategic decision, and operational decisions, which are related to the routing problems.
The literature review emphasized the increasing significance of last-mile delivery in the context of the rise of e-commerce and on-demand services. Last-mile delivery has become a critical factor in customer satisfaction, retention, and the overall cost and efficiency of the transportation process. Numerous studies have been conducted on the VRP, including the VRP with pickup and delivery (VRPPD), the VRPRDL, and the VRP with delivery options (VRPDOs). MCDM methods have also been applied to last-mile delivery problems to evaluate alternative solutions and help decision makers make informed decisions. Below is a comparison between this article and the articles that were reviewed.
  • In several studies in the literature, various variants of vehicle routing problems (VRPs) are proposed to find efficient solutions for last-mile delivery. However, some of them do not consider service options such as home delivery, self-pickup, and delivery options, or they only consider them individually. In contrast, the current study proposes a VRP with service options (VRPSOs) that considers these options together with sustainability factors.
  • In addition, the proposed approach in the current study offers the opportunity for customers to choose different service options based on their priorities and costs. The study measures the level of customer satisfaction and analyzes the results, which is a unique feature in comparison with the other studies.
  • Furthermore, this paper introduces a novel multi-criteria decision-making (MCDM) model (SWARA-COCOSO) that facilitates rating and selecting pickup and delivery points based on sustainability factors. Furthermore, customized mixed-integer linear programming is developed to minimize the cost objective while maintaining a minimum level of customer satisfaction.
  • Acknowledging both strategic and operational decisions in the context of selecting sustainable pickup points is considered a novel approach in the literature. Our proposed method involves rating and selecting pickup points based on sustainability factors and strategically addressing routing problems operationally to optimize transportation efficiency.

3. Problem Definition

The problem under investigation is a set of decisions on LMDPSOs related to selecting the most appropriate locations for pickup and delivery points (PDPs). In order to optimize the problem, these decisions should be made in an integrated structure. Therefore, we developed a novel two-phase approach for location selection and routing planning. To ensure customer satisfaction while minimizing the cost of pickup and delivery, it aims to select PDPs and service customers at a minimal cost. To increase customer satisfaction, customers can choose their preferred PDPs and other service locations (such as home delivery). To evaluate the scores of PDPs while considering sustainability aspects, multi-criteria decision-making methods were employed in the first phase. In the second phase, a mathematical model was devised to optimize routes and achieve predefined objectives.
Relevant studies and expert interviews were conducted to develop criteria for marketplace businesses. In order to rank and prioritize all PDPs, a hybrid multi-criteria decision-making method was developed, employing both SWARA and COCOSO techniques. Specifically, SWARA is used to measure the derived criteria. In the next step, the PDPs are evaluated using the COCOSO method according to the selected criteria. A score is then assigned to each pickup center, followed by a rating. The next phase is based on the results of the first phase. In the second phase, a mathematical model is developed for deciding the proper delivery method and optimizing routes for customers visiting.
As part of a 2-phase hierarchical methodology (Figure 1), the study examines both customer satisfaction and profitability.
In developing the novel two-phase approach for the LMDPSOs, we make several assumptions that are essential for the successful implementation and interpretation of our approach:
  • The set of potential pickup and delivery points is known and fixed.
  • The selection of these points is considered a strategic decision, which is why it constitutes the first phase of our approach.
  • In the first phase, we consider only the environmental and social aspects of sustainability, excluding the economic aspect to avoid biased results. The economic aspect is taken into account in the second phase of our approach.
  • Customer preferences for PDPs and other service locations can be quantified.
  • The decisions made in the first phase regarding the selection of PDPs are binding and will not be revisited during the second phase.
  • The available delivery options, including home delivery, self-pickup, and delivery at different prices, can be feasibly implemented by the delivery service provider.
Additional assumptions specific to the mathematical model for vehicle routing with service options are introduced in the second phase of our research.
Phases 1 and 2 are described in the following:
Phase I: Evaluation of pickup points scores using the SWARA-COCOSO method
The first step in evaluating pickup and delivery locations is to identify the factors that influence these locations. Then, in step 2, the SWARA technique is used to calculate the criteria score. It has been shown in the literature that there are several factors that influence the quality of pickup points. Despite these factors not being collectively employed in the literature, they have been utilized separately in various studies. In the last step of phase 1, a combined compromise solution (COCOSO) scoring approach is used to evaluate locations.
Step 1: The literature related to the establishment of delivery centers indicates that several factors influence customer perceptions of the desirability of pickup points. To choose a pickup point, these factors have been used sporadically in different studies, but they have not been considered together with sustainable last-mile delivery. As a result of the survey, sustainable PDPs must satisfy nine key factors.
Availability: Ensuring PDPs are readily available during the day can enhance customer satisfaction and reduce the likelihood of failed deliveries, thereby minimizing the environmental impact of multiple delivery attempts.
Accessibility: PDPs should be easily reachable via eco-friendly transportation modes, such as walking, cycling, or public transportation, to encourage greener travel options for customers and decrease the overall carbon footprint of the distribution process.
Security: Centers must prioritize safety and security measures to safeguard goods, mitigating the risk of theft or other incidents that could adversely affect social welfare and economic costs.
Environmental Impact: PDPs should minimize energy consumption, waste generation, and pollution by employing energy-efficient equipment.
The number of Facility Staff: Refers to the number of personnel available at a pickup or delivery point to assist customers and manage deliveries. Points with more staff are preferable, as they can provide better customer service and ensure efficient operations and social sustainability.
Disaster Resilience: PDPs should be located in areas with low risk of natural disasters or have adequate measures in place to mitigate potential impacts, ensuring the continuity of operations, protecting employees and customers, and reducing potential economic losses.
Methods of Use: The methods of use factor refers to the strategies and procedures implemented at the PDPs to ensure a seamless and sustainable customer experience.
Regulations: Centers must comply with all pertinent environmental, social, and safety regulations, thus demonstrating a commitment to responsible business practices and contributing to sustainable development within the logistics sector.
Capacity: PDPs ought to have sufficient capacity to handle existing demand and potential future growth, ensuring efficient resource utilization and adaptability to evolving customer requirements and ultimately fostering long-term economic sustainability for the distribution system.
Table 2 summarizes the criteria along with their explanations and sources.
Step 2: After selecting the factors in the previous step, the SWARA method, a new criteria scoring technique in MCDM literature is applied for ranking criteria [60]. Using this approach, specialists determine the criteria’s weights using their expertise. In accordance with their knowledge, information, and experience, each expert determines each criterion’s importance. To evaluate the weight of each criterion, experts’ opinions about the advantages of each criterion are gathered, and a normalization method is applied [61]. In this method, experts are asked to evaluate the rank of factors in the process of scoring them, which is its main feature. It is not dependent on any assessment process to solve decision problems or to arrange criteria. Instead, weights and priorities are determined by a scale based on the plans and strategies of an organization [62]. In Table 3, the results of the SWARA method are shown.
The table indicates the results of using the SWARA method to rank various factors related to the installation and maintenance of PDPs. The comparative importance of each factor is listed based on its average value, and a coefficient is calculated for each factor. The coefficients are then used to recalculate the weight of each factor, resulting in a final weight (WC) for each. The factors are then ranked based on their final weight, with C1 (availability) being the most important factor and C5 (number of facility staff) being the least important. The steps are explained in Appendix A. Moreover, the ranking of criteria by the experts is provided in Appendix B.
Step 3: A combined compromise solution technique (COCOSO) is applied during the last step of phase 1. In the field of (MCDM), this method is a reliable and appropriate technique for rating options [63]. In this method, the weighted sum and weighted product are computed after constructing and normalizing the decision matrix. Three different strategies are then used to evaluate the options. Lastly, scores are determined by a linear–exponential function. The results of the COCOSO technique are presented in Table 4. Finally, the assessment of the SWARA-COCOSO scoring approach is used to determine the pickup points in the next phase of implementation. The final scoring column in Table 4 displays the results of this scoring method.
Table 4 presents the results of the COCOSO method used for evaluating different pickup points in terms of their suitability for implementation. The table includes five pickup points labeled A1 to A5, and each point is evaluated based on three different scoring strategies (Ka-Kb-Kc). Based on the final scoring results, pickup point A3 received the highest score, while A4 received the lowest score among all pickup points. The COCOSO method provided a comprehensive approach to evaluate the pickup points and helped in selecting the most appropriate location for implementation. The steps are explained in Appendix C.
Phase II: Problem structure, mathematical modeling
The problem under investigation is a vehicle routing problem with service options. Delivery of parcels to customers at the lowest possible cost is the goal of the problem. Customers are given the opportunity to choose between self-pickup or home delivery based on their preferences to increase customer satisfaction (Figure 2). The VRP developed in this study includes n customers with a certain amount of demand for delivery. Based on the proposed model, the customer’s preferences are determined, while also ensuring that a minimum level of satisfaction is achieved. Using the information consumers provide, the company can plan routes based on their priorities, as shown in Table 5. As an example of the VRPSO, in part five of Figure 2, there are three PDPs and four customers that can choose different locations (C12 indicates the second option of customer 1).
Table 5 presents a sample of data that customers furnish to an organization for the purpose of planning delivery routes according to their priorities. The table consists of four customers, each denoted by a unique number. For every customer, three columns represent their preferences regarding delivery alternatives, which include home delivery, self-pickup point 1, and self-pickup point 2. Customers express their preferences by allocating a numeral from 1 to 3, with 1 signifying the top priority and 3 the least.
For instance, Customer 1 indicated that their highest priority is home delivery with a priority of 1, followed by self-pickup point 1 with a priority of 2.
Figure 2 presents several variations of the vehicle routing problem (VRP). The Section 1 depicts the traditional VRP with one hub, thirteen demand nodes (customers), and three routes. The Section 2 depicts the VRP with self-pickup, where all customers collect their parcels from designated pickup points. The Section 3 displays simultaneous self-pickup and home delivery, where some customers receive parcels at home, while others collect them from pickup points. The Section 4 illustrates the VRP with optional delivery, where customers (each color represents a unique customer). can choose different delivery locations without any pickup points. Finally, the Section 5 shows the VRP with service options, where customers select their preferred delivery service (home delivery, other locations, or pickup points), and the company optimizes its route accordingly while considering these choices.
The following are model assumptions:
  • The fleet of vehicles has a specific and limited capacity.
  • Customers are visited and serviced by a vehicle only once.
  • Vehicles start their trips from the warehouse and return to the warehouse after servicing all the customers assigned to them.
  • Vehicles have two types of fixed and variable costs per kilometer.
  • Delivery to one of the customer’s selected options is essential.
  • Pickup points have a specific and limited capacity.
The type of model we developed is a mixed-integer model. First, the symbols used in the model are defined in Table 6, and then the model is described.
The VRPSO is modeled on a graph G = (E, A) that indicates the network in which E0 = {0} EP, the depot is represented with number 0, and Ep = {1, …, ep} is the set of pickup points. A = {(i, j): i, j   V } is the set of arcs, and Cij indicates the cost of the arc (i, j)     A , which is fixed and known in advance. Each customer n has a known demand (dn 0 ) that must be served in one of the customer’s options. Each vehicle commences its journey from the designated depot and ultimately returns to the same location upon completion of the route.
Based on the above statements, the vehicle routing problem with service options model is formulated as follows:
min   Z = ( i j k ( C i j × X i j k ) + r ( C F k × U k ) ) n j ϵ E p k ( P S × Z n j k ) n j ϵ E H k ( P H × Z n j k )
j k A n j × Z n j k = 1       n   ϵ   N
i X i j k = i X j i k         i     j ,   j   ϵ   E ,   k   ϵ   K
i E X 0 i k = j E X j 0 k           k   ϵ   K
D i j k X i j k × Q k           k   ϵ   K ,   i ,   j   ϵ   E
n Z n j k . N i E 0 X i j k         j   ϵ   E ,   k   ϵ   K
n k Z n j k C p j           j   ϵ   E
i j X i j k M × j X 0 j k           k   ϵ   K
i D i j k n d n × Z n j k + i D j i k         j   ϵ   E ,   k   ϵ   K
j E D 1 j k = n d n × n j d n × Z n j k           k   ϵ   K
j D j 0 k = 0           k   ϵ   K
i X i j k M × U k             k   ϵ   K
j J n = 1 N P r n j / n N j J A n j n N j J Z n j k × P r n j                 k   ϵ   K
D i j k + D j i k = D j i k         i , j   ϵ   E ,   k   ϵ   K
i D i j k n d n × Z n j k + i D j i k         j   ϵ   E ,   k   ϵ   K
i D i j k n p n × Z n j k + i D j i k         j   ϵ   E ,   k   ϵ   K
k j D 0 j k = 0
k j D j 0 k = n p n
k j D 0 j k = n d n
k j D j 0 k = 0
Y i k Y j k + N × X i j k < = N 1           i j , i , j   ϵ   E   ,   k   ϵ   K
X i j k = { 0 , 1 }           i , j   ϵ   ( E ) ,   j   ϵ   E , k   ϵ   K
Z n j k = { 0 , 1 }           i , j   ϵ   ( E ) , k   ϵ   K ,   n   ϵ   n
U k = { 0 , 1 }           k   ϵ   K
In Equation (1), the objective function of the problem aims to minimize the aggregate of fixed and variable costs related to vehicle utilization while concurrently maximizing the revenue generated from the provided services. Equation (2) guarantees that each customer is served only once. According to Equation (3), a vehicle must leave a location after entering it. Equation (4) ensures that if a vehicle leaves the depot, it must return to it. According to Equation (5), the flow is guaranteed to respect the capacity of each vehicle on all arcs. According to Equation (6), a vehicle will not travel to a location if there are no shipments designated for transport to that destination. Equation (7) ensures the limited capacity of PDPs. Using Equation (8) ensures that vehicles must leave the depot before they can be used. Equations (9)–(11) ensure the flow of vehicles. Equation (12) shows which vehicles were used. It is guaranteed by Equation (13) that the average customer satisfaction is not less than 50%. The right part of Equation (13) indicates the sum of delivery priorities, and the ideal number equals the number of customers (servicing to the first priority of all customers). Equation (14) indicates that the total freight transported will be the sum of the delivery and pickup over an arc. Equations (15) and (16) update the flow of pickup and delivery demands. It is shown in Equations (17)–(20) that freight is picked up and delivered at the beginning and end of each route, and Equation (21) eliminates sub-tours. Finally, Equations (22)–(24) illustrate binary and positive variables.

4. Computational Results

This article presents an extension form of the classical vehicle routing problems. It is solved using IBM ILOG CPLEX software version 12.6 on a system with a 2 GHz core i7 processor and 8 GB of RAM in various dimensions.
To the best of our knowledge, there is no specific dataset in the literature that is relevant to our proposed research (VRPSO). Based on a uniform distribution, the pickup and delivery points and depot locations are distributed in a [0, 1000] [0, 1000] square [64]. Through the EUC_2D function in TSPLIB [65], routing costs are also calculated by Euclidean distances. In the following, we review the outcomes obtained by resolving the model.
Table 7 presents the solutions for solving the model in 10 dimensions. The solution time increases exponentially with the number of customers, as shown in Table 7. We examined three cases: VRPHD, VRRSP, and VRPSO. Costs are significantly reduced when PDPs are included in the model. A comparison of the solution time and the objective function value of the two models, VRPSP and VRPSO, shows that the cost increases in the case of VRPSO because, in this case, the customer may prefer home delivery to self-pickup, which may increase the system cost. It is critical to note that allowing customers to make their own choices will increase customer satisfaction despite increasing the model complexity and transportation costs.
Table 8 shows the relationship between travel expenses and changes in customer satisfaction for different numbers of customers. The table presents the minimum acceptable travel expenses for each level of customer satisfaction, ranging from 0% to 100%, for 4, 8, 12, 16, 20, and 22 customers.
For example, consider a scenario with 12 customers. To maintain a minimum acceptable customer satisfaction level of 50%, the company should be prepared to allocate at least 8247 units of currency to transportation costs. Likewise, to attain a higher customer satisfaction level of 75%, an expenditure of at least 8584 units of currency is necessary.
As the customer base expands, the minimum acceptable transportation expenses also rise. In the case of 22 customers, the company must allocate at least 14,264 units of currency to achieve a minimum acceptable customer satisfaction level of 50%. For a satisfaction level of 100%, an expenditure of at least 18,192 units of currency is required.
As shown in Figure 3, the most significant amount of change occurs when one or two options are available. Afterward, the reduction in the objective function decreases. There is also a direct correlation between the number of customers and the eventual savings that can be achieved through this approach.
Figure 4 illustrates the changes in the OFV due to applying discounts in PDPs to HD. On the basis of the objective function, we determine the optimal discount rate in this example to reduce costs as much as possible. It is assumed that customers’ demands for servicing at PDPs is linearly related to the discount rate in these centers. Therefore, as the discount rate increases, more people will request service at PDPs. Furthermore, according to the objective function of the model, providing a 100% discount and attracting maximum customers to PDPs will result in a decrease in profits; according to Figure 4, when P S P H = 1 (no discount), we will experience more costs and, therefore, less profit than when P S P H = 0.8 (20% discount). Continuing the trend, the graph shows that when a 50% discount is applied ( P S P H = 0.5 ), the OFV will be higher than when no discount is applied.
A comparative analysis plays a vital role in academic research, as it is employed to examine the trustworthiness of the proposed methods. In this paper, a comparative analysis was conducted to verify the credibility of the results obtained through the hybrid SWARA-COCOSO method for selecting PDP locations. We employed four different methods to verify the outcomes obtained by the proposed SWARA-COCOSO model, including SWARA-EDAS (the evaluation based on distance from average solution), OPA (ordinal priority approach)-COCOSO, OPA-EDAS, and OPA. By examining the outcomes derived from these approaches, we can effectively assess the reliability and suitability of each method in the context of PDP location selection. This comparative analysis helps to ensure the accuracy and reliability of the results, ultimately leading to more informed and adequate decision making in the selection of PDP locations. These methods are thoroughly explained in Appendix D of the article, and the final results are presented in Table 9.
Based on the analysis of Table 9, alternative A3 consistently ranks as the best PDP across all evaluation methods. This indicates that A3 is the most sustainable option by these methods. The outcomes derived from the application of different MCDM methods demonstrate a considerable degree of uniformity in the ranking of the optimal provider. This consistency underscores the reliability of the SWARA-COCOSO method, which is introduced in this study, for the selection of sustainable pickup and delivery centers.
In this part, we discuss the advantages and potential limitations of our proposed method for last-mile delivery optimization. The advantages of our approach are as follows:
  • Comprehensive evaluation: The SWARA method provides a systematic approach to determine the relative importance of multiple criteria, while the CoCoSo method scores the alternatives based on these criteria. This combination allows for a comprehensive evaluation of pickup and delivery points by considering various sustainability dimensions.
  • Subjectivity reduction: Compared with other methods, the combined SWARA and CoCoSo approach effectively reduces subjectivity in the decision-making process. SWARA’s step-wise technique simplifies weight assignment, while CoCoSo addresses interdependencies among sustainability objectives using a cross-consistency assessment.
  • Lower objective function values (OFV): Based on Table 6, using the VRPSO method leads to an average reduction of 14% in OFV when compared with the VRPSP method. This demonstrates that the VRPSO method provides more optimal solutions for last-mile delivery problems, resulting in cost savings and increased efficiency in real-world applications.
  • Improved customer satisfaction: By incorporating customer satisfaction considerations into our method, we can better address the preferences and needs of customers, leading to more tailored and customer-centric solutions that can ultimately enhance overall customer satisfaction levels and strengthen relationships with end users (Table 8).
  • Simultaneous consideration of strategic and operational decisions: The proposed approach integrates both strategic (PDPs selection) in Phase 1 and operational decision making (Routing) in Phase 2 while incorporating sustainability aspects, thus enabling more effective planning and better overall performance in last-mile delivery.
  • Inclusion of various last-mile delivery options: We also consider a diverse range of delivery options, such as optional delivery, self-pickup at different prices, and combined pickup and delivery services, allowing for more customized and efficient solutions that address customer preferences and needs more effectively than existing methods.
  • Novel framework for new last-mile delivery problems: Furthermore, our research presents an innovative framework that can be readily applied to emerging last-mile delivery challenges, ensuring that our approach remains relevant and useful as the field continues to evolve.
Due to the consideration of various last-mile delivery options, our method’s solution time is slightly longer than that of the classic VRP and the VRPSP. However, the difference in solution time is not substantial, and the benefits of our approach outweigh this minor drawback. Implementing our approach requires making strategic decisions and identifying suitable pickup and delivery centers based on each specific case, which can be somewhat challenging. Nonetheless, we believe that the advantages of our method, such as improved sustainability, increased customer satisfaction, and cost savings, more than compensate for this complexity.
In conclusion, the proposed method presents a valuable contribution to the field of last-mile delivery optimization by addressing multiple aspects of the problem and offering a comprehensive and sustainable solution.

5. Managerial Insights

The practical implications of using the novel two-phase approach in this paper can be derived from the research findings on the approach for VRPSO. Managers can use the following practical takeaways and recommendations based on these findings to guide their decisions and actions.
  • According to the findings of the first phase of the proposed approach, it is recommended that the company prioritize the criteria of availability and accessibility when selecting delivery centers. By focusing on these criteria, the company can ensure that its delivery centers are easily accessible to customers and provide reliable services. This can lead to increased customer satisfaction and loyalty, as well as improved operational efficiency and cost-effectiveness. Therefore, the company should allocate resources and efforts to improve these criteria for their delivery centers.
  • Adding PDPs to the last-mile delivery model can significantly reduce costs but at the cost of increased complexity and solution time. The comparison between VRPSP and VRPSO models highlights the importance of considering customer preferences and satisfaction in the decision-making process, even if it may lead to increased costs. Therefore, managers should carefully balance the trade-offs between cost, complexity, and customer satisfaction when designing and implementing last-mile delivery strategies.
  • It is essential to consider customer satisfaction as a critical factor in the last-mile delivery process. This study shows that investing in measures to improve customer satisfaction, such as providing flexible delivery options, can lead to improved routing plans and, ultimately, better business outcomes. Therefore, companies should prioritize customer satisfaction as a key performance indicator and strive to improve the delivery experience for their customers continuously.
  • Offering multiple delivery options to customers can considerably enhance the efficacy of the last-mile delivery process. By presenting customers with various delivery alternatives, the total delivery cost can be diminished, as evidenced by the reduction in the objective function. Moreover, the magnitude of savings attained is directly correlated to the number of customers who utilize alternative delivery options. This indicates that managers ought to contemplate implementing strategies that encourage customers to select these alternatives, such as providing incentives or increasing the visibility of these options during the checkout process. By adopting such measures, managers can decrease delivery expenses and augment the overall efficiency of their last-mile delivery operations.
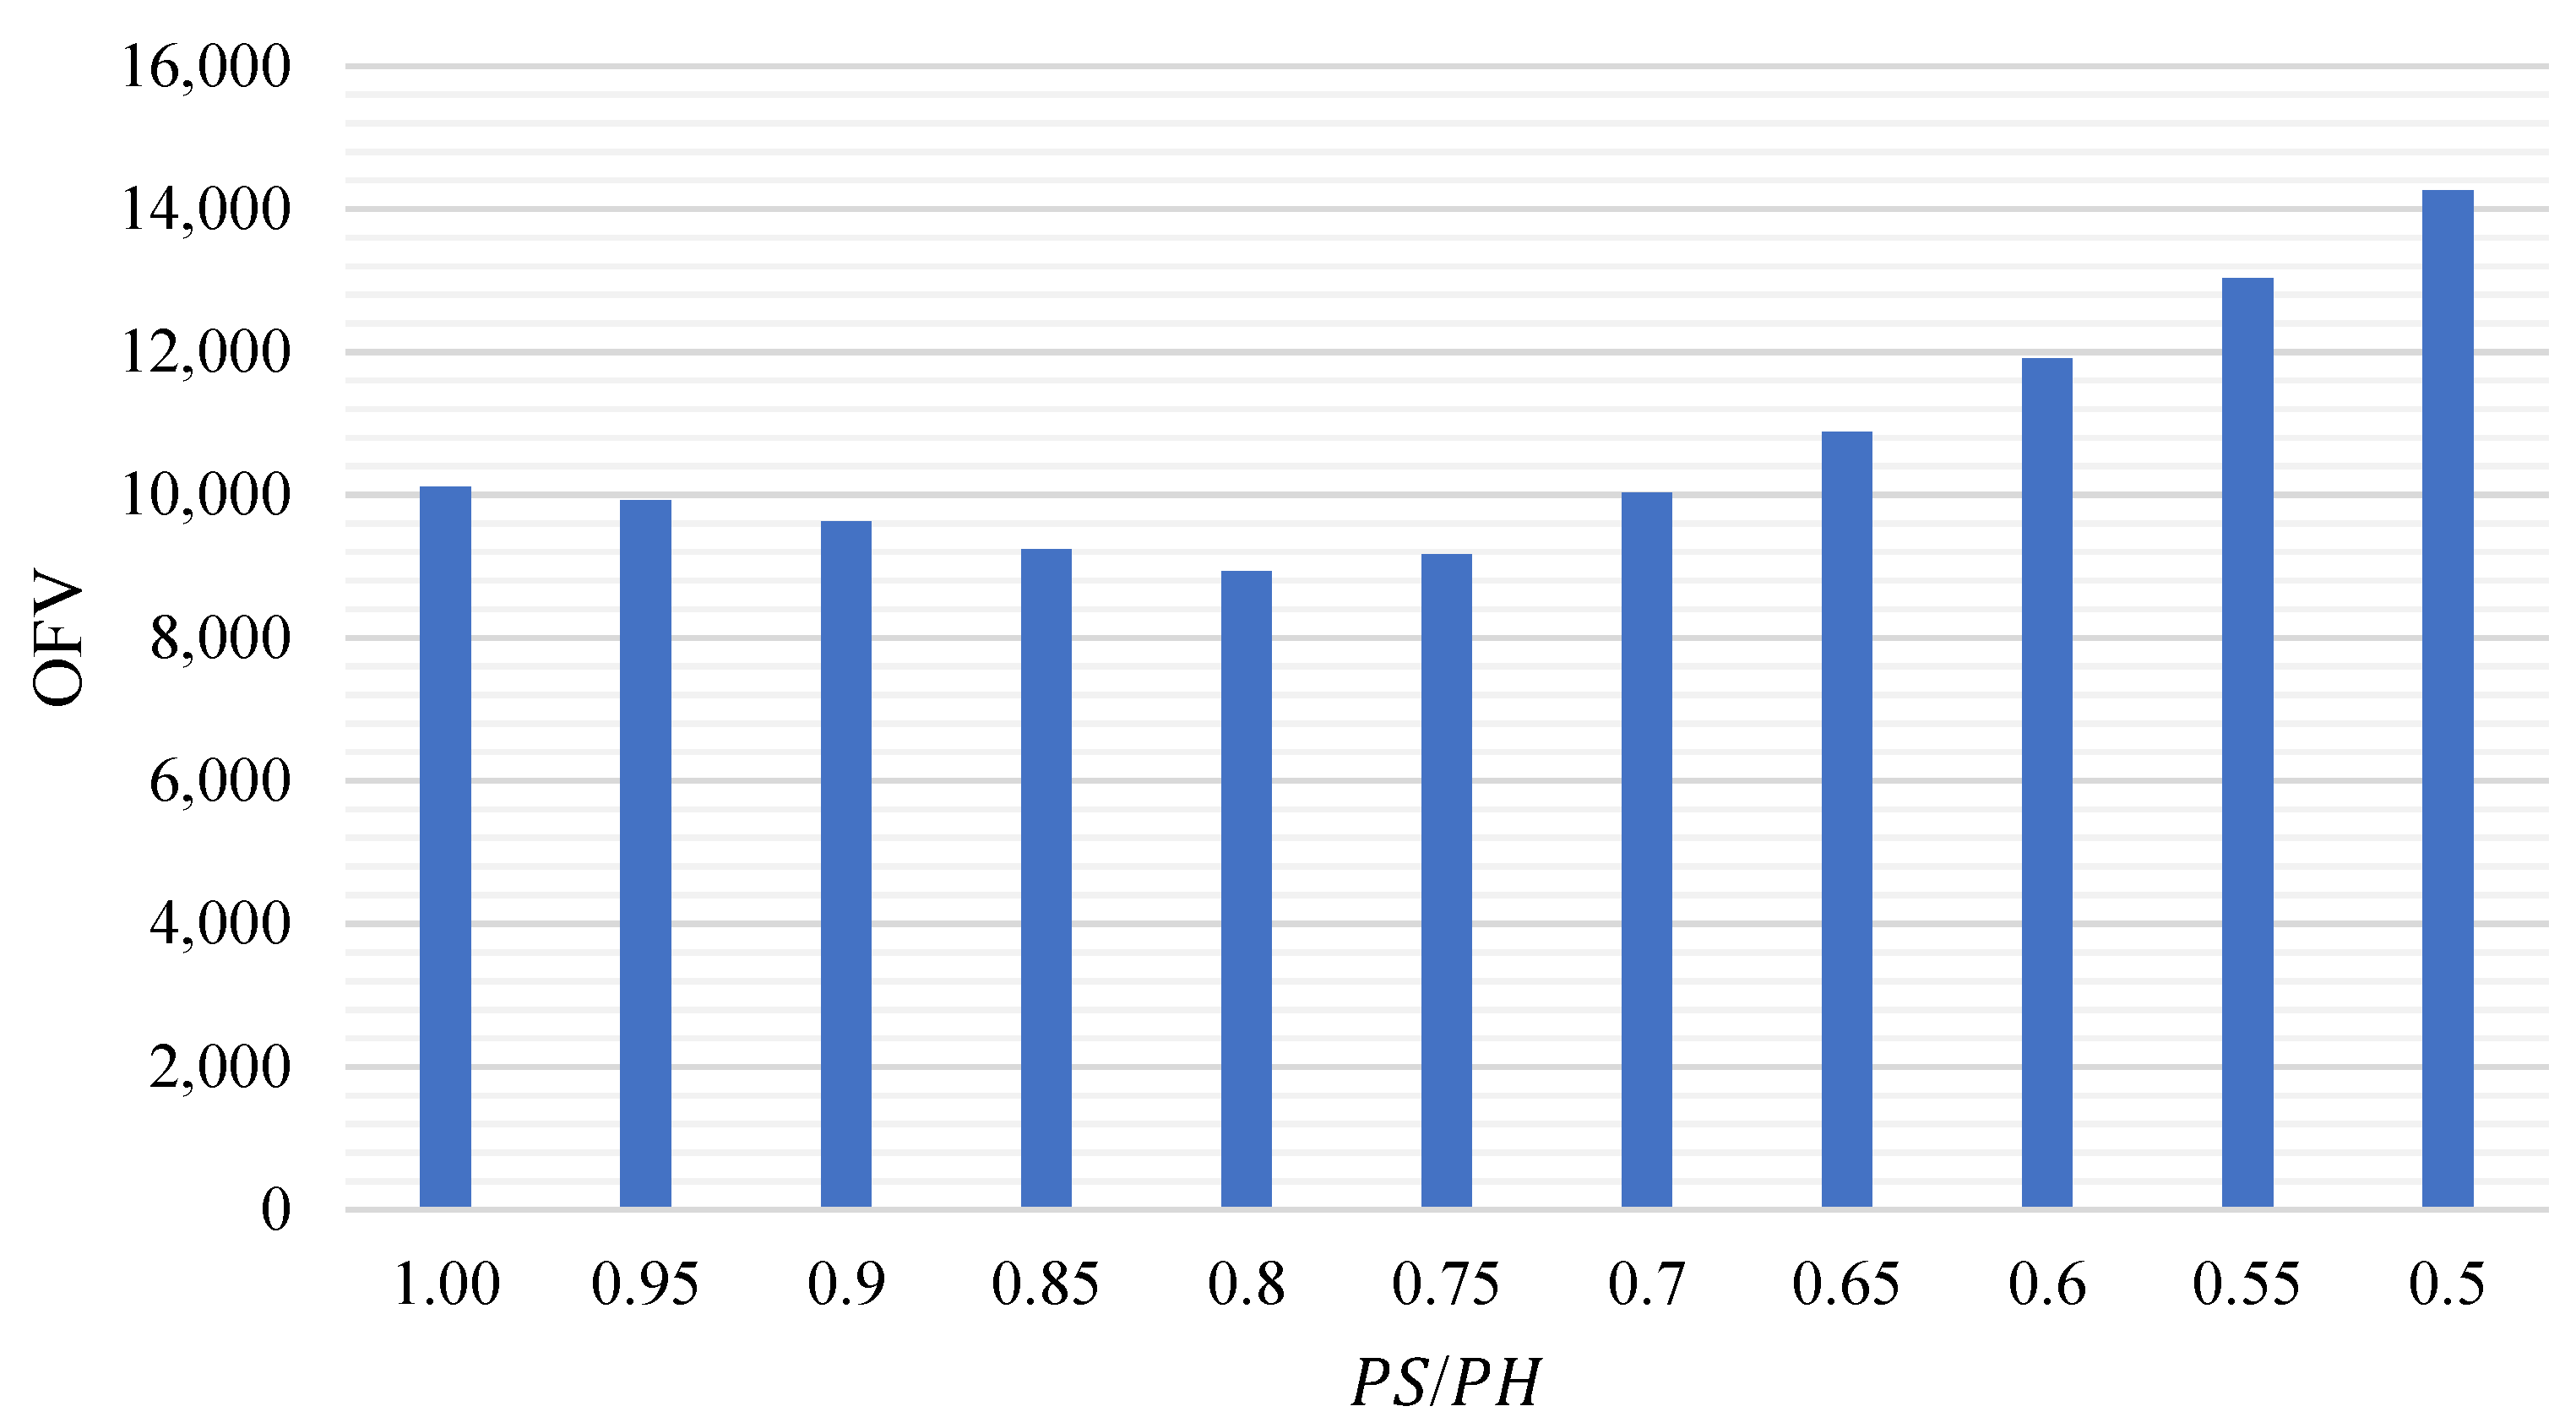
  • Offering discounts on PDPs can be an effective strategy to reduce costs and increase profits in last-mile delivery operations. This study suggests that providing a 100% discount may not be the most profitable option since it attracts too many customers to PDPs, leading to its lower profits. Therefore, companies should carefully evaluate the impact of different discount rates on their costs, product or service demand, and profits to find the most effective strategy for their business. This study highlights the importance of using mathematical models and optimization techniques to determine the optimal discount rate and evaluate the effects of different scenarios on the overall performance of last-mile delivery operations.

6. Conclusions and Future Research

The rapid growth of e-commerce and the increased demand for home deliveries have put pressure on transportation resources and increased the cost of daily deliveries to clients. In response to this trend, this study proposed a two-phase approach that combines multiple criteria decision making (MCDM) and mathematical modeling to select the most sustainable pickup and delivery points (PDPs) and optimal routes. The first phase of the study involved evaluating the scores of all types of proposed PDPs using a hybrid MCDM methodology that takes into account the importance of various criteria, such as availability, accessibility, cost, security, environmental impact, number of facility staff, methods of use, regulations, and capacity. The second phase of the study proposed a mixed-integer mathematical model that minimizes transportation costs while maintaining customer satisfaction by offering different delivery options, including self-pickup, home delivery, or optional delivery. This model was designed to reduce both fixed and variable costs associated with the use of transportation resources.
The findings of the study showed that using these 2 methodologies in modeling can result in a significant reduction in transportation costs by more than 25%. This means that the proposed approach can potentially help organizations to optimize their delivery operations and lower their costs, while considering customer satisfaction. Overall, the proposed two-phase approach offers a practical solution to the vehicle routing problem by combining MCDM and mathematical optimization modeling. Managers and decision makers can use the findings of this study to guide their actions and improve the efficiency of their delivery operations, ultimately resulting in cost savings and improved customer satisfaction.
For future research, considering time windows for different options can bring the problems closer to the real world. It is worth mentioning that using other MCDM methods for choosing PDPs and comparing the methods and results could be beneficial. Moreover, travel time and uncertainties about customers can be taken into consideration in future work.

Author Contributions

Conceptualization, N.P.; methodology, N.P.; supervision, M.R.A.J.; visualization, N.P.; writing—original draft, N.P.; revised reading: M.R.A.J. All authors have read and agreed to the published version of the manuscript.

Funding

This research received no external funding.

Institutional Review Board Statement

Not applicable.

Informed Consent Statement

Not applicable.

Data Availability Statement

The authors confirm that the data supporting the findings of this study are available within the article.

Conflicts of Interest

The authors declare no conflict of interest.

Appendix A

The SWARA method is a decision-making technique that involves the following steps:
Step 1: The first step involves arranging the criteria in order of their significance based on the opinion of the experts. The criterion that is considered the most important is given the highest rank, while the least important criterion is given the lowest rank. The remaining criteria are arranged in a sequential order based on their perceived importance relative to each other. This ranking is subjective and based on the experts’ experience and knowledge of the problem.
Step 2: In the second step, the relative significance is assessed by calculating the weighted average value (SCj).
The experts determine the relative importance of each criterion by comparing it to the criterion ranked immediately below it. For each criterion, the experts assign a value between 0 and 1 that represents how much more important it is than the criterion below it. This value is calculated using the weighted average value (SCj) of the criterion below it, which is calculated as follows:
SCj = (W1 × Rj1 + W2 × Rj2 + … + Wn × Rjn)/(W1 + W2 + … + Wn)
where Wk is the weight of criterion Ck, Rkj is the rank of criterion Ck as given by expert j, and n is the total number of experts.
Step 3: In the third step, the KCj coefficient is calculated using the following equation.
Once the weighted average value (SCj) has been determined for each criterion, the KCj coefficient is calculated by taking the value of SCj + 1 for the criterion ranked immediately below it. This coefficient represents the relative importance of each criterion.
K C j   =   S C j + 1
Step 4: In the fourth step, the initial weight of the criteria is computed.
This step involves computing the initial weight of each criterion. The first criterion is assigned a weight value of 1 since it is considered the most important criterion. For all other criteria, the weight is calculated using the following formula:
Q C j = { 1             j = 1 Q C j 1 K C j             j > 1
Step 5: The final step involves determining the weights for each criterion in such a way that their total sum is equal to one.
The last step involves adjusting the weights of the criteria to ensure that their total sum equals one, making the values normalized. This is carried out using the following formula:
W C j = Q C j j = 1 N Q C j
where WCj is the normalized weight of criterion Cj, and n is the total number of criteria.

Appendix B

Table A1. Experts’ Ranking Results of the SWARA Method.
Expert 1Expert 2Expert 3Expert 4Expert 5Expert 6Expert 7Expert 8
NumberRankNumberRankNumberRankNumberRankNumberRankNumberRankNumberRankNumberRank
C11C12C11C12C12C13C11C11
C22C21C23C23C24C21C23C24
C33C35C34C31C33C32C34C32
C44C43C45C46C48C45C45C48
C59C58C57C57C59C59C58C59
C65C62C62C64C61C64C62C63
C77C76C76C75C77C76C78C77
C88C88C89C88C86C88C87C86
C96C99C98C99C95C97C99C95

Appendix C

The COCOSO technique involves the following steps:
Step 1: Create a decision matrix that evaluates assessing the suitability of options according to criteria where the evaluation of option i based on criterion j is denoted by Aij.
Step 2: Scale the decision matrix using the compromise method to obtain the normal decision matrix, labeled by N, where the elements of the matrix are labeled by dij.
Step 3: To calculate the weighted product (Si) and the weighted sum product (Pi) for each option in the decision matrix, employ the weights of the criteria derived from the SWARA method according to Equations (A5) and (A6), respectively:
S i = j = 1 N W C j d i j
P i = j = 1 N ( d i j ) W C j
Step 4: Use 3 strategies to calculate the importance of the options in relation to each other and finally determine Ui; we considered the value of ρ as 0.5.
K i a = S i + P i i = 1 M S i + P i
K i b = S i M i n i S i + P i M i n i P i
K i c = ( S i ) + ( 1 ρ ) ( P i ) ρ M a x i S i + ( 1 ρ ) ( M a x i P i )
U i = ( K i a K i b K i b ) 1 / 3 + 1 3   ( K i a + K i b + K i c )

Appendix D

Ordinal Priority Approach (OPA):
The procedure for assigning weights to criteria using OPA in this research consists of the following stages [66]:
  • Gather a panel of experts or decision makers. The experts are assigned ordinal rankings based on their education level and years of experience, as their expertise may differ,
  • Each expert prioritizes the criteria according to their judgment.
  • Using the ordinal judgments obtained in steps 1 and 2, a mathematical model (A11) is developed and then solved.
Table A2 indicates sets, indexes, and variables of the OPA used in this article.
Table A2. Sets, indexes, and variables of the OPA model.
sets
ISet of experts ∀i ∈ I
JSet of criteria ∀j ∈ J
Indexes
iIndex for expert (1,…, e)
jIndex for criteria (1,…,c)
Variables
ZObjective function
WijkImportance of jth criteria by ith expert at kth rank
Maximize Z
Z i ( j ( w i j k w i j k + 1 ) )   i , j , k
Z i j w i j j   i , j
i = 1 e j = 1 c w i j = 1
w i j 0     i , j
Once Model (35) is solved, the weights of the criteria and experts are calculated using Equations (A12) and (A13):
w j = i = 1 e w p j     j
w i = j = 1 c w i j     i
The Evaluation Based on Distance from Average Solution (EDAS):
EDAS is an approach within the field of multi-criteria decision making (MCDM) that takes into account the distance of each alternative from the average solution [67]. The EDAS method consists of several steps.
1.
A decision matrix is formed representing the performance of each alternative with respect to each criterion. Let A = {A1, …, A5} be the set of 5 alternatives and C = {C1, C2, …, C9} be the set of 9 criteria. The decision matrix can be written as X = [xij], where xij is the performance of alternative Ai with respect to criterion Cj.
The values of xij can be either benefits or costs, depending on whether the criterion is a benefit (higher values are better) or a cost (lower values are better).
2.
After forming the decision matrix, the second step is to calculate the average value (AV) for each criterion according to Equation (A14). Mathematically, AV for criterion j is calculated using Equation (A15):
AV = [ A V j ] 1 × m ,
where
A V j = i = 1 n x i j n
3.
In the next step, the positive distance from the average (PDA) and the negative distance from the average (NDA) are computed using Equations (A16)–(A19). The positive criterion indicates that an increase in its value leads to a favorable outcome.
P D A i j = max ( 0 , ( X i j A V j ) ) A V j
N D A i j = max ( 0 , ( A V j X i j ) ) A V j
If the criterion has a negative impact, the opposite relationship is used. The negative side indicates that decreasing the criterion will result in a better outcome.
P D A i j = max ( 0 , ( A V j X i j ) ) A V j
N D A i j = max ( 0 , ( X i j A V j ) ) A V j
To proceed with the evaluation of alternatives, the next step involves calculating the values of SP (score of positive distance) and SN (score of negative distance) using Equations (A20) and (A21). This step is crucial as it is weighted by the PDA and NDA values obtained in the previous step, and the weights of the criteria need to be multiplied by these variables.
S P i = j = 1 m w j P D A i j ;
S N i = j = 1 m w j N D A i j ;  
The normalization of the weighted PDA and weighted NDA values is carried out using Equations (A22) and (A23).
N S P i = S P i m a x i ( S P i ) ;
N S N i = 1 S N i m a x i ( S N i )
The final score of the options is calculated using Equations (A24) and (A25) and, subsequently, they are ranked.
A S i = ( N S P i + N S N i ) 2
where   0 A S i 1

References

  1. Gross, W.F.; Hayden, C.; Butz, C. About the impact of rising oil price on logistics networks and transportation greenhouse gas emission. Logist. Res. 2012, 4, 147–156. [Google Scholar] [CrossRef]
  2. Naim, A. Measurement of Electronic Commerce Effectiveness. 2022. Available online: https://neojournals.com/index.php/nsprj/article/view/6 (accessed on 14 February 2023).
  3. Coppola, D. E-commerce worldwide-statistics & facts_Statista. Available online: https://www.statista.com/topics/871/online-shopping/ (accessed on 14 February 2023).
  4. Wassan, S.; Gulati, K.; Ghosh, A.; Mammani, B.S.; Tabbassum, S.; Mohiddin, M.K. Impact of digitalization on retailers and its future trends. Mater. Today Proc. 2022, 51, 803–809. [Google Scholar] [CrossRef]
  5. Sitek, P.; Wikarek, J. Capacitated vehicle routing problem with pick-up and alternative delivery (CVRPPAD): Model and implementation using hybrid approach. Ann. Oper. Res. 2019, 273, 257–277. [Google Scholar] [CrossRef]
  6. Chakraborty, S.; Bagga, C.S.; Sarmah, S.P. Attended home delivery under uncertain travel and response time: A case of Indian public distribution system. Kybernetes 2022. ahead-of-print. [Google Scholar] [CrossRef]
  7. Wang, X.; Zhan, L.; Ruan, J.; Zhang, J. How to choose ‘last mile’ delivery modes for e-fulfillment. Math. Probl. Eng. 2014, 2014. [Google Scholar] [CrossRef]
  8. Agatz, N.A.H.; Fleischmann, M.; Van Nunen, J.A.E.E. E-fulfillment and multi-channel distribution—A review. Eur. J. Oper. Res. 2008, 187, 339–356. [Google Scholar] [CrossRef]
  9. Dantzig, G.; Fulkerson, R.; Johnson, S. Solution of a large-scale traveling-salesman problem. J. Oper. Res. Soc. Am. 1954, 2, 393–410. [Google Scholar] [CrossRef]
  10. Clarke, G.; Wright, J.W. Scheduling of vehicles from a central depot to a number of delivery points. Oper. Res. 1964, 12, 568–581. [Google Scholar] [CrossRef]
  11. Mor, A.; Speranza, M.G. Vehicle routing problems over time: A survey. Ann. Oper. Res. 2022, 314, 255–275. [Google Scholar] [CrossRef]
  12. Savelsbergh, M.; Van Woensel, T. 50th anniversary invited article—City logistics: Challenges and opportunities. Transp. Sci. 2016, 50, 579–590. [Google Scholar] [CrossRef]
  13. Reyes, D.; Savelsbergh, M.; Toriello, A. Vehicle routing with roaming delivery locations. Transp. Res. Part C Emerg. Technol. 2017, 80, 71–91. [Google Scholar] [CrossRef]
  14. Ozbaygin, G.; Karasan, O.E.; Savelsbergh, M.; Yaman, H. A branch-and-price algorithm for the vehicle routing problem with roaming delivery locations. Transp. Res. Part B Methodol. 2017, 100, 115–137. [Google Scholar] [CrossRef]
  15. Lombard, A.; Tamayo-Giraldo, S.; Fontane, F. Vehicle routing problem with roaming delivery locations and stochastic travel times (VRPRDL-S). Transp. Res. Procedia 2018, 30, 167–177. [Google Scholar] [CrossRef]
  16. Zhang, S.Z.; Lee, C.K.M. Flexible vehicle scheduling for urban last mile logistics: The emerging technology of shared reception box. In Proceedings of the 2016 IEEE International Conference on Industrial Engineering and Engineering Management (IEEM), Bali, Indonesia, 4–7 December 2016; pp. 1913–1917. [Google Scholar]
  17. He, Y.; Qi, M.; Zhou, F.; Su, J. An effective metaheuristic for the last mile delivery with roaming delivery locations and stochastic travel times. Comput. Ind. Eng. 2020, 145, 106513. [Google Scholar] [CrossRef]
  18. Mancini, S.; Gansterer, M. Vehicle routing with private and shared delivery locations. Comput. Oper. Res. 2021, 133, 105361. [Google Scholar] [CrossRef]
  19. Sitek, P.; Wikarek, J.; Rutczyńska-Wdowiak, K.; Bocewicz, G.; Banaszak, Z. Optimization of capacitated vehicle routing problem with alternative delivery, pick-up and time windows: A modified hybrid approach. Neurocomputing 2021, 423, 670–678. [Google Scholar] [CrossRef]
  20. Dragomir, A.G.; Van Woensel, T.; Doerner, K.F. The pickup and delivery problem with alternative locations and overlapping time windows. Comput. Oper. Res. 2022, 143, 105758. [Google Scholar] [CrossRef]
  21. Oliveira, W.J.P.; dos Santos, A.G. Last Mile Delivery with Lockers: Formulation and Heuristic. In ICEIS (1); 2020; pp. 460–467. Available online: https://www.locus.ufv.br/handle/123456789/30484 (accessed on 12 January 2023).
  22. Yu, V.F.; Susanto, H.; Yeh, Y.-H.; Lin, S.-W.; Huang, Y.-T. The Vehicle Routing Problem with Simultaneous Pickup and Delivery and Parcel Lockers. Mathematics 2022, 10, 920. [Google Scholar] [CrossRef]
  23. Hornstra, R.P.; Silva, A.; Roodbergen, K.J.; Coelho, L.C. The vehicle routing problem with simultaneous pickup and delivery and handling costs. Comput. Oper. Res. 2020, 115, 104858. [Google Scholar] [CrossRef]
  24. Bortfeldt, A.; Yi, J. The split delivery vehicle routing problem with three-dimensional loading constraints. Eur. J. Oper. Res. 2020, 282, 545–558. [Google Scholar] [CrossRef]
  25. Orenstein, I.; Raviv, T.; Sadan, E. Flexible parcel delivery to automated parcel lockers: Models, solution methods and analysis. EURO J. Transp. Logist. 2019, 8, 683–711. [Google Scholar] [CrossRef]
  26. Grabenschweiger, J.; Doerner, K.F.; Hartl, R.F.; Savelsbergh, M.W.P. The vehicle routing problem with heterogeneous locker boxes. Cent. Eur. J. Oper. Res. 2021, 29, 113–142. [Google Scholar] [CrossRef]
  27. Schwerdfeger, S.; Boysen, N. Optimizing the changing locations of mobile parcel lockers in last-mile distribution. Eur. J. Oper. Res. 2020, 285, 1077–1094. [Google Scholar] [CrossRef]
  28. Lai, P.-L.; Jang, H.; Fang, M.; Peng, K. Determinants of customer satisfaction with parcel locker services in last-mile logistics. Asian J. Shipp. Logist. 2022, 38, 25–30. [Google Scholar] [CrossRef]
  29. Liu, S.; Liu, Y.; Zhang, R.; Cao, Y.; Li, M.; Zikirya, B.; Zhou, C. Heterogeneity of Spatial Distribution and Factors Influencing Unattended Locker Points in Guangzhou, China: The Case of Hive Box. ISPRS Int. J. Geoinf. 2021, 10, 409. [Google Scholar] [CrossRef]
  30. Rabe, M.; Gonzalez-Feliu, J.; Chicaiza-Vaca, J.; Tordecilla, R.D. Simulation-optimization approach for multi-period facility location problems with forecasted and random demands in a last-mile logistics application. Algorithms 2021, 14, 41. [Google Scholar] [CrossRef]
  31. Ducret, R. Parcel deliveries and urban logistics: Changes and challenges in the courier express and parcel sector in Europe—The French case. Res. Transp. Bus. Manag. 2014, 11, 15–22. [Google Scholar] [CrossRef]
  32. Wang, Y.; Ong, T.; Lee, L.H.; Chew, E.P. Capacitated competitive facility location problem of self-collection lockers by using public big data. In Proceedings of the 2017 13th IEEE Conference on Automation Science and Engineering (CASE), Xi’an, China, 20–23 August 2017; p. 1344. [Google Scholar]
  33. Lee, H.; Chen, M.; Pham, H.T.; Choo, S. Development of a decision making system for installing unmanned parcel lockers: Focusing on residential complexes in Korea. KSCE J. Civ. Eng. 2019, 23, 2713–2722. [Google Scholar] [CrossRef]
  34. Buzzega, G.; Novellani, S. Last mile deliveries with lockers: Formulations and algorithms. Soft Comput. 2022, 1–19. [Google Scholar] [CrossRef]
  35. Dumez, D.; Lehuédé, F.; Péton, O. A large neighborhood search approach to the vehicle routing problem with delivery options. Transp. Res. Part B Methodol. 2021, 144, 103–132. [Google Scholar] [CrossRef]
  36. Enthoven, D.L.J.U.; Jargalsaikhan, B.; Roodbergen, K.J.; Uit het Broek, M.A.J.; Schrotenboer, A.H. The two-echelon vehicle routing problem with covering options: City logistics with cargo bikes and parcel lockers. Comput. Oper. Res. 2020, 118, 104919. [Google Scholar] [CrossRef]
  37. Friedrich, C.; Elbert, R. Adaptive large neighborhood search for vehicle routing problems with transshipment facilities arising in city logistics. Comput. Oper. Res. 2022, 137, 105491. [Google Scholar] [CrossRef]
  38. He, Y.; Wang, X.; Zhou, F.; Lin, Y. Dynamic vehicle routing problem considering simultaneous dual services in the last mile delivery. Kybernetes 2019, 49, 1267–1284. [Google Scholar] [CrossRef]
  39. Janinhoff, L.; Klein, R.; Scholz, D. Multitrip Vehicle Routing with Delivery Options: A Data-Driven Application to the Parcel Industry. OR Spectr. 2023, 1–54. [Google Scholar] [CrossRef]
  40. Los, J.; Spaan, M.T.J.; Negenborn, R.R. Fleet management for pickup and delivery problems with multiple locations and preferences. In International Conference on Dynamics in Logistics; Springer: Berlin/Heidelberg, Germany, 2018; pp. 86–94. [Google Scholar]
  41. Sampaio, A.; Kinable, J.; Veelenturf, L.P.; Van Woensel, T. A scenario-based approach for the vehicle routing problem with roaming delivery locations under stochastic travel times. Optim. Online 2019, 1–29. [Google Scholar]
  42. Tilk, C.; Olkis, K.; Irnich, S. The last-mile vehicle routing problem with delivery options. OR Spectr. 2021, 43, 877–904. [Google Scholar] [CrossRef]
  43. Zhou, L.; Wang, X.; Ni, L.; Lin, Y. Location-routing problem with simultaneous home delivery and customer’s pickup for city distribution of online shopping purchases. Sustainability 2016, 8, 828. [Google Scholar] [CrossRef]
  44. Zhou, L.; Baldacci, R.; Vigo, D.; Wang, X. A multi-depot two-echelon vehicle routing problem with delivery options arising in the last mile distribution. Eur. J. Oper. Res. 2018, 265, 765–778. [Google Scholar] [CrossRef]
  45. Šelmić, M.; Nikolić, M.; Čupić, A. Postboxes quantitative optimization model. Sustainability 2020, 12, 1945. [Google Scholar] [CrossRef]
  46. Mostarac, K.; Mostarac, P.; Kavran, Z.; Šarac, D. Determining Optimal Locations of Postal Access Points Based on Simulated Annealing. Sustainability 2022, 14, 8635. [Google Scholar] [CrossRef]
  47. Zenezini, G.; Lagorio, A.; Pinto, R.; De Marco, A.; Golini, R. The collection-and-delivery points implementation process from the courier, express and parcel operator’s perspective. IFAC-Pap. 2018, 51, 594–599. [Google Scholar] [CrossRef]
  48. Lemke, J.; Iwan, S.; Korczak, J. Usability of the parcel lockers from the customer perspective–the research in Polish Cities. Transp. Res. Procedia 2016, 16, 272–287. [Google Scholar] [CrossRef]
  49. Tang, Y.M.; Chau, K.Y.; Xu, D.; Liu, X. Consumer perceptions to support IoT based smart parcel locker logistics in China. J. Retail. Consum. Serv. 2021, 62, 102659. [Google Scholar] [CrossRef]
  50. Stašys, R.; Švažė, D.; Klimas, E. The main reasons for customer satisfaction with parcel locker services: The case of Lithuania. Reg. Form. Dev. Stud. J. Soc. Sci. 2022, 37, 175–187. [Google Scholar] [CrossRef]
  51. Tedjo, A.T.; Tee, P.K.; Ahmad, R. A Study on the Factors Boosting Customer Experience in the Adoption of Smart Locker in Klang Valley. Int. J. Acad. Res. Bus. Soc. Sci. 2022, 12, 430–443. [Google Scholar] [CrossRef]
  52. Yu, B.; Du, G. Research on fuzzy evaluation of online shopping express service quality based on SERVQUAL model. Ind. Eng 2013, 2, 127–133. [Google Scholar]
  53. Iwan, S.; Kijewska, K.; Lemke, J. Analysis of parcel lockers’ efficiency as the last mile delivery solution–the results of the research in Poland. Transp. Res. Procedia 2016, 12, 644–655. [Google Scholar] [CrossRef]
  54. Faugere, L.; Montreuil, B. Hyperconnected pickup & delivery locker networks. In Proceedings of the 4th International Physical Internet Conference, Graz, Austria, 4–6 July 2017; pp. 1–14. [Google Scholar]
  55. Lin, Y.; Chen, A.; Zhong, S.; Giannikas, V.; Lomas, C.; Worth, T. Service supply chain resilience: A social-ecological perspective on last-mile delivery operations. Int. J. Oper. Prod. Manag. 2023, 43, 140–165. [Google Scholar] [CrossRef]
  56. Pahwa, A.; Jaller, M. Assessing last-mile distribution resilience under demand disruptions. Transp. Res. E Logist. Transp. Rev. 2023, 172, 103066. [Google Scholar] [CrossRef]
  57. Giret, A.; Carrascosa, C.; Julian, V.; Rebollo, M.; Botti, V. A crowdsourcing approach for sustainable last mile delivery. Sustainability 2018, 10, 4563. [Google Scholar] [CrossRef]
  58. Le, D.N.; Nguyen, H.T.; Truong, P.H. Port logistics service quality and customer satisfaction: Empirical evidence from Vietnam. Asian J. Shipp. Logist. 2020, 36, 89–103. [Google Scholar] [CrossRef]
  59. Lagorio, A.; Pinto, R. The parcel locker location issues: An overview of factors affecting their location. In Proceedings of the 8th International Conference on Information Systems, Logistics and Supply Chain: Interconnected Supply Chains in an Era of Innovation, ILS, Austin, TX, USA, 22–24 April 2020; pp. 414–421. [Google Scholar]
  60. Zolfani, S.H.; Bahrami, M. Investment prioritizing in high tech industries based on SWARA-COPRAS approach. Technol. Econ. Dev. Econ. 2014, 20, 534–553. [Google Scholar] [CrossRef]
  61. Salehi, F.; Mirzapour Al-e-hashem, S.M.J.; Husseini, S.M.M. A 2-phase interdependent methodology for sustainable project portfolio planning in the pharmaceutical industry. Comput. Ind. Eng. 2022, 174, 108794. [Google Scholar] [CrossRef]
  62. Majeed, R.A.; Breesam, H.K. Application of SWARA technique to find criteria weights for selecting landfill site in Baghdad governorate. In IOP Conference Series: Materials Science and Engineering; IOP Publishing: Samawah, Iraq, 2021; p. 12045. [Google Scholar]
  63. Yazdani, M.; Zarate, P.; Kazimieras Zavadskas, E.; Turskis, Z. A combined compromise solution (CoCoSo) method for multi-criteria decision-making problems. Manag. Decis. 2019, 57, 2501–2519. [Google Scholar] [CrossRef]
  64. Hasanpour Jesri, Z.S.; Eshghi, K.; Rafiee, M.; Van Woensel, T. The Multi-Depot Traveling Purchaser Problem with Shared Resources. Sustainability 2022, 14, 10190. [Google Scholar] [CrossRef]
  65. Reinhelt, G. {TSPLIB}: A Library of Sample Instances for the TSP (and Related Problems) from Various Sources and of Various Types. 2014. Available online: http://comopt.ifi.uniheidelberg.de/software/TSPLIB95 (accessed on 4 September 2014).
  66. Ataei, Y.; Mahmoudi, A.; Feylizadeh, M.R.; Li, D.-F. Ordinal priority approach (OPA) in multiple attribute decision-making. Appl. Soft Comput. 2020, 86, 105893. [Google Scholar] [CrossRef]
  67. Keshavarz Ghorabaee, M.; Zavadskas, E.K.; Olfat, L.; Turskis, Z. Multi-criteria inventory classification using a new method of evaluation based on distance from average solution (EDAS). Informatica 2015, 26, 435–451. [Google Scholar] [CrossRef]
Figure 1. The two-phase hierarchical methodology.
Sustainability 15 08098 g001
Figure 2. Visual illustration of VRPHD (1), VRPSP (2), VRPHDSP (3), VRPDO (4), and VRPSO (5).
Sustainability 15 08098 g002
Figure 3. The cost of travel varies depending on the choice of model and options.
Sustainability 15 08098 g003
Figure 4. The relation between discount rate and OFV.
Sustainability 15 08098 g004
Table 1. Comparison of the present study with the main related papers.
ArticleDelivery OptionsSelf-Pickup PD 1PriorityLocationPriceSustainabilitySolution
[34]Branch and cut
[20]MS-ALNS 2
[35]LNS 3
[36]ALNS 4
[37]ALNS
[26]ALNS bin packing
[38]LNS
[17]SAA 5
[39]ALNS
[40]ALNS
[18]ILS 6, metaheuristic
[25]Savings, petal, TS 7, LNS
[14]Branch and price
[13]Heuristics based on GRASP 8
[41]Scenario based Stochastic approximation
[5]Variable fixing
[19]CP 9, GA 10, MP 11
[42]Branch price and cut
[22]ALNS
[16]ACO 12
[43]HGS 13
[44]HGS
[45]Branch and cut
[46]SA 14
This paperBranch and Cut; new hybrid MCDM method
1 Pickup and delivery; 2 multi-start, adaptive, large neighborhood search; 3 large neighborhood search; 4 adaptive large neighborhood search; 5 sample average approximation; 6 iterated local search; 7 tabu search; 8 greedy randomized adaptive search procedures; 9 constraint programming; 10 genetic algorithm; 11 mathematical programming; 12 ant colony optimization; 13 hunger games search; and 14 simulated annealing.
Table 2. Pickup point factors and their definitions.
FactorsSymbolDefinitionSources
Availability C 1 Possibility of parcel delivery 24/7[47,48,49]
Accessibility C 2 PDPs are easily reachable by eco-friendly transportation modes[48,49,50,51]
Security C 3 Prioritizing safety and security measures for goods[52,53]
Environmental impact C 4 Minimizing energy consumption and pollution at PDPs[53,54]
Number of facility staff C 5 The number of employees that should be in the facility[47,50]
Disaster resilience C 6 Low-risk areas or having measures to mitigate disaster impacts[55,56,57]
Methods of use C 7 Encouraging sustainable practices, such as reusable packaging and recycling programs[48,50,58]
Regulations C 8 Complying with relevant environmental, social, and safety regulations[48,59]
Capacity C 9 Ensuring sufficient capacity to accommodate current demand and future growth[47,59]
Table 3. The results of the SWARA approach.
FactorsComparative Importance
of Average Value
( S C j )
Coefficient
( K C j   =   S C j   +   1 )
Recalculated
( Q C j = ( Q C j 1 ) / K C j )
Weight
( W C j )
Rank
C101.001.000.211
C20.091.090.920.192
C60.16251.160.790.163
C30.231251.230.640.134
C40.2751.280.500.105
C70.351.350.370.086
C90.343751.340.280.067
C80.3251.330.210.048
C50.41251.410.150.039
Table 4. The results of the COCOSO method.
Pickup PointsWeighted Average SumWeighted Product SumScoring with the First Strategy
( K a )
Scoring with the Second Strategy ( K b )Scoring with the Third Strategy ( K c )Final Scoring Results
A10.5706.5730.2273.4820.9542.464
A20.6336.6880.2333.7150.9772.587
A30.7036.7880.2383.9661.0002.716
A40.3104.0000.1372.0000.5751.444
A50.5124.6750.1652.8210.6921.912
Table 5. An example of the information that the customer fills out.
ExampleHome DeliverySelf-Pickup Point 1Self-Pickup Point 2
Customer 1 priorities12-
Customer 2 priorities--1
Customer 3 priorities11-
Customer 4 priorities321
Table 6. Indicators, parameters, and variables.
IndicesDescription
i,jDelivery point index
KVehicle index
NCustomer index
GNetwork, G = (E, A)
EA set of points
E0A set of points plus the depot
ECA set of customers option points
KA set of vehicles
NA set of customers
EPA set of pickup points
ParametersDescription
CijThe travel cost from i to j
CFkThe fixed cost of using the vehicle k
AnjThe matrix in which all the elements are either 0 or 1 for the presence of the customer
PrnjCustomer preferences matrix that is completed by the customer
dnDelivery demand of customer n
pnPickup demand of customer n
QkThe capacity of vehicle K
CPjThe capacity of node j as a pickup point
PSThe price that customers should pay for self-pickup
PHThe price that customers should pay for home delivery
QkThe capacity of vehicle k
MA large number
Decision variablesDescription
XijkEqual to 1 if vehicle k travels from node i to point j; 0, otherwise
ZnjkEqual to 1 if customer n is serviced in node j by vehicle k; 0, otherwise
DijkFreight transported by vehicle k that drives through the arc (i, j)
D′ijkFreight transported of delivery demand by vehicle k that drives through the arc (i,j)
DijkFreight transported of pickup demand by vehicle k that passes through the arc (i,j)
UkEqual to 1 if vehicle k is used; 0, otherwise
Table 7. Comparison of objective function values and solving time in VRPHD, VRPSP, and VRPSO models.
ExampleNumber of CustomersVRPHDVRPSP
(without Customer Satisfaction Consideration)
VRPSO
(without Customer Satisfaction Consideration)
VRPSO
(with 50% of Customer Satisfaction)
OFVTime(s)OFVTime(s)OFVTime (s)OFVTime(s)
14812519653537525050653555
26898031668067542380697087
3810,413456951795603987225103
41010,94488703213862051727720190
51211,745106750025965063528247389
61413,109320883158068507179004740
71615,183560938589073519309828980
81816,90992210,15013018019153012,0011680
92018,235178011,01024029150242012,5092730
102219,892260213,260340610,109395214,2644289
Table 8. The relation between travel expenses and changes in customer satisfaction.
Number of CustomersMinimum Acceptable Customer Satisfaction
0%25%50%75%100%
452505250653563507320
856035603722575557980
1265067126824785849347
1673517507982810,60513,880
20915010,89212,50913,80716,535
2210,10912,35014,26416,75118,192
Table 9. Comparison of Sustainability Rankings Across MCDM Methods for PDPs.
PDPSWARA-COCOSOSWARA-EDASOPA-COCOSOOPA-EDASOPA
Final ScoreRankFinal ScoreRankFinal ScoreRankFinal ScoreRankFinal ScoreRank
A12.46430.67732.34530.69430.2193
A22.58720.77722.44920.78520.2722
A32.71610.90412.57210.87710.3201
A41.44450.32051.45450.33650.0964
A51.91240.62541.82840.62240.0905
Disclaimer/Publisher’s Note: The statements, opinions and data contained in all publications are solely those of the individual author(s) and contributor(s) and not of MDPI and/or the editor(s). MDPI and/or the editor(s) disclaim responsibility for any injury to people or property resulting from any ideas, methods, instructions or products referred to in the content.

