
Which Is More Environmentally Friendly? A Comparative Analysis of the Environmental Benefits of Two Waste-to-Energy Technologies for Plastics Based on an LCA Model
Abstract
:1. Introduction
2. Materials and Methods
2.1. Target Scope Determination
2.2. Inventory Analysis
2.2.1. System Parameters
2.2.2. Construction Phase Data List
2.2.3. Operation Phase Data List
2.3. Environmental Impact Assessment Method
2.4. Sensitivity Analysis
3. Results and Discussion
3.1. Results of LCA Model Evaluation
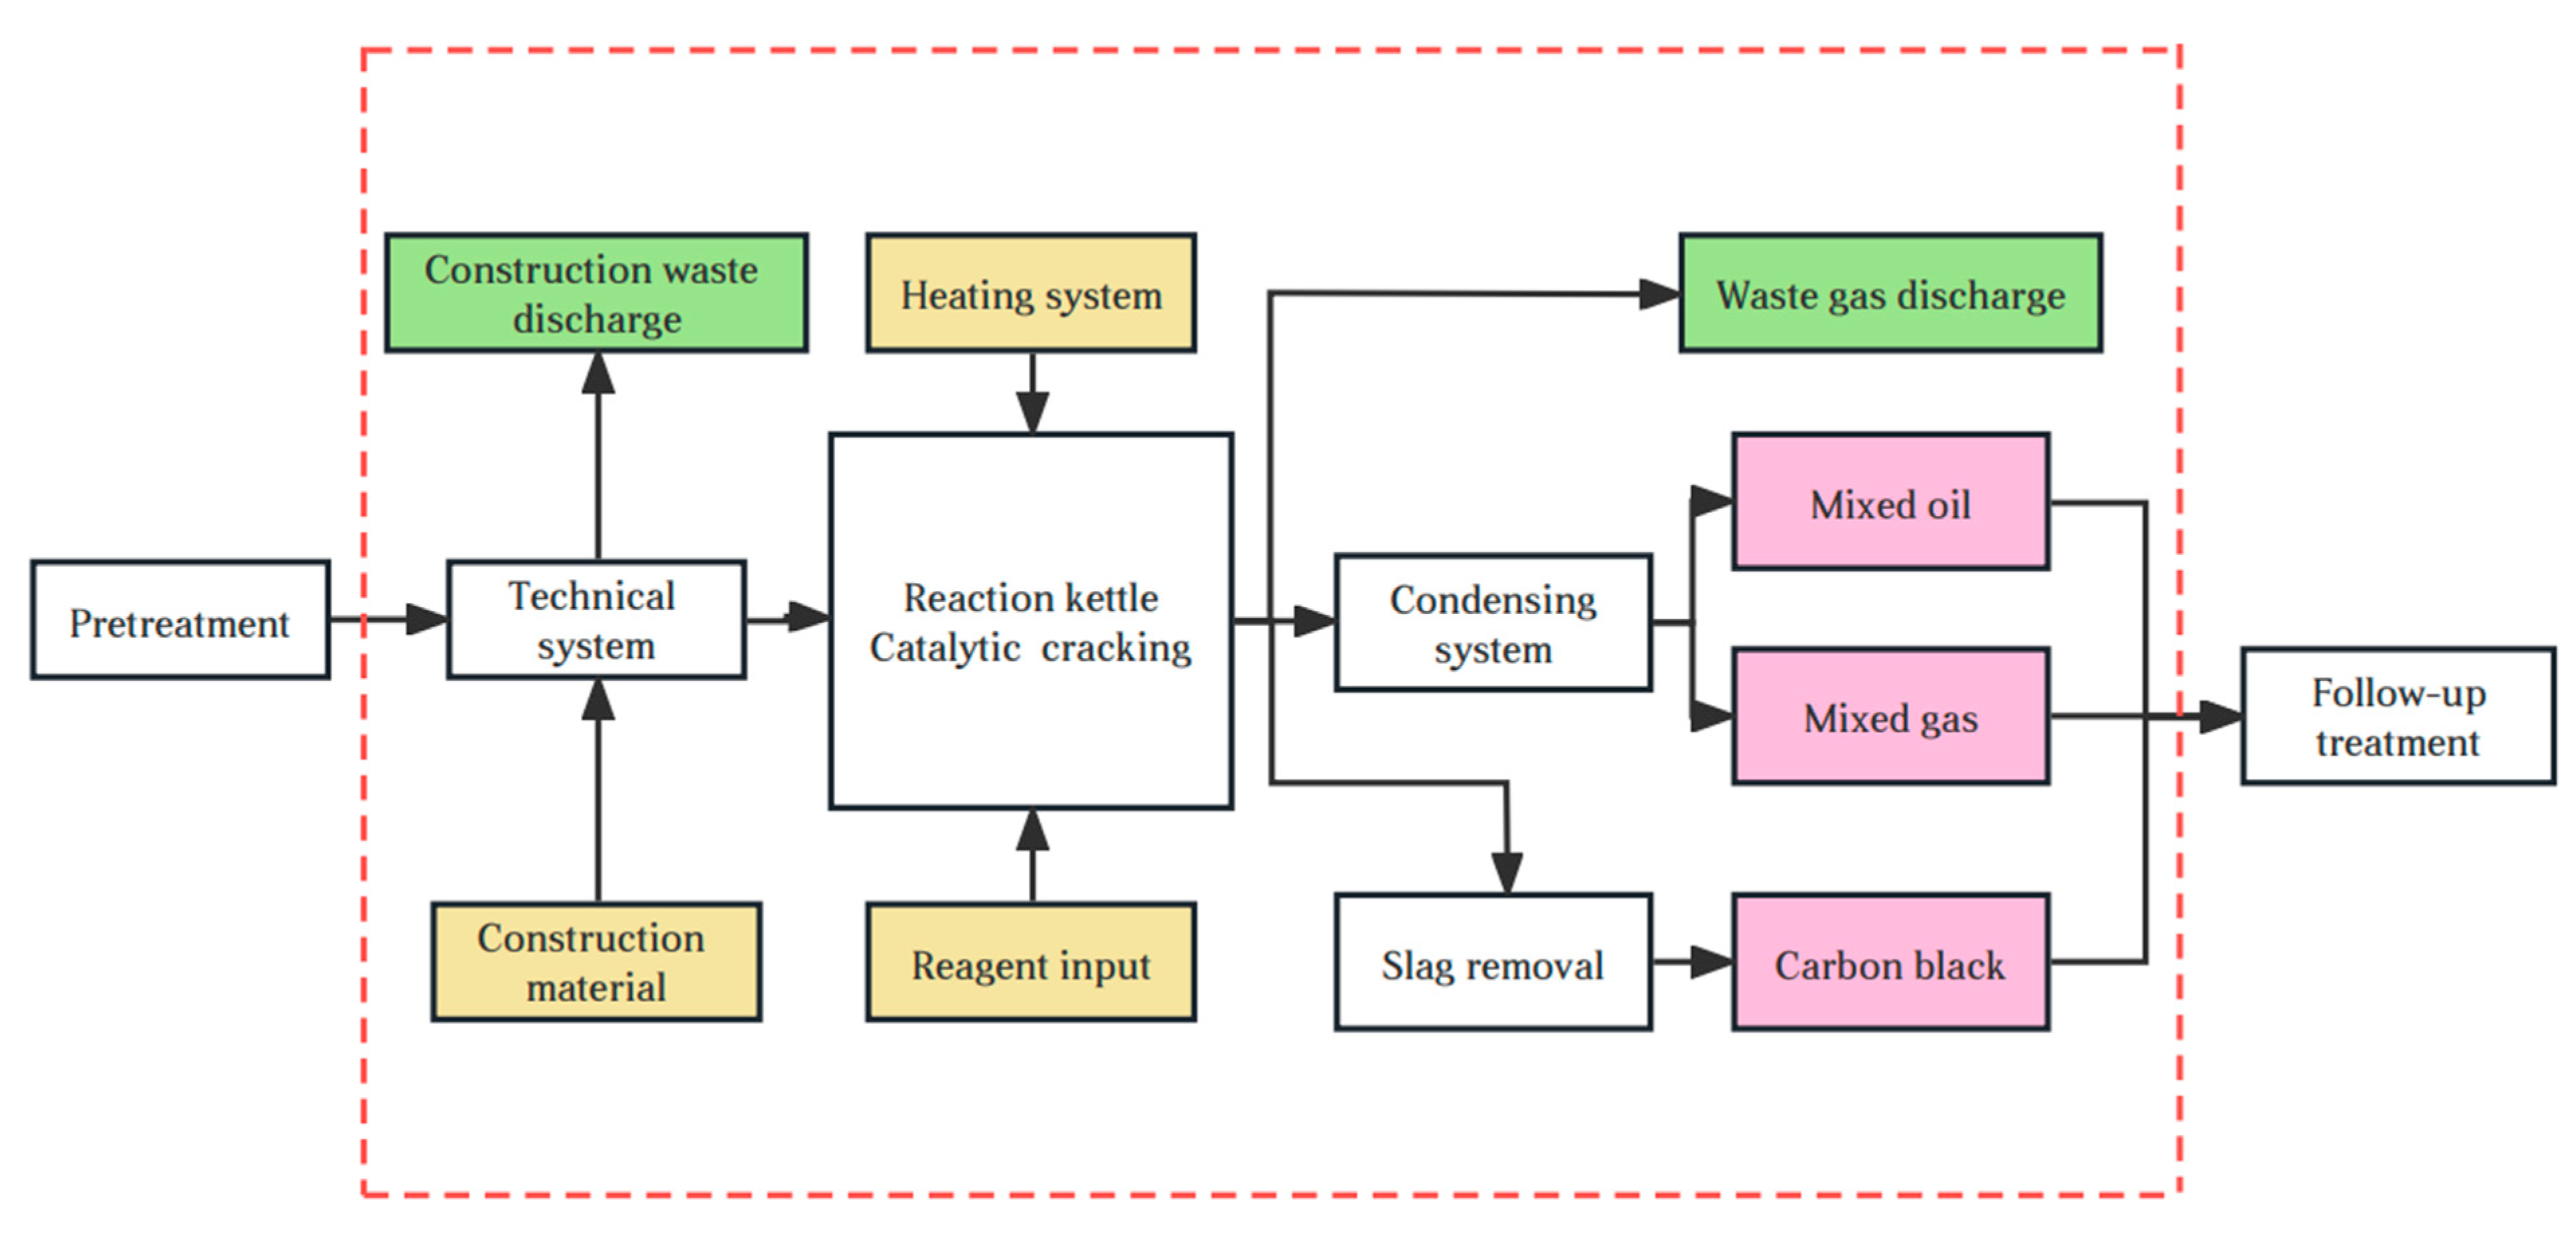
- Catalytic cracking technology.
- 2.
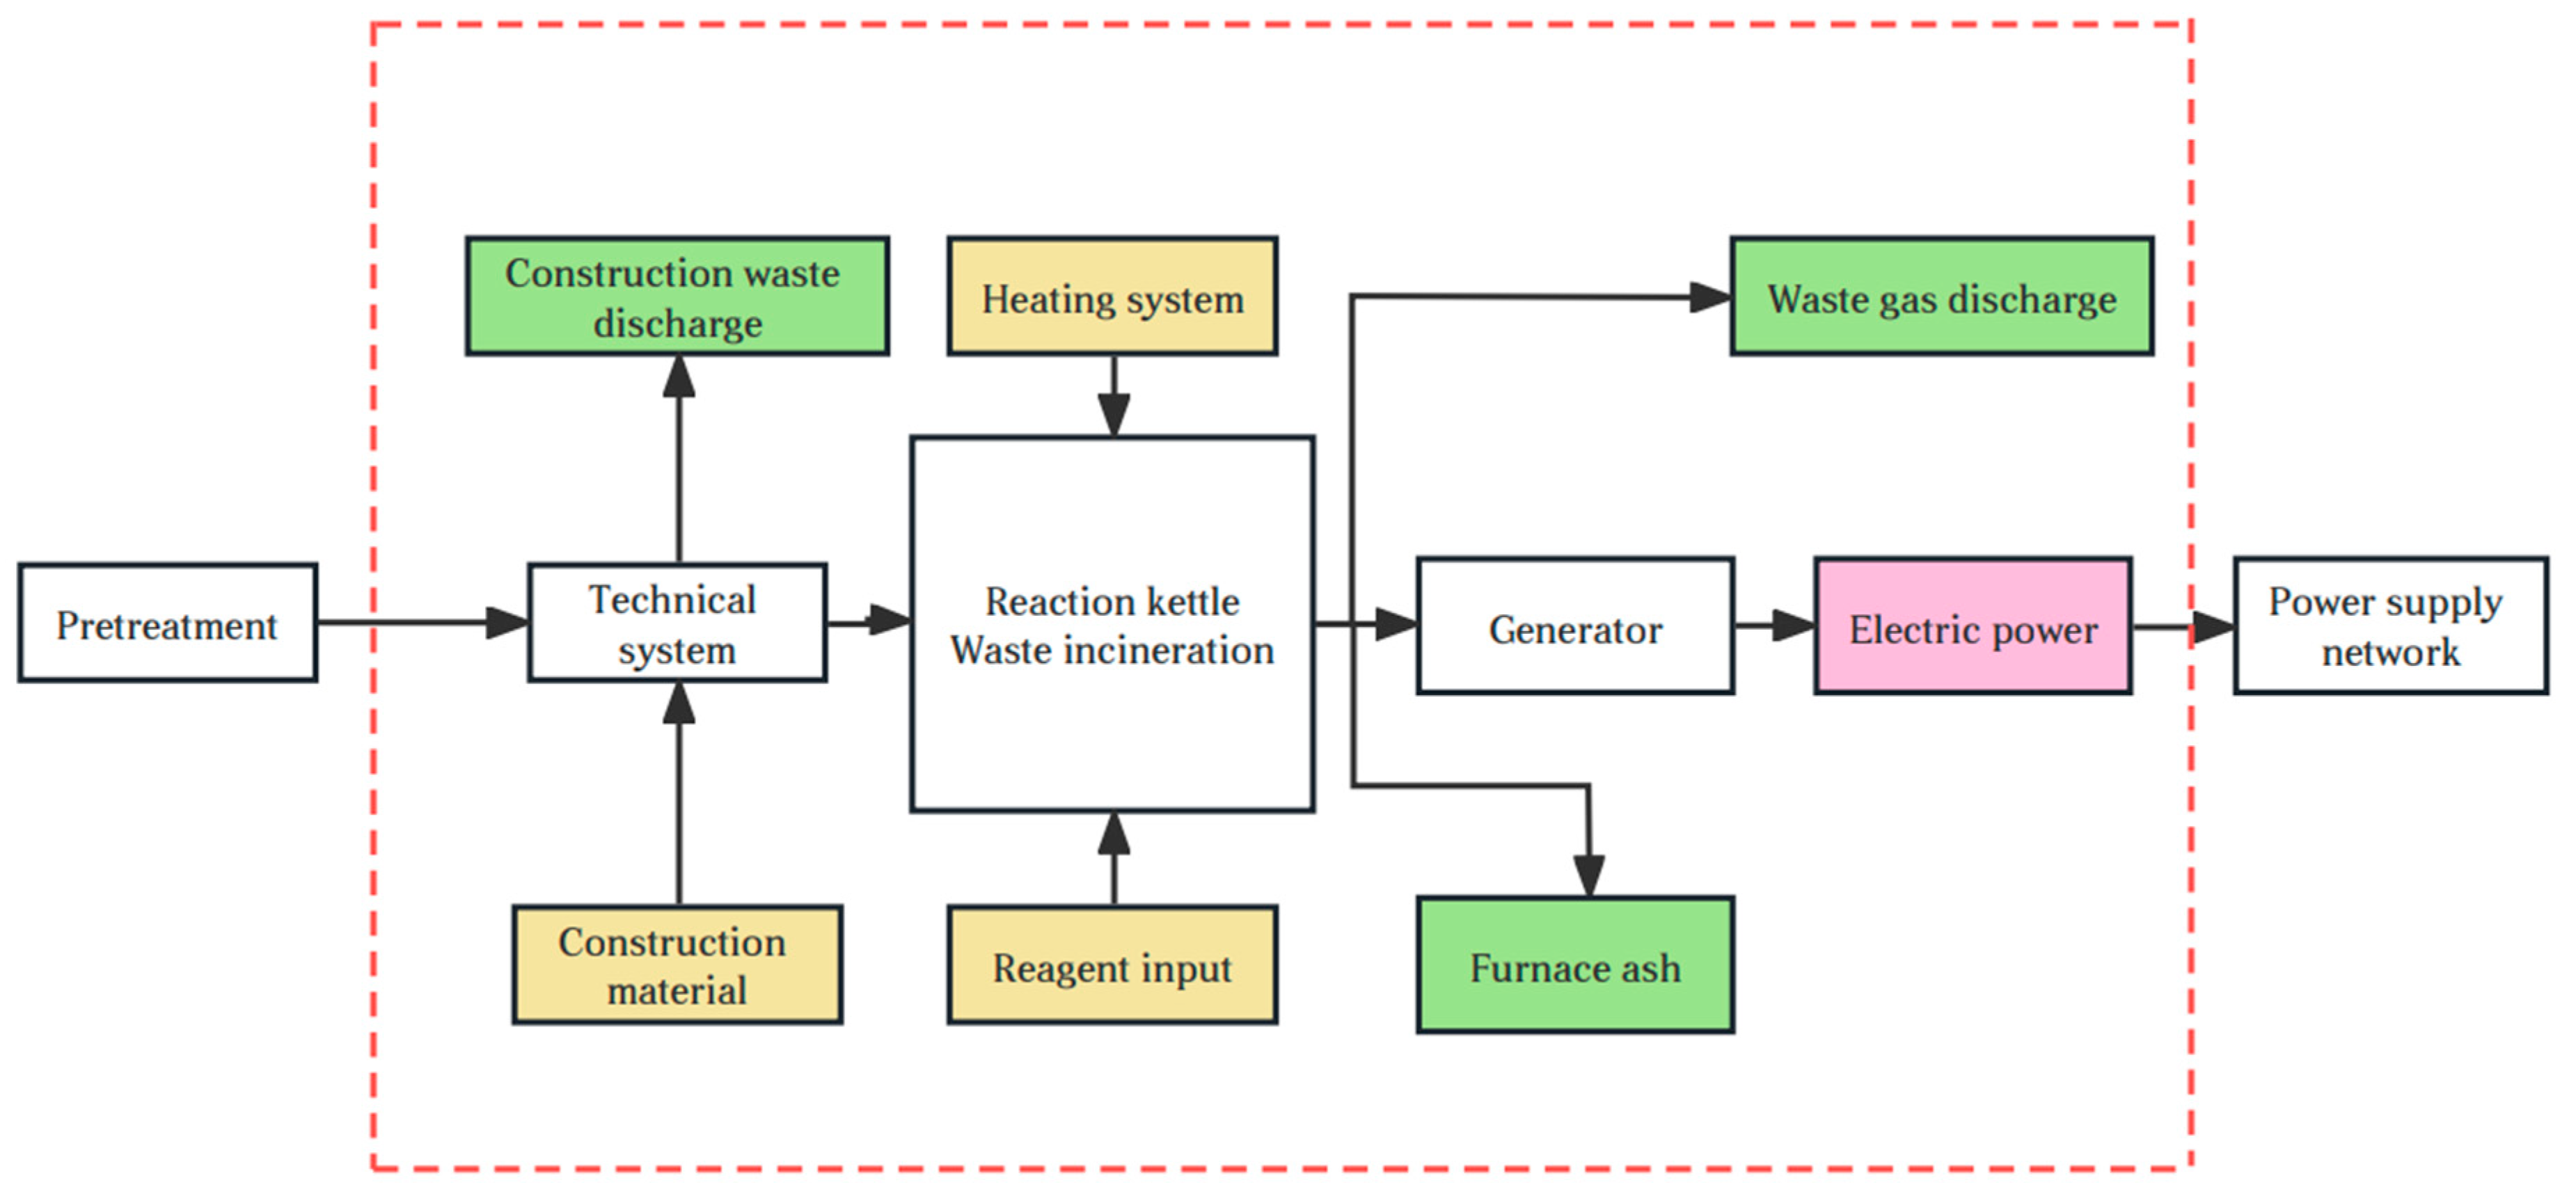
- Incineration and power generation technology.
3.2. Sensitivity Analysis
3.3. Technology Optimization
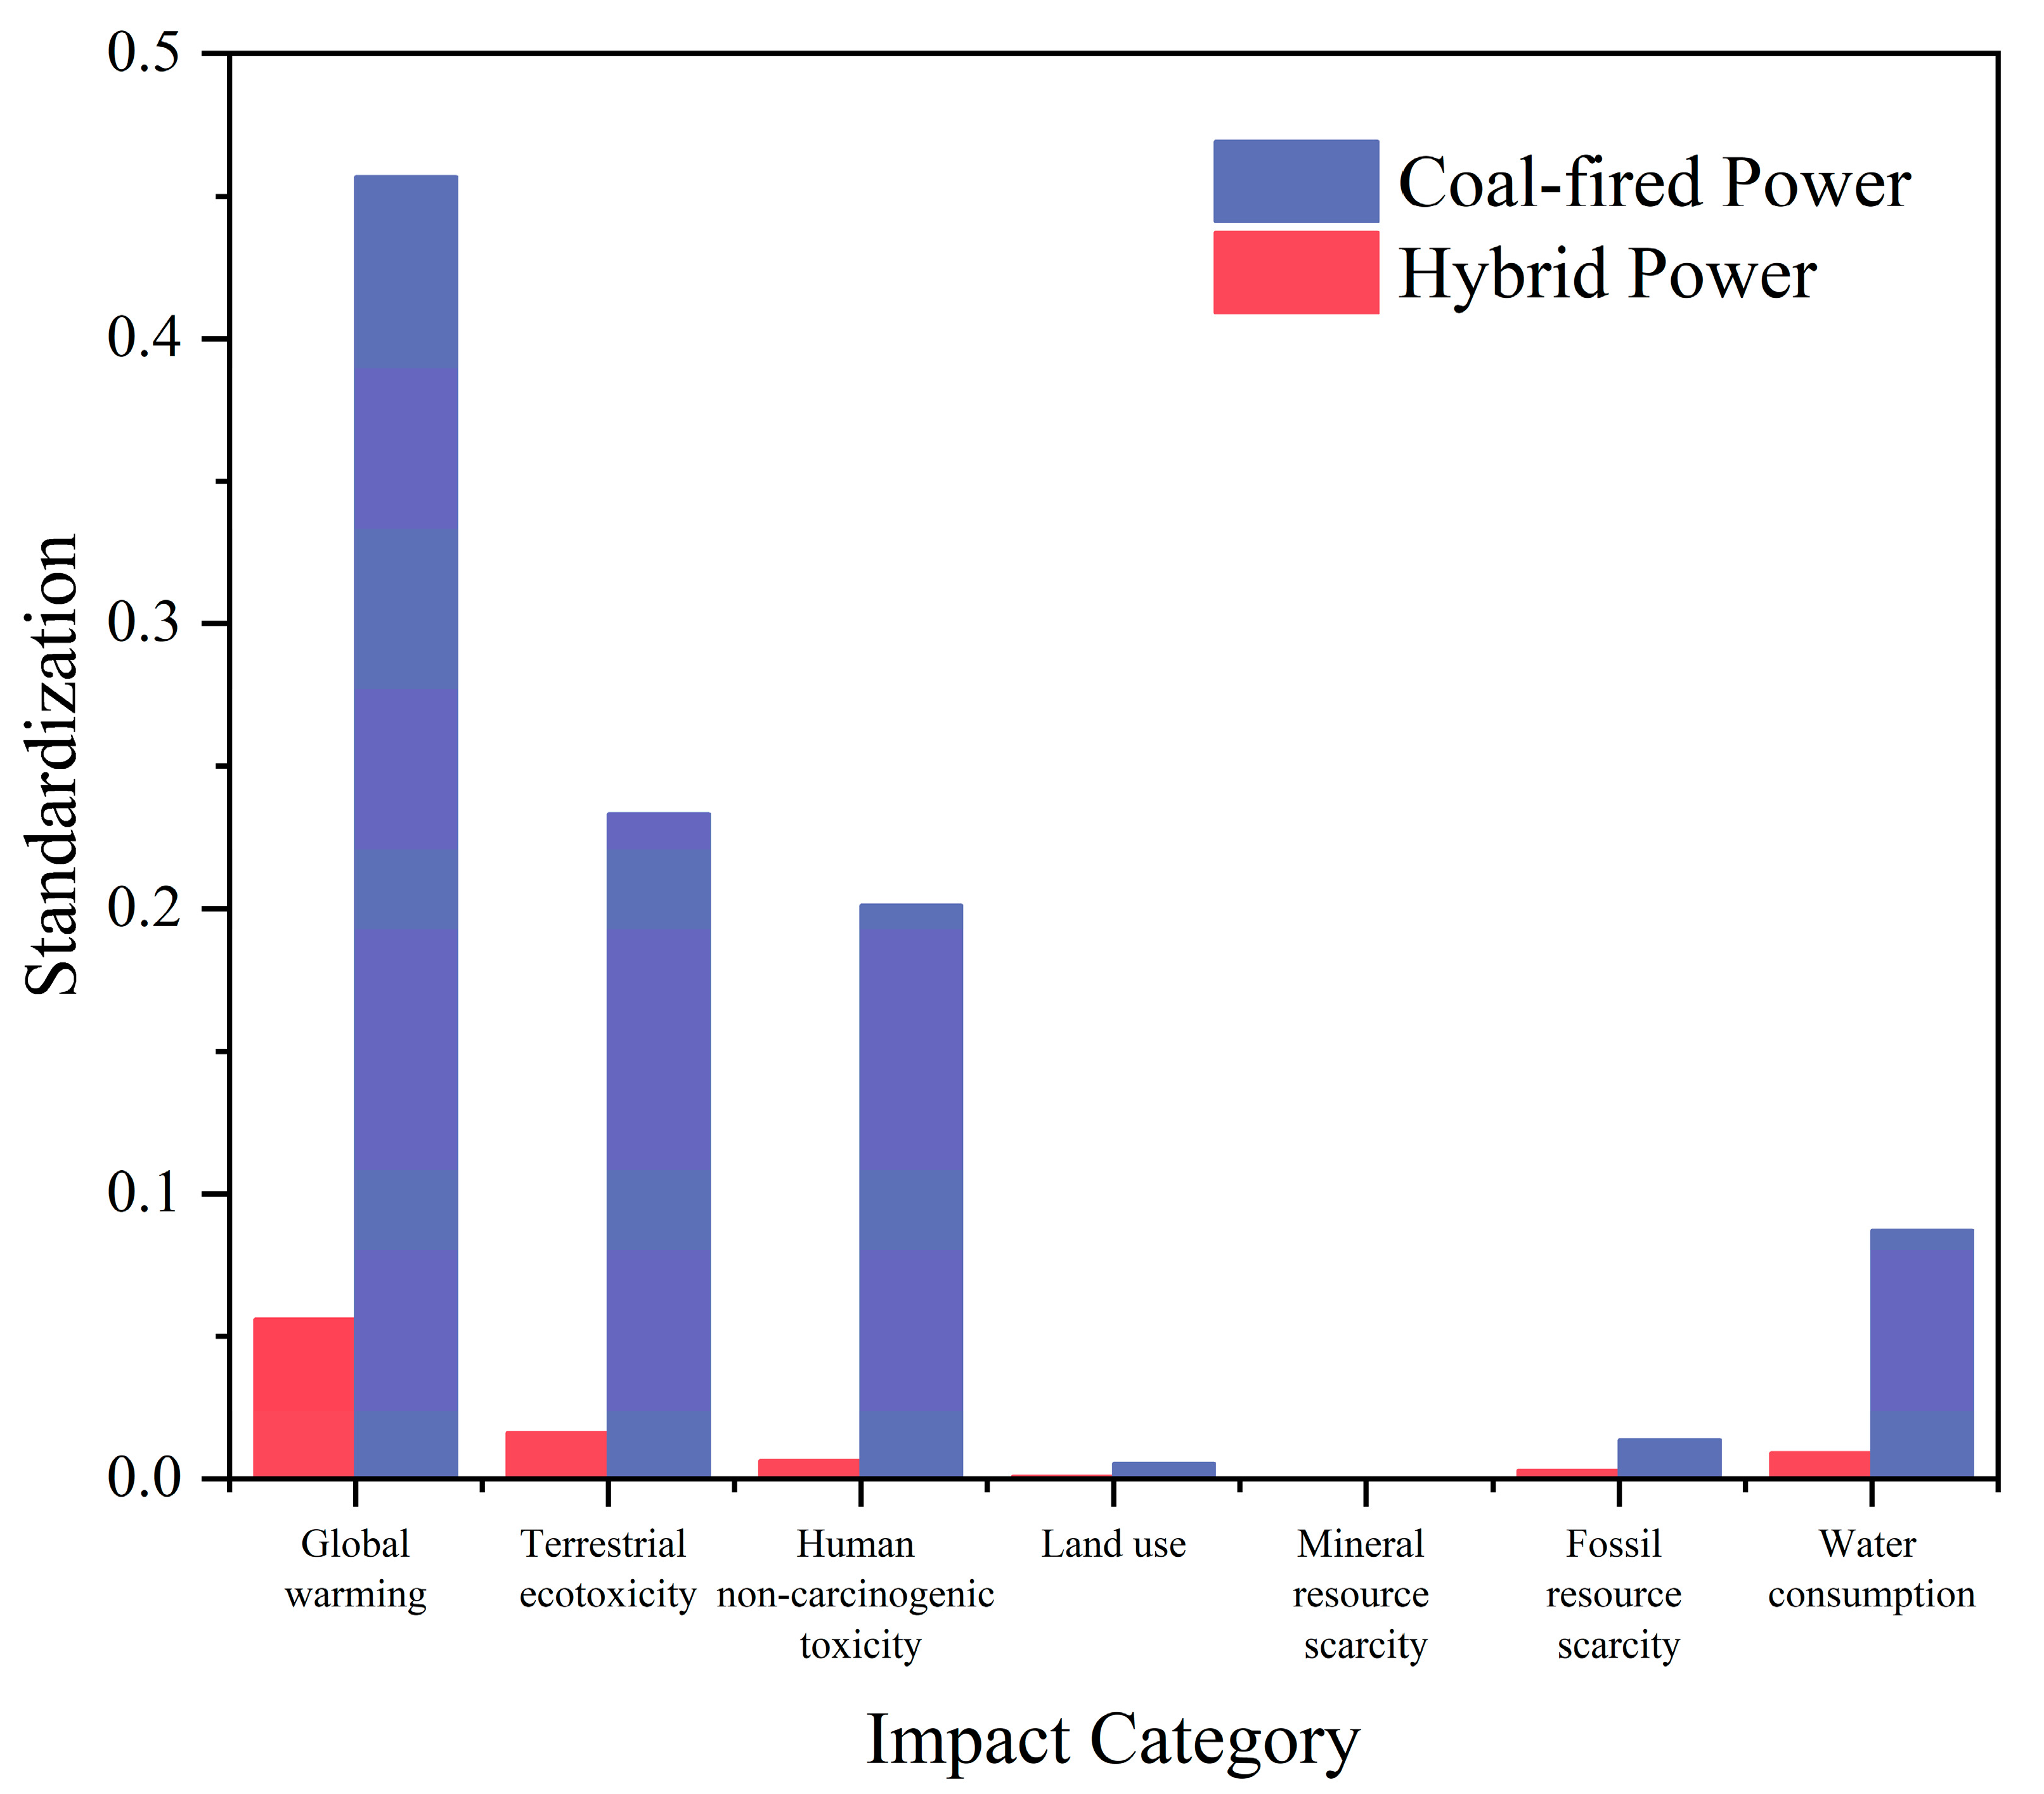
3.3.1. Optimization of Electricity Input
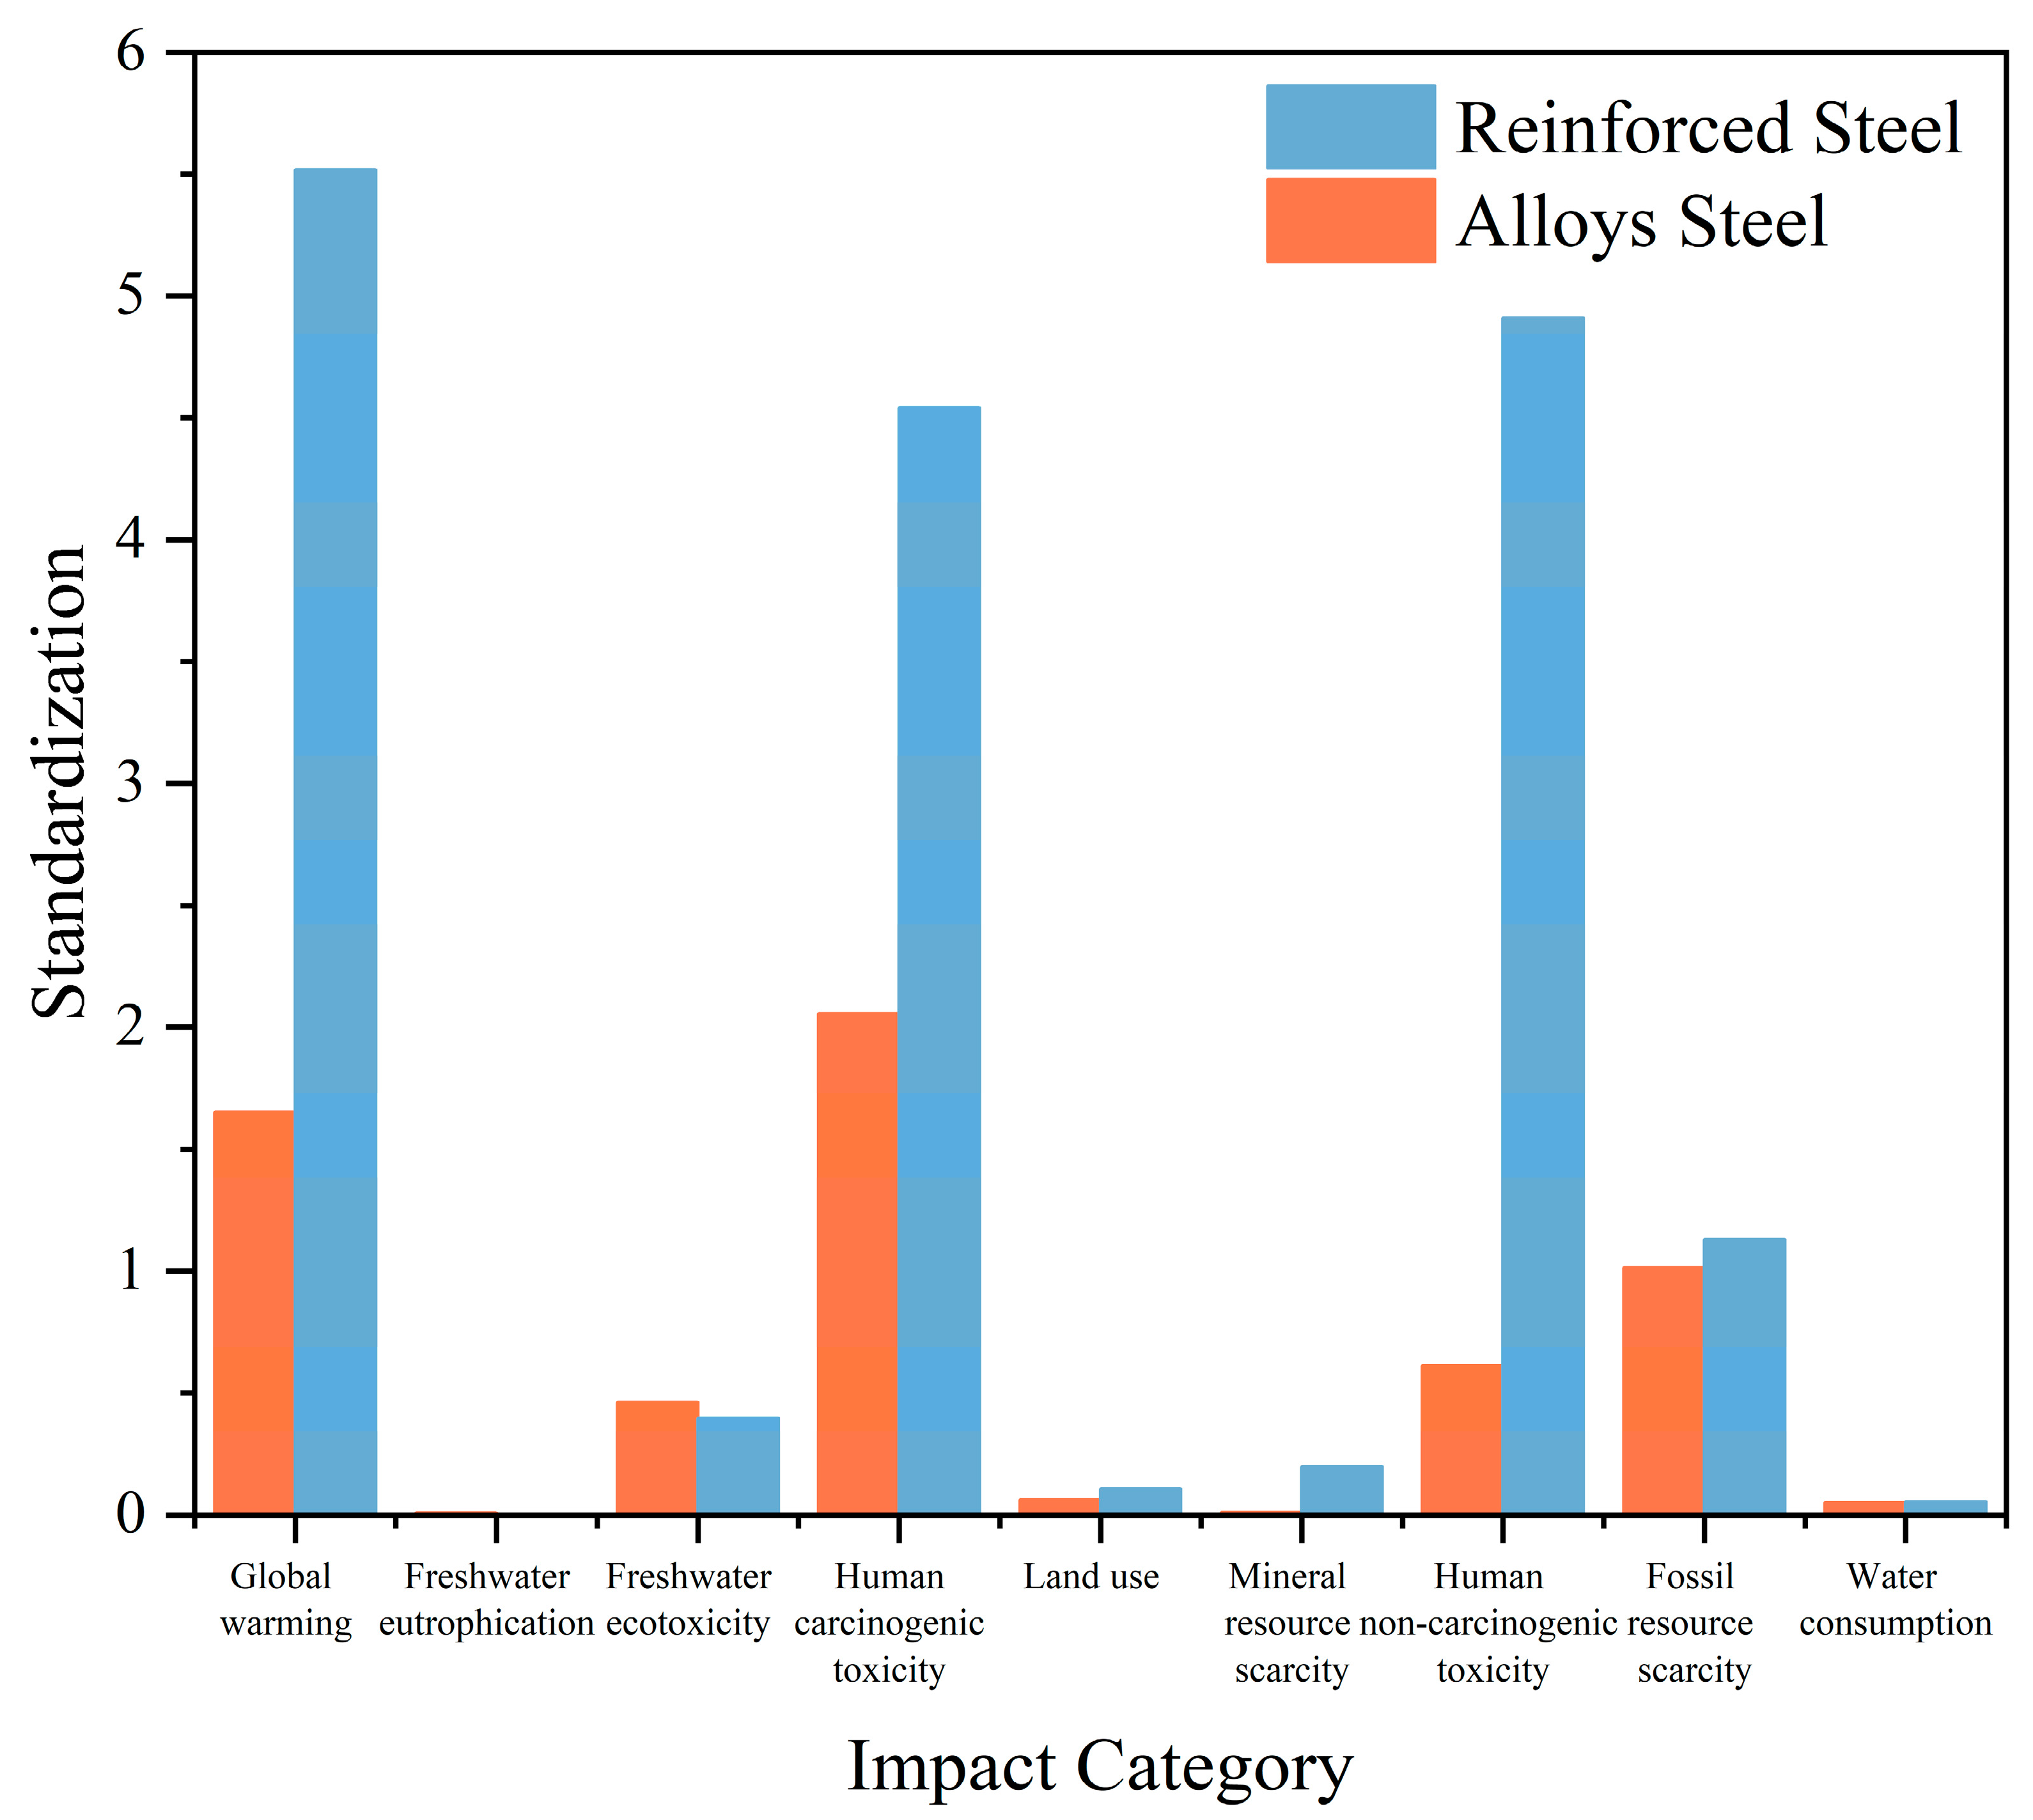
3.3.2. Optimization of Catalytic Cracking Equipment
3.3.3. Optimization of Incineration and Power Generation Agents
4. Conclusions
- (1)
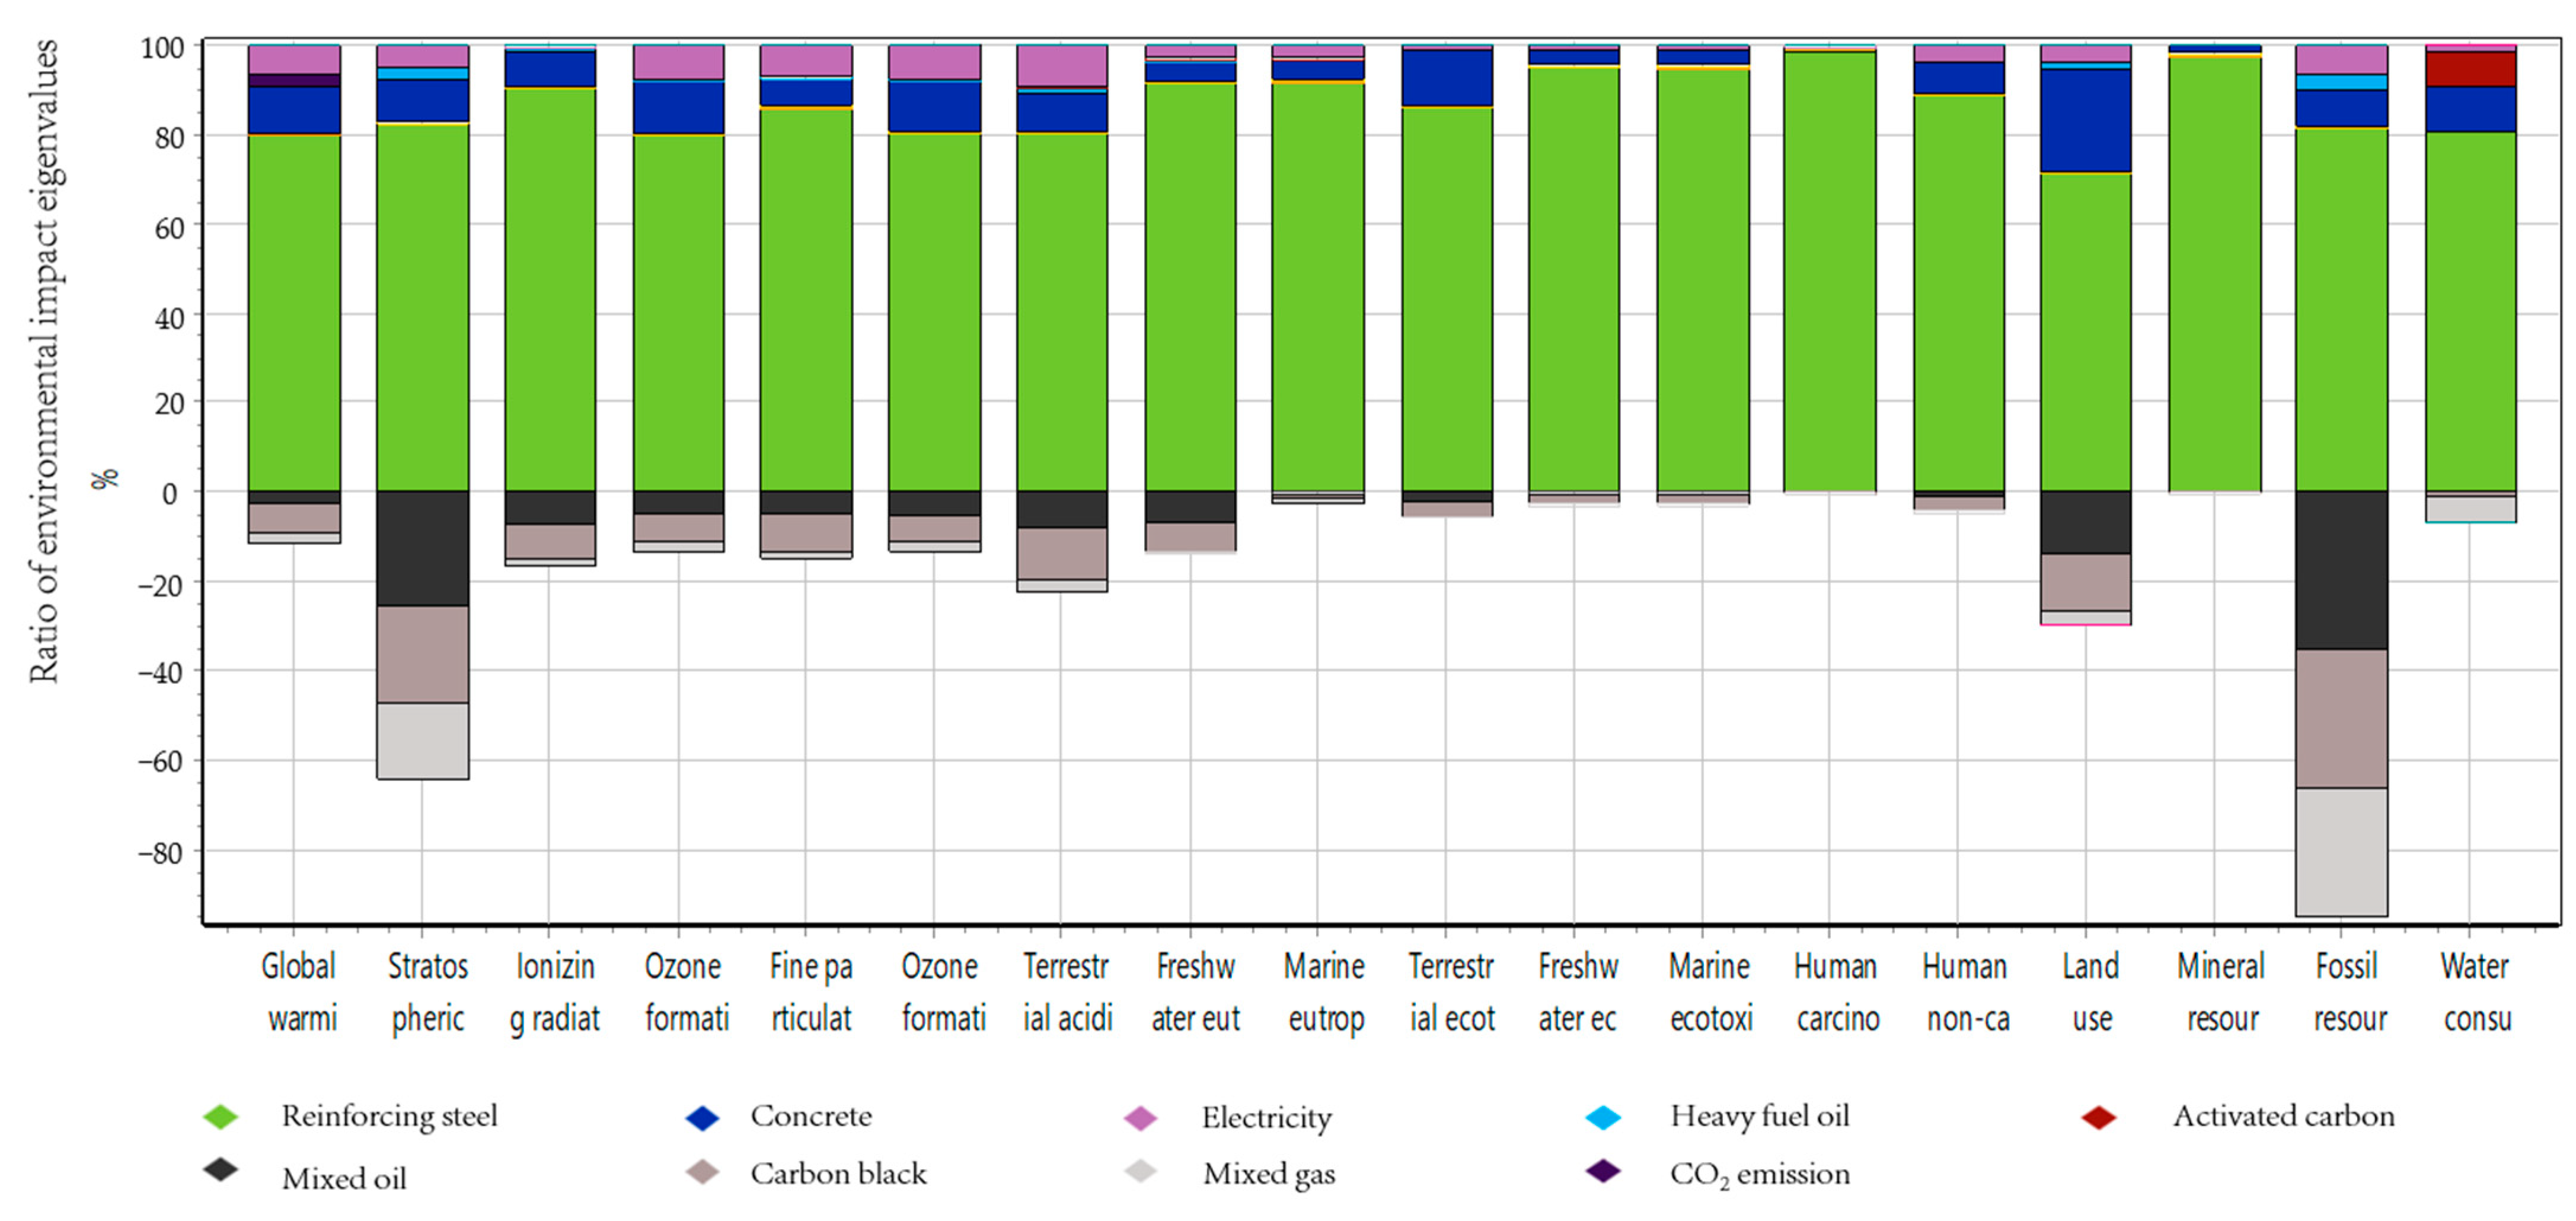
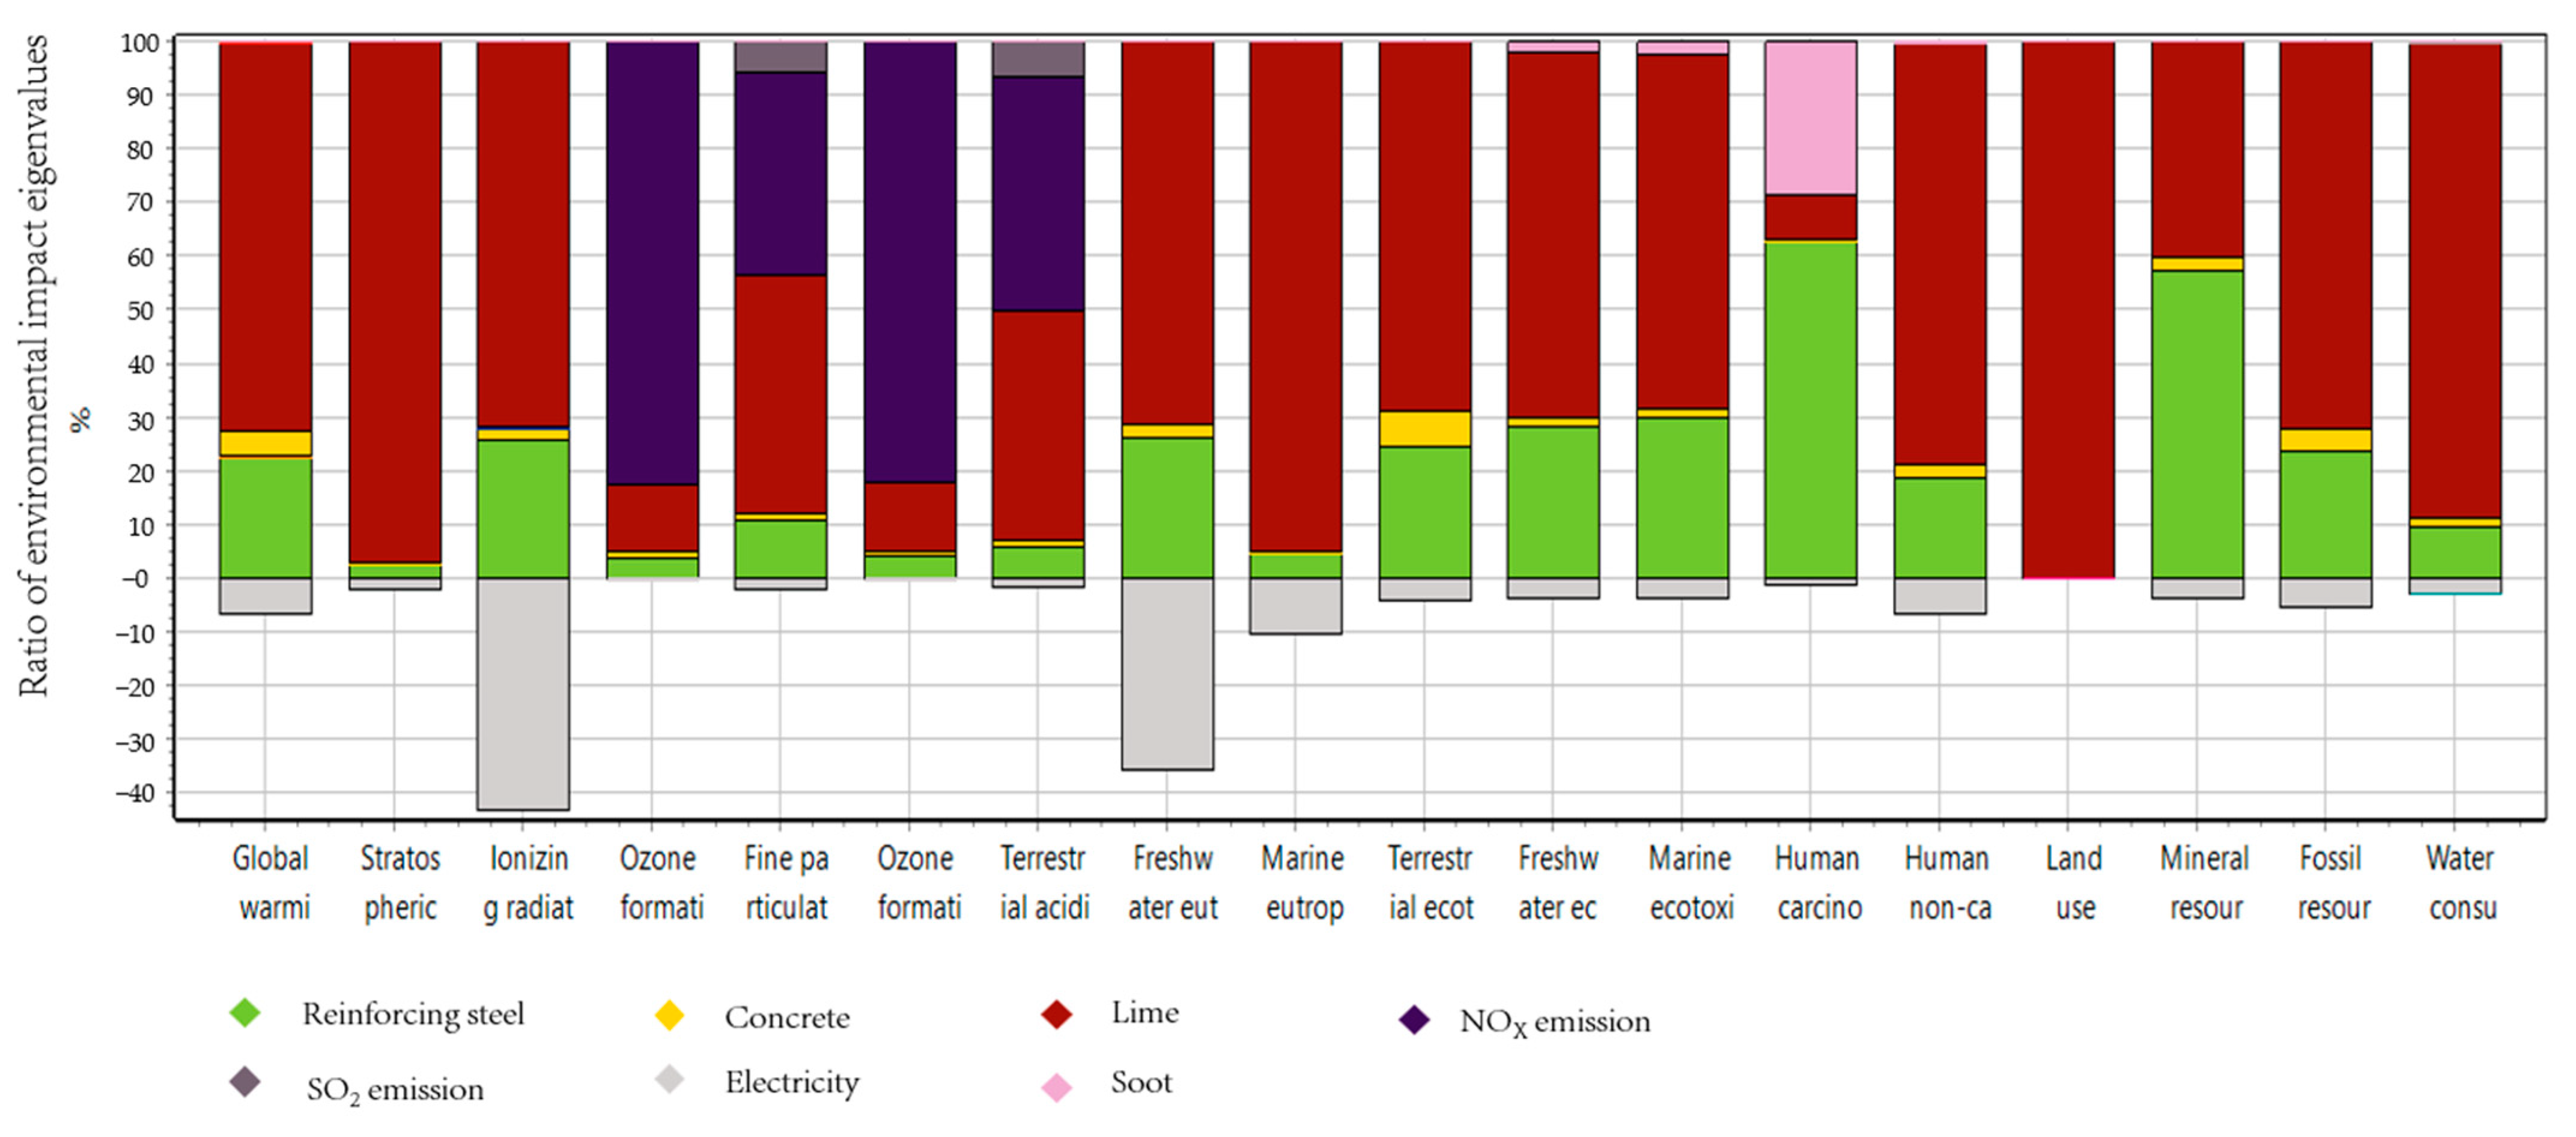
- The negative environmental impacts of CCT are lower compared with IAPGT, most of which are concentrated in the construction stage; the impact of reinforced steel on equipment is the most significant. The negative environmental impact of IAPGT is more clearly reflected in the operation stage; the impact of chemical input is the most significant. According to the standardized results of environmental impact, the total environmental impacts of CCT and IAPGT are 42.466 and 111.598 per functional unit, respectively.
- (2)
- Based on the sensitivity analysis, the environmental impact contribution of CCT is the most significant due to data fluctuations in the construction phase, and the environmental impact contribution of incineration and power generation is the most significant due to data fluctuations in the operation phase. Therefore, for CCT, optimization should be focused on the construction phase, and for IAPGT, optimization should be focused on the operation phase.
- (3)
- The process optimization discussion shows that a mixed power input, chromium-nickel composite steel, and composite agent structure can significantly reduce the negative environmental impact. However, there is also a negative environmental impact; thus, it is necessary to avoid environmental damage as much as possible and choose a technical solution with higher overall environmental benefits during the specific implementation. Relevant companies and R&D platforms could conduct research based on this idea and make sustainable improvements to the technology.
- (4)
- Contemporary research is still at the experimental stage, and the data sources are not extensive enough. Thus, subsequent studies could be based on more extensive enterprise research combined with actual production experience to drive the optimization of the technology from the perspective of production applications. In addition, future studies could apply more environmental analysis indicators.
Author Contributions
Funding
Institutional Review Board Statement
Informed Consent Statement
Data Availability Statement
Conflicts of Interest
References
- Fitriani, F.; Bilad, M.R.; Aprilia, S.; Arahman, N. Biodegradable Hybrid Polymer Film for Packaging: A Review. J. Nat. Fibers 2023, 20, 2159606. [Google Scholar] [CrossRef]
- Park, H.; Kim, K.; Yu, M.; Yun, Z.; Lee, S. Economic Analysis of the Circular Economy Based on Waste Plastic Pyrolysis Oil: A Case of the University Campus. Environ. Dev. Sustain. 2023, 21. [Google Scholar] [CrossRef]
- Shekhar, S.; Hoque, M.E.; Bajpai, P.K.; Islam, H.; Sharma, B. Chemical Upcycling of Plastics as a Solution to the Plastic Trash Problem for an Ideal, Circular Polymer Economy and Energy Recovery. Environ. Dev. Sustain. 2023, 36. [Google Scholar] [CrossRef]
- Prasad, M.K. A Review on Pyrolysis of Agro-Waste and Plastic Waste into Biofuels: Shifting to Bio-Based Economy. BioEnergy Res. 2023, 29. [Google Scholar]
- Liu, Y.; Liao, C.; Tang, Y.; Tang, J.; Sun, Y.; Ma, X. Techno-Environmental-Economic Evaluation of the Small-Scale Municipal Solid Waste (MSW) Gasification-Based and Incineration-Based Power Generation Plants. J. Taiwan Inst. Chem. Eng. 2022, 141, 104594. [Google Scholar] [CrossRef]
- Rodrigues, L.F.; Santos, I.F.S.D.; Santos, T.I.S.D.; Barros, R.M.; Tiago Filho, G.L. Energy and Economic Evaluation of MSW Incineration and Gasification in Brazil. Renew. Energy 2022, 188, 933–944. [Google Scholar] [CrossRef]
- Wang, Y.; Zhao, Q.; Zhang, Z.; Lei, J.; Hou, Y. Progress of domestic and international recycling of waste plastics by cracking in the context of carbon neutrality. Chem. Ind. Eng. Prog. 2022, 41, 1470–1478. [Google Scholar] [CrossRef]
- Hung, Y.-C.; Ho, C.-H.; Chen, L.-Y.; Ma, S.-C.; Liu, T.-I.; Shen, Y.-C. Using a Low-Temperature Pyrolysis Device for Polymeric Waste to Implement a Distributed Energy System. Sustainability 2023, 15, 1580. [Google Scholar] [CrossRef]
- Zhao, Y.; Yuan, J.; Zhao, S.; Chang, H.; Li, R.; Lin, G.; Li, X. Is Pyrolysis Technology an Advisable Choice for Municipal Solid Waste Treatment from a Low Carbon Perspective? Chem. Eng. J. 2022, 449, 137785. [Google Scholar] [CrossRef]
- Jeong, Y.-S.; Choi, Y.-K.; Kang, B.-S.; Ryu, J.-H.; Kim, H.-S.; Kang, M.-S.; Ryu, L.-H.; Kim, J.-S. Lab-Scale and Pilot-Scale Two-Stage Gasification of Biomass Using Active Carbon for Production of Hydrogen-Rich and Low-Tar Producer Gas. Fuel Process. Technol. 2020, 198, 106240. [Google Scholar] [CrossRef]
- Filip, M.; Pop, A.; Perhaiţa, I.; Moldovan, M.; Truşcă, R. Investigation of Thermal and Catalytic Degradation of Polystyrene Waste into Styrene Monomer over Natural Volcanic Tuff and Florisil Catalysts. Open Chem. 2013, 11, 725–735. [Google Scholar] [CrossRef]
- Guo, L.; Xu, W.; Zhang, Y.; Ji, W.; Wu, S. Selecting the Best Performing Modified Asphalt Based on Rheological Properties and Microscopic Analysis of RPP/SBS Modified Asphalt. Materials 2022, 15, 8616. [Google Scholar] [CrossRef] [PubMed]
- Sharma, R.; Bansal, P.P. Use of Different Forms of Waste Plastic in Concrete—A Review. J. Clean. Prod. 2016, 112, 473–482. [Google Scholar] [CrossRef]
- Zhou, H.; Wei, Y.; Song, J.; Wang, M. Co-catalytic cracking of mixed waste plastics and coker wax oil to make fuel oil. Ind. Catal. 2018, 26, 80. [Google Scholar] [CrossRef]
- Somoza-Tornos, A.; Guerra, O.J.; Crow, A.M.; Smith, W.A.; Hodge, B.-M. Process Modeling, Techno-Economic Assessment, and Life Cycle Assessment of the Electrochemical Reduction of CO2: A Review. iScience 2021, 24, 102813. [Google Scholar] [CrossRef]
- Elwan, A.; Arief, Y.Z.; Adzis, Z.; Saad, M.H.I. The Viability of Generating Electricity by Harnessing Household Garbage Solid Waste Using Life Cycle Assessment. Procedia Technol. 2013, 11, 134–140. [Google Scholar] [CrossRef]
- Perugini, F.; Mastellone, M.L.; Arena, U. A Life Cycle Assessment of Mechanical and Feedstock Recycling Options for Management of Plastic Packaging Wastes. Environ. Prog. 2005, 24, 137–154. [Google Scholar] [CrossRef]
- Florindo, T.J.; De Medeiros Florindo, G.I.B.; Talamini, E.; Da Costa, J.S.; Ruviaro, C.F. Carbon Footprint and Life Cycle Costing of Beef Cattle in the Brazilian Midwest. J. Clean. Prod. 2017, 147, 119–129. [Google Scholar] [CrossRef]
- Tonini, D.; Wandl, A.; Meister, K.; Unceta, P.M.; Taelman, S.E.; Sanjuan-Delmás, D.; Dewulf, J.; Huygens, D. Quantitative Sustainability Assessment of Household Food Waste Management in the Amsterdam Metropolitan Area. Resour. Conserv. Recycl. 2020, 160, 104854. [Google Scholar] [CrossRef]
- Sosnina, E.; Masleeva, O.; Kryukov, E.; Erdili, N. Methodology of the Renewable Energy Sources Life Cycle Environmental Assessment. In Proceedings of the 2021 IEEE PES Innovative Smart Grid Technologies Europe (ISGT Europe), Espoo, Finland, 18 October 2021; pp. 1–5. [Google Scholar]
- Chari, S.; Sebastiani, A.; Paulillo, A.; Materazzi, M. The Environmental Performance of Mixed Plastic Waste Gasification with Carbon Capture and Storage to Produce Hydrogen in the U.K. ACS Sustain. Chem. Eng. 2023, 11, 3248–3259. [Google Scholar] [CrossRef]
- Claassens, C.E.; Cilliers, D.P.; Retief, F.P.; Roos, C.; Alberts, R.C. The Consideration of Waste Management in Environmental Impact Assessment (EIA) for Developments in Protected Areas. Impact Assess. Proj. Apprais. 2022, 40, 320–330. [Google Scholar] [CrossRef]
- Zhang, K.; Tsai, J.-S. Identification of Critical Factors Influencing Prefabricated Construction Quality and Their Mutual Relationship. Sustainability 2021, 13, 11081. [Google Scholar] [CrossRef]
- Nighojkar, A.; Sangal, V.K.; Dixit, F.; Kandasubramanian, B. Sustainable Conversion of Saturated Adsorbents (SAs) from Wastewater into Value-Added Products: Future Prospects and Challenges with Toxic per- and Poly-Fluoroalkyl Substances (PFAS). Environ. Sci. Pollut. Res. 2022, 29, 78207–78227. [Google Scholar] [CrossRef] [PubMed]
- Seitz, M.; Schröter, S. Catalytic Depolymerization of Polyolefinic Plastic Waste. Chem. Ing. Tech. 2022, 94, 720–726. [Google Scholar] [CrossRef]
- Xing, Z.; Ping, Z.; Xiqiang, Z.; Zhanlong, S.; Wenlong, W.; Jing, S.; Yanpeng, M. Applicability of Municipal Solid Waste Incineration (MSWI) System Integrated with Pre-Drying or Torrefaction for Flue Gas Waste Heat Recovery. Energy 2021, 224, 120157. [Google Scholar] [CrossRef]
- Barkhordari, A.; Guzman, M.I.; Ebrahimzadeh, G.; Sorooshian, A.; Delikhoon, M.; Jamshidi Rastani, M.; Golbaz, S.; Fazlzadeh, M.; Nabizadeh, R.; Norouzian Baghani, A. Characteristics and Health Effects of Particulate Matter Emitted from a Waste Sorting Plant. Waste Manag. 2022, 150, 244–256. [Google Scholar] [CrossRef]
- Adeniyi, L.A. Assessment of the Effects of Location of Disposal-Sites on Waste Disposal Practices of Urban Residents in Nigeria. GeoJournal 2023, 15. [Google Scholar] [CrossRef]
- De Feo, G.; Ferrara, C. A Procedure for Evaluating the Most Environmentally Sound Alternative between Two On-Site Small-Scale Wastewater Treatment Systems. J. Clean. Prod. 2017, 164, 124–136. [Google Scholar] [CrossRef]
- Lozano-Medina, A.; Pérez-Báez, S.O.; Alamo, A.L.; Blanco-Marigorta, A.M. A Parametric Environmental Life Cycle Assessment of Newspaper Making in Spain. Int. J. Life Cycle Assess. 2018, 23, 1240–1260. [Google Scholar] [CrossRef]
- Li, X.; Gui, F.; Li, Q. Can Hydropower Still Be Considered a Clean Energy Source? Compelling Evidence from a Middle-Sized Hydropower Station in China. Sustainability 2019, 11, 4261. [Google Scholar] [CrossRef]
- Li, J.; Zheng, H.; Li, J.; Ye, M.; Yang, Y.; Liu, B.; Lu, H.; Zou, B. Environmental impact study of municipal domestic waste incineration process based on life cycle assessment. Environ. Pollut. Control 2022, 44, 1209–1215. [Google Scholar] [CrossRef]
- Nie, R. A Study on the Impact of Upgrading Waste-to-Energy Projects on Mitigating the Neighborhood Avoidance Effect. Master’s Thesis, Dalian University of Technology, Dalian, China, 2022. [Google Scholar]
- Xie, M. Comprehensive Analysis of the Investment Value of Domestic Waste Incineration Power Generation Projects. Master’s Thesis, Northeast Electric Power University, Jilin, China, 2021. [Google Scholar]
- Huijbregts, M.A.J.; Steinmann, Z.J.N.; Elshout, P.M.F.; Stam, G.; Verones, F.; Vieira, M.; Zijp, M.; Hollander, A.; van Zelm, R. ReCiPe2016: A Harmonised Life Cycle Impact Assessment Method at Midpoint and Endpoint Level. Int. J. Life Cycle Assess. 2017, 22, 138–147. [Google Scholar] [CrossRef]
- Kawajiri, K.; Kobayashi, M. Cradle-to-Gate Life Cycle Assessment of Recycling Processes for Carbon Fibers: A Case Study of Ex-Ante Life Cycle Assessment for Commercially Feasible Pyrolysis and Solvolysis Approaches. J. Clean. Prod. 2022, 378, 134581. [Google Scholar] [CrossRef]
- Borghesi, G.; Stefanini, R.; Vignali, G. Life Cycle Assessment of Packaged Organic Dairy Product: A Comparison of Different Methods for the Environmental Assessment of Alternative Scenarios. J. Food Eng. 2022, 318, 110902. [Google Scholar] [CrossRef]
- Jia, X.; Lv, F.; Li, P.; Wang, W. Life-Cycle Assessment of p-Type Multi-Si Back Surface Field (BSF) Solar Module in China of 2019. Sol. Energy 2020, 196, 207–216. [Google Scholar] [CrossRef]
- Cho, H.H.; Strezov, V. Comparative Analysis of the Environmental Impacts of Australian Thermal Power Stations Using Direct Emission Data and GIS Integrated Methods. Energy 2021, 231, 120898. [Google Scholar] [CrossRef]
- Cui, T. A Study on the Preferential Selection of Rural Wastewater Treatment Model in China Based on Life Cycle Sustainability Evaluation and Multi-Criteria Decision Coupling Model. Master’s Thesis, Qingdao University, Qingdao, China, 2022. [Google Scholar]
- Luo, X.; Wang, Y.; Gong, X.; Xu, H. Problems and countermeasures for landfill disposal of solidified and stabilized fly ash from waste incineration. J. Environ. Eng. 2018, 12, 2717–2724. [Google Scholar]
- Tsai, C.-H.; Shen, Y.-H.; Tsai, W.-T. Analysis of Current Status and Regulatory Promotion for Incineration Bottom Ash Recycling in Taiwan. Resources 2020, 9, 117. [Google Scholar] [CrossRef]
- Oguchi, M.; Sakanakura, H.; Terazono, A. Toxic Metals in WEEE: Characterization and Substance Flow Analysis in Waste Treatment Processes. Sci. Total Environ. 2013, 463–464, 1124–1132. [Google Scholar] [CrossRef]
- Popović, O.; Prokić-Cvetković, R.; Burzić, M.; Lukić, U.; Beljić, B. Fume and Gas Emission during Arc Welding: Hazards and Recommendation. Renew. Sustain. Energy Rev. 2014, 37, 509–516. [Google Scholar] [CrossRef]
- Dong, Q.; Jia, W.; Zhang, Z.; Zhang, D.; Wu, J.; Zhang, B. Effects of Ni Content on the Corrosion Behavior of Al0.5 CoCrFeNix High Entropy Alloys in Acid and Alkaline Media. Mater. Corros. 2022, 73, 1274–1285. [Google Scholar] [CrossRef]
- Yin, K.; Chan, W.-P.; Dou, X.; Ahamed, A.; Lisak, G.; Chang, V.W.-C. Human Exposure and Risk Assessment of Recycling Incineration Bottom Ash for Land Reclamation: A Showcase Coupling Studies of Leachability, Transport Modeling and Bioaccumulation. J. Hazard. Mater. 2020, 385, 121600. [Google Scholar] [CrossRef] [PubMed]
- Van der Ploeg, R.R.; Schweigert, R.P.; Bachmann, R.J. Use and Misuse of Nitrogen in Agriculture: The German Story. Sci. World J. 2001, 1, 737–744. [Google Scholar] [CrossRef] [PubMed]
- Shi, Y.; Cui, S.; Ju, X.; Cai, Z.; Zhu, Y.-G. Impacts of Reactive Nitrogen on Climate Change in China. Sci. Rep. 2015, 5, 8118. [Google Scholar] [CrossRef] [PubMed]
- Chen, B.; Yan, W.; Wu, S.; Liu, Z.; Yan, Y. Research on Test and Evaluation Technology of Hybrid Power Unit. IOP Conf. Ser. Earth Environ. Sci. 2021, 632, 032067. [Google Scholar] [CrossRef]
- Chein, H.M.; Aggarwal, S.G.; Wu, H.H.; Chen, T.M.; Huang, C.-C. Field Enhancements of Packed-Bed Performance for Low-Concentration Acidic and Basic-Waste Gases from Semiconductor Manufacturing Process. J. Air Waste Manag. Assoc. 2005, 55, 647–657. [Google Scholar] [CrossRef]
- Chin, T.; Yan, R.; Liang, D.T.; Tay, J.H. Hydrated Lime Reaction with HCl under Simulated Flue Gas Conditions. Ind. Eng. Chem. Res. 2005, 44, 3742–3748. [Google Scholar] [CrossRef]
- Fang, M.-L.; Wu, C.-Y.; Chou, M.-S. Adsorptive Conversion of Nitrogen Dioxide from Etching Vent Gases over Activated Carbon. J. Air Waste Manag. Assoc. 2018, 68, 755–762. [Google Scholar] [CrossRef]


| Flow of Materials | CCT | IAPGT |
|---|---|---|
| (+) Reinforced steel for equipment(t) | 2.5 | 1.3 |
| (+) Operating auxiliary steel (kg) | 3 | 3 |
| (+) Concrete (m3) | 2.475 | 2.475 |
| (+) Electricity (kWh) | 29.8 | 29.8 |
| (−) Solid waste (kg) | 1.065 | 1.065 |
| (−) Wastewater (m3) | 3.522 | 3.522 |
| Flow of Materials | CCT | IAPGT |
|---|---|---|
| ① Pharmaceutical input | ||
| Activated carbon | 0.5 kg | 0.5 kg |
| Sodium hydroxide | 0.1 kg | 0.1 kg |
| Urea fueling agent | / | 0.45 kg |
| Lime | / | 8 t |
| ② Energy input | ||
| Electricity for production | 400 kWh | 40 kWh |
| ③ Product output | ||
| Mixed oil | 0.461 t | / |
| Carbon black | 0.246 t | / |
| Mixed Gas | 0.293 t | / |
| Electricity | / | 529.41 kWh |
| ④ Waste discharge | ||
| Carbon dioxide | 153 kg | 24 kg |
| Sulfur dioxide | 0.0048 kg | 5.62 kg |
| Nitrogen oxides | / | 157.5 kg |
| Carbon monoxide | / | 3.56 kg |
| Hydrogen chloride | / | 1.9 kg |
| Slag | / | 18 kg |
| Fly ash | / | 2.7 kg |
| Environment Impact Categories | Unit |
|---|---|
| Global warming | kg CO2 eq |
| Stratospheric ozone depletion | kg CFC11 eq |
| Ionizing radiation | kBq Co-60 eq |
| Ozone formation, human health | kg NOX eq |
| Fine particulate matter formation | kg PM2.5 eq |
| Ozone formation, terrestrial ecosystems | kg NOx eq |
| Terrestrial acidification | kg SO2 eq |
| Freshwater eutrophication | kg P eq |
| Marine eutrophication | kg N eq |
| Terrestrial ecotoxicity | kg 1,4-DCB |
| Freshwater ecotoxicity | kg 1,4-DCB |
| Marine ecotoxicity | kg 1,4-DCB |
| Human carcinogenic toxicity | kg 1,4-DCB |
| Human non-carcinogenic toxicity | kg 1,4-DCB |
| Land use | m2a crop eq |
| Mineral resource scarcity | kg Cu eq |
| Fossil resource scarcity | kg oil eq |
| Water consumption | m3 |
| Environment Impact Categories | Unit | CCT | Standardization | IAPGT | Standardization |
|---|---|---|---|---|---|
| Global warming | kg CO2 eq | 6.071 | 0.758 | 11.851 | 1.481 |
| Stratospheric ozone depletion | kg CFC11 eq | 0.000 | 0.008 | 0.000 | 0.391 |
| Ionizing radiation | kBq Co-60 eq | 0.148 | 0.308 | 0.186 | 0.388 |
| Ozone formation, human health | kg NOX eq | 0.014 | 0.715 | 0.189 | 9.211 |
| Fine particulate matter formation | kg PM2.5 eq | 0.009 | 0.362 | 0.044 | 1.744 |
| Ozone formation, terrestrial ecosystems | kg NOx eq | 0.015 | 0.869 | 0.190 | 10.713 |
| Terrestrial acidification | kg SO2 eq | 0.014 | 0.345 | 0.127 | 3.121 |
| Freshwater eutrophication | kg P eq | 0.002 | 3.901 | 0.003 | 5.301 |
| Marine eutrophication | kg N eq | 0.000 | 0.040 | 0.001 | 0.411 |
| Terrestrial ecotoxicity | kg 1,4-DCB | 21.201 | 1.395 | 40.206 | 2.645 |
| Freshwater ecotoxicity | kg 1,4-DCB | 0.402 | 15.984 | 0.707 | 28.105 |
| Marine ecotoxicity | kg 1,4-DCB | 0.559 | 12.870 | 0.931 | 21.421 |
| Human carcinogenic toxicity | kg 1,4-DCB | 4.555 | 4.423 | 3.738 | 3.629 |
| Human non-carcinogenic toxicity | kg 1,4-DCB | 5.237 | 0.167 | 12.864 | 0.411 |
| Land use | m2a crop eq | 0.105 | 0.017 | 118.162 | 19.142 |
| Mineral resource scarcity | kg Cu eq | 0.199 | 0.001 | 0.173 | 0.001 |
| Fossil resource scarcity | kg oil eq | 0.061 | 0.062 | 2.342 | 2.389 |
| Water consumption | m3 | 0.062 | 0.232 | 0.289 | 1.086 |
| Environment Impact Categories | Construction | Operation | Electricity | Waste |
|---|---|---|---|---|
| Global warming | 6.228 (92.65%) | 0.027 (0.41%) | 0.456 (6.80%) | 0.009 (0.14%) |
| Terrestrial ecotoxicity | 22.285 (98.30%) | 0.060 (0.27%) | 0.233 (1.03%) | 0.092 (0.41%) |
| Carcinogenic human toxicity | 4.565 (99.65%) | 0.001 (0.03%) | 0.013 (0.30%) | 0.001 (0.02%) |
| Non-carcinogenic human toxicity | 5.273 (95.93%) | 0.015 (0.28%) | 0.201 (3.66%) | 0.007 (0.13%) |
| Environment Impact Categories | Construction | Operation | Electricity | Waste |
|---|---|---|---|---|
| Global warming | 3.495 (27.45%) | 9.228 (72.48%) | 0.000 (0.01%) | 0.006 (0.05%) |
| Terrestrial ecotoxicity | 12.950 (30.90%) | 28.945 (69.06%) | 0.004 (0.01%) | 0.012 (0.03%) |
| Carcinogenic human toxicity | 2.385 (63.10%) | 0.307 (8.15%) | 0.000 (0.01%) | 1.086 (28.75%) |
| Non-carcinogenic human toxicity | 2.880 (20.91%) | 10.867 (78.87%) | 0.000 (0.01%) | 0.029 (0.21%) |
| Land use | 0.090 (0.08%) | 118.152 (99.92%) | 0.000 (0.00%) | 0.000 (0.00%) |
| Fossil resource scarcity | 0.683 (27.58%) | 1.793 (72.38%) | 0.000 (0.01%) | 0.000 (0.04%) |
| Environment Impact Categories | Construction | Operation | Electricity | Waste |
|---|---|---|---|---|
| Global warming | 3.420% | 0.015% | 0.752% | 0.134% |
| Stratospheric ozone depletion | 8.710% | 0.277% | 1.362% | 0.059% |
| Ionizing radiation | 3.934% | 0.045% | 0.041% | 0.011% |
| Ozone formation, human health | 3.523% | 0.026% | 0.874% | 0.023% |
| Fine particulate matter formation | 3.616% | 0.027% | 0.800% | 0.011% |
| Ozone formation, terrestrial ecosystems | 3.537% | 0.026% | 0.833% | 0.022% |
| Terrestrial acidification | 3.845% | 0.049% | 1.190% | 0.017% |
| Freshwater eutrophication | 3.713% | 0.035% | 0.334% | 0.009% |
| Marine eutrophication | 3.321% | 0.008% | 0.287% | 0.081% |
| Terrestrial ecotoxicity | 3.504% | 0.010% | 0.110% | 0.022% |
| Freshwater ecotoxicity | 3.400% | 0.004% | 0.098% | 0.003% |
| Marine ecotoxicity | 3.411% | 0.004% | 0.099% | 0.003% |
| Carcinogenic human toxicity | 3.341% | 0.001% | 0.030% | 0.001% |
| Non-carcinogenic human toxicity | 3.357% | 0.010% | 0.384% | 0.007% |
| Land use | 4.511% | 0.078% | 0.504% | 0.027% |
| Mineral resource scarcity | 3.355% | 0.001% | 0.005% | 0.001% |
| Fossil resource scarcity | 67.312% | 3.007% | 14.223% | 0.396% |
| Water consumption | 3.267% | 0.265% | 0.177% | 0.270% |
| Environment Impact Categories | Construction | Operation | Electricity | Waste |
|---|---|---|---|---|
| Global warming | 0.983% | 2.589% | 0.001% | 0.003% |
| Stratospheric ozone depletion | 0.102% | 3.301% | 0.003% | 0.000% |
| Ionizing radiation | 1.638% | 4.233% | 0.002% | 0.001% |
| Ozone formation, human health | 0.159% | 0.426% | 0.000% | 1.039% |
| Fine particulate matter formation | 0.413% | 1.507% | 0.000% | 0.558% |
| Ozone formation, terrestrial ecosystems | 0.166% | 0.431% | 0.000% | 1.035% |
| Terrestrial acidification | 0.241% | 1.446% | 0.000% | 0.639% |
| Freshwater eutrophication | 1.491% | 3.703% | 0.001% | 0.003% |
| Marine eutrophication | 0.176% | 3.551% | 0.000% | 0.000% |
| Terrestrial ecotoxicity | 1.074% | 2.400% | 0.001% | 0.000% |
| Freshwater ecotoxicity | 1.028% | 2.365% | 0.001% | 0.027% |
| Marine ecotoxicity | 1.090% | 2.291% | 0.001% | 0.031% |
| Carcinogenic human toxicity | 2.127% | 0.275% | 0.001% | 0.363% |
| Non-carcinogenic human toxicity | 0.746% | 2.816% | 0.001% | 0.003% |
| Land use | 0.003% | 3.333% | 0.000% | 0.000% |
| Mineral resource scarcity | 2.067% | 1.399% | 0.001% | 0.000% |
| Fossil resource scarcity | 0.972% | 2.552% | 0.001% | 0.001% |
| Water consumption | 0.376% | 3.045% | 0.054% | 0.000% |
Disclaimer/Publisher’s Note: The statements, opinions and data contained in all publications are solely those of the individual author(s) and contributor(s) and not of MDPI and/or the editor(s). MDPI and/or the editor(s) disclaim responsibility for any injury to people or property resulting from any ideas, methods, instructions or products referred to in the content. |
© 2023 by the authors. Licensee MDPI, Basel, Switzerland. This article is an open access article distributed under the terms and conditions of the Creative Commons Attribution (CC BY) license (https://creativecommons.org/licenses/by/4.0/).
Share and Cite
Zhao, Y.; Ren, K.; Huang, W. Which Is More Environmentally Friendly? A Comparative Analysis of the Environmental Benefits of Two Waste-to-Energy Technologies for Plastics Based on an LCA Model. Sustainability 2023, 15, 8209. https://doi.org/10.3390/su15108209
Zhao Y, Ren K, Huang W. Which Is More Environmentally Friendly? A Comparative Analysis of the Environmental Benefits of Two Waste-to-Energy Technologies for Plastics Based on an LCA Model. Sustainability. 2023; 15(10):8209. https://doi.org/10.3390/su15108209
Chicago/Turabian StyleZhao, Yumeng, Kai Ren, and Wenfang Huang. 2023. "Which Is More Environmentally Friendly? A Comparative Analysis of the Environmental Benefits of Two Waste-to-Energy Technologies for Plastics Based on an LCA Model" Sustainability 15, no. 10: 8209. https://doi.org/10.3390/su15108209