Abstract
Consumer behavior is an important area for the tourism sector that needs to be continuously explored. Tourism is a sensitive sector influenced by several factors, like pandemics, government intervention, international cooperation, etc. The tourist industry is rapidly expanding, influenced by social media and digital marketing, which act as influencers. The current study investigates the association between travel website quality and customer satisfaction to lead to purchase intention. The research undertook a statistical path analysis of feedback from 500 frequent flyers, who use travel websites for international travel. SmartPLS 4.0 was applied to prepare a structural equation model by partial least squares. The study indicates that the caliber of travel websites is linked to customers’ satisfaction, which, in turn, impacts their intention to make a purchase.
1. Introduction
Websites showcase a range of e-commerce industries, including insurance, consumer electronics, travel, health care, and food. Websites play an important role in quickly connecting business to consumer (B2C), with the flexibility of time and place. Customers of B2C websites benefit most from the Internet because it is relatively inexpensive to get reliable information. Therefore, understanding how consumers use information is essential to the success of B2C websites. Websites may help consumers decide what to buy, where to buy it, and whether to do an online transaction [1]. The Internet serves as a communication platform for the sharing of information. Thus, the information hub helps most B2C businesses that operate online to offer information quantitatively and qualitatively that is intended for customer satisfaction to make better decisions leading to customer loyalty and purchase intentions.
Information and communication technologies (ICTs) have played a major role in the development and growth of the tourism industry [2,3,4]. Tourism performance is a significantly important index for gauging tourism development [5]. One of the most important elements in keeping a travel business alive is web design for tourist firms. The tourism sector has undergone a recent debacle due to recent pandemics across the globe [6]. Several travel operators suffered severe financial losses due to international travel restrictions during the recent two-year-long pandemic [7]. Many travel operators closed their businesses, and many of them switched to other sectors. The travel sector is steadily picking up pace as normalcy is reinstated globally. Digital marketing and social media play a significant role in boosting the travel business. Apart from this, customer behavior also significantly influences the travel business, as customer purchase intention is influenced by several factors. One such factor is the quality of the travel website, which influences customer behavior and leads to purchase intention. Web analytics play a significant role in understanding the website visitor’s behavior. Web analytics may contain visitors’ tracking, website usage, and measurement of web activity through reviewing and reporting visitor data. Web analytics gives crucial information on website visitors’ decisions to visit, different web page pictures, and uploaded videos [8].
The study on consumer behavior in tourism revealed the key research gap in studying the hedonic and affective aspects of tourism [9]. Figure 1 shows the tourism expansion model. Various concepts, influences, and research contexts prevail in the sector and may be explored to expand the tourism sector by enhancing the e-value experience of travel website users. Tourism operators may adopt various strategy formulations to increase tourism business. A travel website’s quality may differ in providing usability, flexibility, visibility, and agility dimensions to motivate website visitors to revisit the webpage and motivate their purchase intention.
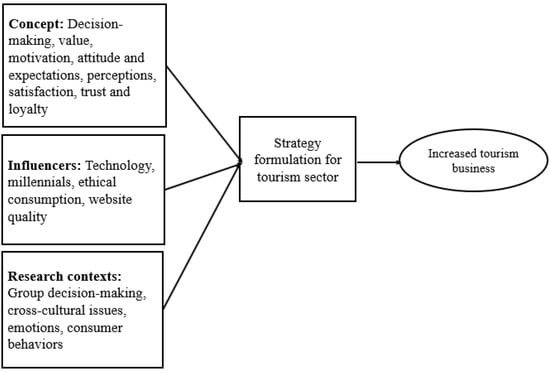
Figure 1.
Tourism expansion model.
When comparing traditional tourism to e-tourism, the website is a crucial sales tool in digital marketing [10,11]. One of the exploratory studies on travel website quality derived eight evaluation attributes using the AIDA model. The exploratory study further used Weka, an open-source data mining software, to create decision trees to analyze the datasets from a web-based experiment [11].
Based on the above premises, it is significant to answer the following research questions: What is the influence of various attributes like website design, website information, website interaction, and website usefulness on website quality? What is the influence of website quality on satisfaction? How does satisfaction lead to purchase intention? What is the association between satisfaction and loyalty? How does loyalty lead to purchase intention?
The present research employs SmartPLS 4.0 to prepare a structural equation model by partial least squares and carry out the path analysis. With the help of an empirical survey, it has been concluded that first-time visitors to travel and tourism websites look for more and more information and attempt to get a leisurely feeling. It has been further revealed that first-time visitors are reluctant to use the website; hence a website revisit is mandatory for purchase intentions [8].
The present research is further documented as follows: Section 2 presents a comprehensive review of travel website quality and the building of research hypotheses. Section 3 guides the adopted research approach in empirical analysis and the structural relationship model. Various significant findings revealed through the present study are documented in the following section. In Section 5, the proposed model’s outcomes are discussed. Section 6 includes limitations and future directions for carrying out the research. The paper provides the conclusion in Section 7.
2. Literature Review
In tourism organizations, web design has emerged as one of the most important elements in sustaining a travel business [11]. Website quality plays a major role in customer satisfaction and continuance usage. Several researchers have attempted to evaluate website quality in various fields [12,13,14]. Website quality was assessed using WebQual™, SERVQUAL, and developing measuring indicators. Another study developed the DISCERN indicators to evaluate web quality and investigated Google PageRank as a website quality indicator and user satisfaction [15]. A website quality metric called WebQualTM was created with the four constructs of utility, usability, enjoyment, and complementary relationships, each of which has twelve dimensions [16]. They considered usefulness (informational fit-to-task, interactivity, trust, response time), ease of use (ease of understanding and intuitive operations), entertainment (visual appeal, innovativeness, flow-emotional appeal), and complementary relationships (consistent image, online completeness, better than alternative channels). The WebQual Index of website quality was developed using quality function deployment (QFD) to ascertain the voice of the customer [17]. Research investigating the effect of site quality, information quality, interaction quality, and airline-specific quality of the airline website quality was carried out using the metric for measuring the quality of airline websites (PAWQI) [18].
A scoring framework based on the analytic hierarchy process (AHP) with a total of 29 criteria and subcriteria was used in assessing the 3 websites of cellular phone service providers using the respondent feedback of 122 Greek users [19]. A total of 156 online customers and 34 employees of e-business companies provided respondent feedback, which was used in an AHP to examine the impact of website quality on business success [20]. Their study revealed that the highest-quality websites yielded the highest business performance. Researchers discovered that the quality of websites affects user satisfaction and trust after collecting input from 656 online customers of Taiwanese securities businesses [21]. They further concluded that the informational value of the website is the most important factor in creating long-lasting connections. A positive relationship is influenced by the system quality of the website and the service quality.
The hospital website’s service quality was assessed [22]. Another study reported that website quality has a positive association with purchase intention while influencing product quality. Website quality, signal credibility, and product asymmetries of information were found to influence the perceived product quality and enhance the intention to purchase from the website [23]. The study further revealed the positive influence of the website quality dimensions (visual appeal, security, download delay, navigability) on the website quality and perceived product quality.
Several studies in the past have been found to model website quality for customer satisfaction. The mediating effect of website quality on Internet searching behavior among Internet users was investigated considering three dimensions of Internet attitudes, website quality (system quality, service quality, and information quality), and Internet searching behavior [24]. They further reported that website quality plays a significant role in online behavior, such as information seeking. The study by Dragulanescu evaluated website quality to confirm the expectations of needs and requirements using eight dimensions: accuracy, authority, coverage, currentness, density, interactivity, objectivity, and promptness [25]. They also discovered favorable relationships between customer happiness and informational fit-to-task, transaction capacity, and response speed. The overall impressions and likelihood of revisits decide the web’s effectiveness [26].
2.1. Website Quality–Satisfaction–Loyalty–Purchase Intention Model
- Website design
Having a well-designed website can help you find the information you need fast. Web visitors are given the necessary website usability due to the website’s quality design and content. Website design involves a systematic approach to structuring the required information in terms of adequate content and completing relevant information to suit the visitors’ needs. The website’s design also provides graphics. The use of graphics will enhance the aesthetics of the website. Website design leads to the perception of website satisfaction. According to the study, there are no discernible variations in e-loyalty users’ perceptions of website design and satisfaction [27]. Furthermore, it has been reiterated that one of the key elements influencing repeat visits is web content [26]. The Internet has become a significant marketing channel for tourist destinations [28].
- Website information
The presentation of information is crucial to conveying its meaning and achieving successful delivery [29]. An effective website design may contain ergonomic and cognitive concerns while designing website icons and menus to deliver user-friendliness, ease of use, and appeal [30]. Website information is one of the most crucial factors considered while evaluating the value of a travel website. In evaluating the quality of the website, the ease of use, flexibility in the reservation, and personalization are considered. Travel website quality also influences the travel business and collects more business [11].
- Website interaction
A website interaction is any movement, exchange of information, or other action between a user and the website. Interaction takes place when a user clicks on anything to proceed, watches a video, comments on a post, offers feedback, or accesses internal links. Easy website interaction involves the visitors with travel website usage and leads to website quality [11]. Information sharing is one of the motivations for using website services [31].
- Website usefulness
One of the biggest benefits of having a good website usefulness is that anyone, anywhere, may access it at any time. One of the important components of website usefulness is its accessibility outside office hours; thus, it also helps increase business. It has been demonstrated that factors related to perceived website usefulness and website satisfaction have a large and direct impact on online shoppers’ loyalty [32].
- Website quality
It reflects users’ general opinions on how well a website functions and appears, especially compared to other websites [33]. Brand perceptions are influenced by the quality of websites [34]. The perceived product quality and website quality are positively correlated, which increases the purchase probability on the website [23]. The three basic criteria for measuring the quality of a website are its content, services, and technological capabilities [29].
- Website satisfaction
According to Anderson and Srinivasan, the definition of e-satisfaction is the customer’s satisfaction with previous experience during purchasing with a certain online retailer [35]. Customer loyalty and purchasing intent may increase because of customer satisfaction. Travel website satisfaction may be accomplished by providing prompt services with a smart design. According to findings, website usability affects user happiness, which in turn affects their intent to use [36].
- Loyalty
Zeithaml et al. defined customer loyalty as the desire to continue doing business with a certain company [37]. Numerous cross-sectional studies have demonstrated that customer happiness with a good purchasing experience and perceived website utility have a significant impact on loyalty [38]. Tourist operators are keen to improve their website capabilities to fulfill user requirements and expectations to lure customers into revisiting at a later stage [39]. Good website quality leads to satisfaction and leads to loyalty; visitors’ loyalty helps in the travel business’s survival and growth. Additionally, a change in satisfaction has a stronger impact on a change in loyalty. Undergoing a psychological evaluation process, travel website visitors become loyal over time and undergo purchase experience [40]. With repeated purchases from customers, loyalty grows over time [41].
- Purchase intention
Customers are more inclined to return to a website if they like it [26]. Purchase intent, commonly referred to as buyer intention, refers to a customer’s willingness and inclination to purchase a product or service within a specified time frame. Valid metrics for assessing the quality of travel-related website designs include service quality, information quality, and system quality [42]. Additionally, the attitudes of travelers, customer happiness, and the effectiveness of the design of the travel website all significantly influence passengers’ intentions to make a transaction. A thorough analysis of the literature indicated that many scales were used to rate the website’s quality, as shown in Table 1.

Table 1.
Website-quality assessing scales.
The present study proposes to use four travel quality attributes, i.e., design, information, interaction, and usefulness, to measure the travel website quality. The association of four quality attributes towards website quality for tourist satisfaction leads to loyalty. Satisfaction also leads to purchase intention, as shown in Figure 2.
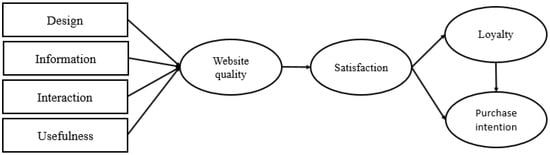
Figure 2.
Website quality–satisfaction–loyalty–purchase intention model.
From the conceptual model, the following hypotheses are derived:
H1.
Website quality has a positive influence on satisfaction.
H2.
Website satisfaction has a positive influence on loyalty.
H3.
Website satisfaction has a positive influence on purchase intention.
H4.
Website loyalty has a positive influence on purchase intention.
2.2. Attributes Contributing to Travel Website Quality
The travel website quality consists of several attributes influencing the website quality. Website design, website information, website interaction, and website usefulness are considered in the present research to contribute to website quality. Website design refers to the way content is displayed and plays a major role in information exchanges in an effective manner. A good website design lures the web surfer to revisit the website. The design parameters play an important role in website design [48]. The various design parameters or specification of content (picture, text, layout, graphics, sounds, etc.), and the way they are displayed on the website refers to its design and plays a major role in the repeat visits of its user [26]. A website design consists of eye-catching content that sometimes may not upload relevant information; hence, the website information is also significant in deciding the website quality. The relevant and correct website information in a precise manner may invite the web visitor to spend more time, which may influence the end result. Website information must be sufficient to satisfy the information seeker and should not be in abundance. Web developers should concentrate more on website information and provide precise, accurate, and correct amounts of information along with several visual elements in good alignment with website design [28]. A website interaction refers to the communication exchange between the website and the user. The website design must support the website interaction requiring unnecessary clicks for opening and closing of menu and submenus. The website interaction helps move users further to the required destination on the web page. Website usefulness is also one of the important attributes that constitute website quality. The website’s usefulness is also responsible for the dominance of tourists at a particular destination [49]. The travel website quality derives customer satisfaction and leads to loyalty and purchase intention.
Researchers and experts try to determine whether the travel website quality invites the customer to return and opt for purchase intention. A thorough assessment of the literature has shown that more research is needed to determine the connection between travel website quality and user loyalty and subsequent purchase intentions. Numerous studies have sought to assess travel website quality and its relationship with satisfaction, loyalty, and purchase intention. Table 2 provides such attempts in the past.
Table 2.
Research on travel-website quality in the recent past.
3. Research Methodology
3.1. Measurement Scales
An online poll was conducted o evaluate the travel website quality leading to satisfaction and loyalty and purchase intentions. Only respondents who had used the travel website for their traveling were considered for the survey. To measure the items for all the constructs, a five-point Likert scale was used where 1 represents “strongly disagree” and 5 “strongly agree”. The scales were adapted from established scales, and in the context of travel website quality, the item’s wording was altered. The scale filtering process was attempted by eliminating items from a reflective multi-item scale [53]. The filtering process enhanced the measurement properties of reflective scales. The exploratory factor analysis (EFA) results led to a change in the 28 items survey to 24 items.
3.2. Sampling
The filtered question was used to select the respondents who used online travel operator services through their websites. The questionnaire was circulated through personal contacts, and a social media platform was used for collecting the responses. The questionnaire was sent in early December 2022. The feedback was collected from various sources at the beginning of February 2023. The respondents were also reminded in between to expedite the feedback.
3.3. Data Collection
Data collection was carried out from December 2022 until January 2023. A total of 750 people were solicited for participation; however, only 520 responded to the participation call. Finally, 500 valid samples were found and included in the analysis to provide the 67% response rate. There were two reasons for excluding the responses (1) the standard deviations of the items were zero, i.e., all the items had the same response, which indicates that the respondent was not serious about filling out the questionnaire, and (2) the questionnaire was incomplete.
3.4. Data Analysis and Model Testing
An analysis consisting of two stages was completed. In the initial step, the validity of convergent, discriminant, and reliability was examined. SPSS 23.0 was used to carry out various statistical analyses. In the final stage, Smart PLS 4.0 was used to derive the structural model. The reasons for choosing Smart PLS for the analysis were that the data violated the assumption of normality. PLS is a modeling technique well-suited for model constructs that are either formative, reflective, or even mixed models [54]; also, PLS-SEM is preferred over AMOS as it gives results for small sample sizes [55]. Apart from the used SEM software, another popular software for measuring structural equation modeling is AMOS. It is the covariance-based technique used mainly when the model constructs are primarily reflective and possess large data sizes. Further, it is also appropriate for research where the goal of the analysis is to verify relationships based on theories [54].
4. Results
4.1. Sample Characteristics
The respondent ratio consisted of 60.00% and 40.00% for male and female respondents, respectively. Most of the samples, about 92.00%, came from responders who were under 40 years old. The respondents’ demographic information is tabulated in Table 3.
Table 3.
Demographic information.
According to the demographic information, employees make up 31.8% of the respondents, followed by business professionals and graduate students. The survey item responses are shown to have a mean value higher than 3.0 and a larger standard deviation value greater than 0.8. If the standard deviation is high, there is a wide range of values represented by the data points [56,57,58]. The variable’s mean and standard deviations as well as the items used in the analysis, are tabulated in Table 4.
Table 4.
Descriptive statistics analysis.
4.2. Exploratory Factor Analysis
To investigate the causal relationships between the variables, principal component analysis (PCA) was performed. The extraction method for factor analysis has been the principal component analysis method. When extracting the factors, Eigenvalues greater than 1 were considered. A total of 8 factors accounted for 78.13% of the variance.
The Kaiser–Meyer–Olkin (KMO) test was run to determine how well the data would lend themselves to factor analysis. Sampling is appropriate when KMO values are between 0.8 and 1. Since the KMO value for the analysis was 0.862, it can be said that the sample was sufficient. Bartlett’s test of sphericity’s small significance level value of <0.05 suggests that the data would benefit from factor analysis. Table 5 presents the findings.
Table 5.
Principal component analysis.
4.3. Confirmatory Factor Analysis
Individual observed variables with weights below the standardized regression threshold of 0.7 were eliminated during the confirmatory factor analysis. The squared multiple correlations must be less than 0.4 [59] to reach a high level of fitness. There was high multicollinearity between reliability, responsiveness, assurance, and empathy, which are associated with website quality. Hence all the variables were loaded on the website and were treated as one construct. An analysis based on the criteria of construct reliability of over 0.7 and average variance extracted (AVE) of over 0.5 was carried out to evaluate reliability and validity. The results are shown in Table 6. The findings revealed that each variable’s AVE was higher than 0.5. Construct reliability was determined to be more than 0.7 for all variables. Additionally, the number of linkages among observed independent variables as measured by the AVE of discriminant validity was higher than the squared correlation of each factor; Consequently, it can be said that the factors’ discriminant validity was not compromised [54].
Table 6.
Reliability of constructs.
4.4. High-Order Confirmatory Factor Analysis
The travel website quality model is a high-order component of the second-order factor model. In this study, four lower-order factors—design, information, interaction, and usefulness—were used instead of the second-order model’s intention to quantify travel purchase intentions. The goodness-of-fit measurements were derived. The structural model’s overall fitness indicators were satisfactory (2 = 194.7, p < 0.000, 2/df = 1.54, GFI = 0.94, CFI = 0.97, RMSEA = 0.056). The dimensional structure also met the requirement [60]. The results of the analysis utilized the reflective indicator acquiring nomological validity, which can connect certain constructs. Lower-order factor variables were measured, and items were added to the high-order factor analysis. Figure 3 presents the SEM obtained in the present empirical investigation of travel website quality.
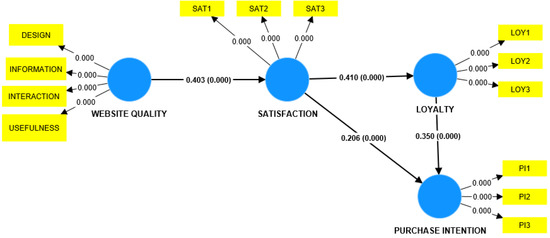
Figure 3.
Structural equation model.
4.5. Reliability and Validity (Measurement Model)
Table 6 lists the average variance extracted (AVE), composite reliability, and Cronbach’s alpha α (reliability). Cronbach alphas for each variable ranged from 0.724 to 0.861. The latent construct’s CR value was within the recommended range of 0.735 to 0.868, falling in this range. The results can be used to verify the questionnaire’s validity and internal consistency. The measuring model was evaluated using the concept of construct validity. In every case, AVE was >0.5, ranging from 0.511 to 0.783 [61].
It was further found that there was no issue with discriminant validity. The correlation between each pair of constructs was less than the square root of AVE. The same is described in Table 7. All the constructs were found reliable, meeting the threshold limits. The constructs’ validity was also verified. The necessary conditions were also satisfied for the measurement model [62].
Table 7.
Fornell-Larcker criterion.
The results obtained are documented in Table 8. The result confirms that all the hypotheses are statistically supported and therefore accepted.
Table 8.
Hypothesis results.
5. Discussion
The digital revolution in information systems has helped many business owners expand their enterprises multifold. The website has played a major role in business-to-consumer (B2C) connections during office hours and beyond. Travel operators have to utilize a variety of business tactics, such as good-quality information and lower profit margins, to grow their business. Good travel website quality attracts tourists and provides them with the necessary satisfaction to help in their purchase intentions. As a result, new travel agents entered the tourism industry because of the rising demand from tour operators. A tour operator or travel agent adopts a travel website as the business channel that operates with a marginally higher initial investment but a lower running cost. As a result, their customer base and profit margin are growing.
A slight conflict in a business transaction causes tourists to move to a new travel service provider; therefore, the growing number of travel operators also presents a challenge for travel service providers. Therefore, tour operators need to comprehend consumer loyalty, behavior, and purchasing intentions. To ensure that every visitor to the website is completely satisfied, they must also understand how the website’s quality dimensions affect the website user’s purchase intentions. Assurance, empathy, dependability, and responsiveness are the basic dimensions that fulfill the website quality aspects and play a crucial part in ensuring that users of travel websites are satisfied. Travel websites need to be created in a way that provides the most crucial information to visitors.
The study examined four major attributes of website quality, i.e., website design, website information, website interaction, and website usefulness. Website design is one of the significant attributes considered for website quality. It also lures the visitor to repeat visits. It has been well established that good website design and website content invite the web surfer for a repeat visit [26,63]. The website design parameters depend upon its type and may be determined using the interactions of users with the webpage [48]. The website’s usefulness helps the website visitors in decision-making; hence, it is one of the important attributes of website quality [49].
The present study confirms the positive association of the quality dimension of travel websites with user satisfaction. The result obtained is in line with the past study examining the association between website usefulness and satisfaction [38]. The satisfaction acquired from the travel website quality dimension further provides loyalty and purchase intentions. The satisfaction derived from the website quality attributes drives the website users towards loyalty, which is in line with the results of past studies revealing the association between satisfaction and loyalty [64]. The present research derives the influence of website quality on customer satisfaction and leads to purchase intention, which is in line with the past study [65].
These two outcomes of loyalty and purchase intentions also encourage tour operators to adopt suitable business practices. Tour operators may also look for the long-term sustainability of travel destinations leading to enhanced travel business using website quality as a decision-making tool. To provide real-time solutions, the tour operators must also maintain a dynamic website. Once a website adds more value-based information and demonstrates its commitment to keeping its promises when a customer purchases its services, a website of this caliber will attract more visitors. The study revealed that website usability significantly affects consumer behavior leading to purchase intentions. More specifically, it has been discovered that website visitor satisfaction is directly influenced by website usability.
6. Limitations and Directions for Future Research
The current study focused on tourists from Saudi Arabia and examined the influence of travel website characteristics on visitors’ purchasing intentions. With some exceptions, the results of the present investigation may be generalized if similar studies are conducted in different parts of the world. The purchasing intention inferred from travel website quality dimensions may also vary considering an individual’s living standard, earnings, and level of computer knowledge.
Therefore, considering the differences in cultures and societal and business cultures, comparative research may be conducted. The present research uses the data gathered from two sources, i.e., Saudi travel operators and their users. Thus, the feedback of the respondents mostly reflects the quality of the Saudi tour operators’ websites. Future research may look at other website quality factors that contribute to the explanation of additional variances in consumer behavior and satisfaction leading to purchase intention. The future study may also examine the tour operators’ influence on the long-term sustainability of travel destinations using SEM.
7. Conclusions
The present study examines the influence of various attributes of website quality like website design, website information, website interaction, and website usefulness on website quality and reveals a positive association of these attributes toward website quality. Website quality leads to satisfaction. Satisfaction leads to loyalty and purchase intention. The website’s high quality benefits the travel industry. The website’s quality in terms of assurance, empathy, reliability, and responsiveness influences satisfaction, leading to loyalty and purchase intention. The travel website’s design and launch need more investments, which poses a dilemma for small tour operators. Thus, the current study aids in understanding how travel businesses might make the most of their limited resources for website creation. They can build a useful and functional website that addresses sustainability issues and consumer needs. The travel operator may come up with a plan to rank and manage the four aspects of a travel website’s quality to increase visitor satisfaction and subsequent purchase intent. The quality of the travel website must be able to provide relevant, significant information in the most flexible way to meet customer needs. Thus, a viable plan to meet the travel website quality requirements may be realized using the website quality dimensions.
Funding
This research was funded by the Deanship of Scientific Research, King Khalid University, Kingdom of Saudi Arabia, and the grant number is RGP.1/382/43.
Institutional Review Board Statement
Not Applicable.
Informed Consent Statement
Not Applicable.
Data Availability Statement
Not Applicable.
Acknowledgments
I would like to express my gratitude to the Deanship of Scientific Research, King Khalid University, Kingdom of Saudi Arabia, for funding this work, as well as to family, friends, and colleagues for their constant inspiration and encouragement.
Conflicts of Interest
The authors declare no conflict of interest.
References
- Montoya-Weiss, M.M.; Voss, G.B.; Grewal, D. Determinants of Online Channel Use and Overall Satisfaction with a Relational, Multichannel Service Provider. J. Acad. Mark. Sci. 2003, 31, 448–458. [Google Scholar] [CrossRef]
- Maurer, C. Digital Marketing in Tourism. In Handbook of e-Tourism; Springer International Publishing: Cham, Switzerland, 2021; pp. 1–24. [Google Scholar] [CrossRef]
- Deb, S.K.; Nafi, S.M.; Valeri, M. Promoting Tourism Business through Digital Marketing in the New Normal Era: A Sustainable Approach. Eur. J. Innov. Manag. 2022; ahead-of-print. [Google Scholar] [CrossRef]
- Priatmoko, S.; David, L.D. Winning tourism digitalization opportunity in the indonesia cbt business. Geoj. Tour. Geosites 2021, 37, 800–806. [Google Scholar] [CrossRef]
- Zhou, Q.; Zhu, K.; Kang, L.; Dávid, L.D. Tea Culture Tourism Perception: A Study on the Harmony of Importance and Performance. Sustainability 2023, 15, 2838. [Google Scholar] [CrossRef]
- Skryl, T.V.; Gregoric, M. Tourism in the Post-COVID Age. In Post-COVID Economic Revival, Volume II; Springer International Publishing: Cham, Switzerland, 2022; pp. 239–254. [Google Scholar] [CrossRef]
- Klinsrisuk, R.; Pechdin, W. Evidence from Thailand on Easing COVID-19′s International Travel Restrictions: An Impact on Economic Production, Household Income, and Sustainable Tourism Development. Sustainability 2022, 14, 3423. [Google Scholar] [CrossRef]
- Mandal, S.; Roy, S.; Raju, A.G. Exploring the Role of Website Attractiveness in Travel and Tourism: Empirical Evidence from the Tourism Industry in India. Tour. Plan. Dev. 2017, 14, 110–134. [Google Scholar] [CrossRef]
- Cohen, S.A.; Prayag, G.; Moital, M. Consumer Behaviour in Tourism: Concepts, Influences and Opportunities. Curr. Issues Tour. 2014, 17, 872–909. [Google Scholar] [CrossRef]
- Chaiprasit, K.; Jariangprasert, N.; Chomphunut, A.; Naparat, D.; Jaturapataraporn, J. Tourist Expectations toward Travel and Tourism Websites in Thailand. Int. Bus. Econ. Res. J. (IBER) 2011, 10, 41–50. [Google Scholar] [CrossRef]
- Sun, P.; Cárdenas, D.A.; Harrill, R. Chinese Customers’ Evaluation of Travel Website Quality: A Decision-Tree Analysis. J. Hosp. Mark. Manag. 2016, 25, 476–497. [Google Scholar] [CrossRef]
- Abu Jadayil, W.; Shakoor, M.; Bashir, A.; Selmi, H.; Qureshi, M.R.N.N. Using SERVIQUAL to Investigate the Quality of Provided Wireless Communication Services in UAE. Int. J. Qual. Serv. Sci. 2020, 12, 109–132. [Google Scholar] [CrossRef]
- Talib, F.; Rahman, Z.; Qureshi, M.N. Total Quality Management in Service Sector: A Literature Review. Int. J. Bus. Innov. Res. 2012, 6, 259. [Google Scholar] [CrossRef]
- Talib, F.; Rahman, Z.; Qureshi, M.N. Prioritising the Practices of Total Quality Management: An Analytic Hierarchy Process Analysis for the Service Industries. Total Qual. Manag. Bus. Excell. 2011, 22, 1331–1351. [Google Scholar] [CrossRef]
- Griffiths, K.M.; Christensen, H. Website Quality Indicators for Consumers. J. Med. Internet Res. 2005, 7, e55. [Google Scholar] [CrossRef] [PubMed]
- Loiacono, E.T.; Watson, R.T.; Goodhue, D.L. WebQual: A Measure of Website Quality. Mark. Theory Appl. 2002, 13, 432–438. [Google Scholar]
- Barnes, S.; Vidgen, R. WebQual: An Exploration of Website Quality. In Proceedings of the 8th European Conference on Information Systems, Trends in Information and Communication Systems for the 21st Century, ECIS 2000, Vienna, Austria, 3–5 July 2000. [Google Scholar]
- Shchiglik, C.; Barnes, S.J. Evaluating Website Quality in the Airline Industry. J. Comput. Inf. Syst. 2004, 44, 17–25. [Google Scholar] [CrossRef]
- Moustakis, V.; Litos, C.; Dalivigas, A.; Tsironis, L. Website Quality Assessment Criteria. In Proceedings of the Ninth International Conference on Information Quality (ICIQ-04), Cambridge, MA, USA, 5–7 November 2004; pp. 59–73. [Google Scholar]
- Lee, Y.; Kozar, K.A. Investigating the Effect of Website Quality on E-Business Success: An Analytic Hierarchy Process (AHP) Approach. Decis. Support Syst. 2006, 42, 1383–1401. [Google Scholar] [CrossRef]
- Liang, C.-J.; Chen, H.-J. A Study of the Impacts of Website Quality on Customer Relationship Performance. Total Qual. Manag. Bus. Excell. 2009, 20, 971–988. [Google Scholar] [CrossRef]
- Ali, F. Hotel Website Quality, Perceived Flow, Customer Satisfaction and Purchase Intention. J. Hosp. Tour. Technol. 2016, 7, 213–228. [Google Scholar] [CrossRef]
- Wells, J.D.; Valacich, J.S.; Hess, T.J. What Signal Are You Sending? How Website Quality Influences Perceptions of Product Quality and Purchase Intentions. MIS Q. 2011, 35, 373. [Google Scholar] [CrossRef]
- Ho, L.-A.; Kuo, T.-H.; Lin, B. The Mediating Effect of Website Quality on Internet Searching Behavior. Comput. Hum. Behav. 2012, 28, 840–848. [Google Scholar] [CrossRef]
- Dragulanescu, N.-G. Website Quality Evaluations: Criteria and Tools. Int. Inf. Libr. Rev. 2002, 34, 247–254. [Google Scholar] [CrossRef]
- Rosen, D.E.; Purinton, E. Website Design. J. Bus. Res. 2004, 57, 787–794. [Google Scholar] [CrossRef]
- Cyr, D.; Bonanni, C. Gender and Website Design in E-Business. Int. J. Electron. Bus. 2005, 3, 565. [Google Scholar] [CrossRef]
- Luna-Nevarez, C.; Hyman, M.R. Common Practices in Destination Website Design. J. Destin. Mark. Manag. 2012, 1, 94–106. [Google Scholar] [CrossRef]
- Rocha, Á. Framework for a Global Quality Evaluation of a Website. Online Inf. Rev. 2012, 36, 374–382. [Google Scholar] [CrossRef]
- De Marsico, M.; Levialdi, S. Evaluating Web Sites: Exploiting User’s Expectations. Int. J. Hum. Comput. Stud. 2004, 60, 381–416. [Google Scholar] [CrossRef]
- Cavusoglu, H.; Phan, T.Q.; Cavusoglu, H.; Airoldi, E.M. Assessing the Impact of Granular Privacy Controls on Content Sharing and Disclosure on Facebook. Inf. Syst. Res. 2016, 27, 848–879. [Google Scholar] [CrossRef]
- Kim, D.J.; Ferrin, D.L.; Rao, H.R. Trust and Satisfaction, Two Stepping Stones for Successful E-Commerce Relationships: A Longitudinal Exploration. Inf. Syst. Res. 2009, 20, 237–257. [Google Scholar] [CrossRef]
- McKnight, D.H.; Choudhury, V.; Kacmar, C. Developing and Validating Trust Measures for E-Commerce: An Integrative Typology. Inf. Syst. Res. 2002, 13, 334–359. [Google Scholar] [CrossRef]
- Lowry, P.B.; Vance, A.; Moody, G.; Beckman, B.; Read, A. Explaining and Predicting the Impact of Branding Alliances and Web Site Quality on Initial Consumer Trust of E-Commerce Web Sites. J. Manag. Inf. Syst. 2008, 24, 199–224. [Google Scholar] [CrossRef]
- Anderson, R.E.; Srinivasan, S.S. E-Satisfaction and e-Loyalty: A Contingency Framework. Psychol. Mark. 2003, 20, 123–138. [Google Scholar] [CrossRef]
- Belanche, D.; Casaló, L.V.; Guinalíu, M. Website Usability, Consumer Satisfaction and the Intention to Use a Website: The Moderating Effect of Perceived Risk. J. Retail. Consum. Serv. 2012, 19, 124–132. [Google Scholar] [CrossRef]
- Zeithaml, V.A.; Berry, L.L.; Parasuraman, A. The Behavioral Consequences of Service Quality. J. Mark. 1996, 60, 31–46. [Google Scholar] [CrossRef]
- Pee, L.; Jiang, J.; Klein, G. E-Store Loyalty: Longitudinal Comparison of Website Usefulness and Satisfaction. Int. J. Mark. Res. 2019, 61, 178–194. [Google Scholar] [CrossRef]
- Cyr, D.; Hassanein, K.; Head, M.; Ivanov, A. The Role of Social Presence in Establishing Loyalty in E-Service Environments. Interact. Comput. 2007, 19, 43–56. [Google Scholar] [CrossRef]
- Toufaily, E.; Ricard, L.; Perrien, J. Customer Loyalty to a Commercial Website: Descriptive Meta-Analysis of the Empirical Literature and Proposal of an Integrative Model. J. Bus. Res. 2013, 66, 1436–1447. [Google Scholar] [CrossRef]
- Keiningham, T.L.; Aksoy, L.; Malthouse, E.C.; Bouye, A.; Lariviere, B. The Cumulative Effect of Transaction-Specific Satisfaction on Share of Wallet: A Longitudinal Investigation. In Advances in Advertising Research (Vol. III); Springer: Berlin/Heidelberg, Germany, 2012; pp. 381–390. [Google Scholar]
- Wen, I. An Empirical Study of an Online Travel Purchase Intention Model. J. Travel Tour. Mark. 2012, 29, 18–39. [Google Scholar] [CrossRef]
- Ahmad, A.; Rahman, O.; Khan, M.N. Exploring the Role of Website Quality and Hedonism in the Formation of E-Satisfaction and e-Loyalty. J. Res. Interact. Mark. 2017, 11, 246–267. [Google Scholar] [CrossRef]
- Suryani, T.; Fauzi, A.A.; Sheng, M.L.; Nurhadi, M. Developing and Testing a Measurement Scale for SMEs’ Website Quality (SMEs-WebQ): Evidence from Indonesia. Electron. Commer. Res. 2022. [Google Scholar] [CrossRef]
- Yoo, B.; Donthu, N. Developing a Scale to Measure the Perceived Quality of an Internet Shopping Site (SITEQUAL). Q. J. Electron. Commer. 2001, 2, 31–45. [Google Scholar]
- Barnes, S.J.; Vidgen, R.T. An Integrative Approach to the Assessment of E-Commerce Quality. J. Electron. Commer. Res. 2002, 3, 114–127. [Google Scholar]
- Parasuraman, A.; Zeithaml, V.A.; Malhotra, A. ES-QUAL: A Multiple-Item Scale for Assessing Electronic Service Quality. J. Serv. Res. 2005, 7, 213–233. [Google Scholar] [CrossRef]
- Cebi, S. Determining Importance Degrees of Website Design Parameters Based on Interactions and Types of Websites. Decis. Support Syst. 2013, 54, 1030–1043. [Google Scholar] [CrossRef]
- Woodside, A.G.; Mir, V.R.; Duque, M. Tourism’ s Destination Dominance and Marketing Website Usefulness. Int. J. Contemp. Hosp. Manag. 2011, 23, 552–564. [Google Scholar] [CrossRef]
- Pudliner, B.A. Alternative Literature and Tourist Experience: Travel and Tourist Weblogs. J. Tour. Cult. Chang. 2007, 5, 46–59. [Google Scholar] [CrossRef]
- Kwon, D.Y.; Jeong, S.R. A Content Analysis for Website Usefulness Evaluation: Utilizing Text Mining Technique. J. Internet Comput. Serv. 2015, 16, 71–81. [Google Scholar] [CrossRef]
- Holland, J.; Baker, S.M. Customer Participation in Creating Site Brand Loyalty. J. Interact. Mark. 2001, 15, 34–45. [Google Scholar] [CrossRef]
- Frohlich, M.T. E-Integration in the Supply Chain: Barriers and Performance. Decis. Sci. 2002, 33, 537–556. [Google Scholar] [CrossRef]
- Hair, J.F., Jr.; Sarstedt, M.; Ringle, C.M.; Gudergan, S.P. Advanced Issues in Partial Least Squares Structural Equation Modeling; Sage Publications: Thousand Oaks, CA, USA, 2017. [Google Scholar]
- Hair, J.F.; Ringle, C.M.; Sarstedt, M. PLS-SEM: Indeed a Silver Bullet. J. Mark. Theory Pract. 2011, 19, 139–152. [Google Scholar] [CrossRef]
- Qureshi, K.M.; Mewada, B.G.; Buniya, M.K.; Qureshi, M.R.N.M. Analyzing Critical Success Factors of Lean 4.0 Implementation in Small and Medium Enterprises for Sustainable Manufacturing Supply Chain for Industry 4.0 Using PLS-SEM. Sustainability 2023, 15, 5528. [Google Scholar] [CrossRef]
- Qureshi, K.M.; Mewada, B.G.; Kaur, S.; Qureshi, M.R.N.M. Assessing Lean 4.0 for Industry 4.0 Readiness Using PLS-SEM towards Sustainable Manufacturing Supply Chain. Sustainability 2023, 15, 3950. [Google Scholar] [CrossRef]
- Almakayeel, N.; Buniya, M.K.; Abubakar, A.S.; Kamil, S.M.; Qureshi, K.M.; Qureshi, M.R.N.M. Modelling the Construction Projects Implementation Barriers: A Structure Equation Modelling Approach. Buildings 2023, 13, 1223. [Google Scholar] [CrossRef]
- Yu, J.P. The Re-Examination of Conceptual Model Which Contains Control Variables in Structural Equation Modeling: Focusing on Power, Satisfaction and Long-Term Orientation. J. Channel Retail. 2015, 20, 43–62. [Google Scholar] [CrossRef]
- Blut, M.; Chowdhry, N.; Mittal, V.; Brock, C. E-Service Quality: A Meta-Analytic Review. J. Retail. 2015, 91, 679–700. [Google Scholar] [CrossRef]
- Gefen, D.; Straub, D. A Practical Guide to Factorial Validity Using PLS-Graph: Tutorial and Annotated Example. Commun. Assoc. Inf. Syst. 2005, 16, 5. [Google Scholar] [CrossRef]
- Hair, J.; Andreson, R.; Tatham, R.; Black, W. Multivariate Data Analysis, 5th ed.; Prentice-Hall Inc.: Hoboken, NJ, USA, 1998. [Google Scholar]
- Thielsch, M.T.; Hirschfeld, G. Facets of Website Content. Hum.–Comput. Interact. 2019, 34, 279–327. [Google Scholar] [CrossRef]
- Elkhani, N.; Soltani, S.; Bakri, A. An Effective Model for Evaluating Website Quality Considering Customer Satisfaction and Loyalty: Evidence of Airline Websites. Int. J. Comput. Sci. Issues 2013, 10, 109. [Google Scholar]
- Hsu, C.-L.; Chang, K.-C.; Chen, M.-C. The Impact of Website Quality on Customer Satisfaction and Purchase Intention: Perceived Playfulness and Perceived Flow as Mediators. Inf. Syst. E-Bus. Manag. 2012, 10, 549–570. [Google Scholar] [CrossRef]


Disclaimer/Publisher’s Note: The statements, opinions and data contained in all publications are solely those of the individual author(s) and contributor(s) and not of MDPI and/or the editor(s). MDPI and/or the editor(s) disclaim responsibility for any injury to people or property resulting from any ideas, methods, instructions or products referred to in the content. |
© 2023 by the author. Licensee MDPI, Basel, Switzerland. This article is an open access article distributed under the terms and conditions of the Creative Commons Attribution (CC BY) license (https://creativecommons.org/licenses/by/4.0/).