Article

E-Learning Behavior Categories and Influencing Factors of STEM Courses: A Case Study of the Open University Learning Analysis Dataset (OULAD)

1
College of Education, Zhejiang University of Technology, Hangzhou 310023, China
2
College of Computer Science and Technology, Zhejiang University of Technology, Hangzhou 310023, China
*
Author to whom correspondence should be addressed.
Sustainability 2023, 15(10), 8235; https://doi.org/10.3390/su15108235
Submission received: 21 April 2023 / Revised: 12 May 2023 / Accepted: 16 May 2023 / Published: 18 May 2023

Abstract

:
With a focus on enhancing national scientific and technological competitiveness and cultivating innovative talents, STEM education has achieved remarkable results in developing students’ core quality and improving academic achievement. Online courses built for STEM education have attracted many learners. However, as the number of learners continues to grow, online STEM education faces problems such as difficulties in ensuring the quality of teaching and learning in STEM online courses and poor performance of students in online learning. An in-depth exploration of the correlations between learners’ E-learning behavior categories and learning outcomes in STEM education online courses will facilitate teachers’ precise interventions for students who are learning online. This study first predicts the E-learning performance of STEM course learners through machine learning and deep learning algorithms, then uses factor analysis methods to discover correlations between behavioral features, uses the random forest algorithm to explore the vital behavioral features that influence the E-learning performance of STEM courses, and finally performs a category classification of important characteristic behaviors based on the learning behavior category basis. The results show that the learning behavior classifications of learning preparation behavior, knowledge acquisition behavior, and learning consolidation behavior affect the E-learning performance of learners in STEM courses. Moreover, a series of characteristic behaviors strongly affect E-learning performance. In general, teachers can systematically intervene in time for at-risk students from the perspective of learning behavior categories and further improve the construction of STEM online courses.

1. Introduction

With the development of emerging intelligent technologies such as the Internet of Things, big data, and artificial intelligence, the changing social occupational structure has increased the demand for new types of talent. STEM education has received widespread attention from the community as a vital way to respond to the challenges of careers in the intelligent age and to nurture innovative talent. The STEM education concept initially originated in the United States and is an acronym for science, technology, engineering, and mathematics [1]. STEM education is not a simple addition to the four disciplines of science, technology, engineering, and mathematics [2]. Based on real-world problem situations, it emphasizes the cross-fertilization of multiple subjects and uses the links between knowledge as the organizing content’s principle and basis [3]. STEM education breaks down subject area boundaries, enabling students to integrate multidisciplinary knowledge to transfer and innovate, broaden and deepen their understanding of the objective world, improve their ability to self-investigate and solve real-world problems, and ensure that they can meet the challenges of a new era.
The STEM course, the core of STEM education, is a vital means of promoting the implementation of STEM education and realizing the training of future talents. Many researchers are currently working to impel the development of high-quality STEM courses by analyzing case studies of STEM courses [4], pointing out the characteristics of the courses and the current state of construction, building models of interdisciplinary STEM courses [5], proposing measures to improve the quality of the courses, and studying the future development trends and supporting conditions for the development of the courses [6], providing valuable references for STEM education practice. The constant evolution of technology also offers more possibilities that further improve the quality of STEM education and promote equity in STEM education. Many online platforms offer STEM courses, which have attracted many users by breaking traditional courses’ time and space constraints; recordable learning processes; and rich learning resources. However, there are still problems with the poor quality of teaching and learning, lack of monitoring of the teaching process, and poor learning outcomes in STEM online courses. Even though many studies have been published in the field of learning achievement analysis and have shown positive results in improving learners’ online performance and optimizing course construction, there are still some limitations. Firstly, many studies have focused on building STEM courses offline, and there is less research on improving online learners’ learning performance in STEM courses. Secondly, when predicting learners’ online performance, only a single [7] or a few [8] E-learning behaviors are considered predictors, making it challenging to examine the key behaviors that influence learning performance comprehensively. The intrinsic links between learning behaviors, which do not exist independently of each other, are also ignored, and E-learning is a complex learning process. Finally, even though some studies have considered multiple E-learning behaviors and the intrinsic connections between them in terms of improving the predictive effect of learning performance [9], the proposed model for classifying E-learning behaviors still has limitations. As STEM courses focus on the overall quality of learners’ abilities and have particular characteristics, it is essential to study the learning behaviors of STEM course learners’ E-learning performance separately to find the learning behaviors and learning behavior categories that affect STEM course learners’ E-learning performance.
Addressing these limitations can help improve the E-learning performance of learners in STEM courses and point the way to improved teaching and learning in STEM courses. To this end, this study constructs a model for predicting learners’ E-learning performance and uncovers the learning behaviors and behavior categories that influence E-learning performance in STEM courses. The study focuses on the following three issues:
Are there significant differences in the learning performance of learners in STEM courses?
Can E-learning behavior data from STEM courses be used to predict and assess learners’ performance?
What are the essential learning behaviors and behavior categories that affect E-learning performance in STEM courses?
The paper consists of six subsections. The rest of this paper is organized as follows: Section 2 revolves around related research, focusing on methods and prediction models for E-learning performance prediction and the current state of research on E-learning behavior classification. Section 3 presents the experimental design framework. Section 4 describes in detail three experimental designs that explore differences in the E-learning performance of learners in STEM courses, validate the feasibility of E-learning behaviors for predicting learning performance, and identify effective learning behaviors and categories of learning behaviors that influence E-learning performance in STEM courses, and it describes the results of the experiments. The results of the experiments are analyzed and discussed in Section 5. Conclusions and future directions are presented in Section 6.

2. Research Review

With the rapid development and in-depth application of technologies such as big data, cloud computing, and artificial intelligence in education, E-learning is becoming a popular learning method for learners due to its rich resources, freedom of time and space, and variety of learning styles. However, learners often face problems such as low motivation and poor learning experience in the E-learning process, resulting in poor performance or dropping out. Researchers have used different methods to explore the factors that affect learners’ E-learning performance and build E-learning performance predictive models to reveal the relationship between various factors of the learning process and learning outcomes. These studies provide a vital basis for academic early warning and the development of learning intervention plans to ensure the sustainability of education [10]. Depending on the focus of the study, we will sort out both the predictive methods and the influencing factors of E-learning performance.

2.1. E-Learning Performance Prediction Methods

In E-learning, the use of techniques such as machine learning and data analysis to collect, process, and analyze data is increasing [11]. Many researchers have improved algorithms or built predictive models of E-learning performance to improve learning performance prediction performance. Mustafa Yağcı [12] proposed a machine learning algorithm-based midterm grade prediction model using students’ midterm exam grades as the source data. The performance of the proposed model was also calculated and compared with the performance of the random forest algorithm, nearest neighbor algorithm, support vector machine algorithm, logistic regression algorithm, naive Bayesian algorithm, and k-nearest neighbor algorithm among machine learning algorithms in predicting students’ final exam results, and the proposed model had a higher prediction accuracy. Abidi et al. [13] used an integrated machine learning model to identify and predict students’ procrastination behavior with high prediction accuracy. Hussain et al. [14] used a hybrid classification model of decision trees and support vector machines to predict students’ academic performance and obtained good prediction results. Ban et al. [15] constructed a multi-algorithm-based E-learning performance prediction framework, incorporating neural network, decision tree, K-nearest neighbor, random forest, and logistic regression algorithms to predict learners’ E-learning performance with high prediction accuracy. Tao et al. [16] predicted unknown course grades based on learners’ previous learning and compared the linear regression, random forest, backpropagation neural network, and deep neural network methods. Based on the improved K-nearest neighbor clustering based on the association rule (Pearson correlation coefficient), they proposed a deep neural network-based learning grade prediction method with an enhanced forecasting result. Zheng et al. [17] proposed a convolutional neural network model incorporating feature weighting and behavioral time series, which effectively improved the accuracy of dropout prediction. Xiao et al. [18] used a backpropagation (BP) neural network as a prediction model with six important learning behavior factors as inputs to develop a complete E-learning performance prediction method. It achieved good prediction results. Song et al. [19] proposed a sequential input-based learning performance prediction model for assessing students’ performance in online learning, which showed better predictive performance compared with various existing advanced machine learning models. Esteban et al. [20] used an algorithm based on multiple-instance learning (MIL) representations of assignment-related information to predict learners’ academic performance, with good results. Although the above E-learning performance prediction methods and models have shown good prediction results, the interpretability of the results needs to be further improved. Xiong et al. [21] use a topic model and a gradient descent algorithm to extract a student’s feature vector and personalize the recommended learning materials for the student based on the predicted grades. Lin et al. [22] constructed a user interest model to calculate user preferences for topics, effectively improving the effectiveness of personalized learning resource recommendations. Using topic modeling to process large amounts of text data and perform feature selection can better explain the prediction results. Overall, these studies have important implications for facilitating the performance of E-learning performance prediction and pointing the way towards improving the quality and efficiency of E-learning for personalized tutoring and recommendation.

2.2. Influences on E-Learning Performance

In addition, in studies on predicting E-learning performance, many researchers have focused on using various algorithms and techniques to uncover the learning behaviors that influence E-learning performance to examine the learning process of learners preferably. Xue et al. [23] propose a clustering algorithm based on brainstorming optimization to analyze the relationship between learning data and academic performance. Luo et al. [24] proposed and validated a generic model for predicting learning outcomes using the random forest algorithm, concluding that a high level of engagement with various E-learning activities could better predict learner learning outcomes in blended courses. Adnan et al. [25] trained and tested predictive models using diverse machine learning and deep learning algorithms and concluded that student assessment scores, engagement intensity, and time-related variables were vital factors influencing E-learning performance. Ni et al. [26] selected the random forest algorithm as the basic algorithm for the learning effectiveness prediction model and concluded that the total document learning time was a factor affecting learning effectiveness. By using cohesive hierarchical clustering analysis, the K-means clustering algorithm, correlation analysis, and logistic regression analysis to process acquired catechism course data, Qiao et al. [8] concluded that video viewing was the main factor influencing the learning effectiveness of catechism learners. Using structural equation modeling, Shi et al. [27] found that learners’ background information and learning preparation affect E-learning behavior significantly. Wang et al. [28] found a positive correlation between students’ viewing behavior and learning outcomes when watching online video lectures. Sun et al. [29] used neural networks, decision trees, and linear regression algorithms for modeling and analysis, concluding that attitude toward learning, learning timeliness level, and learning commitment level were the main factors influencing online academic achievement. Mubarak et al. [30] found that video clickstream events can be used as a learning feature to predict learner effectiveness. Lim et al. [31] used topic models to investigate the impact of epidemics on learners participating in online video tutorials and to infer changes in learning behavior that could better meet learners’ E-learning needs.
In general, many domestic and international researchers have used improved algorithms or built models to improve the prediction of learners’ E-learning performance and further explore the factors that affect learners’ E-learning performance. However, learning is a continuous process, and the actions performed by learners on online platforms are complex and diverse. E-learning performance cannot be predicted and evaluated solely based on a single independent learning behavior.

2.3. E-Learning Behavior Classification Study

Many researchers have carried out research on learning behavior classification. Balti et al. [32] categorize learning activities according to learning style theory, defining and analyzing behavioral traits in depth and thus revealing learners’ learning preferences apart from the correlation between behavioral traits and learning achievement. Ye et al. [33] reflect the existence of an intrinsic correlation between learning behaviors by constructing an E-learning behavior classification model (EBC), and the classification fusion of learning behaviors better supports E-learning prediction performance. Considering the student’s dynamic cognitive structure during the learning process, Sun [34] divides the learners’ E-learning behavior process into four stages: the learning occurrence stage, the knowledge acquisition stage, the interactive reflection stage, and the learning consolidation stage. Qiu et al. [9] divided the learning process into the learning preparation stage, knowledge acquisition stage, interactive learning stage, and learning consolidation stage, proposing an online behavioral classification model based on the E-learning process, namely the process behavioral classification (PBC) model, which demonstrated better predictive performance for performing E-learning performance prediction. Qiu et al. [35] proposed an adaptive feature fusion strategy based on the classification of learning behaviors. They constructed a behavioral classification model based on interactive objects and learning processes, concluding that the basic and knowledge interaction behaviors in the learning behavior category had the strongest correlation with learning performance.
As one of the types of online courses, STEM courses present content constructed from real-life problems, integrating multidisciplinary knowledge and continuously enriching the knowledge structure of interdisciplinary areas, supporting students in gradually delving into familiar life situations, actively exploring, and learning in a lively manner. As a result, the platform records a variety of E-learning behaviors and covers a much more extensive range of learning processes. In contrast, previous research on STEM online courses has used a relatively small variety of datasets, and there is a lack of studies and predictive modeling of the factors influencing E-learning performance in STEM courses. Shi et al. [27] also used structural equation modeling to explore the impact of learners’ background information and online behavioral characteristics on learning outcomes in activity-centered online courses based solely on the UK Open University online course learning behavior and outcome dataset.
Applying artificial intelligence (AI) technology in STEM education positively affects students’ academic performance. AI has shown good efficiency and algorithmic accuracy in STEM education applications, especially with integrated machine learning methods, and has shown great potential in learning prediction, automation, and personalized recommendations areas. Xu et al. [36] analyzed a ten-year review of the use of artificial intelligence in STEM education. Then they found that learning prediction and student behavior detection are conducted mainly through artificial intelligence algorithms and modeling methods. Kehdinga George Fomunyam [37] also theorized the need to use machine learning in STEM education, including providing learners with the right tools to effectively and efficiently select the most appropriate resources and content that meet their learning standards, to meet the needs of learners in a personalized manner. Therefore, to better predict and evaluate the E-learning performance of STEM course learners and enhance their academic achievement, this paper explores the factors affecting the E-learning performance of STEM courses by using different STEM course datasets and employing machine learning and other techniques to construct a prediction model by choosing the learning behavior classification proposed by Qiu et al. [9].

3. Materials and Methods

3.1. Research Design

As shown in Figure 1, the principal component analysis (PCA) method showed there were differences in the E-learning performance of STEM learners and the feature behavior after feature selection using the input variable in the prediction model for STEM E-learning performance. The models were trained and tested using the commonly used naive Bayes, decision tree, support vector machine, K-nearest neighbor (KNN), KNN distance (KNN dis), and Softmax regression algorithms to determine the categories of learning behaviors that affect the performance of E-learning in STEM courses using factor analysis and random forest algorithms based on the learning behavior classification approach proposed by Qiu et al. [9].
The hardware used for the experiments was an Intel Core i5-10600KF processor, 16 GB of RAM, and a 1 TB hard drive. The software was based on the Windows 10 operating system, using the Jupyter lab and PyCharm integrated working environment, with the Python interpreter version 3.8.10.

3.2. Data Source

The Open University Learning Analytics Dataset (OULAD) is one of the most comprehensive international public datasets of E-learning data, containing data on the E-learning behavior and performance of 32,593 students in seven courses from AAA to GGG, such as student demographics and course outcomes (whether they passed or failed), course information (course modules, course categories, number of sessions, number of students enrolled), and information on interactions with the platform. This study discusses E-learning behavior categories that affect STEM courses, and the AAA, BBB, and GGG courses are social sciences. Therefore, in this study, the E-learning behavior data of a total of 21,403 learners from four courses with course categories of STEM, CCC, DDD, EEE, and FFF, such as the number of clicks on HP, PG, and DA, were selected as input variables for the E-learning performance prediction model, with 0 (failed) or 1 (passed) as output values. The model was trained by analyzing the predictors, thereby improving the accuracy of predicting whether learners passed the course or failed. As shown in Table 1 and Table 2, the four STEM courses recorded 19 E-learning behaviors, among which the CCC, DDD, EEE, and FFF courses recorded 9, 12, 11, and 18 E-learning behaviors, respectively. These E-learning behavior data of STEM courses recorded the E-learning dynamics of each learner, and the E-learning behavior data were mined to explore the potential behavioral meaning.

3.3. Data Preprocessing

Due to using multiple course data from E-learning platforms, there may be duplicate records or duplicate fields, outliers, and missing values in the multi-dimensional E-learning behavior data. For subsequent processing and analysis, the data were de-duplicated by replacing the numerical values of the abnormal behavior indicators in individual cases with missing values, then populated by the average of other students for the corresponding behavioral variables, and finally normalized.

3.4. Data Analysis

The purpose of implementing PCA on the preprocessed E-learning behavior data of the four STEM courses was to obtain the characteristics of the distribution of differences in the E-learning performance of learners in STEM courses. The preprocessed E-learning behavior data of the four STEM courses were feature selected to reduce feature dimensionality and use machine learning algorithms and deep learning algorithms for E-learning performance prediction to identify learning behavior data recorded through the E-learning platform for E-learning performance prediction. Based on a specific classification of learning behaviors, a combination of factor analysis and the random forest algorithm was used to uncover the learning behavior categories that influence E-learning performance in STEM courses.

4. Results

4.1. Differentiation of E-Learning Performance of STEM Courses

In this study, PCA was conducted on E-learning behavior data of students in STEM courses to explore differences in the E-learning performance of learners participating in STEM courses. Using PCA to deal with multiple characteristic behavioral data of students can significantly reduce the analysis objectives and information loss, and dimensionality reduction is performed based on full consideration of feature independence and inter-feature relationships. Firstly, multiple learning behavioral characteristic variables of learners are reduced to two dimensions by a linear transformation. Then they are visualized and analyzed by K-means clustering, which divides them into several classes according to the similarity of the sample features, with fast convergence and high interpretability.
As shown in Figure 2, there is a clear degree of differentiation between the red and green samples, indicating that a clear difference exists between the groups of students corresponding to the red and green sections. The red sample corresponds to several scattered points that are more clustered, indicating less variability in student characteristic distances and very high similarity between students; the green sample corresponds to several scattered points that are more scattered, indicating more variability in student characteristic distances and less similarity between students. Overall, there was significant category variability among students participating in the four STEM online courses and similarities among students in the same category, so there was a need to explore the characteristic behaviors that influence the E-learning performance of students in STEM courses and to discover the learning behavior classifications that affect E-learning performance in STEM courses.

4.2. Prediction and Evaluation of E-Learning Performance of STEM Courses

4.2.1. Experimental Scheme

To illustrate the possibility of using feature-selected learning feature data for E-learning performance prediction in STEM courses. Therefore, when constructing the STEM course E-learning performance prediction model, preprocessed, feature-selected characteristic behavior data are used as input data in the STEM course E-learning performance prediction model.
Due to the variety of input data types for the E-learning performance prediction model for STEM courses and the fact that some data are missing, using multiple algorithms for comparison can lead to better predictors. Therefore, this study uses seven machine learning algorithms currently more widely applied in classification tasks in the field of learning prediction [38,39,40,41], namely SVC rbf, SVC linear, Bayes, KNN, KNN dis, decision tree, and Softmax regression algorithms.
SVC, an SVM classification algorithm, is generally used for binary classification models; it supports linear and non-linear divisions and can handle high-dimensional feature data. SVC linear is a linear kernel function, SVC rbf is a Gaussian kernel function, and rbf and liner are two functions of the SVC classifier. The use of different kernel functions can better accommodate variations in the number of samples and the number of features. The Bayes algorithm has the advantages of being a simple and fast process, requiring few parameters to be estimated, and being insensitive to missing data when making predictions on predicted samples. KNN is a simple and easy-to-use algorithm that refers to several samples measured in some space of known size. If the distance between adjacent samples is less than the specified nearest distance, it classifies the two samples as the same category with high accuracy. However, the KNN algorithm suffers from sample imbalance, so a KNN algorithm with distance weighting (KNN dis) adds weight to the distance of each point so that the closer points can obtain greater weight. A decision tree is a single-classifier classification technique that uses a tree shape as a structural framework, consisting of a decision diagram and possible outcomes to aid decision-making and facilitate understanding and interpretation, and it is better suited to dealing with samples with missing attributes. Softmax regression algorithms use the probabilities of the output categories in the Softmax operation to deal with multi-classification problems; they ensure that smaller values have smaller probabilities and are not discarded outright.
The suitable metrics currently used to evaluate predictors, including precision, accuracy (ACC), F1-score, and kappa, were chosen for this study. A five-fold cross-validation method was used for the experimental groups in all four courses. The mean of the five-fold cross-validation results was used for the experimental results. By analyzing and comparing the seven different classification methods’ performance, the validity and feasibility of a predictive model for E-learning performance in STEM courses are illustrated.

4.2.2. Experimental Results and Analysis

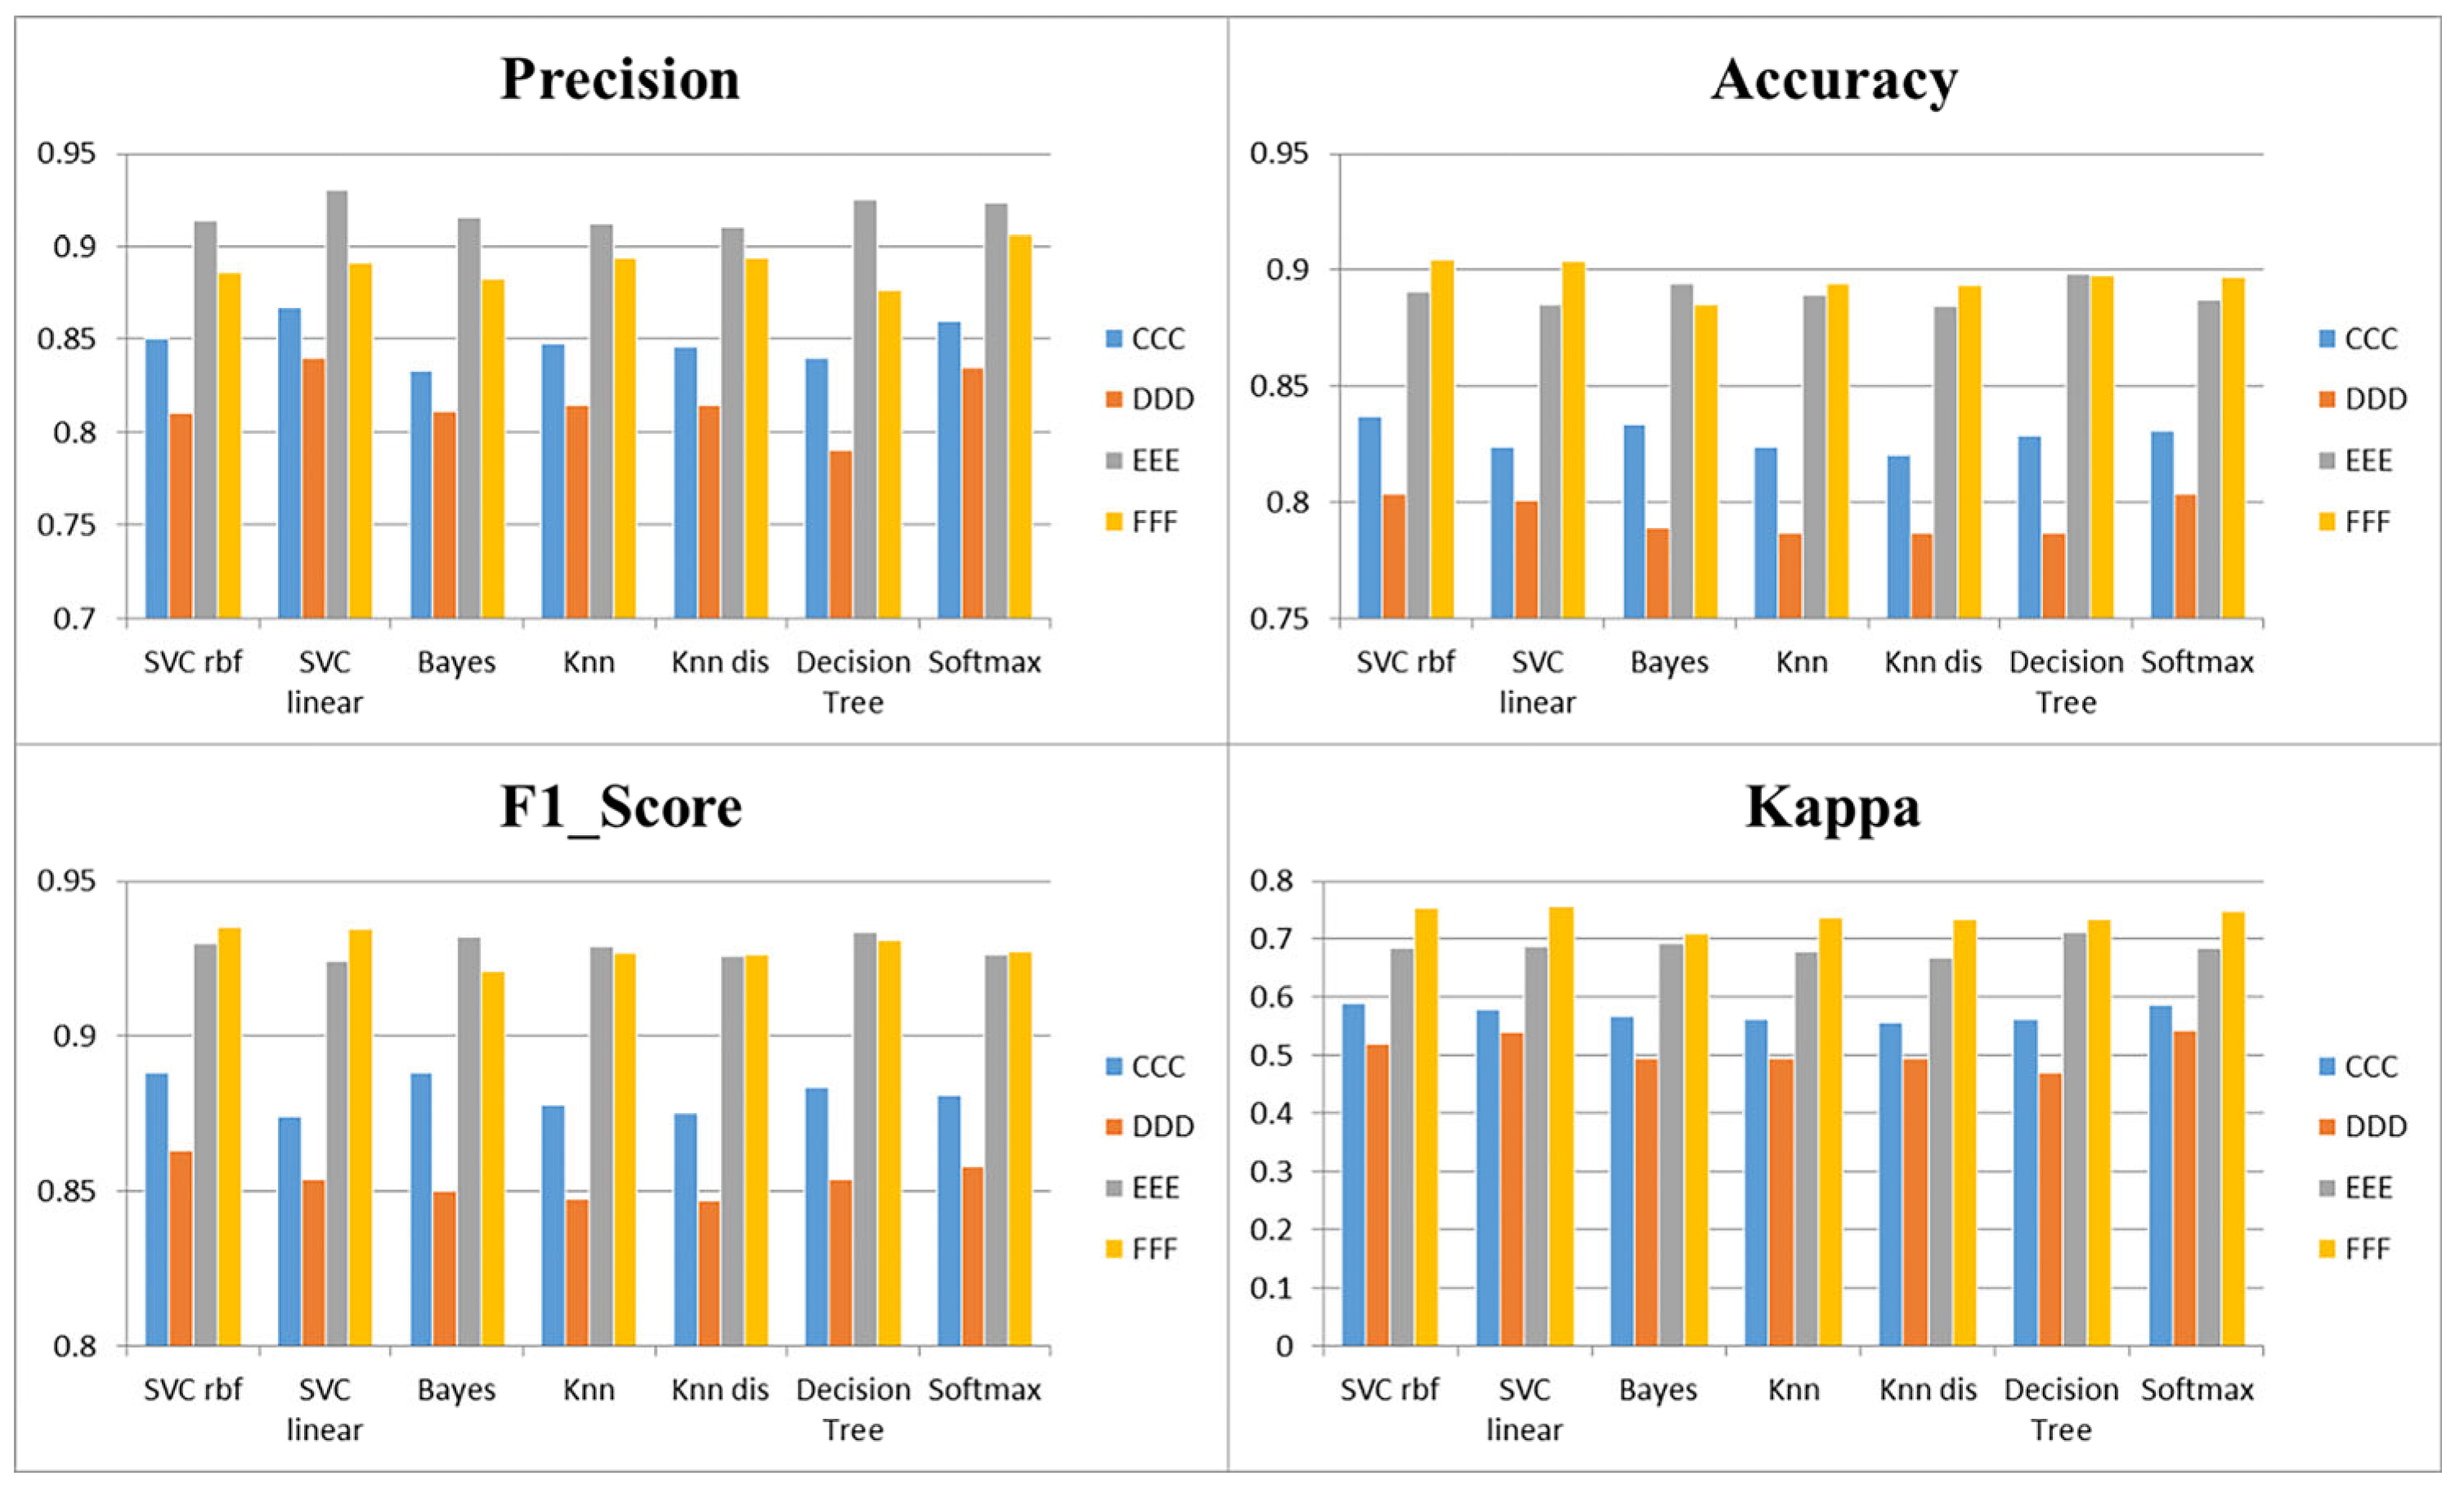
The five-fold cross-validation method was used for all four STEM courses used, and the values of precision, accuracy, F1-score, and kappa were the average of the five-fold cross-validation to verify the feasibility and good predictive performance of using learning feature data for STEM E-learning performance prediction; the results are represented in Figure 3.
From Figure 3, the precision of the four STEM courses ranged from 79.08% to 93.04%, accuracy was 78.66% to 90.44%, F1-score was 0.8471 to 0.9352, and kappa was 0.4956 to 0.7569. The overall prediction performance was good, indicating that using learning feature behavior for STEM E-learning performance prediction is feasible. The precision distribution of the CCC course indicators averaged over the seven algorithms after five-fold cross-validation was 83.32~86.7%, accuracy was 82.03~83.71%, F1-score was 0.8743~0.8881, and kappa was 0.5555~0.5911; DDD course precision distribution was 79.08~84.03%, accuracy was 78.66~80.37%, F1-score was 0.8471~0.8631, and kappa was 0.4692~0.5422; EEE course precision distribution was 91.01~93.04%, accuracy was 88.45~89.78%, F1-score was 0.9241~0.9337, and kappa was 0.6673~0.7111; FFF course precision distribution was 87.65~90.58%, accuracy was 88.51~90.44%, F1-score was 0.9212~0.9352, and kappa was 0.7108~0.7569. This shows that the performance of E-learning performance predictions under all seven algorithms is better for the learning feature data of the four STEM courses after the feature selection process.
Comparing the seven algorithms for the CCC, DDD, EEE, and FFF courses showed that the prediction results were better for the SVC rbf algorithm. The four STEM courses have mean values of 0.8652, 0.859, 0.904, and 0.6381 for the SVC rbf algorithm, respectively. Despite the advantages and disadvantages of predictive performance for different algorithms, using learned feature behavior after feature selection allows predicting and assessing E-learning performance in STEM courses and achieves high performance in all areas.

4.3. Learning Behavior Categories of E-Learning Performance of STEM Courses

4.3.1. Experimental Scheme

The experimental results of predicting and assessing E-learning performance in STEM courses indicate that feature-selective learning behaviors can forecast and evaluate E-learning performance in STEM courses. To further clarify the categories of learning behaviors that influence E-learning performance in STEM courses, this experiment first demonstrated correlations between learning feature behaviors by conducting a factor analysis of the learning feature behaviors recorded in four STEM courses, allowing for group categorization of learning behaviors. Secondly, the random forest algorithm was chosen to train the preprocessed learning feature behaviors to obtain the degree of influence of individual feature behaviors on the E-learning performance of students in STEM courses and to rank the features’ importance. Then, the feature selection results from Experiment 2 for predicting E-learning performance in STEM courses were calculated and aggregated. Finally, the number of feature selections was compared with the results of the random forest experiment to further identify the categories of learning behaviors that influence performance in online learning in STEM courses.

4.3.2. Experimental Results and Analysis

  • Factorial Analysis
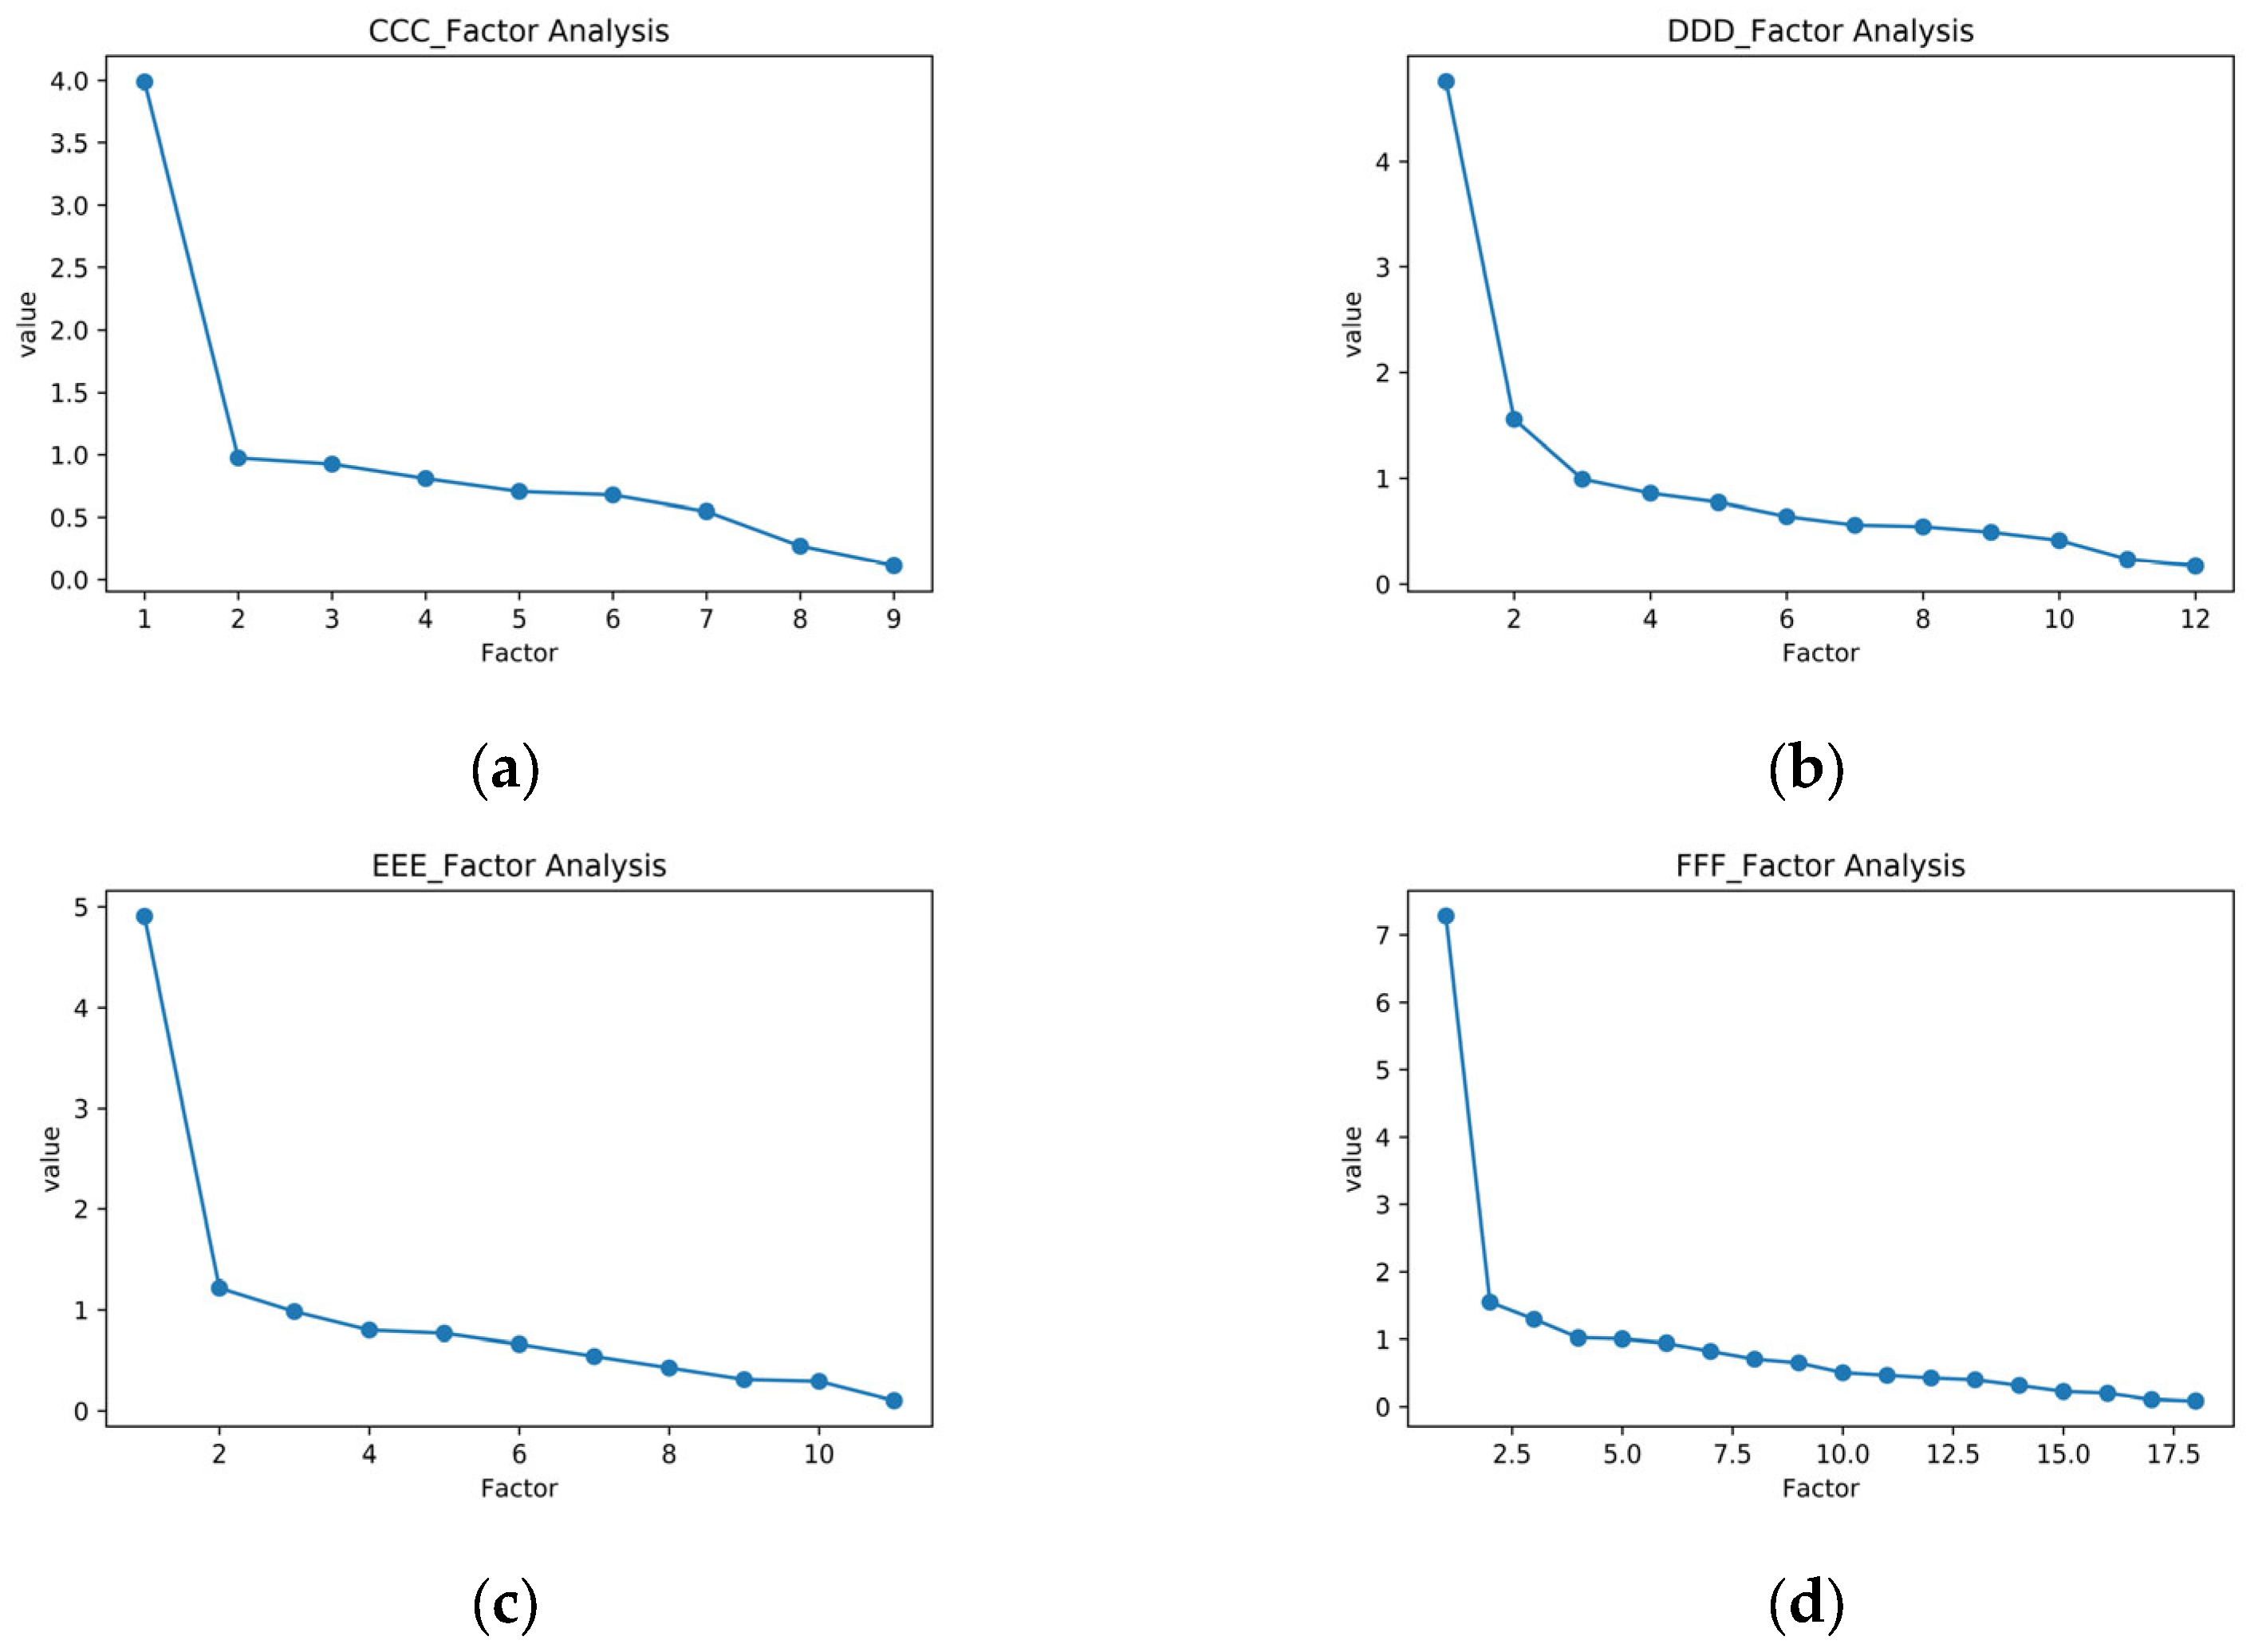
To explore the commonalities between the E-learning behaviors of the four STEM courses, a factor analysis was conducted on the E-learning behaviors of these four STEM courses. Based on the dimensionality reduction concept, factor analysis aggregates a host of complex variables into a few independent common factors with no loss of information about the original data or as little loss as possible. These few common factors can reflect the core information of the many original variables, reducing the number of variables while at the same time reflecting the intrinsic links between them. By extracting the common factors of all E-learning behaviors and exploring the correlations between learning behaviors, it is possible to clarify the grouping of learning behaviors into categories.
When implementing factor analysis, it is necessary to meet the condition that the original variables should have a strong correlation. Therefore, correlation analysis was conducted on the E-learning behavior recorded by each STEM course, and the correlation coefficient matrix between the original variables was calculated. The data from the CCC course were first processed, and after removing missing values, there were 3851 records. After Bartlett’s spherical test and KMO test for nine learning behaviors, the p_value value was 0.0, and the value of KMO was 0.8138, greater than 0.6, proving that the correlation matrix of the characteristic variables was not a unit matrix and could be used to conduct factor analysis. After removing missing values from the DDD course data, 5406 student records were tested for 12 behaviors with a p_value of 0.0 and a KMO value of 0.8574, greater than 0.6, demonstrating that the characteristic variables were not independent of each other and could be used to conduct factor analysis. After removing missing values, 2633 student records were tested for the EEE course data. Through Bartlett’s spherical and KMO tests, the p_value value was 0.0, and the KMO value was 0.8725, greater than 0.6. This proved that the correlation between the characteristic variables is strong, and the factor analysis is valid. After removing missing values from the FFF course data, there were 6798 student records, and after Bartlett’s spherical test and KMO test, the p_value value was 0.0, and the value of KMO was 0.9007, greater than 0.6, proving that there was a strong correlation between the characteristic variables and that factor analysis was valid.
The vertical coordinates in Figure 4 are the eigenvalues, and the horizontal coordinates are the number of indicators for each STEM course. An analysis of the trend of the folds in Figure 4 shows that the folds of the gravel plot for each course suddenly become smooth from steep at a factor number of 2, with larger eigenvalues and more obvious changes and could take the trend in the number of factors that are extracted from steep to smooth. Therefore, Figure 4 shows the correlation between the learning behaviors of the four STEM courses of CCC, DDD, EEE, and FFF. The number of factors jointly extracted from the factor analysis was 2. To further obtain the degree of correlation between learning behaviors and to determine the feasibility of carrying out learning behavior classification, in the subsequent modeling of the factors, two factors were selected and correlations between features were determined using the variance maximization method.
Figure 5 shows a heat map of the relevance of learning behaviors for the four STEM courses CCC, DDD, EEE, and FFF. The scale on the right side of the heat map shows the shades of color corresponding to the different correlation coefficients, and the left shows the course-specific learning behaviors. Figure 5 shows that the number of common factors for the nine learning behaviors of the CCC course is 2, while the correlation coefficients between FU, HP, SP, QZ, and PG learning behaviors and the common factors are 0.9, 0.83, 0.82, 0.62, and 0.61, respectively. Therefore, the correlation coefficients between FU, HP, SP, QZ, and PG learning behaviors can be more feasibly categorized. The number of common factors for the 12 learning behaviors in the DDD course was 2. The feasibility of classifying the other learning behaviors was high, except for the GS learning behavior with a low correlation with the common factors. The 11 learning behaviors of the EEE course have a co-factor number of 2. The HP, WK, UR, and FU learning behaviors correlate highly with the co-factor and can be categorized. The 18 learning behaviors in the FFF curriculum, except GS, EM, RP, and FD, correlate well with the common factors and can be categorized.
Overall, the factor analysis demonstrated correlations between the learning feature behaviors of the four STEM courses and classifying some learning behaviors according to the categories of learning behaviors.
2.
Importance Sequence of E-learning Behavior of STEM Courses
In order to identify the vital feature behaviors affecting the E-learning performance of STEM courses, the random forest algorithm has the advantage of processing high-dimensional data and fast training, taking into account the ability to solve both regression and classification problems and due to the large volume of data from the four STEM courses and a large number of dimensions of learning behavior characteristics recorded. It is an algorithm that integrates multiple decision trees through the thinking of integration learning. For classification problems, the mode output of individual trees determines the output class. In a regression problem, the output of each decision tree is obtained by averaging the final regression results. Therefore, this experiment uses the random forest algorithm for ranking feature behavior importance.
Figure 6 shows that the four STEM courses, CCC, DDD, EEE, and FFF, have more feature behaviors that influence students’ E-learning performance, and the ranking of the importance of the feature behaviors is not consistent. The numerical distribution of the importance associated with the four STEM courses’ feature behaviors was considered together, and a cut-off of 0.1 was used for the feature behavior selection. The characteristic behaviors that affect the E-learning performance of students in the CCC course are SP, QZ, HP, and PG; the characteristic behaviors that affect the E-learning performance of students in the DDD course are RS and HP; the characteristic behaviors that affect the E-learning performance of students in the EEE and FFF courses are WK and QZ, respectively. HP and QZ were the two characteristic behaviors that were more influential and occurred more frequently in the four STEM courses.
In short, learning feature behaviors affect the prediction of STEM E-learning performance, but the degree of impact and importance varies. Selecting learning feature behaviors with increased impact and identifying their categories will be more conducive to making predictions of STEM E-learning performance and improving student learning outcomes.
3.
Learning Behavior Categories of E-learning Performance of STEM Courses
Based on the experimental results of E-learning performance prediction and evaluation of STEM courses, it was concluded that the E-learning performance of STEM courses can be predicted based on the learning feature behavior after data preprocessing and feature selection, and good performance results were achieved. Based on the correlation between learning behaviors derived from factor analysis and random forest experiments, categories of learning behaviors can be classified, and the degree of influence of different learning behaviors on E-learning performance varies. The vital learning behaviors that affect E-learning performance in STEM courses are SP, QZ, HP, PG, RS, and WK.
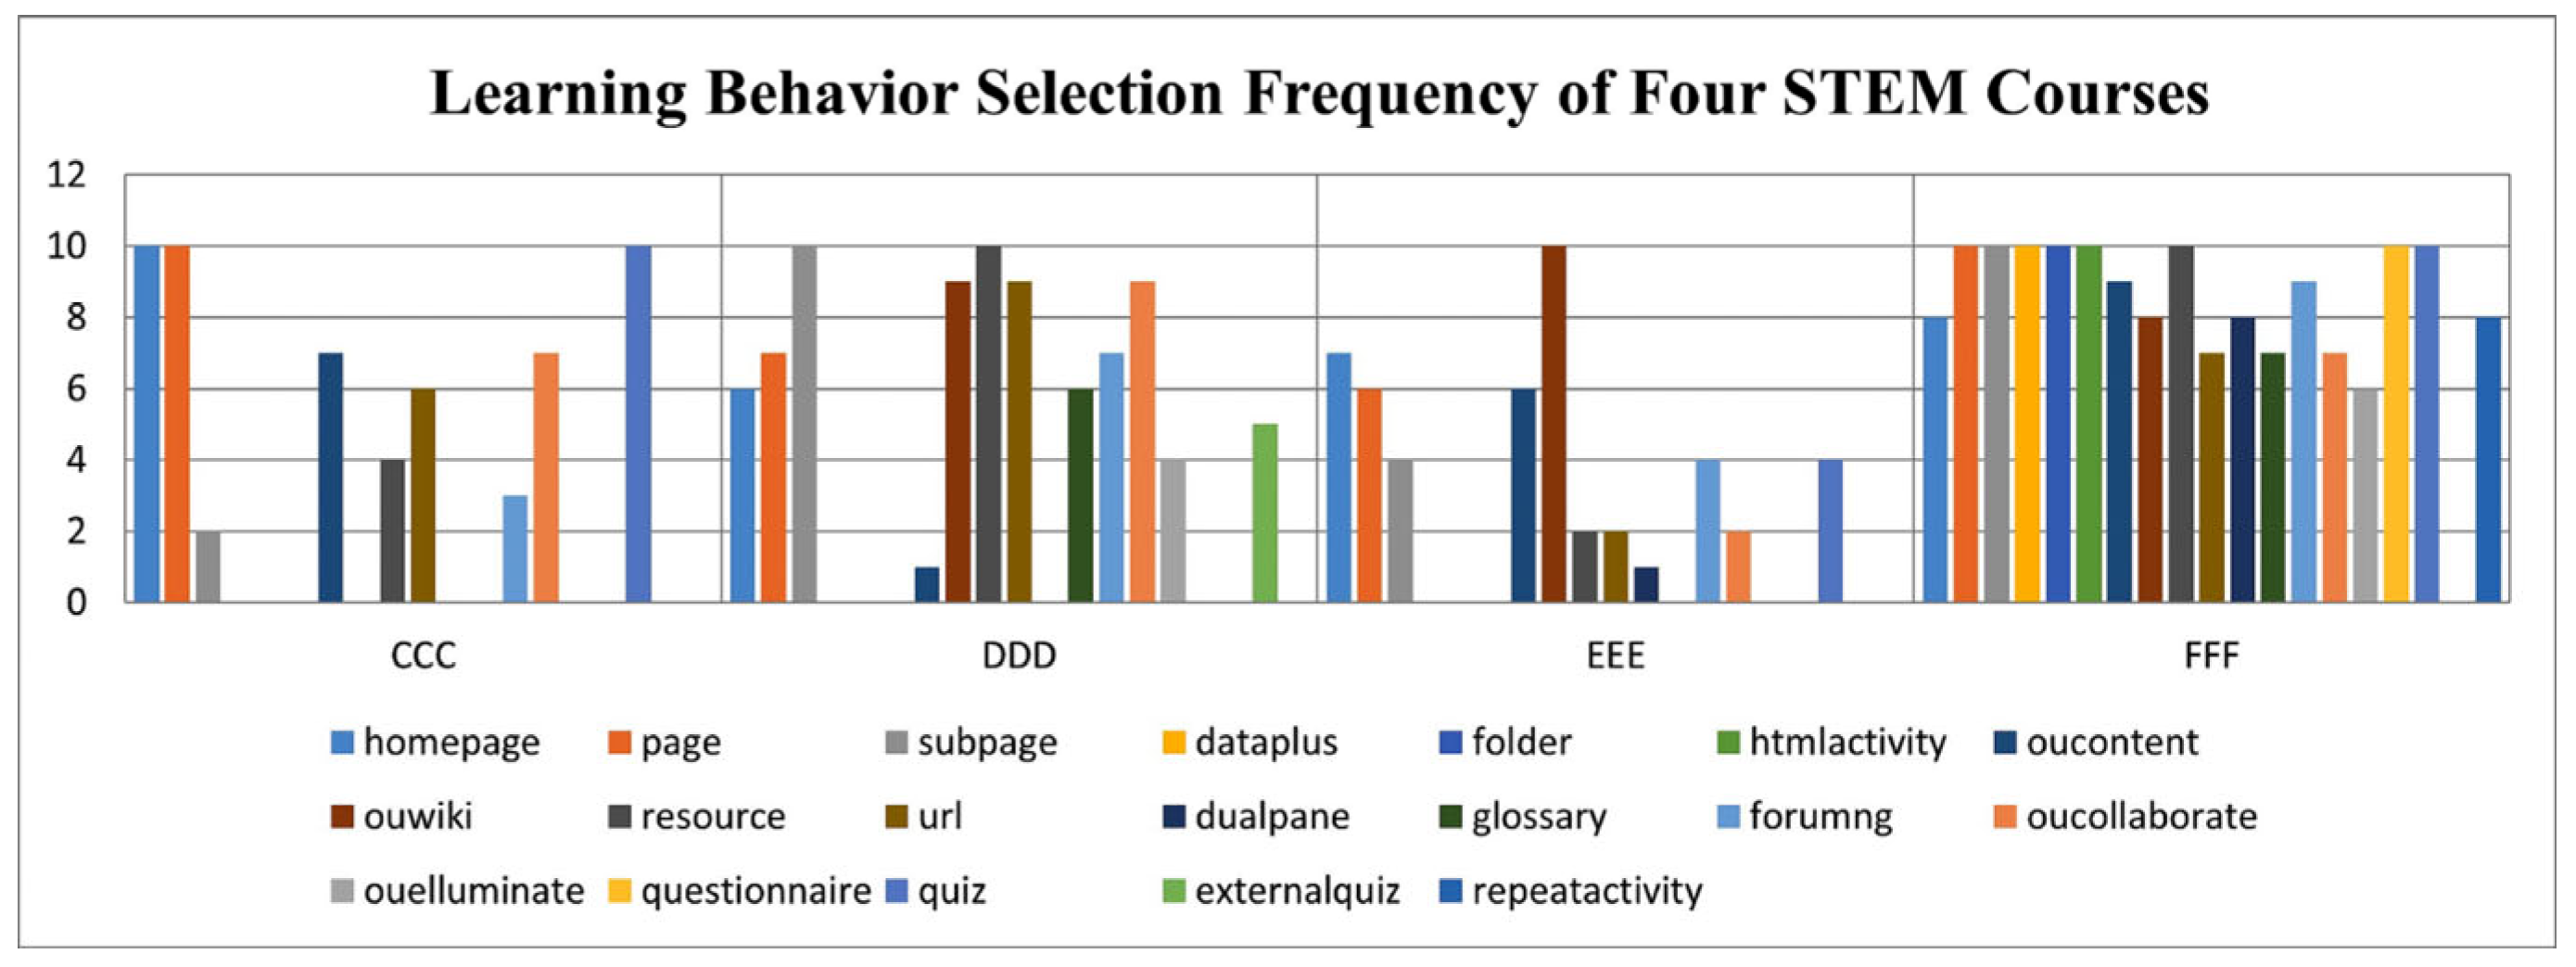
To further identify the learning behaviors that significantly impact the E-learning performance of STEM courses, a classification of learning behavior categories that affect the learner’s E-learning performance in STEM courses was conducted. Learning behavior numbers were counted in ten training sessions of the predictive model for each STEM course in the experiment of predictive modeling and assessment of E-learning performance in STEM courses, as shown in Table 3.
As can be seen from Table 3, the learning behaviors with higher feature selection odds in E-learning performance prediction for the CCC course are HP, PG, and QZ; the learning behaviors with higher feature selection odds in E-learning performance prediction for the DDD course are HP, SP, and RS; WK is the learning behavior with higher feature selection odds in E-learning performance prediction for the EEE course; the learning behaviors with higher feature selection in E-learning performance prediction for the FFF course are PG, SP, DA, FD, HA, RS, QN, and QZ.
The results of this feature selection statistic were broadly consistent with the ranking of vital learning behaviors, apart from the difference in comparison of the SP learning behaviors for the CCC course. The results of the experiment showed that the SP learning behavior of the CCC course had a strong influence on the E-learning performance of the STEM course. However, only two selections were made to predict E-learning performance. The above scenario occurs because the CCC course records a smaller variety of E-learning behaviors, with SP as the behavioral data for accessing course sub-interfaces that reflect the progress of STEM course learners in completing new knowledge learning tasks. The learning of new knowledge has a greater degree of impact on the learners’ performance. Therefore, when using individual E-learning behaviors for learning performance prediction, the degree of influence of the SP learning behavior is greater. However, when multiple learning behaviors are used for prediction, HP and PG learning behaviors, as behavioral data for accessing the main interface and entering the course interface, are intrinsically correlated with SP learning behaviors, reflecting to some extent the tendency to take the next step, and are conditions for SP learning behavioral operations to occur. When HP and PG learning behaviors have a high chance of being selected in ten training sessions of the prediction model, the probability of selection of SP learning behaviors is reduced to improve the prediction model performance. Based on the results of the significant learning behavior sequences and feature selection counts for the CCC, DDD, EEE, and FFF courses, it was concluded that the SP learning behavior was more influential on the E-learning performance of learners in STEM courses. Therefore, the learning behaviors that were further identified as strongly impacting the performance of online learning in STEM courses were SP, QZ, HP, PG, RS, and WK.
Because there is a degree of correlation between the learning behaviors recorded in the CCC, DDD, EEE, and FFF courses, learning behavior categories can be created. Therefore, learning behaviors were classified as learning preparation behavior (LPB), knowledge acquisition behavior (KAB), interactive learning behavior (ILB), and learning consolidation behavior (LCB) according to the learning behavior classification basis proposed by Qiu. [9], and SP, QZ, HP, PG, RS, and WK learning behaviors, which significantly impact E-learning performance in STEM courses, were classified into learning behavior categories.
As shown in Figure 7 and Figure 8, almost every learning behavior recorded on the platform for each STEM course was selected for prediction when performing E-learning performance prediction for STEM courses. However, the odds of feature selection varied. The six learning behaviors SP, QZ, HP, PG, RS, and WK had higher odds of selection and correlations and belonged to the three learning categories of LPB, KAB, and LCB. Therefore, the learning behavior categories that significantly influence E-learning performance in STEM courses are LPB, KAB, and LCB, and ILB influences E-learning performance in STEM courses to a lesser extent.

5. Discussion

To further improve the E-learning performance of STEM course learners, enhance the effectiveness of STEM online course education, and indicate the direction of improvement for teaching staff and learners, this study confirms that there are more significant differences in the E-learning performance of learners studying STEM courses at the Open University in the UK through an experiment on the differentiation of E-learning performance in STEM courses and presents the need for the study. The experimental results in predicting and assessing E-learning performance in STEM courses confirm that E-learning behaviors can be used to predict learning performance. The experiment on the categories of learning behaviors affecting E-learning performance in STEM courses identified the categories of learning behaviors affecting the E-learning performance of learners in STEM courses as learning preparation behavior, knowledge acquisition behavior, and learning consolidation behavior, with SP, QZ, HP, PG, RS, and WK having a significant impact. Moreover, interactive learning behaviors had less impact on the E-learning performance of STEM courses.

5.1. Learning Preparation Behavior

HP, PG, and SP are for accessing the main interface, entering the course interface, and accessing the course sub-interface, all of which are learning preparation behaviors and are the most basic behavioral data in the online learning process. The total number of clicks for accessing the main interface, accessing the course interface, and accessing the course sub-interfaces shows the proportion of STEM course learners completing new knowledge learning tasks. A high number of visits also indicates a higher level of learning engagement [42] and further inference about whether learners are following the course video resources as required by the course. Course videos are the main teaching material in online courses and are presented in various forms such as audio, images, and animations to help students gain a deeper understanding of abstract content that is easy to demonstrate concretely and not easily elaborated in words [43] and to deepen the internalization of knowledge [44]. The variety of multimedia presentations allows learners to choose their preferred media channel format for course content, which attracts learners’ attention and interest and promotes sustained engagement, which in turn influences learners’ E-learning performance.
All three of these learning behaviors strongly impact the E-learning performance of learners in STEM courses and fall into the category of learning preparation behaviors. Learning preparation behaviors occur at the stage where learning happens, as the necessary actions required for learning take place. STEM courses are a kind of online learning course with the general characteristics of an online course. As learning occurs, the platform will automatically record these dynamic data. These clicks predict the number of cognitive engagements when learners access the platform for STEM courses and the chances of learners receiving and viewing course resources as the number of visits increases. Learners are able to gradually build cognitive structures about new knowledge and subsequently complete basic knowledge learning tasks through continuous access to the course content. In addition, the number of clicks and the time period of clicks also reflect, to some extent, the level of engagement and persistence of learners in online learning [45]. Positive and sustained engagement in the course indicates that learners have better attitudes and study habits and are more engaged in learning new knowledge, reflecting their E-learning performance to some extent [46]. In general, the E-learning performance of learners in STEM courses can be explored by looking at learners’ learning preparation behaviors.

5.2. Knowledge Acquisition Behavior

RS and WK are searching platform resources and querying with Wikipedia, respectively, and are knowledge acquisition types of behavior in the STEM curriculum. Most people report that videos and wikis are primary sources of knowledge acquisition. Social networking sites are a valuable tool and source of collaborative learning [47]. In addition to acquiring knowledge by watching videos and completing the most basic course tasks, students participating in STEM courses can expand their knowledge by searching for relevant learning resources on the platform and using the wiki to search for and edit information. In the wiki, learners can read the content and add, modify [48], or reorganize it to share their knowledge online, improve their self-awareness, and ultimately influence their performance in the online learning process.
Knowledge acquisition behaviors affect the E-learning performance of learners in STEM courses and are better suited to active learning, where learners think independently and explore autonomously. Courses that require active learning present a significant challenge to learners [49], which will require the alignment of learners’ knowledge, feelings, intentions, and actions. Once learners in STEM courses have completed the most basic course tasks, they can continue to rely on the platform to acquire knowledge. The knowledge acquisition behavior implemented by learners helps to reshape and expand their previous knowledge, thus satisfying the need for self-improvement. This series of knowledge acquisition actions recorded on the platform also reflects the learners’ awareness of actively answering their queries and exploring actively. Overall, learning knowledge acquisition behaviors reflect, to some extent, the willingness of online learners in STEM courses to take the initiative and contribute to improved E-learning performance.

5.3. Learning Consolidation Behavior

A QZ is a quiz, an assessment, and a feedback activity, which belongs to the act of learning consolidation in STEM courses. STEM learners will be tested on the course content in the later stages of the course. While answering the test questions, learners are encouraged to extract and apply the content to complete the test, with the whole process aiming to consolidate knowledge and train working memory. The test results are an assessment of the learner’s learning effectiveness at this stage, apart from a form of direct feedback. Presenting the right or wrong test questions and results allows students to confront their shortcomings, identify their weaknesses in knowledge mastery, correct them after class, find vulnerabilities, and fill in the gaps in their knowledge system. Thus, the data on learning consolidation behavior on the platform enable a better assessment of learners’ E-learning performance.
The learning consolidation behaviors have significant benefits for online learners of STEM courses in terms of mastering subject knowledge and training subject thinking. The STEM program develops innovative talent based on a multidisciplinary approach to education [50]. However, the design of STEM courses often neglects fundamental subject knowledge, subject thinking, and subject competence and vaguely pursues the development of students’ comprehensive skills, such as problem-solving and critical thinking skills [51]. Learning consolidation behaviors, whether quizzes, questionnaire feedback, or repetitive actions, can develop subject competence and improve learners’ online performance. Quizzes facilitate the internalization and reconstruction of knowledge and motivate learners to stay on course. By completing the questionnaire feedback, learners can evaluate their learning, express their reflections in written form and adjust their learning plans. Recorded repeated operational data can reveal details of how learners monitor their self-learning processes and how these details guide their selection and implementation of learning strategies that promote self-awareness [45,49]. Overall, the learning consolidation behavior is an essential part of the STEM curriculum for learners, contributing to the internalization of knowledge and learning success.

5.4. Interactive Learning Behavior

The STEM course behaviors FU, CA, and EM are a series of interactive behaviors that belong to the learning interactive behavior classification. Learners participating in STEM courses can use the platform features for classroom interaction, such as participating in the course topic forums, collaborative exchanges, and mock seminars (video conferencing). These features allow teachers to share course content with learners and among learners and answer queries in real time, thus meeting the need to promote collaborative knowledge building and sharing. However, the experiment results showed that this interactive approach to online courses had a low impact on learners’ performance and did not achieve the desired pedagogical effect. In essence, there is a need to focus on overcoming the disadvantages of online collaborative communication by using interactive tools more effectively in STEM courses. When conducting course topic forum discussions and collaborative exchanges, teachers may post topic tasks on the platform without carefully designing them to stimulate students’ divergent thinking and without providing subsequent guided feedback on the topic discussions. Most of the students also only completed the topic tasks posted by the teachers and performed simple posting and replying operations, lacking in-depth communication with their teachers and peers. Although the video conferencing format allows the observation of facial expressions with devices such as cameras, it lacks deep emotional engagement compared to offline discussions, making it challenging to build emotional empathy and diminishing the emotional experience for learners. These factors can, to some extent, affect learners’ E-learning performance.
The UK Open University facilitates personalized learning by creating an E-learning platform and a collaborative communication environment that allows learners to connect with teachers and peers. However, the overall effectiveness of teaching and learning is poor [52]. The STEM course emphasizes the development of students’ abilities and encourages students to take more initiative and have more freedom [50]. When face-to-face traditional lectures transfer to an online course format, what is most lacking is a collective-based exploration and teacher–student interaction. The tools for collaborative communication provided through online education websites can affect students’ E-learning performance by influencing, to some extent, their interaction with peers and teachers and their online knowledge-sharing behavior. Building a social learning space not only helps online learners to cross the barrier of physical distance and gradually adapt to connect and communicate effectively with their teachers and peers, but also increases their autonomy in learning, allowing them to become members of a collaborative community and build relationship maps on their own [53] and enhancing their knowledge sharing and emotional experiences. For more effective E-learning interactions, the platform can provide a real-time dashboard for teachers to check learners’ online progress and engagement, allowing learners to compare themselves with their peers by viewing the dashboard, supporting self-management, and promoting improved learning attitudes to achieve learning outcomes [28]. Overall, interactive behavior is valued, but the implementation process is challenging and needs to be based on social constructivist principles and the idea that collaborative working drives learning.

6. Conclusions

Shifting societal needs and educational thinking have fueled the emergence of STEM as a widely sought-after educational paradigm. The value of STEM education is not only that it equips students with basic STEM literacy and the ability to solve real-world problems but also that it leads learners to become wise, caring, and globally aware citizens.
In the context of improving the effectiveness of E-learning for learners in STEM courses and promoting sustainable development of STEM education, this study attempted to find the vital learning behaviors and learning behavior classifications that influence the performance of E-learning in STEM courses through different learning analysis techniques. This study used machine learning and deep learning algorithms to predict E-learning performance and uncovered the important learning behaviors that affect E-learning performance in STEM courses, namely SP, QZ, HP, PG, RS, and WK. These results mean that learners should keep up with the release of course information and focus on systematic learning of course knowledge when taking STEM online courses. After learning new course content, students should learn to use the resources and tools provided by the online platform to expand their knowledge. They should also optimize the use of quizzes to consolidate their knowledge and fill in gaps. Secondly, a classification framework of learning behaviors that affect the performance of online learning in STEM courses was constructed, revealing that the categories of learning behaviors that affect the E-learning performance in the whole process of STEM E-learning are learning preparation behaviors, knowledge acquisition behaviors, and learning consolidation behaviors. In contrast, interactive learning behaviors had little or no impact on E-learning performance in STEM courses. From the learner’s perspective, learners should focus on enhancing their engagement in learning new knowledge during the E-learning process, actively acquiring relevant knowledge and internalizing it while identifying their shortcomings and improving their cognitive framework. From the perspective of building STEM online courses, pedagogues should consider appropriate teaching strategies to facilitate learner–peer and learner–teacher interaction and online knowledge sharing. Online platforms should consider how technology can enhance the interactive experience of E-learning and increase learners’ initiative in online learning platforms. This study provides students and educators with a more comprehensive view and a more critical entry point to explore problems in the studying and teaching process.
However, there are still shortcomings and limitations in terms of analysis, classification, and in-depth study of the E-learning behavior of learners in STEM courses. This study started with the log files of the online platform as a single source of data. Even when recording learners’ learning behaviors in real time in the online environment, it is impossible to capture all the learners’ behaviors (for example, offline learners’ interactions with peers and behaviors that occur while learning manipulative skills) during the learning process. This study also does not consider the impact of changes in behavior over time sequences on learning outcomes. Secondly, this study used a dataset of learning behaviors from just four STEM online courses. The significant learning behaviors and categories of learning behaviors that influence E-learning performance in STEM courses have some scope for application.
In future work, we plan to mine E-learning behavior data from other platforms for STEM courses, synthesize more diverse learning behavior datasets, further optimize the framework of E-learning performance behavior categories for STEM courses, and expand the framework’s applicability. This work will focus on a single characteristic of the learner and consider learners’ demographic information and behavioral data from both online and offline learning to monitor the learner’s learning process from a more systematic and comprehensive perspective and suggest appropriate interventions.

Author Contributions

Conceptualization, J.Z. and W.W.; methodology, J.Z.; software, W.W.; validation, J.W. and R.L.; formal analysis, J.Z.; investigation, M.G.; resources, J.H.; data curation, J.W.; writing—original draft preparation, J.Z.; writing—review and editing, J.Z. and R.L.; visualization, J.H.; supervision, M.G.; project administration, F.Q. All authors have read and agreed to the published version of the manuscript.

Funding

This research received no external funding.

Institutional Review Board Statement

Not applicable.

Informed Consent Statement

Not applicable.

Data Availability Statement

Restrictions apply to the availability of these data. Data was obtained from kaggle and are available from https://www.kaggle.com/datasets/anlgrbz/student-demographics-online-education-dataoulad (accessed on 12 May 2023) with the permission of Kaggle.

Conflicts of Interest

The authors declare no conflict of interest.

References

  1. Zhang, Y.; Li, X.; Jing, H.; Zhang, Y.; Fu, Y.; Jue, W.; Mei, L. Research on the Influence of Design-based Interdisciplinary STEM Teaching on Primary School Students’ Interdisciplinary Learning Attitude. China Educ. Technol. 2018, 378, 81–89. [Google Scholar]
  2. Ling, R.; An, T.; Ren, Y. On the Cultivation of Scientific Thinking in STEM Education. Mod. Educ. Technol. 2019, 29, 107–113. [Google Scholar]
  3. Chen, X.; Xu, B.; Zhang, Z. Idea and Path of STEM Education Research and Practice—Interview with Professor Samson Nashon, a science education expert at the University of British Columbia. China Educ. Technol. 2019, 387, 1–4+22. [Google Scholar]
  4. Kong, J. Research on the Path of STEM Curriculum Design Based on Cognitive Depth Model. Mod. Educ. Technol. 2021, 31, 112–119. [Google Scholar]
  5. Chen, P.; Tian, Y.; Wang, R. The Research and Enlightenment of Innovative STEM Education Curriculum Based on Design Thinking *—Taking the d.loft STEM Course of Stanford University as an Example. China Educ. Technol. 2019, 391, 82–90. [Google Scholar]
  6. Sha, S.; Wang, F.; Yu, X. Characteristics Analysis and Development Trend Research of STEM Curriculum from the Perspective of Scientific Quality Cultivation. China Educ. Inf. 2021, 503, 47–50+55. [Google Scholar]
  7. Hooshyar, D.; Pedaste, M.; Yang, Y. Mining Educational Data to Predict Students’ Performance through Procrastination Behavior. Entropy 2019, 22, 12. [Google Scholar] [CrossRef]
  8. Qiao, L.; Jiang, F. Cluster Analysis of Learners in massive open online course—A Case Study of “STEM Curriculum Design and Case Analysis” in massive open online course. Mod. Educ. Technol. 2020, 30, 100–106. [Google Scholar]
  9. Qiu, F.; Zhang, G.; Sheng, X.; Jiang, L.; Zhu, L.; Xiang, Q.; Jiang, B.; Chen, P.K. Predicting students’ performance in e-learning using learning process and behaviour data. Sci. Rep. 2022, 12, 453. [Google Scholar] [CrossRef]
  10. Alhothali, A.; Albsisi, M.; Assalahi, H.; Aldosemani, T. Predicting Student Outcomes in Online Courses Using Machine Learning Techniques: A Review. Sustainability 2022, 14, 6199. [Google Scholar] [CrossRef]
  11. Moubayed, A.; Injadat, M.; Nassif, A.B.; Lutfiyya, H.; Shami, A. E-Learning: Challenges and Research Opportunities Using Machine Learning & Data Analytics. IEEE Access 2018, 6, 39117–39138. [Google Scholar] [CrossRef]
  12. Yağcı, M. Educational data mining: Prediction of students’ academic performance using machine learning algorithms. Smart Learn. Environ. 2022, 9, 11. [Google Scholar] [CrossRef]
  13. Abidi, S.M.R.; Zhang, W.; Haidery, S.A.; Rizvi, S.S.; Riaz, R.; Ding, H.; Kwon, S.J. Educational sustainability through big data assimilation to quantify academic procrastination using ensemble classifiers. Sustainability 2020, 12, 6074. [Google Scholar] [CrossRef]
  14. Hussain, A.; Khan, M.; Ullah, K. Student’s performance prediction model and affecting factors using classification techniques. Educ. Inf. Technol. 2022, 27, 8841–8858. [Google Scholar] [CrossRef]
  15. Ban, W.; Jiang, Q.; Zhao, W. Research on Accurate Prediction of Online Learning Achievement Based on Multi-algorithm Fusion. Mod. Distance Educ. 2022, 201, 37–45. [Google Scholar] [CrossRef]
  16. Tao, T.; Sun, C.; Wu, Z.; Yang, J.; Wang, J. Deep Neural Network-Based Prediction and Early Warning of Student Grades and Recommendations for Similar Learning Approaches. Appl. Sci. 2022, 12, 7733. [Google Scholar] [CrossRef]
  17. Zheng, Y.; Gao, Z.; Wang, Y.; Fu, Q. MOOC Dropout Prediction Using FWTS-CNN Model Based on Fused Feature Weighting and Time Series. IEEE Access 2020, 8, 225324–225335. [Google Scholar] [CrossRef]
  18. Xiao, J.; Teng, H.; Wang, H.; Tan, J. Psychological emotions-based online learning grade prediction via BP neural network. Front. Psychol. 2022, 13, 981561. [Google Scholar] [CrossRef]
  19. Song, X.; Li, J.; Sun, S.; Yin, H.; Dawson, P.; Doss, R.R.M. SEPN: A Sequential Engagement Based Academic Performance Prediction Model. IEEE Intell. Syst. 2021, 36, 46–53. [Google Scholar] [CrossRef]
  20. Esteban, A.; Romero, C.; Zafra, A. Assignments as Influential Factor to Improve the Prediction of Student Performance in Online Courses. Appl. Sci. 2021, 11, 10145. [Google Scholar] [CrossRef]
  21. Xiong, J.; Wheeler, J.M.; Choi, H.-J.; Cohen, A.S. A Bi-level Individualized Adaptive Learning Recommendation System Based on Topic Modeling. In Quantitative Psychology; Springer: Cham, Switzerland, 2022; pp. 121–140. [Google Scholar] [CrossRef]
  22. Lin, Q.; He, S.; Deng, Y. Method of personalized educational resource recommendation based on LDA and learner’s behavior. Int. J. Electr. Eng. Educ. 2021. [Google Scholar] [CrossRef]
  23. Xue, Y.; Qin, J.; Su, S.; Slowik, A. Brain Storm Optimization Based Clustering for Learning Behavior Analysis. Comput. Syst. Sci. Eng. 2021, 39, 211–219. [Google Scholar] [CrossRef]
  24. Luo, Y.; Han, X.; Zhang, C. Prediction of learning outcomes with a machine learning algorithm based on online learning behavior data in blended courses. Asia Pac. Educ. Rev. 2022. [Google Scholar] [CrossRef]
  25. Adnan, M.; Habib, A.; Ashraf, J.; Mussadiq, S.; Raza, A.A.; Abid, M.; Bashir, M.; Khan, S.U. Predicting at-Risk Students at Different Percentages of Course Length for Early Intervention Using Machine Learning Models. IEEE Access 2021, 9, 7519–7539. [Google Scholar] [CrossRef]
  26. Ni, Q.; Xu, Y.; Wei, T.; Gao, R. Learning effect model based on online learning behavior data and analysis of influencing factors. J. Shanghai Norm. Univ. Nat. Sci. Ed. 2022, 51, 143–148. [Google Scholar]
  27. Shi, W.; Niu, X.; Zheng, Q. An Empirical Study on the Influencing Factors of Learning Results of Activity-centered Online Courses—Taking the Open University Learning Analysis Data Set (OULAD) as an example. Open Learn. Res. 2018, 23, 10–18. [Google Scholar] [CrossRef]
  28. Wang, J.Y.; Yang, C.H.; Liao, W.C.; Yang, K.C.; Chang, I.W.; Sheu, B.C.; Ni, Y.H. Highly Engaged Video-Watching Pattern in Asynchronous Online Pharmacology Course in Pre-clinical 4th-Year Medical Students Was Associated With a Good Self-Expectation, Understanding, and Performance. Front. Med. 2021, 8, 799412. [Google Scholar] [CrossRef]
  29. Sun, F.; Feng, R. Research on Influencing Factors of Online Academic Achievement Based on Learning Analysis. China Educ. Technol. 2019, 386, 48–54. [Google Scholar]
  30. Mubarak, A.A.; Cao, H.; Zhang, W.; Zhang, W. Visual analytics of video-clickstream data and prediction of learners’ performance using deep learning models in MOOCs’ courses. Comput. Appl. Eng. Educ. 2020, 29, 710–732. [Google Scholar] [CrossRef]
  31. Lim, K.K.; Lee, C.S. Investigating Learner’s Online Learning Behavioural Changes during the COVID-19 Pandemic. Proc. Assoc. Inf. Sci. Technol. 2021, 58, 777–779. [Google Scholar] [CrossRef]
  32. Balti, R.; Hedhili, A.; Chaari, W.L.; Abed, M. Hybrid analysis of the learner’s online behavior based on learning style. Educ. Inf. Technol. 2023. [Google Scholar] [CrossRef]
  33. Ye, M.; Sheng, X.; Lu, Y.; Zhang, G.; Chen, H.; Jiang, B.; Zou, S.; Dai, L. SA-FEM: Combined Feature Selection and Feature Fusion for Students’ Performance Prediction. Sensors 2022, 22, 8838. [Google Scholar] [CrossRef]
  34. Sun, Y. Analysis on the Characteristics of Online Learning Behavior of Distance Learners in Open University. China Educ. Technol. 2015, 343, 64–71. [Google Scholar]
  35. Qiu, F.; Zhu, L.; Zhang, G.; Sheng, X.; Ye, M.; Xiang, Q.; Chen, P.K. E-Learning Performance Prediction: Mining the Feature Space of Effective Learning Behavior. Entropy 2022, 24, 722. [Google Scholar] [CrossRef] [PubMed]
  36. Xu, W.; Ouyang, F. The application of AI technologies in STEM education: A systematic review from 2011 to 2021. Int. J. STEM Educ. 2022, 9, 59. [Google Scholar] [CrossRef]
  37. Fomunyam, K.G. Machine Learning and Stem Education: Challenges and Possibilities. Int. J. Differ. Equ. IJDE 2022, 17, 165–176. [Google Scholar]
  38. Brahim, G.B. Predicting Student Performance from Online Engagement Activities Using Novel Statistical Features. Arab J. Sci. Eng. 2022, 47, 10225–10243. [Google Scholar] [CrossRef]
  39. Shreem, S.S.; Turabieh, H.; Al Azwari, S.; Baothman, F. Enhanced binary genetic algorithm as a feature selection to predict student performance. Soft Comput. 2022, 26, 1811–1823. [Google Scholar] [CrossRef]
  40. Bujang, S.D.A.; Selamat, A.; Ibrahim, R.; Krejcar, O.; Herrera-Viedma, E.; Fujita, H.; Ghani, N.A.M. Multiclass prediction model for student grade prediction using machine learning. IEEE Access 2021, 9, 95608–95621. [Google Scholar] [CrossRef]
  41. Hasan, R.; Palaniappan, S.; Mahmood, S.; Abbas, A.; Sarker, K.U.; Sattar, M.U. Predicting student performance in higher educational institutions using video learning analytics and data mining techniques. Appl. Sci. 2020, 10, 3894. [Google Scholar] [CrossRef]
  42. Zhao, H.; Jiang, Q.; Zhao, W.; Li, Y.; Zhao, Y. An Empirical Study on Early Warning Factors and Intervention Countermeasures of Online Learning Performance Based on Big Data Learning Analysis. E-Educ. Res. 2017, 38, 62–69. [Google Scholar]
  43. Lange, C.; Costley, J. Improving online video lectures: Learning challenges created by media. Int. J. Educ. Technol. High. Educ. 2020, 17, 16. [Google Scholar] [CrossRef]
  44. Tseng, S.-S. The influence of teacher annotations on student learning engagement and video watching behaviors. Int. J. Educ. Technol. High. Educ. 2021, 18, 7. [Google Scholar] [CrossRef]
  45. Rizvi, S.; Rienties, B.; Rogaten, J.; Kizilcec, R.F. Beyond one-size-fits-all in MOOCs: Variation in learning design and persistence of learners in different cultural and socioeconomic contexts. Comput. Hum. Behav. 2022, 126, 106973. [Google Scholar] [CrossRef]
  46. Yurum, O.R.; Taskaya-Temizel, T.; Yildirim, S. The use of video clickstream data to predict university students’ test performance: A comprehensive educational data mining approach. Educ. Inf. Technol. 2022, 28, 5209–5240. [Google Scholar] [CrossRef]
  47. Moran, M.; Seaman, J.; Tinti-Kane, H.; Pearson Learning Solutions and Babson Survey Research Group. Teaching, Learning, and Sharing: How Today’s Higher Education Faculty Use Social Media. 2011. Available online: http://www.pearsonlearningsolutions.com/educators/pearson-social-media-survey-2011-bw.pdf (accessed on 12 May 2023).
  48. Augar, N.; Raitman, R.; Zhou, W. Teaching and Learning Online with Wikis. In Proceedings of the 21st ASCILITE Conference, Perth, Australia, 5–8 December 2014; Available online: https://www.ascilite.org/conferences/perth04/procs/pdf/augar.pdf (accessed on 12 May 2023).
  49. Raković, M.; Bernacki, M.L.; Greene, J.A.; Plumley, R.D.; Hogan, K.A.; Gates, K.M.; Panter, A.T. Examining the critical role of evaluation and adaptation in self-regulated learning. Contemp. Educ. Psychol. 2022, 68, 102027. [Google Scholar] [CrossRef]
  50. Yan, H.; Wang, W. The Comparison and Optimization of STEM Curriculum Quality at Home and Abroad from the Perspective of Interdisciplinary Integration. Mod. Distance Educ. Res. 2020, 32, 39–47. [Google Scholar]
  51. Dong, J.; Wang, F.; Peng, Z.; Zhou, S. Integration Road of STEM Curriculum Oriented by Discipline Core Literacy—Guided by Mathematics Discipline. Mod. Educ. Technol. 2020, 30, 111–117. [Google Scholar]
  52. Ansari, J.A.N.; Khan, N.A. Exploring the role of social media in collaborative learning the new domain of learning. Smart Learn. Environ. 2020, 7, 378–385. [Google Scholar] [CrossRef]
  53. Tsoni, R.; Panagiotakopoulos, C.; Verykios, V.S. Revealing latent traits in the social behavior of distance learning students. Educ. Inf. Technol. 2022, 27, 3529–3565. [Google Scholar] [CrossRef]
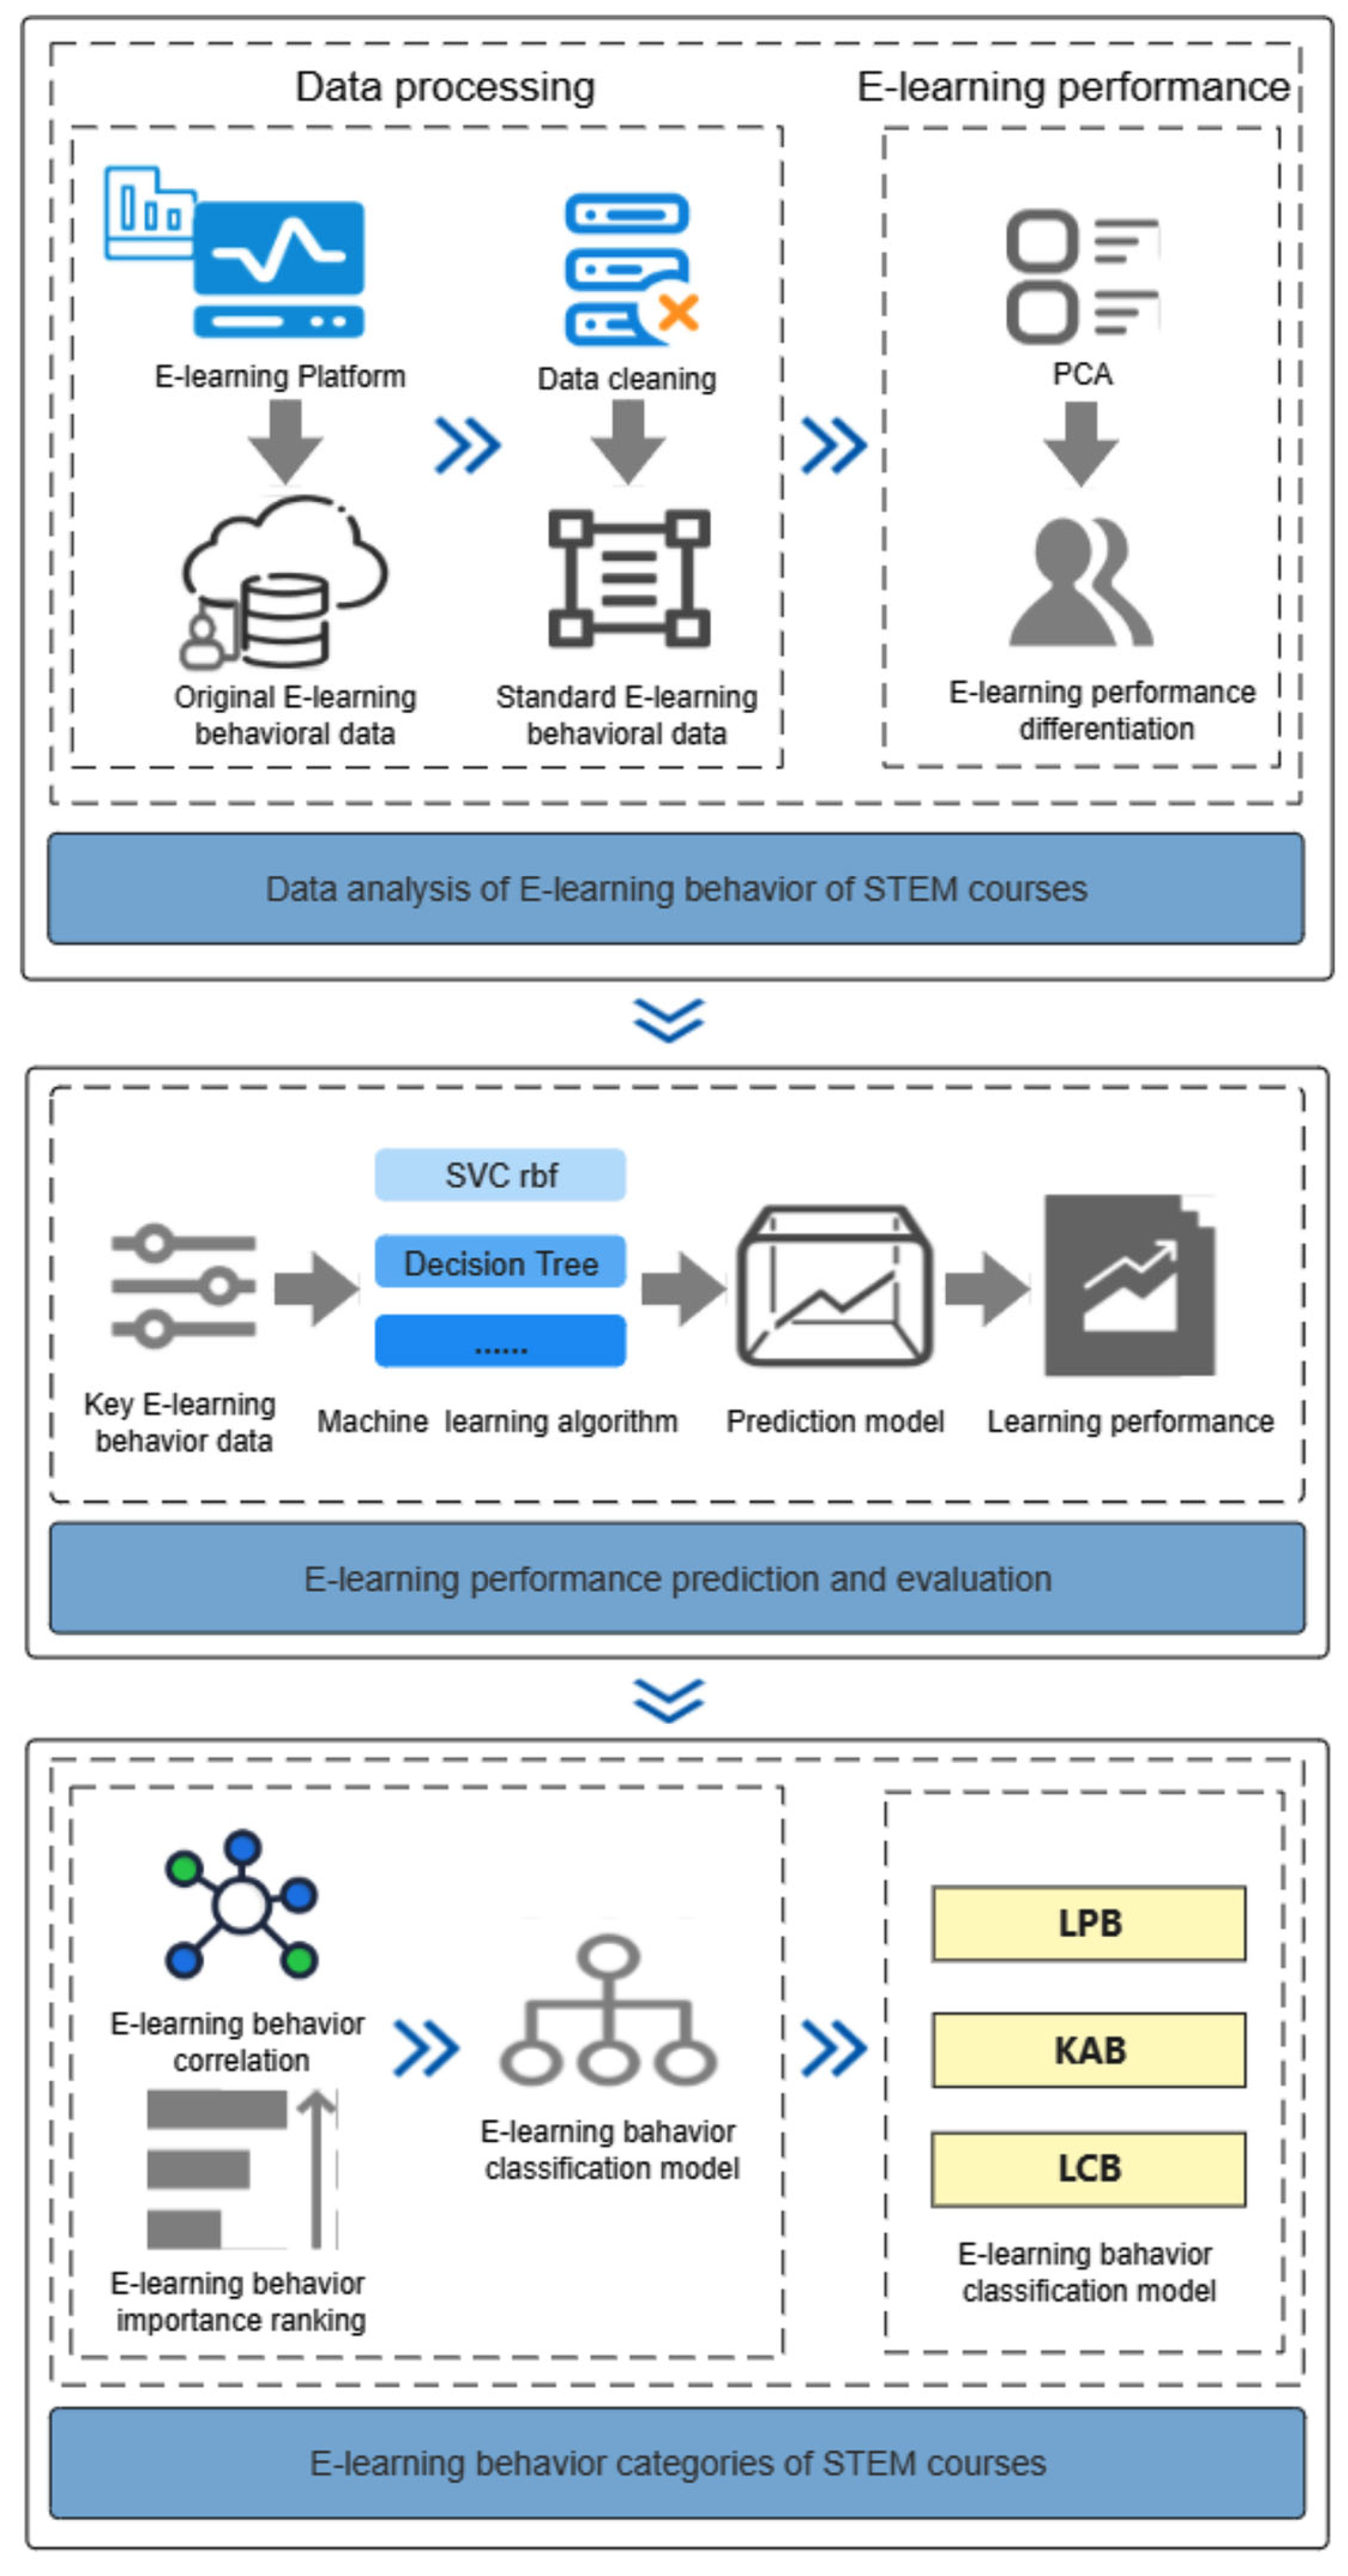
Figure 1. Experimental framework.
Sustainability 15 08235 g001
Figure 2. E-Learning Performance of STEM Course Learners: (a) E-Learning Performance of CCC Course Learners; (b) E-Learning Performance of DDD Course Learners; (c) E-Learning Performance of EEE Course Learners; (d) E-Learning Performance of FFF Course Learners.
Sustainability 15 08235 g002
Figure 3. Predictive Performance of E-Learning of Four STEM Courses.
Sustainability 15 08235 g003
Figure 4. Factor analysis of E-learning behavior of STEM course: (a) factor analysis of E-learning behavior of CCC course; (b) factor analysis of E-learning behavior of DDD course; (c) factor analysis of E-learning behavior of EEE course; (d) factor analysis of E-learning behavior of FFF course.
Sustainability 15 08235 g004
Figure 5. Correlation of E-learning behavior of STEM course: (a) correlation of E-learning behavior of CCC course; (b) correlation of E-learning behavior of DDD course; (c) correlation of E-learning behavior of EEE course; (d) correlation of E-learning behavior of FFF course.
Sustainability 15 08235 g005
Figure 6. Importance Ranking of E-Learning Behavior in STEM Courses: (a) importance ranking of E-learning behavior in CCC course; (b) importance ranking of E-learning behavior in DDD course; (c) importance ranking of E-learning behavior in EEE course; (d) importance ranking of E-learning behavior in FFF course.
Sustainability 15 08235 g006
Figure 7. Learning Behavior Selection Frequency of Four STEM courses.
Sustainability 15 08235 g007
Figure 8. E-learning behavior categories of STEM courses.
Sustainability 15 08235 g008
Table 1. E-learning behavior of STEM courses.
Behavior CodesE-Learning BehaviorExplanation
HPhomepageAccess the main interface of the learning platform
PGpageAccess the course interface
SPsubpageAccess the course sub-interface
DAdataplusSupplementary data
FDfolderOpen folder
HAhtmlactivityWeb activity
CToucontentDownload platform resources
WKouwikiQuery with Wikipedia
RSresourceSearch platform resources
URurlAccess course URL link
DUdualpaneAccess double window
GSglossaryAccess the glossary
FUforumngParticipate in the course topic forum
CAoucollaborateParticipate in collaborative exchange activities
EMouelluminateParticipate in simulation course seminars
QNquestionnaireParticipate in simulation course seminars
QZquizTest
EQexternalquizComplete extracurricular quizzes
RPrepeatactivityRepetitive activity
Table 2. E-learning behavior of four STEM courses.
FactorCCC CourseDDD CourseEEE CourseFFF Course
HP
PG
SP
DA
FD
HA
CT
WK
RS
UR
DU
GS
FU
CA
EM
QN
QZ
EQ
RP
The ✓ refers to the course recording the behavior.
Table 3. Selection and Classification of E-Learning Behavior in STEM Courses.
Learning Behavior CategoryCCC CourseDDD CourseEEE CourseFFF Course
Learning preparation behavior
(LPB)
HP10678
PG107610
SP210410
Knowledge acquisition behavior
(KAB)
DA 10
FD 10
HA 10
CT7169
WK 9108
RS410210
UR6927
DU 18
GS 6 7
Interactive learning behavior
(ILB)
FU3749
CA7927
EM 4 6
Learning consolidation behavior
(LCB)
QN 10
QZ10 410
EQ 5
RP 8
Disclaimer/Publisher’s Note: The statements, opinions and data contained in all publications are solely those of the individual author(s) and contributor(s) and not of MDPI and/or the editor(s). MDPI and/or the editor(s) disclaim responsibility for any injury to people or property resulting from any ideas, methods, instructions or products referred to in the content.