Article

The Effect of Sustainable Human Resource Management Practices on Customer Satisfaction, Service Quality, and Institutional Performance in Hotel Businesses

by
Christos Papademetriou
1,
Sofia Anastasiadou
1,2,* and
Stylianos Papalexandris
2,3
1
Department of Economics and Business, Neapolis University Pafos, Pafos 8042, Cyprus
2
Department of Midwifery, School of Health Sciences, University of Western Macedonia, 50200 Ptolemaida, Greece
3
Department of Occupational Therapy, School of Health Sciences, University of Western Macedonia, 50200 Ptolemaida, Greece
*
Author to whom correspondence should be addressed.
Sustainability 2023, 15(10), 8251; https://doi.org/10.3390/su15108251
Submission received: 7 April 2023 / Revised: 4 May 2023 / Accepted: 8 May 2023 / Published: 18 May 2023
(This article belongs to the Section Sustainable Management)

Abstract

:
The purpose of the current research seeks to explore the influence of sustainable Human Resource Management (HRM) practices on customer satisfaction, service quality, and institutional performance in inner-city hotel businesses. The information was gathered by studying Cypriot inner-city hotels. A quantitative method was used to gather data from HRM managers, staff, and patrons at every inner-city hotel under study. The questionnaires were specifically employed by the researchers. Based on the findings of this study, human resource management techniques have a substantial effect on customer satisfaction. The most important relationship was discovered between customer satisfaction and institutional performance, which is an important result. This finding has tremendous importance since it is the first time that it has been demonstrated in a study pertaining to the inner-city hotel business. Customer satisfaction is influenced by both HRM and service quality practices. Ultimately, this research supports the close association between HRM practices and hotel performance. Both human resource management methods and service quality practices have shown their impact on client happiness. Lastly, the research provides evidence for the close relationship between hotel performance and HRM practices.

1. Introduction

Cyprus’s tourism industry has traditionally been an important contributor to the island’s economy. Almost 15% of the island’s GDP is generated by tourism and hospitality [1]. The Cyprus hotel industry, on the other hand, faces enormous hurdles because of the unpredictable and constantly altering external setting in which it functions. Customers’ expectations for on-time services and, of course, high quality puts organizations under strain because of globalization, making them unable to handle their hotel functions alone. Due to increased competition, many hotels try to find new paths, first to retain their existing customers and also to acquire their competitors’ customers.
Sustainable HRM is an important function of every company, but it is mostly important for hotels that pay attention to customer service and employee satisfaction. With efficient people management practices, the significance of sustainable HRM is acquiring and maintaining a required competitive advantage from a large number of satisfied, committed, and valuable employees [2,3]. This concept is frequently used in institutions for human outcomes that benefit from long-term sustainable development [4]. Therefore, human resources are frequently regarded as among the most valuable resources by hospitality businesses. HRM methods that enhance customer happiness, service quality, and hotel performance are practical ways for hoteliers to achieve hoteliers advantages. In contrast, service quality is frequently insubstantial and inconsistent [5]. Due to these two characteristics, service quality evaluation is not primarily objective and is dependent on the opinions of the consumers. Moreover, the effective interaction between customers and front-line workers has had a major effect on the overall service quality [6]. For this reason, there should be a professional approach to sustainable management procedures, especially in human resource development. The aforementioned approach is very important if we take into consideration the personnel problems that the Cypriot hotels are facing at the moment. Nicolaou [7] clearly explained how employers face acute skill shortages, a tighter mindset (behavior), and high levels of personnel turnover as a result of the significant challenges in attracting and maintaining excellent staff. Numerous studies have shown the importance of customer-contact personnel in developing and delivering exceptional services [8,9,10]. Many studies have demonstrated the significance of experts on customer service in creating and delivering great amenities [11]. Much has been published in HRM literature regarding HRM strategies and their possible effect on institutional performance [12,13,14,15,16,17]. However, the aforementioned studies did not take into consideration institutional performance in terms of customer satisfaction and staff service quality. The present research aims to fill this gap in the literature. This study contributes to the management community by providing evidence that implementing sustainable HRM practices can enhance service quality and, consequently, hotel performance. It emphasizes the value of efficient hotel service as a factor in customer enjoyment and a predictor of the hotel’s performance. The current study strengthens the field of human resource management by providing evidence of a positive correlation between institutional performance, customer happiness, staff service quality, and sustainable HRM practices. Taking into consideration the above, this paper examines the association among HRM techniques, client satisfaction, service quality, and institutional performance in the Cypriot inter-city hotel industry. The parts that follow examine the chosen literature on HRM and customer satisfaction, HRM and service quality, and subsequent metrics/constraints in the hotel industry, as well as research. The next section is about the research methodologies. Finally, the results are discussed and analyzed. This study concludes by pointing out some practical and theoretical implications and recommendations for research projects in the future.

2. Literature Review

For decades, service quality has appeared as a crucial factor in the hotel sector. Thus, hoteliers must comprehend client prospects and thoughts, as well as the elements that affect their assessment and satisfaction of the services provided to them [18]. Meanwhile, as previously stated, service quality focuses on which way to reach customers’ hopes/expectations. Customers’ hopes/expectations include a wide range of service characteristics. These characteristics influence their purchase intent and perception of service quality [19]. Following that, clients’ thoughts on the service quality provided are typically measured by the end of the service [20]. In the hotel sector, by offering the best quality of service you can achieve greater customer satisfaction and positive impacts on clients’ behavioral intents, e.g., consistency and greater profits for the service provider [21]. Interestingly, [11] investigated the impact of supposed quality on customer happiness and supported that an improvement in the quality of service can enhance customer satisfaction.
HRM practices are human resource related management tasks such as human resource planning, staffing, training of employees, selection, organizational performance and evaluation, reward system, and development of employees [22,23,24]. Ref. [6] defines HRM systems as interrelated HR activities that guarantee that workers take a wide range of exceptional competencies and talents, which are used to achieve the company’s mission and goals.
Likewise, the socialization of HRM approaches has been identified as a conduit for increasing information and transferring knowledge, leading to a more comprehensive understanding of different levels of demand and customer satisfaction [25]. In the tourism industry, a hotel should incorporate the best practices to improve the competences of its employees, which are critical for a hotel’s existence. The best HRM practices were identified as a critical factor in gaining a competitive advantage [26]. Appropriate HRM plays a significant role in the growth of employee commitment, which aids the achievement of organizational objectives [27]. Human resource management practices may be a significant cause of employee happiness, resulting in lower income, lower absenteeism, and greater employee devotion to institutions [28].
Institutional performance is defined as how a company or organization performs in terms of the current business market. A profit-making organization with effective processing can be considered successful. Choosing the right human resources and keeping employees motivated are critical components of any organization’s human management process. HRM is the foundation of any business’s high performance [29].

2.1. Relationship among Sustainable HRM Practices and Service Quality

HRM plays a critical role in ensuring high-quality service standards [30]. Not remarkably, the primary role of quality of service excellence and reliability in pursuing service quality and management programs is well recorded and stems from the firm’s service quality strategic plan [31]. A vast amount of human resource researchers have recently stated that, in the hotel sector, quality enhancement must focus on selection, training, development, and remuneration packages [14,32,33,34,35]. Additionally, it is argued that in the hotel sector, effective HRM may boost strategic advantage [36]. Hotel contract workers, according to [37], should be sufficiently trained to be in a position to deliver an outstanding service. Existing HRM research discovered a positive interconnection among customer judgements of institutional service effectiveness and employee insights of business HR procedures in the hotel industry [38,39,40]. According to research, HRM practices help organizations improve the quality of their services. Ref. [41] conducted an observational investigation of the relationship between HRM practices and quality of service in hotel companies. Human resource practices are critical for the implementation of quality strategies, and, as [42] stated, the quality of human performance is the most crucial component in quality control. This helped us to come up with the following research question:
“Are the sustainable HRM practices positively connected to the growth of quality of service in hotel sector?”
Thus, the hypothesis to be investigated is:
H1: Sustainable HRM practices have a strong correlation with quality of service.

2.2. Relationship among Customer Happiness and Service Quality

The existing literature has expansively underlined the robust relationship between customer satisfaction and service quality [43,44,45]. Customer happiness is a wide feeling that is influenced by the expenses incurred, quality of the service or product, and other exterior and individual factors [46]. According to Nunkoo et al. [44,47], customer satisfaction necessitates the experience of service and is influenced by service quality awareness. Client satisfaction is critical for success in the service business, particularly in the hospitality industry. Bitner and Hubbert [48] define customer satisfaction as the consequence of both quality of service experiences and personal service activities. Additionally, Xie [49] asserted that attaining and maintaining a high degree of client happiness provides various benefits to firms. Furthermore, customer satisfaction is always a corporate aim because it supports an increase in market share [50,51,52]. To achieve customer satisfaction, a company must offer services and goods that cater to particular levels of the supposed customer value. For example, clients are satisfied when their awareness of the quality of service fits their prospects. Moreover, customer satisfaction can be reached if the quality of the service they experience corresponds to the price of the service [53]. According to Olorunniwo, Hsu, and Udo [54], hotel managers must comprehend what consumers want and how they evaluate hotel quality of service so as to successfully run a hotel and provide a satisfying experience to customers. According to previous research, customer happiness has emerged as a significant factor in evaluating institutional performance; similarly, it is regarded both as the reference point for performance standards and as a potential benchmark of quality results for the company [55]. The measurement of customer satisfaction can be succeeded by taking into consideration enjoyment, interest, anger, surprise, doing the right thing, and wise decision. These variables are critical for hotel businesses because client happiness proved to be the most important factor in determining service quality [56]. Back and Lee [57] and Schiffman and Wisenblit [58], agree that client devotion grows when customers have a positive experience with the alleged quality of service. Because of these ties, clients support the hotel by making positive recommendations. There are two forerunners in client devotion: first, a favorable experience of the world of the quality of service, and second, a good opinion of the business. Guests’ future actions will be influenced by the establishment of the hotel. Customer happiness has an emotional reaction, and differences in perceived service levels depend on previous ones [59]. Client loyalty is a rational development process. Guests evaluate the establishment after analyzing their experience and having an emotional reaction to the service experience. According to the findings of [59], there appear to be close relationships among (a) customer loyalty and service quality, (b) service quality and emotional reactions from customers, and (c) positive client reaction and loyalty. Thus, the second research question of this study is as follows:
“Is there any correlation between service quality and customer happiness in hotel sector?”
Thus, the hypothesis to be investigated is:
H2: Quality of service has a strong correlation with customer satisfaction.

2.3. Relationship among Sustainable HRM Practices and Company Performance

According to Tomic et al. [60], in the hotel sector, there is a favorable link between the quality of service and organizational performance. Furthermore, according to Katou and Budhwar [61], HRM activities of skills and behaviors manage the correlation among institutional performance and development and remuneration of employees. Chand [62] discovered that HRM practices have a positive effect on offering optimal and effective service, which leads to enhanced client happiness and consequently enhances institutional performance.
HRM methods, according to several researchers, have a considerable effect on quality service delivery, service organization performance, and client happiness [14,63,64,65,66,67]. These studies were conducted primarily with respect to single human resource practices instead of using variables such as customer satisfaction and service quality; therefore, those results may be considered biased. Consumer satisfaction, on the other hand, has been discovered to be a significant predictor of company cost-effectiveness as a way of continuous positive behavior of clients and loyalty [67]. Thus, this study, also considered the effect of human resource management on hotel performance. Based on this, the following research question was derived:
“Does institutional performance correlate in any way with sustainable HRM practices?”
Thus, the hypothesis to be investigated is:
H3: Sustainable HRM practices have a strong correlation with institutional performance.

2.4. Relationship among Sustainable HRM Practices, Service Quality, Customer Happiness, and Company Performance

Several studies have acknowledged the importance of understanding the relationship between consumers, employees, and institutional performance [68]. According to [69], content customers spend extra money, which increases the institutional earnings and profits. Gill, Samantha, and Samantha [70] supported that HR practices play an important role in changing workers’ behavior in order to incorporate competitive strategies. According to the literature, changing employee behavior and attitudes leads to increased customer satisfaction in businesses, especially in service organizations. Thus, the final research question of the study is as follows:
“Are sustainable HRM practices, customer satisfaction, service quality and hotel company performance related?”
Thus, the hypotheses to be investigated are:
H4: Sustainable HRM practices have a strong correlation with customer satisfaction.
H5: Quality of service has a strong correlation with institutional performance.
H6: Institutional performance has a strong correlation with customer satisfaction.

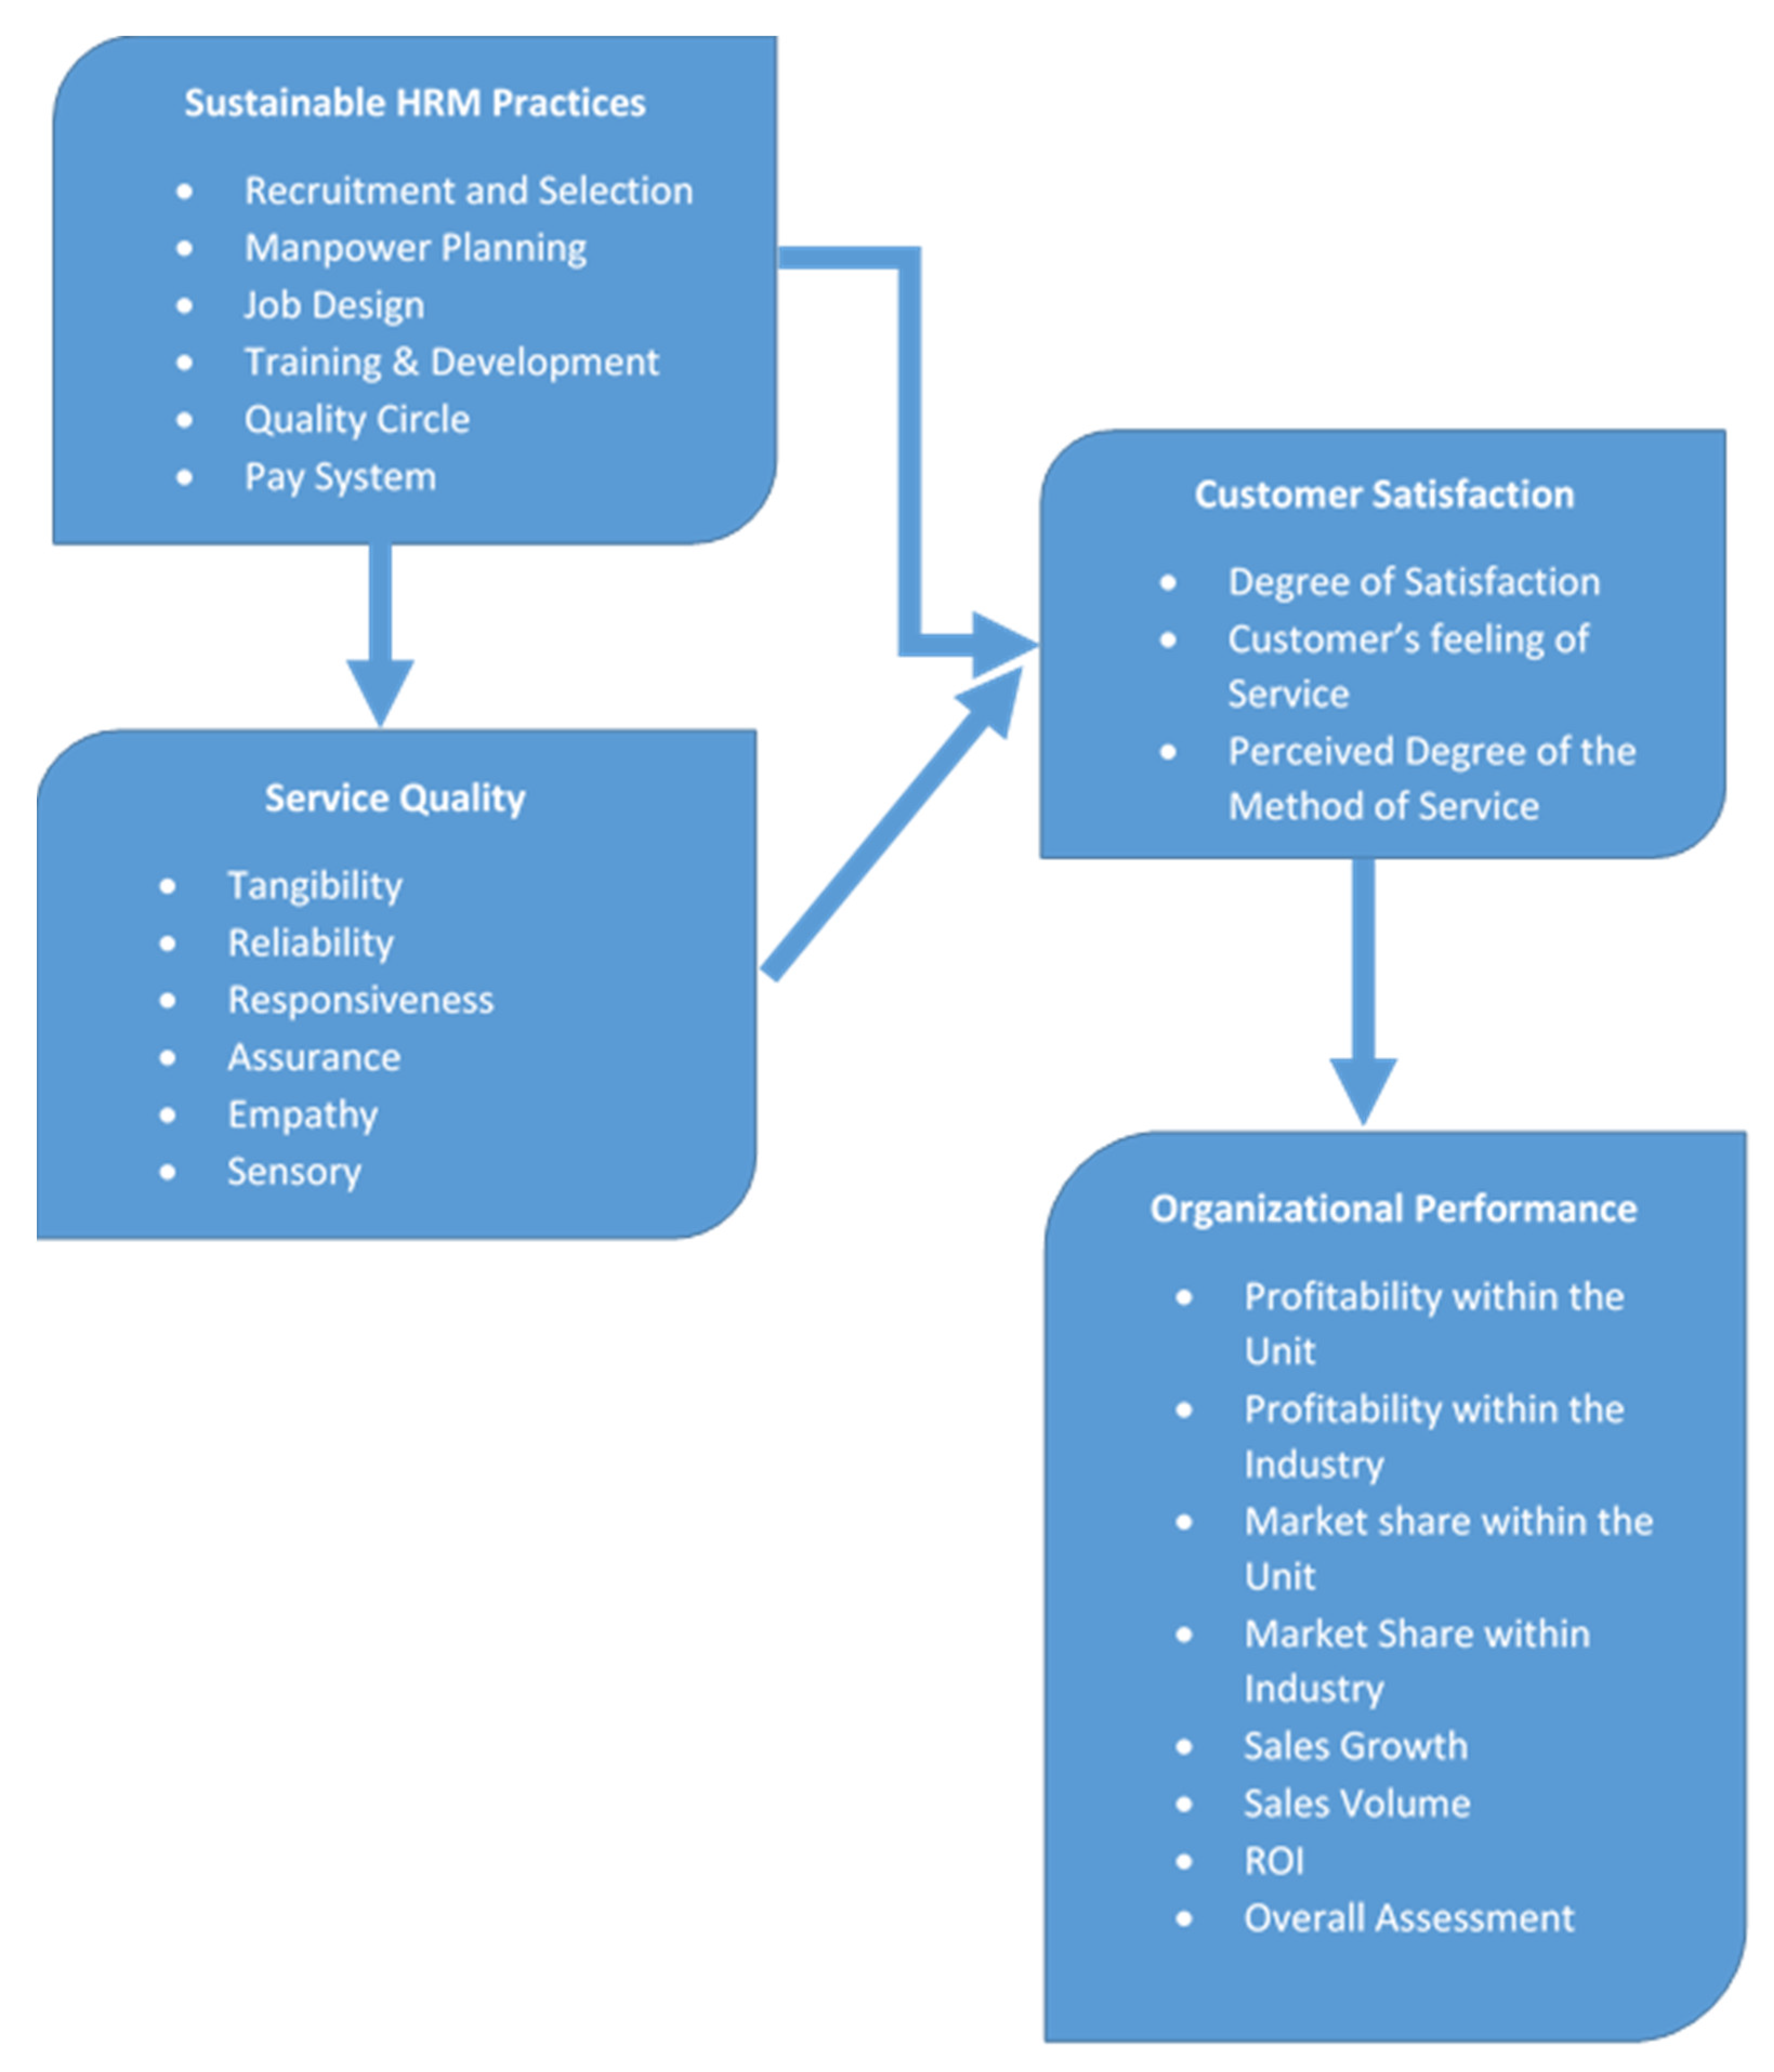
3. Theoretical Model

Social exchange theory [71] was used in this study in order to examine the causal connections between the independent and dependent elements. This concept clarifies human performance and the relationship structures that result from it. It suggests that when hotel employees feel that their employers are investing in them, they are likely to reciprocate to their hotels with extra-role activities. When employees have access to sustainable resources at work, they feel obligated to defend their hotels by providing an excellent service quality [72]. In consequence, high levels of quality service lead to higher customer satisfaction and, therefore, higher organizational performance. In order to comprehend how green-friendly hotels use sustainable human resource management to attain superior performance and competitive advantage and subsequently obtain value in return to their company, social exchange theory was chosen. The idea of HRM has developed to help organizations reach the necessary levels of novelty, the flexibility of the organization, the quality of the product, customer happiness, labor relations, and overall performance of the organization [33,52,73,74,75,76,77,78]. Numerous researchers in the existing Human Resource literature have emphasized the necessity of developing staff dedication to quality, encouraging employees to demonstrate ownership of quality, focusing on customer happiness, creating a climate for the creation of novel and imaginative products/services, and enhancing the performance of the organization [14,33,73,75,77,79,80]. It is evident that HRM is a management strategy that fosters strong relationships between and within organizations with different business aspects. Actually, it has been acknowledged particularly that in order to achieve a competitive edge, HRM is increasingly emphasizing divide-departmental collaboration of operations (improve client happiness, improve service quality, and enhance hotel performance) because they are key factors in the flourishing of the hotel sector. Given these various facts, this study suggests that sustainable HRM practices in the hospitality sector will enhance the efficacy of providing quality service, client happiness, and, as a result, improve the performance of the hotel. Additionally, the best and most effective sustainable HRM practices will have an immediate effect on how well hotel staff members can provide the best services. The following figure shows the theoretical model of this research.

4. Methodology

According to [81], “study design is a sketch that narrates when, how and where data are to be collected and analyzed”. According to Kurdi, Alshurideh, and Alnaser [82], the questionnaire is a method of collecting data by employing a number of questions to elicit responses and useful facts from respondents. In this research, a questionnaire was employed to gather and assemble information from a large group of people. The main reasons for choosing a quantitative method over a qualitative method are as follows: First, it the quantitative method offers ease of data collection. The delivery and collection of questionnaires are not time-consuming, difficult procedures, in contrast to qualitative methods. Second, it is the generalizability of the results. The findings are supported by larger samples that are representative of the population. The quantitative method gives you the opportunity to have a vast amount of data and, therefore, to be in position to generalize the results, an option that is not offered in qualitative research. Lastly, by using the quantitative method, a replication of the research can be made because of its high reliability. Consequently, other researchers can test or enrich the findings of the present study by conducting future research [83,84].
Creswell [85] defined a population as a group of people who share at least one characteristic that the researcher is interested in. According to Welman and Kruger [86], “target population is a number of feasible respondents that are considered in the research study”. Before writing up the full administration of the aforementioned questionnaire, a pilot study was conducted by drafting a survey with a small number of potential survey participants to assist in identifying problems. As in Belias et al. [87], it is critical to test the instrument to see if respondents understand the questions and how long it will take to complete before the questionnaire is administered. In this research project, a pilot survey was administered to a randomly selected couple of attendees before the final questionnaire was administered to the study population. The sample for this research included 12 human resource managers, 360 workers, and 360 customers in inner-city hotels in Cyprus. The research was based on inner-city hotels because they had more convenient geographical access for the researchers. The survey approach was selected because it is the most effective method for gaining access to a high pool of respondents; thus, the available data permitted the adoption of the questionnaire. The hotel samples were picked from the Cypriot Ministry of Tourism because it keeps relevant hotel company records. We approached the human resource managers of a variety of inner-city Cypriot hotels (more than 18 hotels) to obtain a sample. During February 2023, questionnaires were given to HR managers of the hotels under study. Each HR manager received 50 questionnaires from employees, 50 questionnaires from customers, and 1 questionnaire from HR management. We humbly requested the HR managers to distribute the questionnaires to employees and customers. The surveys were collected by HR managers and placed in a special box at the reception of each hotel. Afterwards, the researcher collected the questionnaires to proceed with data analysis.
Hotel companies returned 30 staff and 30 client questionnaires for the total sample. Thus, valid surveys were returned by 12 HR managers, 30 employees, and 30 guests from each hotel. Overall, we collected 360 questionnaires from employees and 360 from clients.
It is critical to consider respondents’ concerns and ethics when conducting research with human participants. Thus, the present research received both an Institutional Review Board Statement and Informed Consent Statement. First, the study was reviewed and approved by the Institutional Review Board of Neapolis University Pafos. Afterwards, the research received ethical approval from each hotel and participant. Prior to any data collection procedure, the researchers provided each hotel and participant with an ethics consent form. The research took place after the collection of these contest forms. Both hotels and participants provided their ethical approval. Refs. [88,89] identified essential ethical considerations for research projects as fully informed members about the research’s goals and objectives, techniques, and importance of the research, voluntarily granting consent, and exercising their withdrawal rights. Respondent anonymity and confidentiality were all protected in this study. Respondents were asked not to reveal their names when the questionnaire was administered in order to avoid traceability or identification. Furthermore, participation during this research was entirely voluntary, and participants had the opportunity to withdraw whenever they wanted. These were considered to ensure that participants were at ease when answering the questionnaire.

4.1. Measure Development

The operationalization of the constructs was based on a literature review that identified already established and tested scales. Multi-item measures were used to assess all the components. The scales below were employed foresightedly:
HRM Practice: Using a 7-point Likert scale ranging from 1 ‘Strongly Disagree’ to 7 ‘Strongly Agree’, we assessed the 27 standing HRM practices. This Likert scale integrates the six crucial features of human resource management practices as presented in the bibliography review (for example [17,18,19,20]): (a) manpower planning, (b) staffing and selection, (c) training and expansion, (d) job design, (e) pay system, and (f) quality.
Service Quality: SERVQUAL is essential when discussing service quality. The service quality questionnaire, created by Parasuraman et al. [90] and cited in [91,92], aids in gathering clients’ thoughts on the quality of service. The SERVQUAL questionnaire seeks to ascertain clients’ service expectations versus delivered services. This model was created as a tool for evaluating service industry performance. Its purpose was to assess dependability, ability to respond, assuredness, empathy, and tangibles [93]. An organization should employ the data gathered from a SERVQUAL questionnaire to lead internal modifications in order to advance customer amenities [94]. According to Jain and Gupta [95], the SERVPERF scale has fewer elements to investigate and therefore to support, but SERVQUAL is used in a wider range of applications. SERVPERF’s usefulness in several sectors was confirmed in [96]. Nevertheless, both scales are equally important in measuring quality of service tools, with SERVQUAL pointing to the start of quality of service, research, and literature [95,97]. Items for measuring service quality were derived from previous research [98,99,100,101,102]. Fifteen items were selected from SERVQUAL’s 22 items (three for each of the five features) in order to shorten the survey items and assess the sensory factor. The components of service quality were scored on a 7-point Likert scale, with 1 representing “Strongly Disagree” and 7 representing “Strongly Agree”.
Customer happiness: In this study, client happiness was assessed using three factors that were derived from research by [99,103,104]. These parameters are (a) the level of a client’s experience with the hotel, (b) the level of the supposed technique of service, and (c) the degree of pleasure with the client’s decision to support the business. For this, a 7-point Likert Scale method was used, starting from 1 representing “Completely Dissatisfied” and 7 representing “Completely Satisfied”.
Institutional performance: Researchers used a variety of institutional performance variables such as ROI likened to hotel industry average, profitability against hotel industry average, sales volume likened to business unit goals, profitability likened to business unit objectives, market shares compared to hotel industry average, overall assessment of company performance likened to hotel industry average, and sales growth likened to hotel industry average. Previous research [14,105,106] discovered an important association between objective and subjective measures of performance, which were assessed by adopting the philosophy of a perception score of a hotel’s effectiveness. The above metrics were used in this study to assess the hotels’ performance in Cyprus. The hotel components were assessed on a 7-point Likert scale, with 1 representing “Strongly Disagree” and 7 representing “Strongly Agree”.

4.2. Statistical Hypotheses

This research aims to assess the impact of sustainable HRM methods on customer satisfaction, service quality, and institutional performance in the Cypriot inner-city hotel sector. We argue that since the theoretical foundations of the research model were founded on social exchange theory, hotels that employ sustainable human resource management would thereafter ensure successful outcomes. This study investigates, as already mentioned, the following statistical hypotheses:
H1: Sustainable HRM practices have a strong correlation with quality of service.
H2: Quality of service has a strong correlation with customer satisfaction.
H3: Sustainable HRM practices have a strong correlation with institutional performance.
H4: Sustainable HRM practices have a strong correlation with customer satisfaction.
H5: Quality of service has a strong correlation with institutional performance.
H6: Institutional performance has a strong correlation with customer satisfaction.

4.3. Statistical Methodology

For the data analysis, the Principal Components Analysis (PCA) was used to evaluate the research instruments for their reliability and validity. The SPSS.v22 statistical software was used for this purpose (University of Western Macedonia, Kozani, Greece). Cronbach’s alpha coefficients for the scales’ conceptual components or latent variables were evaluated using the SPSS.v22 statistical software, as well as Eigen values, % Variance, Loadings, and Communalities of each construct and its items. In addition, STATA software was used to evaluate whether the measurement model matched the observed data presented. The indices Χ2/df, CFΙ, GFΙ, RΜSΕA, AGFΙ, and ΙFΙ were used for this purpose. The indices Composite Reliability (CR) and Average Variance explained (AVE) were used to evaluate the scales’ reliability with the help of STATA software. Furthermore, Implicative Statistical Analysis (ASI) was used to present respondents’ opinions. The software CHIC was used for this aim. Similarity Tree, Hierarchy Tree, and Implicative Graph are released by software CHIC.

5. Analysis and Discussion

Cronbach’s alpha coefficient (α), Composite Reliability (CR), and Average Variance Explained (AVE) were considered in order to evaluate the reliability of the chosen instruments. For the HRM practices scale, α equals to 0.968. Cronbach’s alpha coefficients for its conceptual components or latent variables entitled Job design, Recruitment and selection, Training and development, Manpower planning, Pay system, and Quality circle are greater than the cutoff point of 0.70. Coefficients α regarding manpower planning, selection and recruitment, training and development, job design, pay system, and quality circle are 0.901, 0.871, 0.897, 0.891, 0.848, and 0.906, respectively [107,108,109,110,111,112,113], as they are presented in Table 1.
Composite reliability (CR) for manpower planning, selection and recruitment, training and development, work design, pay system, and quality circle is 0.946, 0.927, 0.932, 0.927, 0.942, and 0.940, respectively. All CR values appeared greater than the 0.7 cutoff mark, indicating internal consistency [107,108,109,110,111,112,113]. For manpower planning, selection, and recruitment, development and training, job design, pay system, and quality circle the average variance extracted (AVE) was 0.946, 0.927, 0.932, 0.927, 0.947, and 0.940, respectively. AVE values more than 0.5 were deemed satisfactory [114,115,116,117,118,119,120,121,122,123]. (Table 1). The following indices were satisfactory, and they demonstrated that the instrument validity named construct validity related to the instrument of HΜR Practices [82,114,115,116,117]: Eigenvalue, % Variance, Loadings, and Communalities (Table 1). The measurement model (Χ2/df = 0.71, CFΙ = 0.95, GFΙ = 0.94, RΜSΕA = 0.03, AGFΙ = 0.90, ΙFΙ = 0.95) matches all data that were observed.
For the Service Quality scale, the Cronbach’s alpha coefficient was 0.882. Its conceptual constructs, Reliability, Tangibles, Responsiveness, Empathy, Assurance, and Sensory, have Cronbach’s alpha coefficients greater than 0.70. Reliability, Responsiveness, Tangibles, Assurance, Empathy, and Sensory have Cronbach alpha coefficients of 0.903, 0.877, 0.831, 0.805, 0.811, and 0.808 [107,108,109,110,111,112,113]. (Table 2). Tangibles, Reliability, Empathy, Assurance, Responsiveness, and Sensory have composite reliability (CR) values of 0.946, 0.930, 0.941, 0.964, 0.936, and 0.953, respectively, which are values that are larger than 0.70, and consequently show internal consistency [107,108,109,110,111,112,113]. Reliability, Responsiveness, Tangibles, Empathy, Assurance, and Sensory have AVEs of 0.854, 0.817, 0.842, 0.898, 0.831, 0.910, respectively. AVE’s rates are bigger than the value of 0.5, that is, the limit acceptable points are regarded as satisfactory [107,108,109,110,111,112,113]. (Table 2). The following indices are acceptable and demonstrate the built validity of the Service Quality scale [107,108,109,110,111,112,113]: Eigenvalue, % Variance, Loadings, and Communalities (Table 2). The measurement model (Χ2/DF = 1.68, CFΙ = 0.95, GFΙ = 0.94, RΜSEA = 0.04, AGFΙ = 0.90, ΙFΙ = 0.95) matched all data that were observed [107,108,109,110,111,112,113,114,115,116,117,118,119,120,121,122,123].
For the Hotel Performance scale, the Cronbach’s alpha coefficient was 0.824. Hotel Performance has a composite reliability (CR) of 0.973. This number is above the threshold point of 0.7, indicating internal consistency [94,95,96,97,98,99,100,101,102,103,104,105,106,107,108,109,110,111]. The average extracted variation (AVE) for an acceptable Hotel Performance scale was 0.817 [94,95,96,97,98,99,100,101,102,103,104,105,106,107,108,109,110,111] (Table 3). The following indices are tolerable and demonstrate the built validity of the Service Quality scale [94,95,96,97,98,99,100,101,102,103,104,105,106,107]: Eigenvalue (11.614), %Variance (85.722), Loadings, and Communalities (Table 3). The measurement model (Χ2/DF = 1.65, CFΙ = 0.95, GFΙ = 0.92, RΜSΕA = 0.035, AGFΙ = 0.90, ΙFΙ = 0.95) [107,108,109,110,111,112,113] matched the observed data presented in Table 3.
For the Hotel Performance scale, coefficient a counts for internal consistency, equals to 0.896 while for the instrument referring to Customer Satisfaction, the Composite reliability (CR) is 0.920. This number above the threshold point of 0.7, indicating internal consistency [107,108,109,110,111,112,113]. With a Customer Satisfaction scale that is rated satisfactory [107,108,109,110,111,112,113], AVE counts for 0.793. (Table 4). The following indices are tolerable and demonstrated the built validity of the Service Quality scale [107,108,109,110,111,112,113]: Eigenvalue is equal to 5.209, Variance to 79.871, Loadings are above 0.800 and Communalities are larger than 0.700, (Table 4).
Hypotheses testing: Correlation analysis confirms the six null hypotheses given. Human Resource Management techniques, in particular, are substantially connected with service quality, as the Pearson correlation coefficient r equals 0.831, which is significant (p < 0.001); institutional performance, as the Pearson correlation coefficient r equals 0.893, which is significant (p < 0.001); and customer happiness, as the Pearson correlation coefficient r equals 0.905, which is significant (p < 0.001). As a result, the null hypotheses Ho3, Ho4, and Ho1 are all admissible. In the same vein, Nazir and Islam [124] proved that sustainable HRM practices a have positive impact on employee engagement, which leads to customer satisfaction. These findings also support the research of Chand and Katou [14], who proved a strong correlation between HRM and hotel performance. Furthermore, service quality is substantially associated with organizational success, as the Pearson correlation coefficient r equals 0.833, which is significant (p < 0.001), and client happiness, as the Pearson correlation coefficient r equals 0.907, which is significant (p < 0.001). As a result, the null hypotheses Ho2 and Ho5 are viable. This result is in accordance with the study of Islam et al., (2019), which supported that service quality has a positive impact on customer satisfaction. Lastly, consumer satisfaction is substantially connected with organizational success, as the Pearson correlation coefficient r equals 0.981, which is significant (p < 0.001). As a result, the sixth null hypothesis, Ho6, was satisfactory (Table 5). Similarly, previous studies have underlined the connection between customer happiness and hotel performance [76,77,80]. The results also confirm earlier studies suggesting that improving attention to client requests can increase customer happiness/value, which can therefore have a beneficial impact on the profitability of the business [64,125,126,127,128,129,130,131]. In addition, HRM is substantially connected with Service quality, as the Pearson correlation coefficient r equals 0.831, which is significant (p < 0.001); with Hotel performance, as the Pearson correlation coefficient r equals 0.893, which is significant (p < 0.001); and Customer Satisfaction, as the Pearson correlation coefficient r equals 0.905, which is significant (p < 0.001).
Implicative statistical Analysis (ASI): ASI results released a similarity tree, a hierarchy tree, and an Implicative Graph. The implication strength of involvement was molded by the implicative relationships among the variables in the command of significance. Moreover, the hierarchy dendrogram or hierarchy tree and implicative diagram present the path of such relations [132]. ASI can enable the merging of the most significant variables according to responders’ answers [133]. ASI produces and generates association rules. It highpoints bents in a set of properties [134] based on a probabilistic model. Finally, it shows the way respondents deal with and treat these associations among variables and conceptual constructs of the study. Thus, the data were analyzed with the ASI methodology and CHIC software was used [133].
Similarity tree: The similarity tree produces grouping of items based on the selection subscale of the HRM scale, Quality Service of the SERVQUAL scale, Hotel Performance of the Hotel Performance scale, and the Satisfaction scale (Figure 1). The similarity tree (Figure 2) shows three similarity subgroups (Group A, Group B, and Group C). The first similarity subgroup (Group A) presents relations regarding the corresponding similarity among items ((TANG ASSUR) ((REL RESP) (EMP SEN))) similarity: 0.1966 connected with the SERVQUAL scale conceptual constructs named Tangibles (TANG), Assurance (ASSUR), Reliability (REL), Responsiveness (RESP), Empathy (EMP), and Sensory (SEN). The strongest similarity in this group is between the items (REL RESP) (similarity: 0.822425) connected with Reliability (REL) and Responsiveness (RESP) with conceptual constructs’ items. The second strongest similarity in this group is between the items (TANG ASSUR) (similarity: 0.816507) connected with Tangibles Assurance conceptual constructs’ items. The third strongest similarity in this group is between the items (EMP SEN) (similarity: 0.774239) connected with Empathy and Sensory. The ((REL RESP) (EMP SEN)) items of the first two groups also have a medium similarity relation ((REL RESP) (EMP SEN)) (similarity: 0.453427). This means that Reliability, Responsiveness, Empathy, and Sensory conceptual constructs have medium importance. On the contrary, the whole group A ((TANG ASSUR) ((REL RESP) (EMP SEN))) similarity: 0.1966) has law similarity, which means that Tangibles and Assurance have law similarity with the rest of the conceptual constructs named Reliability, Responsiveness, Empathy, and Sensory.
The other similarity subgroup (Group B) presents similarity relations among items connected with Customer Satisfaction (SAT), Hotel Performance (PERFO), Recruitment and selection (Recru), and Training and development (Train) ((SAT PERFO) (Recru Train) similarity: 0.0673802). The strongest similarity in this group is between the items ((SAT PERFO) similarity: 0.511334) connected with the Satisfaction and Hotel Performance conceptual constructs’ items, which is of quite significant importance. The second strongest similarity in this group is between the items ((Recru Train) similarity: 0.506339) connected with the Recruitment, Selection, Training, Development, and Hotel Performance conceptual constructs’ items, which is also of quite significant importance. On the contrary, the whole Group B ((SAT PERFO) (Recru Train) similarity: 0.0673802) has law similarity, which means that Customer Satisfaction and Hotel Performance have law similarity with the rest of the conceptual constructs named Selection and Recruitment Development and Training.
Similarity Group C presents similarity relationships among items connected to 4/6 of the HRM scales. More specifically, the third similarity group (Group) ((Manpo Pay) (Jobd Qcircle) similarity: 0.573255) refers to similarity relations among items connected with the Manpower planning and Pay system, Job design, and Quality circle conceptual constructs of the HRM scale. The strongest similarity in this group is between the items ((Jobd Qcircle) similarity: 0.872949) connected with Job design and Quality circle conceptual constructs. The second strongest similarity is connected with ((Manpo Pay) similarity: 0.76724) Manpower planning and Pay system conceptual constructs of the HRM scale. The whole third group ((Manpo Pay) (Jobd Qcircle) similarity: 0.573255) is of quite significant importance.
Hierarchy tree: The hierarchy tree (Figure 2) presents the implicative relations between the variables in the order of significance. Additionally, the cohesive tree also shows the direction of such relations. From the tree, it can be observed that there are two discrete hierarchical groups. From the above tree, it can be observed that the first hierarchical group has a stronger implication (RESP ⟹ REL cohesion: 1), which is significant. This rule means that Responsiveness (Responsiveness (RESP)) implies responders’ perception of Reliability. The rule (RESP ⟹ REL) ⟹ SEN (cohesion: 1) means that the rule RESP ⟹ REL implies respondents’ perception of Sensory (SEN). The rule ASSUR ⟹ ((RESP ⟹ REL) ⟹ SEN) (cohesion: 1) means that Assurance implies respondents’ perception of the previous rule. The rule TANG ⟹ (ASSUR ⟹ ((RESP ⟹ REL) ⟹ SEN))) (cohesion: 1) means that Tangible implies the previous rule ASSUR ⟹ ((RESP⟹ REL) ⟹ SEN)).
The rule ((TANG ⟹ (ASSUR ⟹ ((RESP ⟹ REL) ⟹ SEN))) ⟹ EMP) (cohesion: 1) has perfect cohesion. This hierarchy group shapes the rule, according to which the rule TANG ⟹ (ASSUR ⟹ ((RESP ⟹REL) ⟹ SEN)) implies Empathy (EMP). This rule corresponds only to SERVQUAL conceptual constructs.
The whole first hierarchy group (((TANG ⟹ (ASSUR ⟹ ((RESP ⟹ REL) ⟹ SEN))) ⟹ EMP) ⟹ PERFO) (cohesion: 0.51) is of medium importance. Moreover, the rule ((TANG ⟹ (ASSUR ⟹ ((RESP ⟹ REL) ⟹SEN))) ⟹ EMP) ⟹ PERFO means that the rule TANG ⟹ (ASSUR ⟹ ((RESP ⟹ REL) ⟹ SEN))) is connected with the SERVQUAL scale, and implies the Hotel Performance conceptual construct (PERFO).
From the tree, it can be observed that the second hierarchical group with stronger implications (Qcircle ⟹ Jobd) (cohesion: 0.999) is significant. The rule Qcircle ⟹ Jobd implies almost perfect quality, and the Quality circle (Qcircle) implies respondents’ perception of Job design (Jobd).
The rule (Manpo ⟹ (Qcircle ⟹ Jobd)) (cohesion: 0.925) indicates that respondents’ perception of Manpower planning (Manpo) implies their perception of Quality circle (Qcircle) as well as their perception of Job design (Jobd). This hierarchy group shapes the rule (Recru ⟹ (Manpo ⟹ (Qcircle ⟹ Jobd))) (cohesion: 0.838), which is characterized by significant cohesion. Moreover, the rule (Recru ⟹ (Manpo ⟹ (Qcircle ⟹ Jobd))) means that respondents’ perception of Recruitment and selection implies respondents’ perception of the rule (Manpo ⟹ (Qcircle ⟹Jobd)). The strongest rule in this hierarchical Group B was Pay ⟹ Train (cohesion: 0.99). This rule means that respondents’ perception of Pay system (Pay) implies respondents’ perception of Training and development (Train). Finally, the second hierarchical group, which is rule ((Recru ⟹ (Manpo ⟹ (Qcircle ⟹ Jobd))) ⟹ (Pay ⟹Train)) (cohesion: 0.621), indicates a rule between the two rules. More specifically respondents’ perception of the rule Recru ⟹ (Manpo ⟹ (Qcircle ⟹ Jobd)) implies respondents’ perception toward the rule Pay ⟹Train. This rule is a hierarchical representation of all the conceptual constructs of the HRM scale, namely, Job Design, Selection and Recruitment, Quality Circle, Pay System, Manpower planning, and Training and Development, which are characterized by a significant cohesion.
Implicative graph: In the implicative graph, all implications between items are appreciated at a confidence level (see Figure 3). This figure represents the Implicative Diagram from threshold 0.60 to threshold 0.99. In this graph, there is only one implicative chain, that is Recruitment and Selection ⟹Quality Circle ⟹ Manpower Planning ⟹ Pay System ⟹ Job Design ⟹ Training and Development ⟹ Sensory, Job Design ⟹ Assurance ⟹ Responsiveness ⟹ Tangibles ⟹ Sensory ⟹ Reliability ⟹ Empathy ⟹ Hotel Performance, SAT ⟹ Hotel Performance. For example, the chain Selection and Recruitment ⟹ Quality Circle ⟹ Manpower Planning ⟹ Pay System ⟹ Job Design ⟹ Training & Development ⟹ Sensory the rule Recruitment and Selection ⟹ Quality Circle ⟹ Manpower Planning ⟹ Pay System has an implication intensity between 0.60 and 0.90, it appears in grey, as well as the rule Job Design ⟹ Training and Development ⟹ Sensory. The rule Pay System ⟹ Job Design has an implication intensity between 0.95 and 0.99, it appears in red. The rule Pay system ⟹ Job Design implies that Pay System (Pay System) signifies Job Design (Job Design). The part of the implicative chain Recruitment and selection ⟹ Quality Circle ⟹ Manpower Planning ⟹ Pay System ⟹ Job Design ⟹ Training and Development is in line with the second part of the hierarchy tree and describes the rules between the conceptual constructs of the HMR scale. The rule Job Design ⟹ Assurance has an implication intensity between 0.60 and 0.90, it appears in grey, and it is the rule that connects Job Design, which is a HMR scale, conceptual construct, and Assurance conceptual construct of the SERVQUAL scale.
The chain Assurance ⟹ Responsiveness ⟹ Tangibles ⟹ Sensory ⟹ Reliability ⟹ Empathy has an implication intensity between 0.95 and 0.99, it appears in red. This rule implies that Assurance suggests Responsiveness which indicates Tangibles which indicates Sensory which suggests Reliability which finally suggests Empathy. The rules SAT, Emp ≥ Hotel Performance, which have intensity between 0.60 and 0.90, appearing in grey, suggest that Satisfaction and Empathy endorse Hotel Performance (Figure 4).

6. Conclusions and Implications

The current study examines how sustainable HRM techniques affect service quality, customer happiness, and institutional performance in the Cypriot inner-city hotel sector. This study contributes to the field of management by providing evidence that adapting sustainable HRM practices can lead to improving service quality and, therefore, hotel performance. It highlights the significance of effective hotel services as a contributor to guest happiness and a predictor of the performance of the hotel. The operational equation model confirmed the dimension model’s fit with the experiential records/data. As a result, the present study supports that the conceived Human Resource Practices model is a legitimate model that has an identical respectable fitting to SERVAQUAL and the Hotel Performance model. Additionally, the outcomes of the study indicate that HRM practices have a major impact on client happiness. It was discovered that HRM routines, in particular, can impact the effective way of providing service quality and, therefore, hotel performance and client happiness. The most significant correlation was discovered between customer satisfaction and institutional performance. This is an important discovery since it was first demonstrated in a Cypriot study pertaining to the inner-city hotel sector. Both the quality of service and HRM practices have an effect on it. Overall, this research supports the strong correlation between hotel performance and HRM practices [14]. This study’s key managerial suggestions are the following: the human resource managers must not only focus on operations, which are frequently quantified in terms of improved efficiency, distribution skills, and attitudes of workers, but must also highlight the advancement of relational capabilities and intradepartmental learning. This study informed the hotel sector that human resource managers could be assured that advocating and supporting HRM practices, as well as creating client connections, would yield great returns. With regard to theoretical contributions, this study investigated the effect of core organizational competences, such as HRM and service quality, on customers’ happiness and company success in Cyprus’s inter-city hotel industry. Positive connections were, implying that HRM improvements are the result of operational and technical measures, as well as managerial, disciplinary, and interorganizational competencies. The findings of the current study confirm the major significance of HRM practices in terms of boosting customer satisfaction and service effectiveness and, as a result, company success [134,135]. The present study adds weight to the HRM area because it provides evidence that sustainable HRM practices, staff service quality, customer satisfaction, and institutional performance are positively correlated.

7. Limitations and Future Research

Nevertheless, the present study had some limitations too. The first limitation is correlated with self-generated validity, which seems to interfere in some cases. According to ref. [130], the expression of personal feelings may develop on the spot, deriving from self-generated validity. Some participants may have never considered some of the topics under study before. Thus, their opinion when commenting and valuing may not be representative. Alternatively, according to ref. [129] respondent may use previously collected replies to earlier questions in order to generate responses to survey questions. Another limitation of the study was the sample size. The sample size was limited in this research, and the assessment of models incorporating interaction terms under such conditions is difficult due to multicollinearity. Furthermore, this study was limited to urban Cypriot hotels.
Future research may widen the scope of the problem by incorporating more cultures and countries. Pipelines and Big Data applications, including algorithms, can help researchers collect a lot of data by searching hotel industry websites in order to evaluate the influence of hotel performance and HRM practices [136,137,138,139,140]. Finally, the goal of future studies should be to use a longitudinal research approach of generating findings that are more robust and the opportunity to broaden awareness of the outcome of HRM practices on customer satisfaction, service quality, and institutional performance. For example, researchers could examine the influence of HRM practices in multiple ways over a longer period, offering greater accuracy and depth. They could measure the influence of HRM practices in stages rather than at a single point in time, as this research did. Nonetheless, many studies [138,139,140,141,142,143,144,145,146] claim that longitudinal research has extra methodological considerations that every researcher must take into account.

Author Contributions

Conceptualization, C.P. and S.A.; methodology, C.P. and S.A.; software, C.P. and S.P.; validation, C.P., S.A. and S.P.; formal analysis, C.P.; investigation, C.P.; resources, C.P.; data curation, C.P., S.A. and S.P.; writing—original draft preparation, C.P.; writing—review and editing, C.P. and S.P.; visualization, C.P. and S.A.; supervision, C.P.; project administration, C.P. and S.A. All authors have read and agreed to the published version of the manuscript.

Funding

This research received no external funding.

Institutional Review Board Statement

The study was conducted in accordance with the Declaration of Helsinki, and ap-proved by the Institutional Review Board (or Ethics Committee) of Neapolis University Pafos (pro-tocol code: 2023/002, date of approval: 28/01/2023).

Informed Consent Statement

Informed consent was obtained from all subjects involved in the study.

Data Availability Statement

Not applicable.

Conflicts of Interest

The authors declare no conflict of interest.

References

  1. Invest Cyprus. 2022. Available online: https://www.investcyprus.org.cy/tourism-and-hospitality/ (accessed on 25 February 2023).
  2. Kramar, R.R. Beyond strategic human resource management: Is sustainable human resource management the next approach? Int. J. Hum. Resour. Manag. 2014, 25, 1069–1089. [Google Scholar] [CrossRef]
  3. Jabbour, C.J.C.; Santos, F.C.A. The central role of human resource management in the search for sustainable organizations. Int. J. Hum. Resour. Manag. 2008, 19, 2133–2154. [Google Scholar]
  4. Stankevi, Ž.; Savanevičienė, A. Raising the Curtain in People Management by Exploring How Sustainable HRM Translates to Practice: The Case of Lithuanian Organizations. Sustainbility 2018, 10, 4356. [Google Scholar]
  5. Hartline, M.D.; Jones, K.C. Employee Performance of a Hotel Service Environment: Influence on Perceived Service Customer Value and Word-of-Mouth Intentions. J. Bus. Res. 1996, 35, 207–215. [Google Scholar] [CrossRef]
  6. Zahoor, A.; Khan, D. Frontline service employees and customer engagement: Some further insights. IIM Ranchi J. Manag. Studies 2022, 1, 175–190. [Google Scholar] [CrossRef]
  7. Nikolaou, K. Labour Ministry Initiative Fails to Dent Hotel Staff Shortages. Available online: https://cyprus-mail.com/2022/02/12/labour-ministry-initiative-fails-to-dent-hotel-staff-shortages/ (accessed on 12 February 2022).
  8. Parasuraman, A.; Zeithaml, V.A.; Berry, L.L. SERVQUAL: A multiple-item scale for measuring consumer perceptions of service quality. J. Retail. 1988, 64, 12–40. [Google Scholar]
  9. Hartline, M.D.; Ferrell, O.C. The management of customer-contact service employees: An empirical investigation. J. Mark. 1996, 60, 52–70. [Google Scholar] [CrossRef]
  10. Kelly, S.W.; Hoffman, K.D. An Investigation of Proposed Affect, Pro-social Behaviour and Service Quality. J. Retaining 1997, 73, 407–427. [Google Scholar] [CrossRef]
  11. Butler, H. Customer Service. 2021. Available online: https://roicallcentersolutions.com/customerservice/why-is-professionalism-important-in-customer-service/ (accessed on 12 February 2022).
  12. Saini, D.; Budhwar, P. Human Resource Management in India, in Managing Human Resources in Asia-Pacific; Budhwar, P., Ed.; Routledge: London, UK, 2004; pp. 113–140. [Google Scholar]
  13. Naresh, K.; Budhwar, P.S. A study of strategic HR issues in an Asian context. Pers. Rev. 2002, 31, 166–188. [Google Scholar]
  14. Chand, M.; Katou, A. The Impact of HRM Practices of Organisational Performance in Indian Hotel Industry. Empl. Relat. Int. J. 2007, 29, 576–594. [Google Scholar]
  15. Chieng, H.P.; Arokiasamy, L.; Kassim, K.A.A. Human resource management practices and their impact on construction institutional performance. Glob. Bus. Manag. Res. 2019, 1, 392–406. [Google Scholar]
  16. Salman, M.; Ganie, S.; Ganaie, M.; Saleem, I.; Khan, I.S. Human Resource Management Practices and Institutional Performance: The Mediating Role of Team Competence. In Proceedings of the First Pan IIT International Management Conference, Roorkee, India, 30 November–2 December 2018. [Google Scholar] [CrossRef]
  17. Anwar, G.; Abdulla, N.N. The impact of Human resource management practice on Institutional performance. Int. J. Eng. Bus. Manag. 2021, 5, 35–47. [Google Scholar] [CrossRef]
  18. Mola, F.; Jusoh, J. Service Quality in Penang Hotels: A Gap Score Analysis. World Appl. Sci. J. 2011, 12, 19–24. [Google Scholar]
  19. Mamilla, R.; Janardhana, G.; Anjan, B.G. Customer Satisfaction on Reliability Dimension of Service Quality in Indian Higher Education. Int. J. Ind. Manuf. Eng. 2013, 7, 3210–3215. [Google Scholar]
  20. Rahman, M.S. Corporate Image and Customer’s Satisfaction Towards Customers Perception: An Exploratory Study on Telecom Customers in Bangladesh. Bus. Intell. J. 2012, 5, 56–63. [Google Scholar]
  21. Dortyol, I.T.; Varinli, I.; Kitapci, O. How do international tourists perceive hotel quality? An exploratory study of service quality in Antalya tourism region. Int. J. Contemp. Hosp. Manag. 2014, 26, 470–495. [Google Scholar] [CrossRef]
  22. Ravichandran, K.; Mani, B.T.; Kumar, S.A.; Prabhakaran, S. Prabhakaran. Influence of service quality on customer satisfaction application of servqual model. Int. J. Bus. Manag. 2010, 5, 117. [Google Scholar]
  23. Aguinis, H. Performance Management; Pearson/Prentice Hall: London, UK, 2009. [Google Scholar]
  24. Papademetriou, C. International Human Resource Management: Sequential Cross Cultural Training–Sociocultural and Psychological Adjustment; Nova Science Publishers: New York, NY, USA, 2020; ISBN 978-1-53616-947-8. [Google Scholar]
  25. Apornak, A. Customer satisfaction measurement using SERVQUAL model, integration Kano and QFD approach in an educational institution. Int. J. Product. Qual. Manag. 2020, 21, 129–141. [Google Scholar] [CrossRef]
  26. Obeidat, B.Y.; Abdallah, A.B. The Relationships among Human Resource Management Practices, Organizational Commitment, and Knowledge Management Processes: A Structural Equation Modeling Approach. Int. J. Bus. Manag. 2014, 9, 9. [Google Scholar] [CrossRef]
  27. Mohyin, N.; Dainty, A.; Carrillo, P. HRM strategies for managing employee commitment: A case study of small construction professional services firms. In Proceeding of the Engineering Project Organizations Conference, Rheden, The Netherlands, 10–12 July 2012; pp. 2–22. [Google Scholar]
  28. Ijigu, A.W. The Effect of Selected Human Resource Management Practices on Employees’ Job Satisfaction in Ethiopian Public Banks. EMAJ Emerg. Mark. J. 2015, 5, 1–16. [Google Scholar] [CrossRef]
  29. Sarhan, N.; Harb, A.; Shrafat, F.; Alhusban, M. The effect of organizational culture on the organizational commitment: Evidence from hotel industry. Manag. Sci. Lett. 2020, 10, 183–196. [Google Scholar] [CrossRef]
  30. Snape, E.; Redman, T. HRM practices, organizational citizenship behaviour, and performance: A multi-level analysis. J. Manag. Stud. 2010, 47, 1219–1247. [Google Scholar] [CrossRef]
  31. Schlesinger, L.A.; Heskett, J.L. The service-driven service company. Harward Bus. Rev. 1991, 69, 71–81. [Google Scholar]
  32. Schneider, B. HRM–A Service Perspective: Towards a Customer-focused HRM. Int. J. Serv. Ind. Manag. 1994, 5, 64–76. [Google Scholar] [CrossRef]
  33. Tsaur, S.H.; Lin, Y.C. Promoting service quality in tourist hotels: The role of HRM practices and service behavior. Tour. Manag. 2004, 25, 471–481. [Google Scholar] [CrossRef]
  34. Gultlten, Y.; Muluk, Z. The practice of service quality: Hotel case. Glob. J. Bus. Econ. Manag. Curr. Issues 2016, 6, 20–34. [Google Scholar]
  35. Tiago, F.; Borges-Tiago, T.; Couto, J. Human resources role in hospitality service quality. In Strategic Innovative Marketing and Tourism; Springer: Cham, Switzerland, 2020; p. 8189. [Google Scholar]
  36. Mohinder, C. Human Resource Strategies and Global Competitiveness: A Study of Indian Small and Medium Sized Tourism Enterprises. In International Conference on Creating Global Competitive Advantage; Laxpara Foundation: Shimla, India, 2004. [Google Scholar]
  37. Belias, D.; Vasiliadis, L.; Mantas, C. The human resource training and development of employees working on luxurious hotels in Greece. Cult. Tour. Innov. Digit. Era 2020, 639–648. [Google Scholar]
  38. Tornow, W.W.; Wiley, J.W. Service Quality and Management Practices: A Look at Employee Attitudes, Customer Satisfaction, and Bottom-Line Consequences. Hum. Resour. Plan. 1991, 14, 105–115. [Google Scholar]
  39. Hung, T.K. The Impact of Human Resource Practices on Service Performance of Taiwanese Hotel Industry: Organizational Commitment as a Mediator. Int. J. Inf. Syst. Logist. Manag. 2006, 1, 109–116. [Google Scholar]
  40. Ahmed, U.; Kura, K.M.; Umrani, W.A.; Pahi, M.H. Modelling the Link Between Developmental Human Resource Practices and Work Engagement: The Moderation Role of Service Climate. Glob. Bus. Rev. 2020, 2, 31–53. [Google Scholar] [CrossRef]
  41. Folinas, D.K.; Fotiadis, T.A.; Coudounaris, D.N. Just-in-time theory: The panacea to the business success? Int. J. Value Chain. Manag. 2017, 8, 171–190. [Google Scholar] [CrossRef]
  42. Yang, C.-C. Establishment of a quality-management system for service industries. Total Qual. Manag. 2006, 17–19, 1129–1154. [Google Scholar] [CrossRef]
  43. Fornell, C. A National Customer Satisfaction Barometer: The Swedish Experience. J. Mark. 1992, 56, 6–21. [Google Scholar] [CrossRef]
  44. Vo, N.T.; Chovancová, M.; Tri, H.T. The impact of E-service quality on the customer satisfaction and consumer engagement behaviors toward luxury hotels. J. Qual. Assur. Hosp. Tour. 2020, 21, 499–523. [Google Scholar] [CrossRef]
  45. Harnjo, E.; Rudy, R.; Simamora, S.; Hutabarat, L.R.; Juliana, J. Identifying Customer Behavior in Hospitality To Deliver Quality Service And Customer Satisfaction. J. Ind. Eng. Manag. Res. 2021, 2, 107–113. [Google Scholar]
  46. Zeithaml, V.A. Service quality, profitability, and the economic worth of customers: What we know and what we need to learn. J. Acad. Mark. Sci. 2000, 28, 67–85. [Google Scholar] [CrossRef]
  47. Nunkoo, R.; Teeroovengadum, V.; Ringle, C.M.; Sunnassee, V. Service quality and customer satisfaction: The moderating effects of hotel star rating. Int. J. Hosp. Manag. 2020, 91, 102414. [Google Scholar] [CrossRef]
  48. Bitner, M.J.; Hubbert, A.R. Encounter Satisfaction versus Overall Satisfaction versus Service Quality: The Consumer’s Voice. In Service Quality: New Directions in Theory and Practice; Rust, R.T., Oliver, R.L., Eds.; Sage Publications: Thousand Oak, CA, USA, 1994; pp. 72–94. [Google Scholar]
  49. Xie, Y. The relationship among marketing mix, customer satisfaction and customer loyalty of Chinese tourists to budget hotel of central Bangkok. Int. J. Bus. Econ. 2020, 2, 1–23. [Google Scholar]
  50. Hansemark, O.C.; Albinsson, M. Customer satisfaction and retention: The experiences of individual employees. Manag. Serv. Qual. Int. J. 2004, 14, 40–57. [Google Scholar] [CrossRef]
  51. Anastasiadou, S.; Fotiadis, T.; Anastasiadis, L.; Iakovidis, G.; Fotiadou, X.; Tiliakou, C. Estimate and analysis of vocational training school (IEK) students’ satisfaction regarding the quality of studies provided by these schools. Sci. Bull. Econ. Sci. 2016, 15, 38–45. [Google Scholar]
  52. Belias, D.; Rossidis, G.; Papademetriou, C.; Mantas, C. Job Satisfaction as Affected by Types of Leadership: A Case Study of Greek Tourism Sector. J. Qual. Assur. Hosp. Tour. 2021, 23, 299–317. [Google Scholar] [CrossRef]
  53. Lu, C.; Berchoux, C.; Marek, M.W.; Chen, B. Service quality and customer satisfaction: Qualitative research implications for luxury hotels. Int. J. Cult. Tour. Hosp. Res. 2015, 9, 168–182. [Google Scholar] [CrossRef]
  54. Olorunniwo, F.; Hsu, M.K.; Udo, G.J. Service quality, customer satisfaction, and behavioral intentions in the service factory. J. Serv. Mark. 2006, 20, 59–72. [Google Scholar] [CrossRef]
  55. Omar, H.F.; Saadan, K.B.; Seman, K.B. Determining the Influence of the Reliability of Service Quality on Customer Satisfaction: The Case of Libyan ECommerce Customers. Int. J. Learn. Dev. 2015, 5, 86–89. [Google Scholar] [CrossRef]
  56. Horvath, M.; Michalkova, A. Monitoring Customer Sstisfaction in Service Industry. Kval. Inovacia Prosper. Qual. Innov. Prosper. 2012, 16, 49–54. [Google Scholar] [CrossRef]
  57. Back, K.-J.; Lee, J.-S. Country Club Members’ Perceptions of Value, Image Congruence, and Switching Costs: An Exploratory Study of Country Club Members’ Loyalty. J. Hosp. Tour. Res. 2009, 33, 528–546. [Google Scholar] [CrossRef]
  58. Schiffman, L.G.; Wisenblit, J.L. Consumer Behavior, 11th ed.; Pearson: Boston, MA, USA, 2015. [Google Scholar]
  59. Gracia, E.; Bakker, A.B. Positive Emotions: The Connection between Customer Quality Evaluations and Loyalty. Cornell Hosp. Q. 2011, 52, 458–465. [Google Scholar] [CrossRef]
  60. Tomic, I.; Tesic, Z.; Kuzmanovic, B.; Tomic, M. An empirical study of employee loyalty, service quality, cost reduction and company performance. Econ. Res. Ekon. Istraživanja 2018, 31, 827–846. [Google Scholar] [CrossRef]
  61. Katou, A.; Budhwar, P. Human Resource Management Systems and Institutional performance: A Test of a Mediating Model in the Greek Manufacturing Context. Int. J. Hum. Resour. Manag. 2006, 17, 1223–1253. [Google Scholar] [CrossRef]
  62. Chand, M. The impact of HRM practices on service quality, customer satisfaction and performance in the Indian hotel industry. Int. J. Hum. Resour. Manag. 2010, 21, 551–566. [Google Scholar] [CrossRef]
  63. Cheng, A.; Brown, A. HRM Strategies and Labour Turnover in the Hotel Industry: A Comparative Study of Australia and Singapore. Int. J. Hum. Resour. Manag. 1998, 9, 136–154. [Google Scholar] [CrossRef]
  64. Haynes, P.; Fryer, G. Human Resources, Service Quality and Performance: A Case Study. Int. J. Contemp. Hosp. Manag. 2000, 12, 240–248. [Google Scholar] [CrossRef]
  65. Som, A. Innovative Human Resource Management and Corporate Performance in the Context of Economic Liberalization in India. Int. J. Hum. Resour. Manag. 2008, 19, 1278–1297. [Google Scholar] [CrossRef]
  66. Cantarello, S.; Filippini, R.; Nosella, A. Linking human resource management practices and customer satisfaction on product quality. Int. J. Hum. Resour. Manag. 2012, 23, 3906–3924. [Google Scholar] [CrossRef]
  67. Chi, C.G.; Gursoy, D. Employee satisfaction, customer satisfaction, and financial performance: An empirical examina-tion. Int. J. Hosp. Manag. 2009, 28, 245–253. [Google Scholar] [CrossRef]
  68. Heskett, J.L.; Sasser, W.E.; Schlesinger, L.A. The Service Profit Chain; The Free Press: New York, NY, USA, 1997. [Google Scholar]
  69. Kurdi, B.; Alshurideh, M.; Alnaser, A. The impact of employee satisfaction on customer satisfaction: Theoretical and em-pirical underpinning. Manag. Sci. Lett. 2020, 10, 3561–3570. [Google Scholar] [CrossRef]
  70. Maxwell, G.; Watson, S.; Quail, S. Quality Service in the International Hotel Sector: A Catalyst for Strategic Human Resource Development. J. Eur. Ind. Train. 2004, 28, 159–182. [Google Scholar] [CrossRef]
  71. Blau, P.M. Exchange and Power in Social Life; Wiley & Sons: Hoboken, NJ, USA, 1964. [Google Scholar]
  72. De Souza, M.V.; Hancer, M. Using the Social Exchange Theory to Explore the Employee-Organization Relationship in the Hospitality Industry. Int. J. Contemp. Hosp. Manag. 2021, 33, 670–692. [Google Scholar]
  73. Becker, B.; Gerhart, B. The Impact of Human Resource Management on Organizational Performance: Progress and Prospects. Acad. Manag. J. 1996, 39, 779–801. [Google Scholar] [CrossRef]
  74. Khatri, N. Management Human Resource for Competitive Advantage: A Study of Companies in Singapore. Int. J. Hum. Resour. Manag. 2000, 11, 336–365. [Google Scholar] [CrossRef]
  75. Shyju, P.J.; Singh, K.; Kokkranikal, J.; Bharadwaj, R.; Rai, S.; Antony, J. Service Quality and Customer Satisfaction in Hospitality, Leisure, Sport and Tourism: An Assessment of Research in Web of Science. J. Qual. Assur. Hosp. Tour. 2023, 24, 24–50. [Google Scholar] [CrossRef]
  76. Saini, D. Managing Employee Relations through Strategic Human Resource Management: Evidence from Two Tata Companies. Indian J. Ind. Relat. 2006, 42, 170–189. [Google Scholar]
  77. Belias, D.; Rossidis, I.; Papademetriou, C.; Lamprinoudis, N. The Greek hotel sector: An analysis of job satisfaction, role conflict and autonomy of Greek employees. J. Hum. Resour. Hosp. Tour. 2022, 21, 156–174. [Google Scholar] [CrossRef]
  78. Kim, C.; Chung, K. Measuring customer satisfaction and hotel efficiency analysis: An approach based on data envelopment analysis. Cornell Hosp. Q. 2020, 63, 257–266. [Google Scholar] [CrossRef]
  79. Huselid, M.A. The Impact of Human Resource Management Practices on Turnover, Productivity and Corporate Financial Performance. Acad. Manag. J. 1995, 38, 635–670. [Google Scholar] [CrossRef]
  80. Najam, U.; Ishaque, S.; Irshad, S.; Salik, Q.U.A.; Khakwani, M.; Liaquat, M. A link between human resource manage-ment practices and customer satisfaction: A moderated mediation model. SAGE Open 2020, 10, 1–16. [Google Scholar] [CrossRef]
  81. Parahoo, Μ.K. Nursing Research: Principles, Process and Issues, 2nd ed.; Palgrave Macmillan Methodology: New York, NY, USA, 2006. [Google Scholar]
  82. Hair, F.J.; Black, C.W.; Badin, N.J.; Anderson, E.R.; Tatham, R.L. Multivariate Data Analysis; Pearson Education Inc.: Upper Saddle River, NJ, USA, 2005. [Google Scholar]
  83. Leszczynski, A. Quantitative limits to qualitative engagements: GIS, its critics, and the philosophical divide. Prof. Geogr. 2009, 61, 350–365. [Google Scholar] [CrossRef]
  84. Queirós, D.; Faria, D.; Almeida, F. Strengths and limitations of qualitative and quantitative research methods. Eur. J. Educ. Stud. 2017.
  85. Creswell, J.W.; Design, R. Quantitative and Mixed Method Approaches; Sage Publication Inc.: London, UK, 2005. [Google Scholar]
  86. Welman, J.C.; Kruger, S.J. Research Methodology, 2nd ed.; Oxford University Press: Cape Town, South Africa; Oxford, UK, 2003. [Google Scholar]
  87. Sekaran, U.; Bougie, R. Research Methods for Business: A Skill Building Approach, 5th ed.; John Wily and Sons Ltd.: London, UK, 2011. [Google Scholar]
  88. Babbie, E. The Basics of Social Research, 3rd ed.; Thomson Wadsworth: Belmont, CA, USA, 2005. [Google Scholar]
  89. Opoku, J.Y. A Short Guide to Research Writing in The Social Science and Education; Ghana Universities Press: Accra, Ghana, 2005. [Google Scholar]
  90. Parasuraman, A.; Zeithaml, V.A.; Berry, L.L. A conceptual model of service quality and its implications forfuture research. J. Mark. 1985, 49, 41–50. [Google Scholar] [CrossRef]
  91. Finn, D.W.; Lamb, C.W. An Evaluation of the SERVQUAL Scale in a Retailing Setting. Adv. Consum. Res. 1991, 18, 483–490. Available online: http://www.acrwebsite.org/search/view-conference-proceedings.aspx?Id=7137 (accessed on 9 February 2015).
  92. Lewis, B.R. Managing Service Quality. In Managing Quality, 5th ed.; Dale, B.G., Van der Wiele, T., Van Iwaarden, J., Eds.; Blackwell Publishing: Malden, MA, USA, 2011; pp. 234–258. [Google Scholar]
  93. Maylor, H. Part Three: Functional Management in Tourism: Strategic Quality Management. In Strategic Management in Tourism; Moutinho, L., Ed.; CABI Publishing: Wallingford, UK, 2000; pp. 248–255. [Google Scholar]
  94. Dale, B.G.; Van der Wiele, T.; Van Iwaarden, J. Managing Quality, 5th ed.; Blackwell Publishing: Hoboken, NJ, USA, 2011. [Google Scholar]
  95. Jain, S.K.; Gupta, G. Measuring Service Quality: SERQUAL vs. SERVPERF. Scales Vikalpa 2004, 29, 25–37. [Google Scholar] [CrossRef]
  96. Cronin, J.J., Jr.; Taylor, S.A. Measuring service quality: A reexamination and extension. J. Mark. 1992, 56, 55–68. [Google Scholar] [CrossRef]
  97. Hiltrop, J. The impact of human resource management on institutional performance: Theory and research. Eur. Manag. J. 1996, 14, 628–637. [Google Scholar] [CrossRef]
  98. Spinelli, M.A.; Canavos, G.C. Investigating the relationship between employee satisfaction and guest satisfaction. Cornell Hotel. Restaur. Adm. Q. 2000, 41, 29–33. [Google Scholar]
  99. Lee, Y.-K.; Park, K.H.; Park, D.H.; Lee, K.A.; Kwon, Y.J. The Relative Impact of Service Quality of Service Value, Customer Satisfaction and Customer Loyalty in Korean Family Restaurant Context. Int. J. Hosp. Tour. Adm. 2005, 6, 22–50. [Google Scholar] [CrossRef]
  100. Chaturvedi, R.K. Mapping service quality in hospitality industry: A case through SERVQUAL. Asian J. Manag. 2017, 8, 413. [Google Scholar] [CrossRef]
  101. Shafiq, A.; Mostafiz, M.I.; Taniguchi, M. Using SERVQUAL to determine Generation Y’s satisfaction towards hoteling industry in Malaysia. J. Tour. Futures 2019, 5, 62–74. [Google Scholar] [CrossRef]
  102. Sangpikul, A. Acquiring an in-depth understanding of assurance as a dimension of the SERVQUAL model in regard to the hotel industry in Thailand. Curr. Issues Tour. 2023, 26, 347–352. [Google Scholar] [CrossRef]
  103. Oliver, R.L. A Cognitive Model of the Antecedence and Consequences of Satisfaction Decisions. J. Mark. Res. 1980, 17, 460–469. [Google Scholar] [CrossRef]
  104. Lee, H.S.; Lee, Y.K.; Yoo, D.K. The Determinants of Perceived Service Quality and its Relationship with Satisfaction. J. Serv. Mark. 2000, 14, 217–231. [Google Scholar] [CrossRef]
  105. Leonidou, L.C.; Leonidou, C.N.; Fotiadis, A.T.; Zeriti, A. Resources and capabilities as drivers of hotel environmental marketing strategy: Implications for competitive advantage and performance. Tour. Manag. 2013, 23, 94–110. [Google Scholar] [CrossRef]
  106. Cho, W.; Jang, E. Measuring the Impact of Human Resource Management Practices on Hospitality Firms’ Performances. Hosp. Manag. 2006, 25, 262–277. [Google Scholar] [CrossRef]
  107. Croanbach, L.J. Essentials of Psychological Testing, 4th ed.; Harper & Row: New York, NY, USA, 1984. [Google Scholar]
  108. Bagozzi, R.P.; Kimmel, S.K. A comparison of leading theories for the prediction of directed behaviors. Br. J. Soc. Psychol. 1995, 34, 437–461. [Google Scholar] [CrossRef]
  109. Bentler, P.M. EQS: Structural Equations Program Manual; BMDP Statistical Software: Los Angeles, CA, USA, 1993. [Google Scholar]
  110. Chin, W.W. Issues and opinion on structural equation modelling. Mis Q. 1998, 22, 7–16. [Google Scholar]
  111. Churchill, G.A. A paradigm for developing better measures for marketing constructs. J. Mark. Res. 1979, 16, 64–73. [Google Scholar] [CrossRef]
  112. Fornell, C.; Larcker, D. Evaluating Structural equation models with unobservable variables and measurement error. J. Mark. Res. 1981, 18, 39–50. [Google Scholar] [CrossRef]
  113. Joreskog, K.G.; Sordom, D. Lisrel 8: User’s Reference Guide; Scientific Software International: Chicago, IL, USA, 1996. [Google Scholar]
  114. Kaiser, H.F. An index of factorial simplicity. Psychometrika 1974, 39, 31039. [Google Scholar] [CrossRef]
  115. Kline, P. The Handbook of Psychological Testing; Routledge: London, UK, 1992. [Google Scholar]
  116. Kline, P. An Easy Guide to Factor Analysis; Routledge: London, UK, 1994. [Google Scholar]
  117. Schene, A.; Wijngaarden, B.; Koeter., M. Family Caregiving in Schizophrenia: Domains, Distress. Schizophr. Bull. 1998, 24, 609–618. [Google Scholar] [CrossRef]
  118. Sharma, S. Applied Multivariate Techniques; John Willey & Sons, Inc.: Hoboken, NJ, USA, 1996. [Google Scholar]
  119. Spector, P.E. Summated Rating Scale Construction: An Introduction; Sage University Paper Series on Quantitative Application in the Social Sciences; SAGE: Thousand Oak, CA, USA, 1992. [Google Scholar]
  120. Vivilaki, V.G.; Dafermos, V.; Daglas, M.; Antoniou, E.; Tsopelas, N.D.; Theodorakis, P.N.; Brown, J.B.; Lionis, C. Identifying intimate partner violence (IPV) during the postpartum period in a Greek sample. Arch Womens Ment Health 2010, 13, 467–476. [Google Scholar] [CrossRef] [PubMed]
  121. Vivilaki, V.G.; Dafermos, V.; Patelarou, E.; Bick, D.; Syngelaki, A.; Tsopelas, N.D.; Bitsios, P.; Petridou, E.T.; Vgontzas, A.N.; Lionis, C. Maternal screening for early postnatal vulnerability. Psychiatriki 2016, 27, 169–181. [Google Scholar] [CrossRef] [PubMed]
  122. Georgakis, M.K.; Papadopoulos, F.C.; Beratis, I.; Michelakos, T.; Kanavidis, P.; Dafermos, V.; Tousoulis, D.; Papageorgiou, S.G.; Petridou, E.T. Validation of TICS for detection of dementia and mild cognitive impairment among individuals characterized by low levels of education or illiteracy: A population-based study in rural Greece. Clin Neuropsychol. 2017, 31 (Suppl. S1), 61–71. [Google Scholar] [CrossRef] [PubMed]
  123. Patelarou, A.E.; Dafermos, V.; Brokalaki, H.; Melas, C.D.; Koukia, E. The evidence-based practice readiness survey: A structural equation modeling approach for a Greek sample. Int. J. Evid. Based Healthc. 2015, 13, 77–86. [Google Scholar] [CrossRef] [PubMed]
  124. Nazir, O.; Islam, J. Effect of CSR activities on meaningfulness, compassion, and employee engagement: A sense-making theoretical approach. Int. J. Hosp. Manag. 2020, 90, 102630. [Google Scholar] [CrossRef]
  125. Anderson, E.W.; Lehmann, C.F.D.R. Customer satisfaction, market share, and profitability: Findings from Sweden. J. Mark. 1994, 58, 53–66. [Google Scholar] [CrossRef]
  126. Sapouna, V.; Dafermos, V.; Chatziarsenis, M.; Vivilaki, V.; Bitsios, P.; Schene, A.H.; Lionis, C. Assessing the burden of caregivers of patients with mental disorders: Translating and validating the involvement evaluation questionnaire into Greek. Ann. Gen. Psychiatry 2013, 12, 3. [Google Scholar] [CrossRef] [PubMed]
  127. Lucas, R.E.; Clark, A.E.; Georgellis, Y.; Diener, E. Unemployment alters the set point for life satisfaction. Psychol. Sci. 2004, 15, 8–13. [Google Scholar] [CrossRef]
  128. Lee, M.C.; Hwan, S. Relationships among service quality, customer satisfaction and profitability in the Taiwanese banking industry. Int. J. Manag. 2005, 22, 635. [Google Scholar]
  129. Feldman, J.M.; Lynch, J.G. Self-generated validity and other effects of measurement on belief, attitude, intention, and behaviour. J. Appl. Psychol. 1988, 73, 421. [Google Scholar] [CrossRef]
  130. Forbes, S.; Avis, M. Construct creation from research questions. Eur. J. Mark. 2020, 54, 1817–1838. [Google Scholar] [CrossRef]
  131. Islam, J.U.; Hollebeek, L.D.; Rahman, Z.; Khan, I.; Rasool, A. Customer engagement in the service context: An empirical investigation of the construct, its antecedents and consequences. J. Retail. Consum. Serv. 2019, 50, 277–285. [Google Scholar] [CrossRef]
  132. Anastasiadou, S. Comparison of Contemporary Advanced Statistical Methods Regarding Construct Validity Evaluation of Teique-SF Instrument: Statistical Implicative Analysis vs. Principal Components Analysis; 9ème Colloque International sur Analyse Statistique Implicative (ASI 10): Belfort, France, 2019; pp. 148–163. [Google Scholar]
  133. Couturier, R. CHIC: Cohensive Hierarchical Implicative Classification. In Studies in Computational Intelligence (SCI); Springer: Berlin/Heidelberg, Germany, 2008; pp. 41–53. [Google Scholar]
  134. Couturier, R.R.; Pazmin, Ô. Statistical Implicative Analysis for Educational Data Sets: 2 Analysis with RCHI. In Proceedings of the XVIII Congreso Internacional EDUTEC Educación Y Tecnología Desde Una Visión Transformadoraedudec, Riobamba, Ecuador, 17–19 November 2015; pp. 1–11. [Google Scholar]
  135. Kothari, C.K. Research Methodology, Methods & Techniques; New Age International: New Delhi, India, 2004. [Google Scholar]
  136. Vivilaki, V.G.; Dafermos, V.; Kogevinas, M.; Bitsios, P.; Lionis, C. The Edinburgh Postnatal Depression Scale: Translation and validation for a Greek sample. BMC Public Health 2009, 9, 329. [Google Scholar] [CrossRef] [PubMed]
  137. Antoniou, E.; Ioannidi-Kapolou, E.; Daglas, M.; Vivilaki, V.; Karamitros, D.; Dafermos, G.; Iatrakis, V. Abuse assessment screen (AAS) questionnaire: The Greek validation. Clin. Exp. Obstet. Gynecol. 2010, 37, 313–316. [Google Scholar] [PubMed]
  138. Souravlas, S.; Anastasiadou, S. Pipelined Dynamic Scheduling of Big Data Streams. Appl. Sci. 2020, 10, 4796. [Google Scholar] [CrossRef]
  139. Souravlas, S.; Anastasiadou, S.; Katsavounis, S. More on Pipelined Dynamic Scheduling of Big Data Streams. Appl. Sci. 2021, 11, 61. [Google Scholar] [CrossRef]
  140. Souravlas, S.; Anastasiadou, S.; Katsavounis, S. A Survey on the Recent Advances of Deep Community Detection. Appl. Sci. 2021, 11, 7179. [Google Scholar] [CrossRef]
  141. Souravlas, S.; Katsavounis, S.; Anastasiadou, S. On Modeling and Simulation of Resource Allocation Policies in Cloud Computing Using Colored Petri Nets. Appl. Sci. 2021, 10, 5644. [Google Scholar] [CrossRef]
  142. Souravlas, S.; Anastasiadou, S.D.; Tantalaki, N.; Katsavounis, S. A Fair, Dynamic Load Balanced Task Distribution Strategy for Heterogeneous Cloud Platforms Based on Markov Process Modeling. IEEE Access 2022, 10, 26149–26162. [Google Scholar] [CrossRef]
  143. Souravlas, S.; Roumeliotis, M. Petri net modeling and simulation of pipelined redistributions for a deadlock-free system. Cogent Eng. 2015, 2, 1. [Google Scholar] [CrossRef]
  144. Menard, S. Longitudinal Research; Sage Publications: Newbury Park, NY, USA, 1991. [Google Scholar]
  145. Souravlas, S.; Anastasiadou, S.D.; Economides, T.; Katsavounis, S. Probabilistic Community Detection in Social Networks. IEEE Access 2023, 11, 25629–25641. [Google Scholar] [CrossRef]
  146. Souravlas, S.; Katsavounis, S. Scheduling Fair Resource Allocation Policies for Cloud Computing through Flow Control. Electronics 2019, 8, 1348. [Google Scholar] [CrossRef]
Figure 1. Theoretical Model of the Study.
Sustainability 15 08251 g001
Figure 2. Similarity Tree.
Sustainability 15 08251 g002
Figure 3. Hierarchy Tree.
Sustainability 15 08251 g003
Figure 4. Implicative Graph.
Sustainability 15 08251 g004
Table 1. HRM Practices Scale.
ConstructEigen Value Variance % LonadingsCommunalitiesCronbach’s aCRAVE
HMR 87.972 0.968
A. Recruitment and Selection (Recru)7.48126.908 0.8710.9270.679
Recru1. Harmonized and term conditions 0.8810.786
Recru2. Single status for all staff 0.8340.703
Recru3. Internal promotion norm 0.8320.697
Recru4. Employment test criteria 0.8170.658
Recru5. Merit element in selection 0.7970.652
Recru6. Multi-skilling and experience 0.7800.618
B. Manpower Planning (Manpo)3.86519.705 0.9010.9460.813
Manpo1. Formal manpower planning 0.9180.862
Manpo2. Work culture 0.9110.802
Manpo3. Career planning 0.9040.793
Manpo4. Involvement of all departments 0.8730.736
C. Job design (Jobd)3.39616.023 0.8910.9270.761
Jobd1. Flexible job description 0.9120.809
Jobd2. Development of learning organization 0.8740.792
3Jobd. Cross-cultural job design 0.8530.761
Jobd4. Team working 0.8490.709
D. Training and development (Train)1.30711.913 0.8970.9320.775
Train1. Need based training and development criteria 0.8750.803
Train2. Formal system induction 0.9010.807
Train3. Learning organization 0.8430.781
Train4. Formal training and development 0.9010.807
E. Quality circle (Qcircle)0.4477.931 0.9060.9400.798
Qcircle1. Staff involvement in objective setting 0.9050.783
Qcircle2. Production/ service staff responsible for their service 0.9140.811
Qcircle3. Employee’s involment in quality circles 0.9230.827
Qcircle4. Regular use of attitudes surveys 0.8270.762
F. Pay System0.2115.492 0.8480.9470.782
Pay1. Staff informed about market condition and company performance 0.9120.802
Pay2. Merit element in pay package 0.8160.712
Pay3. staff Formal appraisal for all staff 0.9280.832
Pay4. No-financial incentives 0.8970.793
Pay5. Social appreciation and recognition 0.8640.721
Table 2. SERVQUAL Scale.
ConstructEigen ValueVariance %LoadingsCommu-n AlitiesCronbach’s aCRAVE
SERVQUAL 92.931 0.882
A. Tangibles (TANG)7.86528.983 0.9030.946.854
TANG1. This hotel haw up-to-date equipment 0.9080.895
TANG2. This hotel’s physical facilities are visually appealing 0.9210.903
TANG3. This hotel’s employees are well dresses and appear neat 0.9430.923
B. Reliability6.05919.620 0.8770.930.817
TANG1. When this hotel promises to do something by a certain time, it does so 0.9340.916
TANG2. This hotel keeps its records accurately 0.9430.918
TANG3. This hotel provides its services at the time it promises to do so 0.8300.888
C. Responsiveness (RESP)5.29213.459 0.8310.941.842
RESP1. This hotel does tell consumers exactly when services will be performed 0.9230.896
RESP2. This hotel’s employees are always willing to help customers 0.9180.870
RESP3. This Hotel’s emploeeys respond to customer requests promptly 0.9120.856
D. Assurance (ASSUR)4.93412.568 0.8050.964.898
ASSUR1. I can trust employees of this hotel 0.9540.923
ASSUR2. This hotel’s employees know well their jobs to help customers 0.9350.915
ASSUR3. This hotel’s employees get adequate support from this restaurant to do their jobs well 0.9540.923
E. Empathy (EMP)3.75611.398 0.8110.9360.831
EMP1. Employees of this hotel know what my needs are 0.9120.887
EMP2. This Hotel has my best interests at heart 0.9230.902
EMP3. This hotel has operating hours convenient to all their customers 0.8990.876
F. Sensory Sensory (SEN)3.1586.903 0.8080.9530.910
SEN1. in its presentation This hotel serves quality food with a high degree of excellence 0.9540.903
SEN2. This hotels food is consistently served in the freshest state and with un uncommon degree of visual and olfactory appeal 0.9540.903
Table 3. Hotel Performance Scale.
ConstructEigen ValueVariance %LoadingsCommu-n AlitiesCronbach’s aCRAVE
Hotel Performance (PERFO)11.61479.403 0.8240.9730.817
PERFO1. I am satisfied regarding Profitability compared to business unit objectives 0.9120.834
PERFO2. I am satisfied regarding Profitability compared to hotel industry average 0.9120.834
PERFO3. I am satisfied regarding Market share compared to business unit objectives 0.9120.834
PERFO4. I am satisfied regarding Market share compared to major competitor 0.8450.783
PERFO5. I am satisfied regarding Market share compared to hotel industry average 0.9060.821
PERFO6. I am satisfied regarding Sales volume compared to business unit objectives 0.9060.821
PERFO7. I am satisfied regarding Return on investment compared to hotel industry average 0.9170.841
PERFO8. I am satisfied regarding Overall assessment of your company’s performance compared to hotel industry average 0.9170.841
Table 4. Customer Satisfaction scale.
Construct Eigen ValueVariance % LoadingsCommu-n AlitiesCronbach’s aCRAVE
Customer Satisfaction (SAT)5.20979.871 0.8960.9200.793
SAT1. I am satisfied foe the decision that he/she patronizes the hotel 0.8370.752
SAT2. I am satisfied with the degree of a customer’s feeling of service 0.9160.872
SAT3. I am satisfied with the degree of the perceived degree of the method 0.9160.872
Table 5. Correlations.
Correlations
HRMSERVQUALPERFORMANCE SATISFACTION
HRMPearson Correlation10.831 **0.893 **0.905 **
Sig. (2-tailed) 0.0000.0000.000
N360360360360
SERVQUALPearson Correlation0.831 **10.833 **0.907 **
Sig. (2-tailed)0.000 0.0000.000
N360360360360
PERFORMANCE Pearson Correlation0.893 **0.833 **10.981 **
Sig. (2-tailed)0.0000.000 0.000
N360360360360
SATISFACTIONPearson Correlation0.905 **0.907 **0.981 **1
Sig. (2-tailed)0.0000.0000.000
N360360360360
** Correlation is significant at the 0.01 level (2-tailed).
Disclaimer/Publisher’s Note: The statements, opinions and data contained in all publications are solely those of the individual author(s) and contributor(s) and not of MDPI and/or the editor(s). MDPI and/or the editor(s) disclaim responsibility for any injury to people or property resulting from any ideas, methods, instructions or products referred to in the content.

