Article

Optimal Design and Mathematical Modeling of Hybrid Solar PV–Biogas Generator with Energy Storage Power Generation System in Multi-Objective Function Cases

1
Department of Electrical and Electronic Engineering, Faculty of Engineering and Technology, University of Buea, Buea P.O. Box 63, Cameroon
2
Department of Electrical and Computer Engineering, Debre Markos University, Debre Markos P.O. Box 269, Ethiopia
3
Department of Mechanical Engineering, Faculty of Engineering and Technology, University of Buea, Buea P.O. Box 63, Cameroon
4
Department of Electrical and Electronic Engineering Technology, Faculty of Engineering and the Built Environment, University of Johannesburg, Johannesburg 2006, South Africa
5
Department of Electrical and Computer Engineering, Hawassa University, Hawassa P.O. Box 05, Ethiopia
*
Author to whom correspondence should be addressed.
Sustainability 2023, 15(10), 8264; https://doi.org/10.3390/su15108264
Submission received: 14 April 2023 / Revised: 15 May 2023 / Accepted: 16 May 2023 / Published: 18 May 2023
(This article belongs to the Special Issue Applications of Renewable Energy Technologies on Buildings)

Abstract

:
This study demonstrates how to use grid-connected hybrid PV and biogas energy with a SMES-PHES storage system in a nation with frequent grid outages. The primary goal of this work is to enhance the HRES’s capacity to favorably influence the HRES’s economic viability, reliability, and environmental impact. The net present cost (NPC), greenhouse gas (GHG) emissions, and the likelihood of a power outage are among the variables that are examined. A mixed solution involves using a variety of methodologies to compromise aspects of the economy, reliability, and the environment. Metaheuristic optimization techniques such as non-dominated sorting whale optimization algorithm (NSWOA), multi-objective grey wolf optimization (MOGWO), and multi-objective particle swarm optimization (MOPSO) are used to find the best size for hybrid systems based on evaluation parameters for financial stability, reliability, and GHG emissions and have been evaluated using MATLAB. A thorough comparison between NSWOA, MOGWO, and MOPSO and the system parameters at 150 iterations has been presented. The outcomes demonstrated NSWOA’s superiority in achieving the best optimum value of the predefined multi-objective function, with MOGWO and MOPSO coming in second and third, respectively. The comparison study has focused on NSWOA’s ability to produce the best NPC, LPSP, and GHG emissions values, which are EUR 6.997 × 10⁶, 0.0085, and 7.3679 × 10⁶ Kg reduced, respectively. Additionally, the simulation results demonstrated that the NSWOA technique outperforms other optimization techniques in its ability to solve the optimization problem. Furthermore, the outcomes show that the designed system has acceptable NPC, LPSP, and GHG emissions values under various operating conditions.

1. Introduction

1.1. Background Justification and Motivations

Access to electricity is critical for every country’s socioeconomic and long-term growth. It is necessary for doing daily activities including heating, cooking, lighting, and transportation. Providing unlimited access to renewable energy will fundamentally alter the energy system and significantly help to achieve other Sustainable Development Goals (SDGs) such as eradicating poverty, promoting good health, ensuring access to clean water, and reducing climate change, according to the UN’s SDGs [1,2,3,4].
Around 840 million people worldwide still do not have access to electricity. In sub-Saharan Africa only, there are 573 million individuals without access to electricity [4]. There is better access to energy in Ghana and a few other African countries. Ghana’s coverage rates for urban and rural electricity in 2018 were 94% and 67%, respectively [5]. At the moment, standalone and grid-connected mini-grid systems are considered some of the accessible alternative energy solutions required to improve and quicken the availability of electricity in many rural and sub-urban areas [6]. The utilization of renewable energy sources (RESs) is growing today in order to address the problems with electrical power networks. Supporting the constantly falling usage of conventional sources, such as in various coal and natural gas power plants, is one of the largest problems. The combustion of coal, oil, and natural gas has long contributed significantly to the world’s energy supply. It is commonly known that fossil fuels are a source of greenhouse gas (GHG). GHG emissions have a significant detrimental influence on the environment because they change the climate. The supply of fossil fuels will eventually run out, according to a study. The majority of industrialized and developing countries, including Ethiopia, continue to use these conventional energy sources as their primary source of energy for transportation and power generation, despite the negative environmental effects they produce. Providing power to varying loads in accordance with societal, industrial, and national patterns is another challenge. Compared to RESs, conventional energy sources also have a number of disadvantages, including the maximum costs, maximum pollution levels, rapid depletion rates, and strict rules regarding GHG pollution [7]. The advantages of RESs over conventional energy sources, in contrast, are their affordability, environmental friendliness, low maintenance requirements, and the fact that they do not deplete when used [8]. The majority of countries, therefore, plan to utilize RESs, such as solar, wind, wave, and hydropower, for a range of uses, including heating, energy, and transportation [9]. As a result of their accessibility and continually decreasing acquisition costs, RESs are regarded as the most preferred choice [10]. According to the most current revision of the International Energy Agency’s (IEA) estimates on renewable energy sources, estimated energy generation is almost 8.3 × 10⁹ MWh, which is the greatest change in the energy sector [11].
In order to back up intermittent renewable energy sources (such as solar and wind), energy storage systems (ESS), such as pumped hydro energy storage (PHES) or superconducting magnetic energy storage (SMES) systems, are required. When RESs provide more power than the connected load, the ESS stores the extra power and sends it back into the grid when the connected load needs more power than what RESs can provide. When the storage system cannot give the loads the power they need, some systems use diesel generators or another traditional source of energy. However, these alternatives are neither economically feasible nor environmentally friendly. It is suggested that the PHES be used both to help power systems that are already in place and to store energy, especially for large-scale HRES. Many projects and studies throughout the world have used this sort of ESS [12,13,14,15,16,17]. These PHES systems can operate as standalone [12,13,14] or grid-connected [15,16,17] mode systems and can be used for long-term sustainable energy storage systems. It takes at least four minutes for biogas and PHES to provide power to the connected load. SMES, or quick response energy storage system, is used to smooth the output power from solar and wind [18,19]. SMES can be utilized in any power source change because it responds in milliseconds.
The IEA’s recent efforts to safeguard the environment from GHG emissions have resulted in the establishment and present implementation of national and international laws to reduce the use of fossil fuels. The Paris Agreement, for instance, aims to make the world’s response to climate change better by keeping the rise in global temperature to less than 2 °C and agreeing to reduce GHG emissions, while also making a commitment to adapt behaviors. Additionally, it strengthens countries’ ability to combat climate change’s effects [20]. To meet the Kyoto Protocol’s goal of lowering carbon dioxide, a number of governments have suggested and approved plans to increase the use of biomass to meet future energy needs [21]. At the moment, the world is putting a lot of attention on clean energy as a way to make electricity. This is because people are using more electricity, fossil fuels are running out and getting more expensive, crude oil reserves are running out, fossil fuels are in short supply, and there are environmental concerns [22,23].
A hybrid renewable energy source (HRES) system integrates several power generation techniques, whether they operate independently from the grid or together, and whether they use renewable or conventional fuels [24,25]. HRES is already well known as a desirable option for grid-connected or standalone modes of power generation in urban and rural areas because of recent improvements in renewable energy technology. Hybrid systems are more reliable and cost-effective than single-source renewable power production systems, according to numerous evaluations of their technological viability, dependability, and financials [26]. Greater efficiencies are also made possible by hybrid systems than by a single renewable energy source.

1.2. Related Works

Several studies have been carried out to establish the optimal size for hybrid renewable energy generation utilizing HOMER software, MATLAB, metaheuristic algorithms, and others. The capacity optimization of hybrid renewable energy conversion systems that are connected to the grid has received less attention than standalone hybrid power generation systems, which have been the subject of extensive research. Around the world, research is actively being done on the resilience of hybrid energy systems for a number of purposes.
Oladigbolu et al. (2020) [27] conducted a thorough investigation utilizing HOMER software to determine whether it would be possible to generate electricity in Nigeria using different HRES designs. Elements such as micro-hydro turbines, solar panels, wind turbines, batteries, and diesel generators were integrated to create diverse combinations that improve system reliability. The PV/diesel/battery system performed remarkably well in terms of fuel use and CO2 savings, according to the data, and is the best choice for each of the six locations. In order to simulate various hybrid system architectures for rural electrification in West China, Li et al. (2020) [28] employed HOMER. The hybrid system configuration is produced by combining solar panels, wind generators, and biogas generating sets. The benefit of the modeled hybrid off-grid systems was compared to that of grid expansion in the study. Anik et al. (2020) [29] looked at the possibility of creating a PV/WT hybrid system that is a grid-connected mode of operation. The goal of this work was to reduce LCOE. The results showed that the LCOE of the PV/WT system that is connected to the grid is lower than that of the grid as it is now. Additionally, a HRES system could be annually cut roughly 1894 tons of CO2. Additionally, 587 tons of coal are anticipated to be saved. Aziz et al. (2019) [30] proposed HOMER to evaluate the performance of several HRES systems for rural electrification. According to the data, PV/hydro/diesel/battery systems are the most economical options for rural electrification. Mamaghani et al. (2016) [31] evaluated the utilization of diesel gen-sets, wind turbines, and PV modules for remote area electrification systems. The optimal modeling of the plant was run in the HOMER program in order to thoroughly examine the system configuration and estimate which was the most affordable. According to this research, using diesel in addition to renewable energy significantly reduces carbon emissions. The HOMER software is simple to study and use; however, the objective functions and constraints are established by the software, and it is not capable of executing multi-objective functions (such as financial, reliability, and carbon emissions) simultaneously.
Numerous advanced optimization algorithms for the optimum design of hybrid RES have been offered in multiple research publications published in peer-reviewed journals, which are utilized to solve multi-objective functions with regard to constraints. In most research works, financial objective functions are the most prioritized over the other two objective functions (such as reliability and carbon emissions). The optimal size of a hybrid PV/WT/DG system was determined in [32] by using the multi-objective station competition method to assess two objective functions, such as system cost and carbon emissions. In [33,34,35], a genetic algorithm (GA) was used to find the best size and design for a hybrid PV/WT power system with battery storage, taking into account things such as how reliable the system is when the weather changes, how much it costs each year, and how likely it is that the losses of power supply probability (LPSP) will occur. Several research studies have used particle swarm optimization (PSO) to improve the performance and reliability of hybrid renewable energy systems [36,37]. The PSO was used by Suresh et al. (2022) [38] to assess the technical and financial viability of hybrid systems utilizing wind, PV, diesel, and batteries. The findings indicate that, although having a higher initial cost, the wind/PV/diesel/battery option is more cost-effective than the diesel alternative. Fadli and Purwoharjono (2019) [39] proposed a multi-objective bat algorithm (MOBA) for designing a PV/DG/BES microgrid system for a distant community. The author achieved comparatively good results for LCOE and LPSP, which are USD 0.108 per kWh and 0.238, respectively. This illustrates that the system can accomplish the target constraints for remote electric access while also ensuring a steady supply of electricity. The whale optimization algorithm (WOA), water cycle algorithm (WCA), moth-flame optimizer (MFO), and hybrid particle swarm-gravitational search algorithm (PSOGSA) were used to determine the optimal sizing of a hybrid PV/WT/DG system, as well as the construction of two objective functions such as cost of energy (COE) and LPSP. WOA was very good at running its business, as shown by the fact that it had the lowest COE and the fastest speed of convergence with the smallest LPSP [40]. Arasteh et al. (2021) [41] utilized an improved whale optimizer algorithm (IWOA) to optimize a PV/wind/battery system. The hybrid PV/wind power system was found to have lower energy costs than standalone power systems.
The goal of this study is to evacuate multi-objective functions (such as financial, reliability, and carbon emissions) on a grid-connected hybrid solar PV–biogas with SMES-PHES energy storage system that can deliver affordable electricity to the connected loads. The study’s objective is to access power with minimum NPC, minimum LPSP, and minimum CO2 emissions. The study’s findings are important for policymakers who want to increase the percentage of distant areas from the main grid in Ethiopia that have access to power. Additionally, it warns and educates decision makers to encourage implementations of sustainable renewable energy choices such as biogas, PV, pumped hydro and superconducting energy storage system.

1.3. Contribution and Organization of the Paper

The most important contributions to this work are the following:
  • To examine the impact of various inputs of financial, reliability, CO2 emissions parameters, and sensitivity analysis is performed on the optimized hybrid system components;
  • Uncertainties in providing load demand in grid-connected systems are correctly addressed by a hybrid solar PV–biogas system with a SMES-PHES energy storage system based on an energy management strategy;
  • Optimal sizing of grid-connected hybrid solar PV–biogas with SMES-PHES energy storage systems are depending on three objective functions such as NPC, LPSP, and CO2 emissions by utilizing metaheuristic optimization techniques;
  • Comparing the optimization outcomes of the three solutions mentioned in each Pareto front. These are the points of economical, compromised, reliable, or environmental proportionality;
  • Establishing a mathematical model for each system component in order to discover the best compromise option in terms of cost, reliability, and environmental impact;
  • In terms of global solution capture and convergence time, these optimization findings verified the NSWOA algorithm is superior to the other metaheuristic optimization techniques.
The contributions listed above were used to supply a load in Debre Markos, Ethiopia. The majority of the loads in this category are for the residential, commercial, machine lab, and livestock sectors, which mostly depend on diesel generators. Adopting influential HRES at this location will improve the quality of life in these settlements, get rid of the pollution caused by diesel generators, and cut energy costs by a large amount. Furthermore, in addition to all of the benefits mentioned above, the optimum exploitation of the SMES and PHES energy storage systems in this situation gives still another motivation to launch these new HRES research concepts.
The rest of this paper is organized as follows: Section 2 describes the overview of the study area and existing system. Section 3 presents the suggested methodology. Section 4 creates a hybrid system configuration and descriptions. Section 5 gives evaluation parameter modeling, followed by the formulation of the optimization problem in Section 6. Section 7 gives simulation results and discussion, followed by the conclusion in Section 8.

2. Over View of Study Area and Existing System

Debre Markos distribution station feeder, Debre Markos, Ethiopia, was the site of the proposed investigation. This origin’s longitude and latitude values are 37.44 N and 10.22 E. Figure 1 depicts the location details of the research origin by using Arc Geographic Information System (ArcGIS version 10.3) software [42].
Debre Markos University has certain facilities such as different machines, electronics, and agricultural laboratories, auditoriums, student dormitories, different school classrooms, a water pump, different cooking machines, a teachers’ lounge, teachers and administrative offices, and some other facilities. In this organization, the poor power quality national grid and big diesel generator provide the connected load. The selected site is affordable for solar PV power generation. The weather condition in February and the temperature at the specified location reached 28.5 °C. In July, the low temperature was 8.72 °C. Solar radiation data were extracted from NASA’s database. The average annual solar radiation in the study area was 6.6701 kWh/m2/day (ranging from 5.6011 to 6.80 kWh/m2/day).
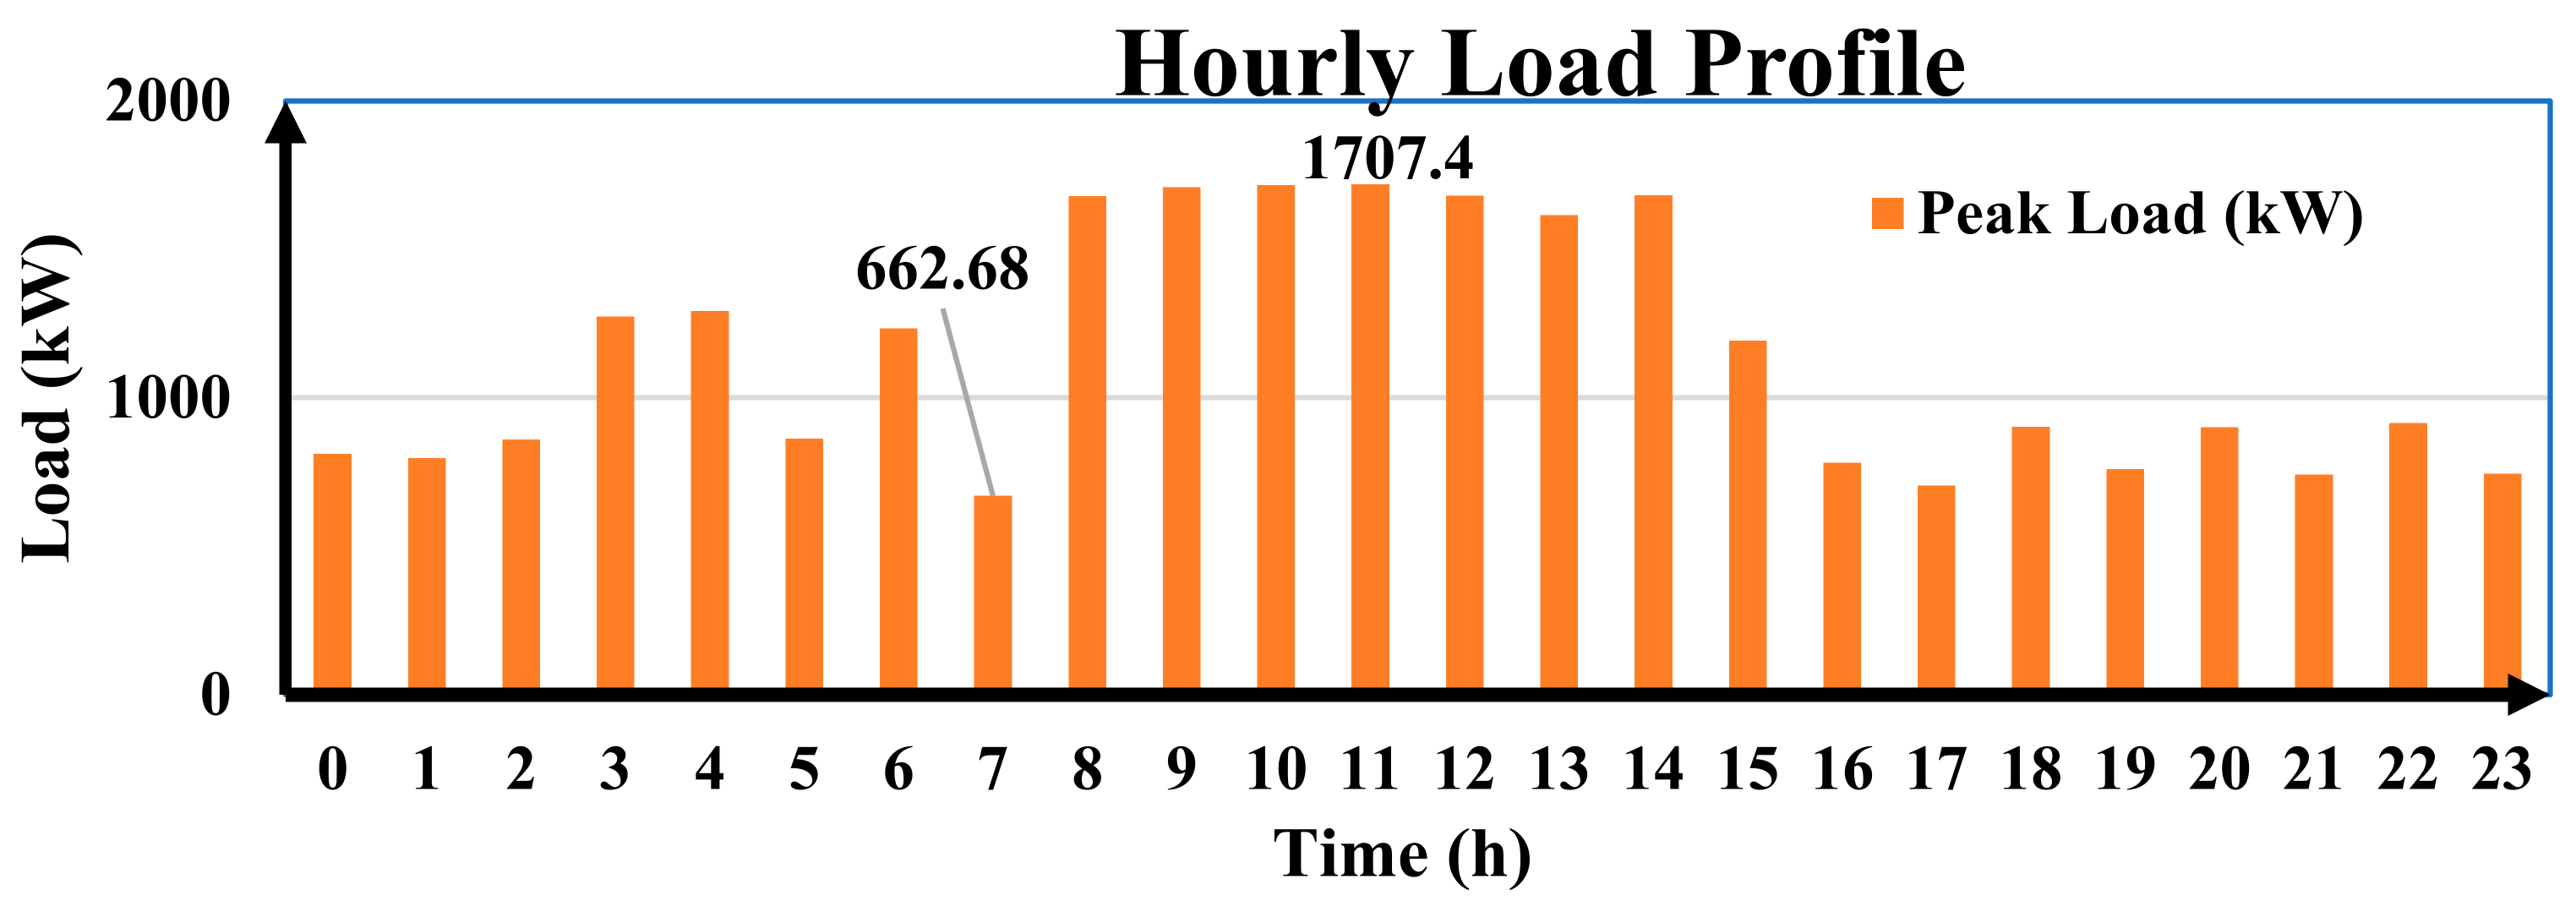
The average hourly electrical energy consumption (24 worst-case data points) was taken from Debre Markos University, Ethiopia. The connected load profile is slightly raised to 1707.4031 kW from 1668.3000 kW (from 08:00–09:00 h to 14:00–15:00 h); the load with the highest demand is then connected. During the night (from 16:00–17:00 h to 02:00–03:00 h), the load ranges from 687.3800 kW to 892.8500 kW. Between 07:00 and 08:00, electricity demand falls to 662.6801 kW, resulting in the system’s minimal load. The minimum load requirements are connected to the national grid between 07:00–08:00 h, as shown in Figure 2.
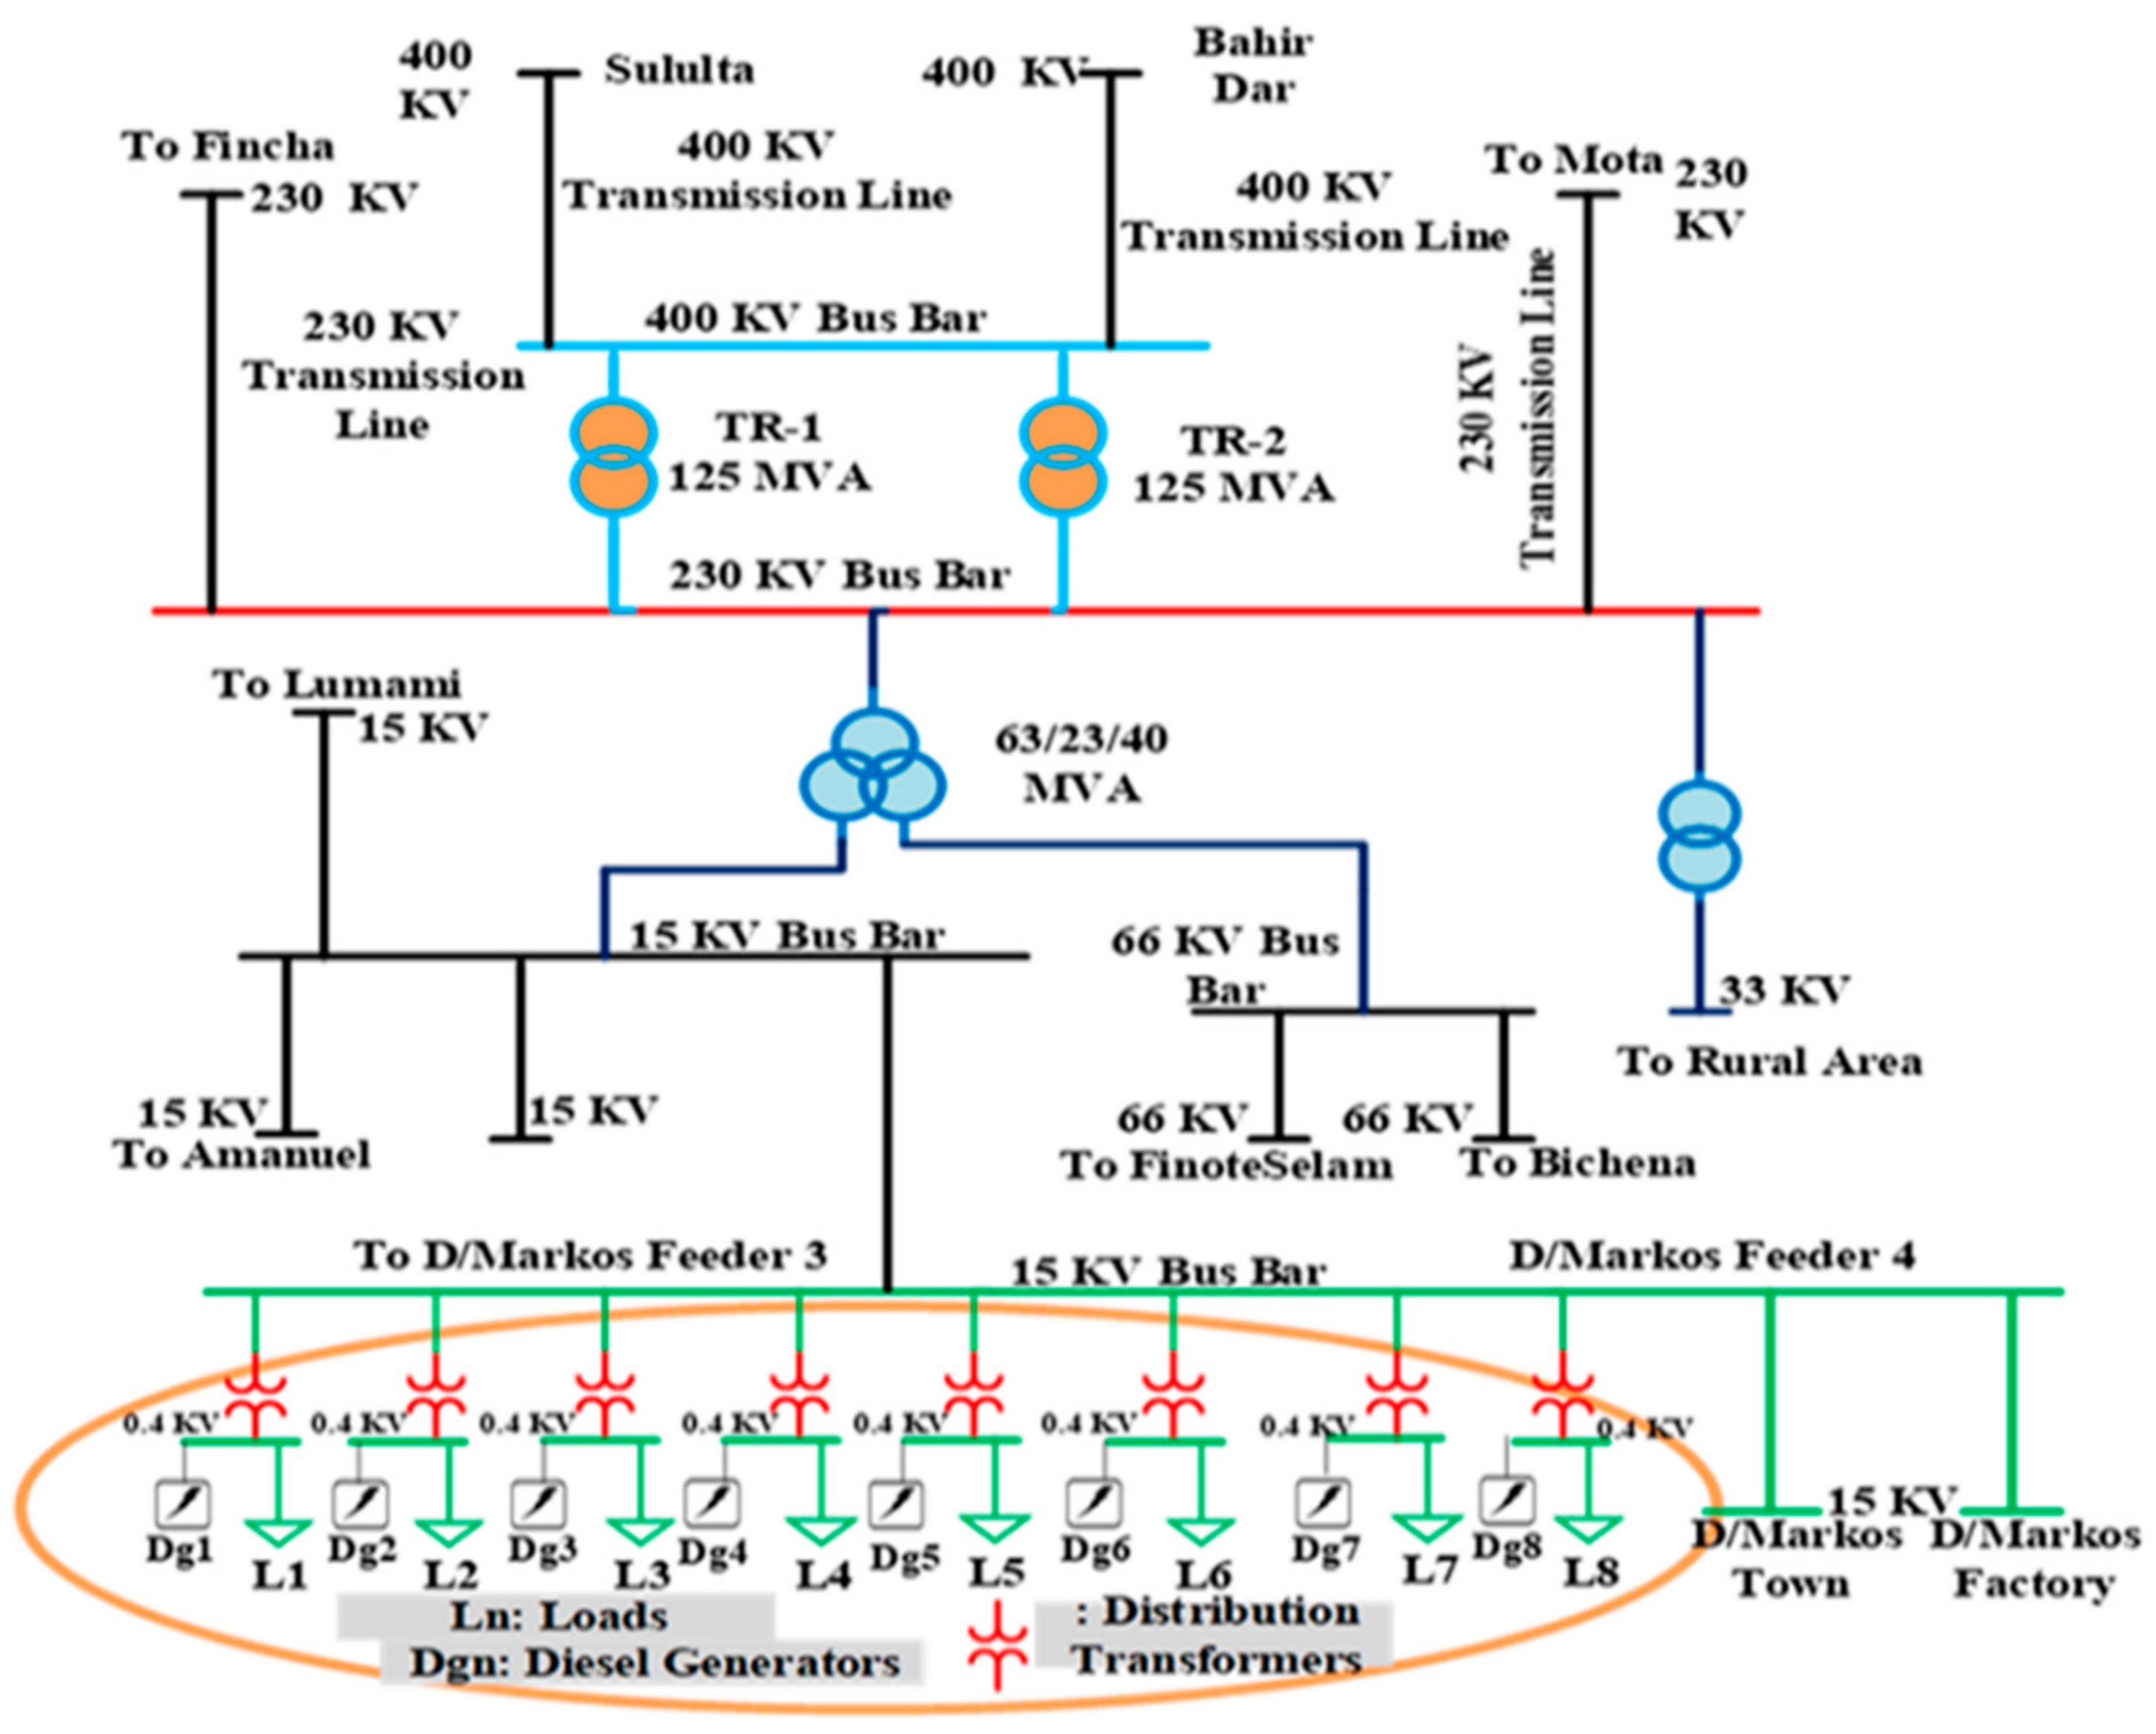
The current power generation system consists of eight diesel generators interconnected in parallel with the output side of the transformer in a common bus; each generator has a 650 KVA capacity. The existing distribution network layout is illustrated in Figure 3.

3. Methodology

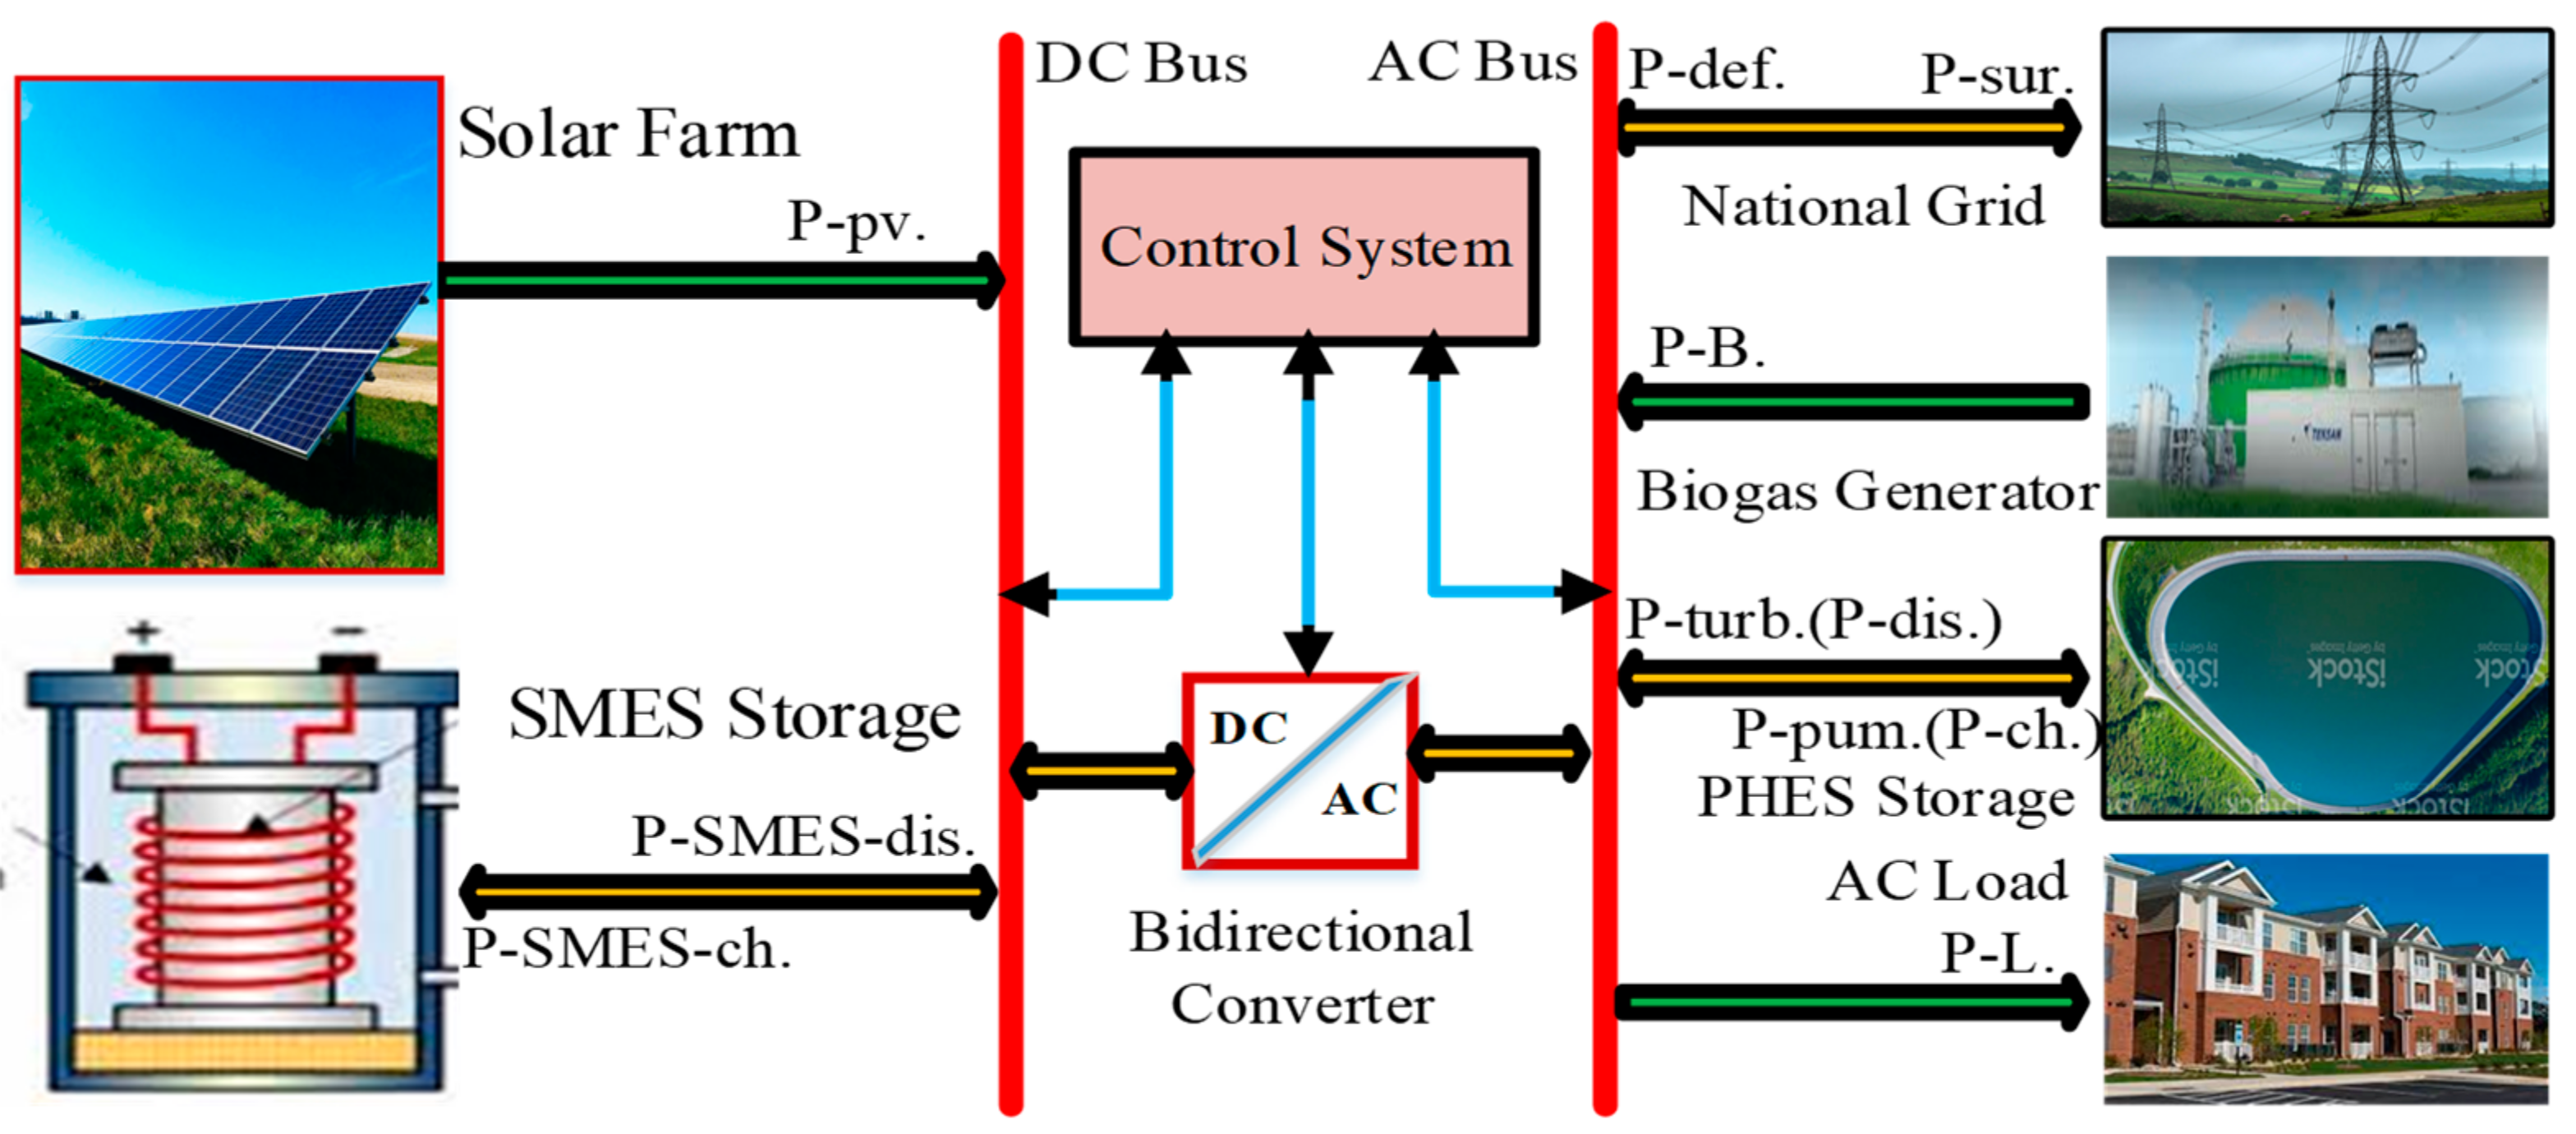
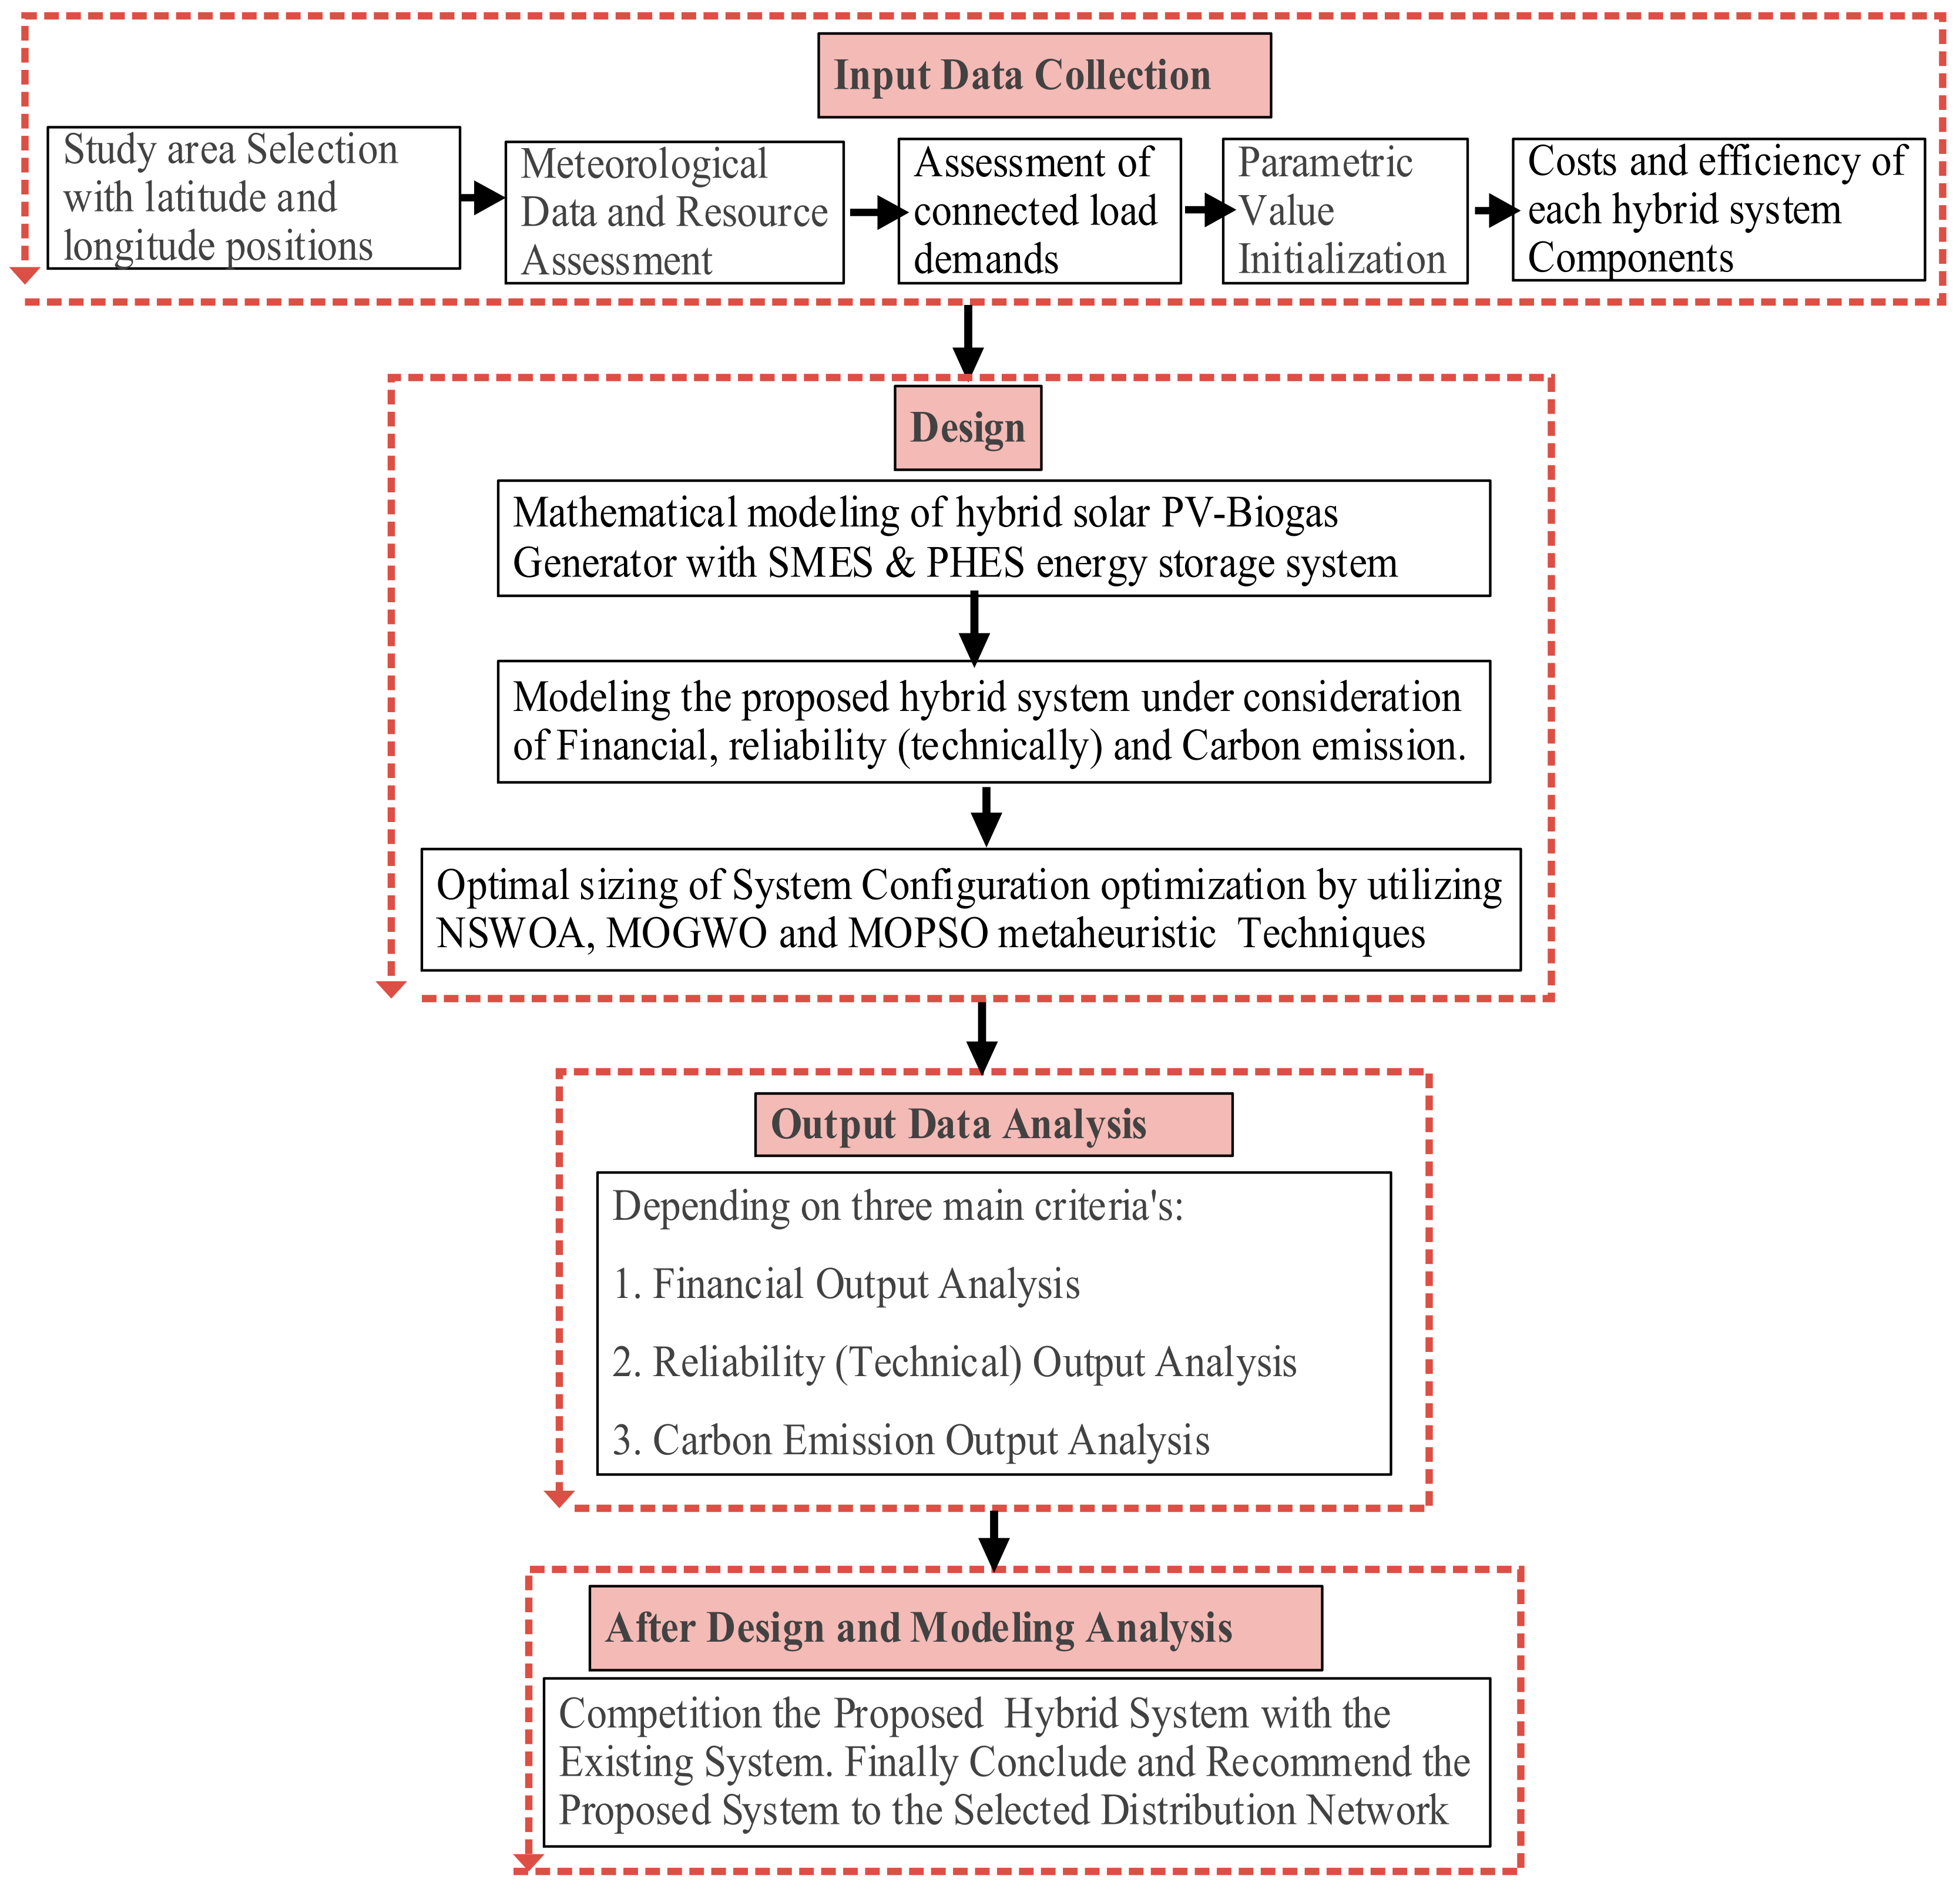
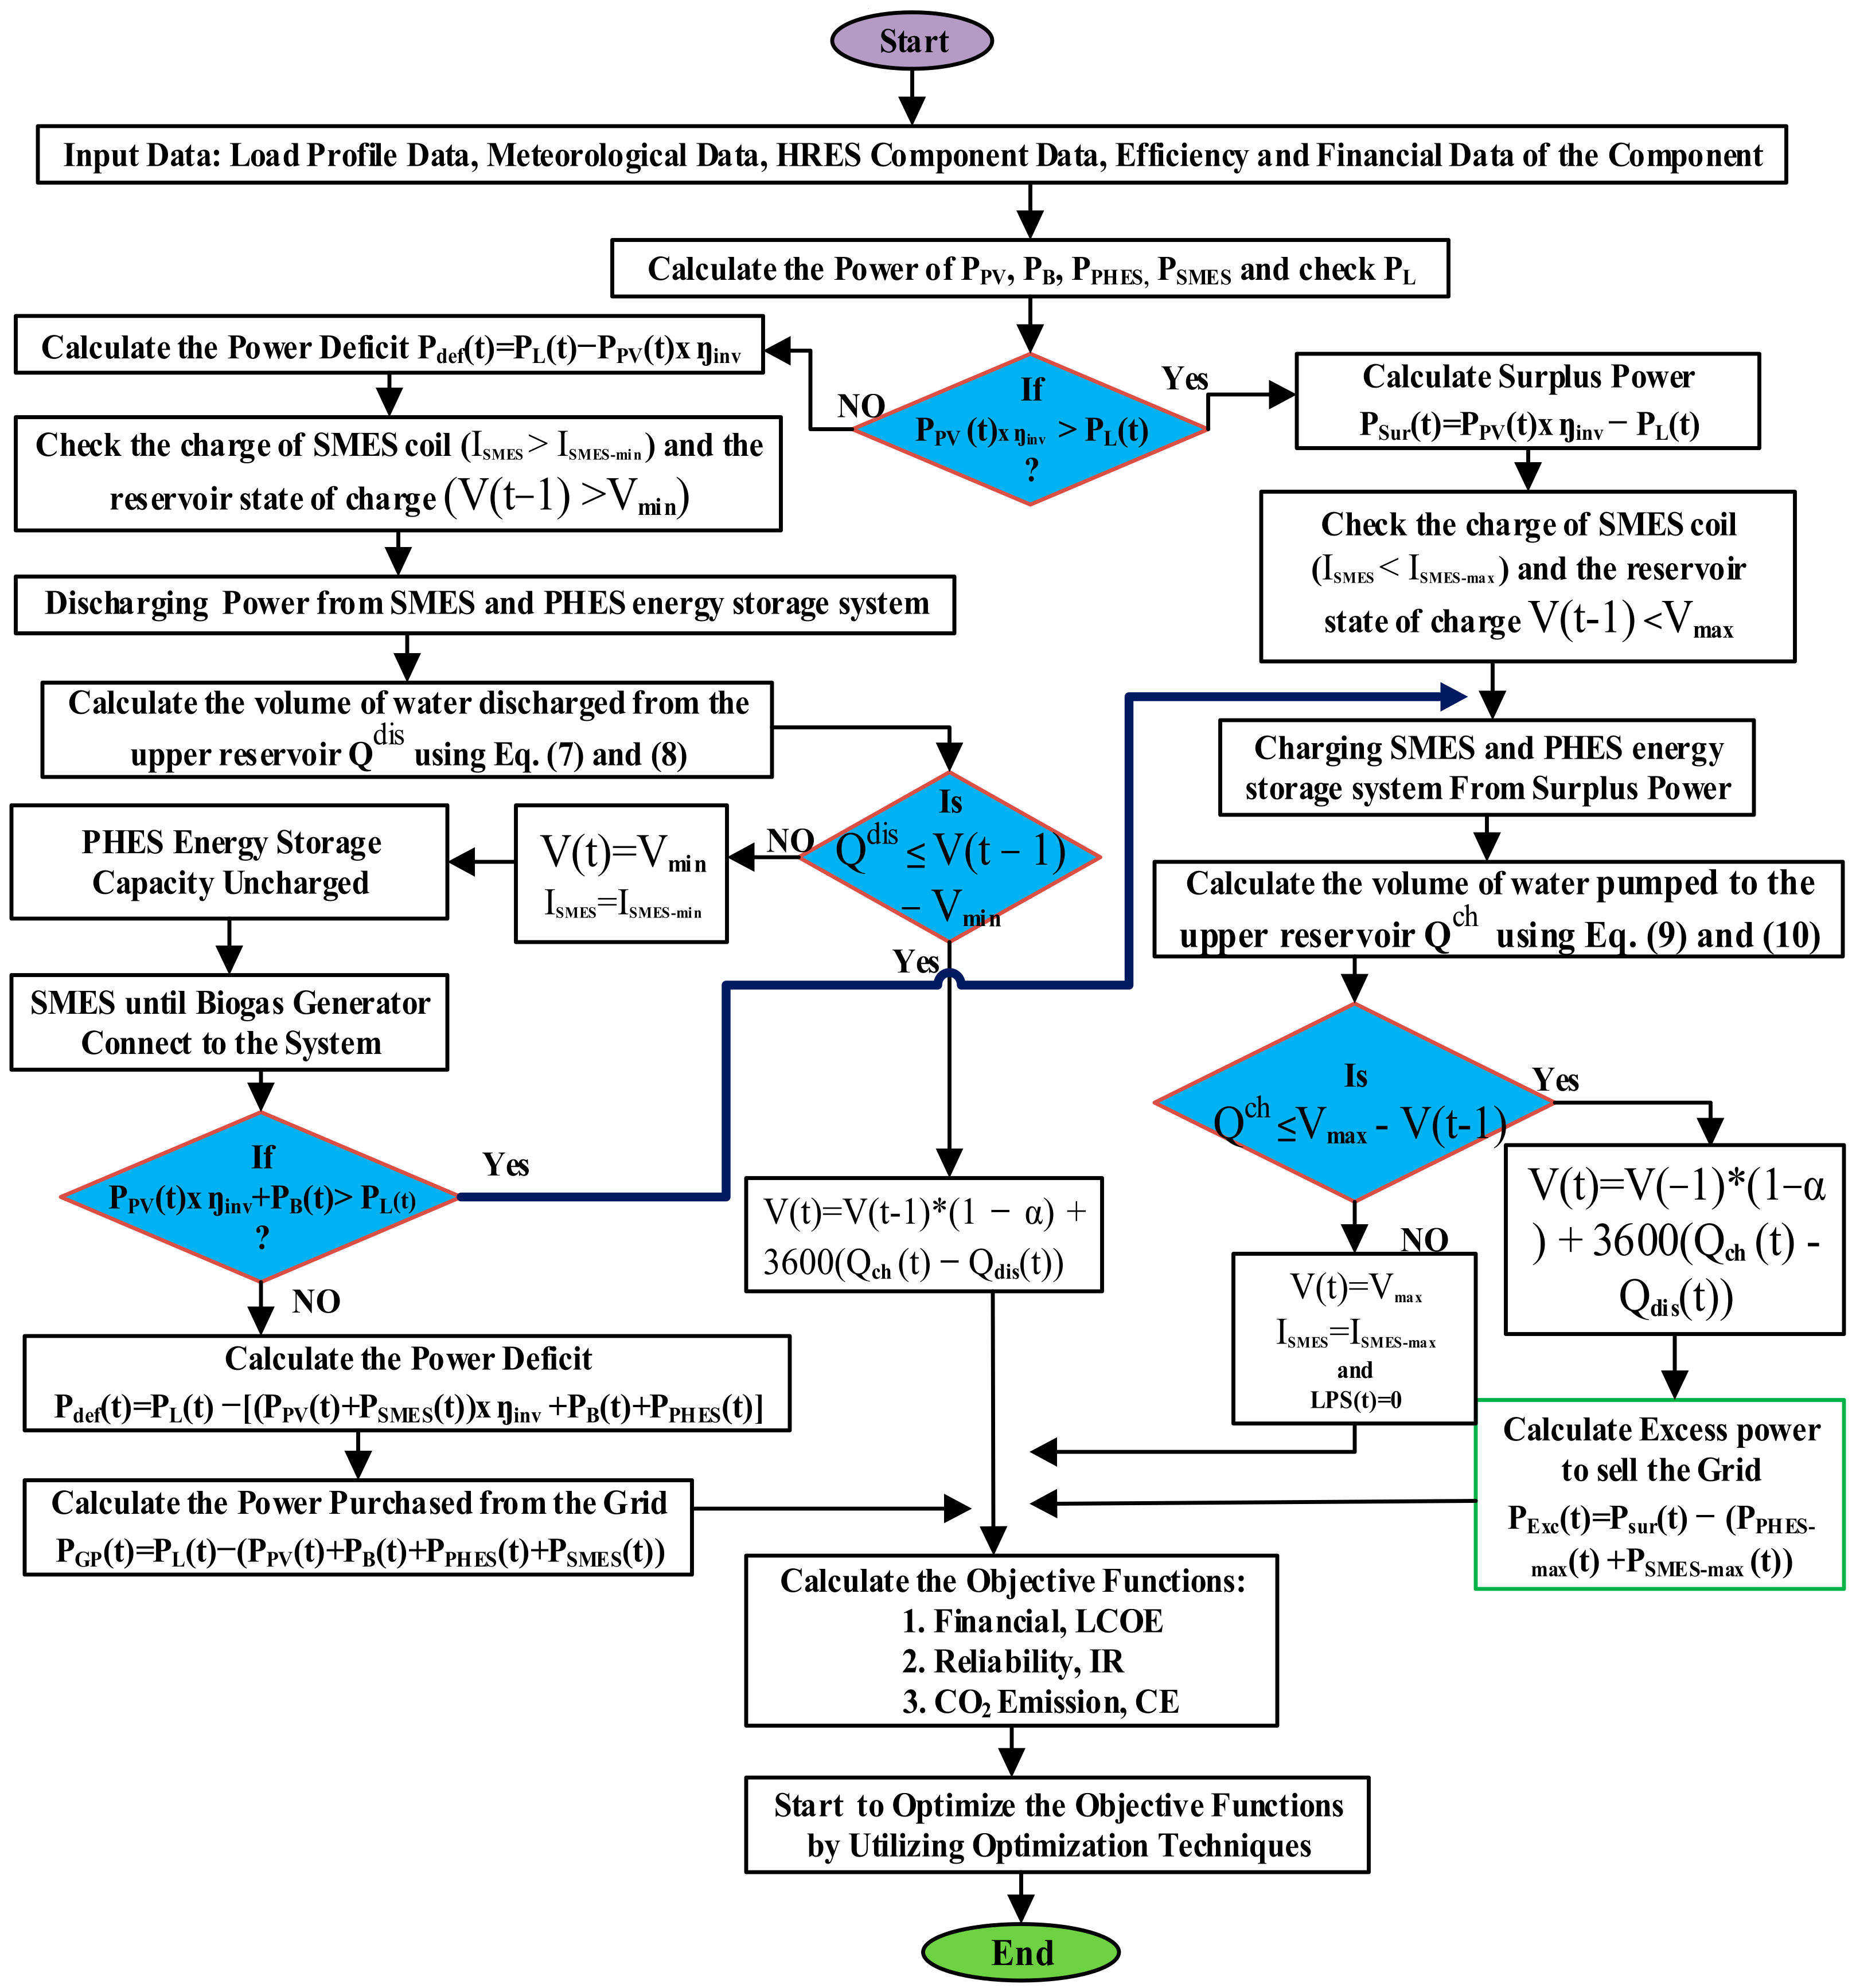
To design a hybrid solar–biogas system with SMES and PHES energy storage systems, some inputs must be provided, such as an hourly load profile, available biogas input data, biogas cost, monthly solar radiation, PV system value, the starting price of each unit (such as PV panel, biogas generators, SMES, PHES, converters), the annual real interest rate, the project lifetime, and so on. The projected equipment’s wattage and hourly usage were used to calculate the load profile for the research region. The HRES design must be optimal in order to supply electricity reliably, economically, and with minimum CO2 emissions. The hybrid system’s component configuration is tuned to minimize NPC, LPSP, and CO2 emissions. The next part goes into a considerable discussion of the modeling of each HRES unit. However, as shown in Figure 4 this system includes several components, such as PV panels, a power converter, a utility grid, a biogas plant, a SMES, and a PHES energy storage system. In fact, this study made use of four hourly measured input data sets. These numerical values are needed to calculate the size of a grid-connected hybrid solar PV–biogas generator with SMES and PHES energy storage systems located in Debre Markos, Ethiopia. As a result, the hourly solar horizontal irradiance is described by KW/m2, the hourly ambient temperature is indicated by °C, the hourly power load demand is indicated by MW, and the hourly wastes are described by tones. The flowchart illustrated in Figure 5 is the general procedure of the methodology.

4. Hybrid System Configuration and Descriptions

Figure 5 depicts the proposed hybrid energy system configuration. It is a grid-connected hybrid system that includes a solar PV system, a biogas system, SMES, PHES, a bidirectional inverter, and a connected load, as well as national grid connections on both the DC and AC buses. There are two main sources of energy production units: solar PV and biogas. The solar PV and SMES energy storage systems are interconnected to the DC bus bar, whereas the biogas generator, PHES energy storage system, loads, and national grid are interconnected to the AC bus bar. The bidirectional DC/AC converter functions as both an inverter and a rectification bridge while converting AC to DC electricity. The PHES and SMES energy storage systems are utilized to feed the electricity supply when solar PV output power cannot satisfy the load completely. Purchase power from the national grid to represent the second spare source and deliver power when neither solar PV nor biogas generators can provide output power, nor do the PHES and SMES have stored energy.

4.1. Mathematical Modeling of Hybrid System

A photovoltaic array, a biogas generator, a SMES, and a PHES energy storage system are all part of the proposed HRES. The next subsections demonstrate the modeling of each component of the HRES.

4.1.1. Solar Energy Conversion System Modeling

The chosen area is in one of the country’s moderate solar radiation zones. The insolation received in the selected areas is just enough to generate power for the majority of the year. According to NASA and the Ministry of Energy (Ethiopia), the state receives an average of 5.6011–6.80 kWh/m2 of solar energy. The integration of the power generated by the solar generating unit with temperature and sun irradiation could use a simple relationship [43,44].
P P V t = P P V r × ϑ i t 1000 × 1 + α c γ
γ = τ α + 0.0256 × ϑ t τ p
α c = 3.7 × 10 3 / ° C

4.1.2. Biogas Generator System Modeling

The biogas unit shown in Figure 1 generates gas from the fermentation of organic materials burned within the AC generator to generate electrical energy. Equation (4) is used to calculate the size of an AC generator that can be installed in a specific area. This biogas energy is included in the power balance calculation. A simple formula for calculating the output power of a biogas generator is as follows [45,46]:
P B t = V B t × C V B × η B 860 × t B

4.1.3. Pumped Hydro Energy Storage System Modeling

The PHES system functions in this work in a very conventional way. The electrical network’s energy flow is continuously observed. The PHES system enters a pumping mode when there is extra energy on the electrical grid and the upper water reservoir is not full. This mode lasts as long as there is extra energy and the upper reservoir is not full. The PHES system switches to power generation mode to supply the power that was previously met when a source (photovoltaic) is unable to fully meet the demand that was previously met by diesel generator plants and the national grid. To perform the pumping and generating mode of operation, the energy balance in the system should be executed appropriately by using the following equation:
P b a l a t = P P V t P L t
Therefore, the mode of operation (generating and pumping mode) depends on the values of P b a l a .
a. 
Generating Mode ( P b a l a < 0 ): It suggests that the demand exceeds the PV system’s electricity generation. In this situation, the energy needed must be available from the storage system. How much power the PHES can generate depends on the volume of water in the upper reservoir and the turbines’ output power. The upper reservoir’s ability to hold enough water will allow it to meet the loads’ energy needs. In any other case, the storage system will attempt to function. In generation mode, the equation of the PHES system is represented as [47,48,49,50]:
E P H E S g e n t = min min V t 1 3600 ; Q T η T η P ρ g h a d d + h 3 ; E B
Q d i s t = E P H E S g e n t g × ρ × η T × η P × h a d d + h 3
P P H E S g e n t = Q d i s . t × g × ρ × η T × η P × h a d d + h 3
As expressed under Equations (6)–(8), ρ represents the density of water and is equal to   1000   kg / m 3 , and g represents the gravitational constant considered here equal to 9.81 m/s of the proposed system.
b. 
Pumping Mode P b a l a > 0 : The proposed system then has excess power. The PHES process will pump until the upper reservoir is filled if the upper water tank is not yet full. The level of water in the reservoir, the amount of excess energy, and the maximum power of the PHES in pumping mode all affect how much water is pumped.
E P H E S p u m p t = min min V max V t 1 3600 ; Q P ρ × g × h a d d + h 3 η p u m p × η P ; E B
Q c h a t = E P H E S p u m p t × η T × η P g × ρ × h a d d + h 3
P P H E S p u m p t = Q d i s . t × g × ρ × h a d d + h 3 η p u m p × η P

4.1.4. SMES Energy Storage System Modeling

SMESs can store excess or surplus energy produced by the hybrid system and release it when needed to meet peak load demand, rather than limiting it when load demand is low. This can be done until long-term energy sources are connected to the system during the day. In other words, SMESs can act as loads to store energy while charging and generators to release or transfer energy while discharging. Reactive power can also be delivered or absorbed [51,52]. The SMES had two modes of operation, as explained below.
a. 
Charging mode: When the hybrid system power P s y s exceeds the load demand P L (i.e., P L P s y s < 0 ), this mode of operation happens.
P e x c h t = max Δ P t , ( E e x c h t 1 E e x c h max t Δ t × η c h , P e x c h r a t e d
E e x c h t = min E e x c h t 1 P e x c h c h t × Δ t × η c h , E e x c h max
b. 
Discharging mode: When the load demand P L is higher than the hybrid system power P s y s (i.e., P L P s y s > 0 ), this mode of operation happens.
P e x c h t = max Δ P t , ( E e x c h t 1 E e x c h min t × η d i s Δ t , P e x c h r a t e d
E e x c h t = max E e x c h t 1 P e x c h , d i s × Δ t η d i s , E e x c h min
State of charge (SOC) represents an index of the energy stored in the SMES, with an initial value S O C i n i t i a l to be optimized for each SMES serving different load models [53,54,55].

4.1.5. Inverter Energy Conversion System Modeling

As expressed in Equation (16), the power inverter converts the DC sources provided by the PV output to AC electricity. This PV output from the inverter will be utilized in the energy management strategies, as explained in the next sections. The size of the inverter is calculated as follows [56,57]:
P i n v t = P P V t × η i n v × N P V × f P V

4.2. Proposed System Operational Procedure and Power Management Strategy

The following operational scenarios provide a summary of how the proposed hybrid renewable energy system would function. Figure 6 shows a flow chart that describes the operating strategy of a hybrid system. Whenever load demand changes, there is a change in the power supply system. Changes in supply are proportional to changes in load demand, so as load demand rises so does system power supply (generation). From this point of view, the power system stability problem in the distribution system can be reduced. As a result, the power supply must be adjusted to minimize the change in hybrid power generation and load requirements when operating in fast mode. This means that as the load demand rises, the power supply should rise along with it, and once the load demand falls, the power supply should drop or be unplugged from the grid-connected hybrid power production system. On this basis, a hybrid system proceeds as follows: when a change in power generation minus load demand becomes negative, SMES responds within milliseconds and supplies the power to the system until long-term energy storage (PHES) or a biogas generator starts to supply the connected load. However, before SMES operates, it must undergo that process where the inductor current (ISMES) of the superconducting coil is compared to its lower limit of inductor current (ISMESdL). If the SMES coil’s current exceeds ISMESdL, SMES discharges and sends electricity to the hybrid power system that is connected to the grid; otherwise, SMES is unable to generate power. In another circumstance where the difference between the change in power generation and the load demand is positive, the SMES does not supply the power but keeps running until the long-term energy storage system or other energy sources are ready to meet the connected demand. For some of the excess power supplied to the SMES before charging the SMES, its inductor coil current has reached its upper limit. If the inductor current is less than the upper limit, then SMES is in charging mode and consumes power from the grid-connected hybrid power generation system; otherwise, SMES does not charge. When there is no difference between the change in power generation and the change in load demand, the SMES remains in standby mode, indicating it is neither charging nor discharging. Long-term energy storage systems (PHES) and SMES both have the same commands.
Based on the availability of P P V , P L , and SOC of energy storage systems such as SMES and PHES, the proposed power management’s general operational modes are as follows:
  • Mode I ( P P V > P L ): In this mode, the available solar PV output exceeds the load demand, and energy storage systems (i.e., SMES and PHES) can absorb the extra power. The PV runs at MPP, while the SMES keeps the common DC bus voltage at its nominal value;
  • Mode II ( P P V < P L and P P V 0 ): The load demand cannot be satisfied in this mode by solar PV power. Therefore, energy storage system (i.e., SMES and PHES) discharges to meet the extra load. SMES energy storage system provides for transition periods;
  • Mode III ( P P V > P L ): If the amount of solar PV power available is more than the amount of power needed and the energy storage systems (SMES and PHES) are full, the extra power is sent to the national grid through feed-in-tariff agreements;
  • Mode IV ( P P V = 0): Solar PV power is not available on cloudy days or at night. In this mode, the PV is not connected, and the connected load demand is met by the energy storage systems (i.e., SMES and PHES). Whenever P P V < P L and energy storage s ystem (i.e., SMES and PHES) is not able to meet the connected loads, then the biogas generator is on and provides power to unmeet connected loads;
  • Mode V ( P P V + P B + P S M E S + P P H E S > P L ): If the hybrid system is not capable to supply the connected load, then the deficit power is taken from the interconnected national grid through purchasing agreement.

5. Evaluation Parameter Modeling

5.1. Economic Modelling

This section shows the math model for the key economic factors, such as the levelized cost of energy (LCOE), the annual real interest rate, the total net present cost (TNPC), the annualized cost of the system (ACS), and the cost of energy (COE).
Equation (17) displays the annualized cost of the system (ACS), which is expressed in USD/yr, as the sum of the costs of the system’s component parts, such as solar PV panels, power inverters, a biogas plant, energy storage at SMES and PHES, energy sold to the grid, and electricity purchased from the grid [58]. ACS is a required input parameter for calculating NPC, which is one of the objectives to be optimized. This ensuing Pareto front connects NPC with LPSP and CO2 emissions to explain the relationship between system affordability, reliability, and environmental friendliness, respectively.
A C S = N P V × A C P V + P B × A C B + P i n v × A C i n v + P P H E S × A C P H E S + P S M E S × A C S M E S + C G P C G S
The COE (USD/kWh) is the cost per unit of electrical energy produced by the system and can be calculated as follows [59]:
C O E = C a n n _ t o t h = 1 h = 8760 P l o a d = N P C h = 1 h = 8760 P l o a d × C R F
where C a n n _ t o t , CRF, and P l o a d are represented as total annualized cost, cost of recovery factor, and connected load power.
The investigated system’s TNPC in USD is the present value of the whole system’s components throughout the project’s lifespan. This comprises the capital cost, replacement cost, operating and maintenance cost, and salvage value, all while taking the time value of money into consideration. In this research, TNPC was one of the best objective functions. Equation (19) can be used to calculate the TNPC. CRF(r, M) is the capital recovery factor value, and it can be computed using Equation (20); where r represents the real interest rate (%) and M represents the project length (in years).
T N P C = A C S C R F r , M
C R F r , M = r 1 + r M 1 + r M 1
The LCOE is the ratio of the ACS of the system’s parts to the amount of energy made from renewable sources and used by the load over a year (kWh/yr). It is a widely used indicator of economic viability that is calculated using Equation (21) [60]. The LCOE represents the average cost per kWh generated by the HRES.
L C O E = A C S Total   Energy   Consumed   by   the   Load   kWh / year  

5.2. Reliability Indicators

The system’s reliability is defined as the HRES’s capacity to supply enough energy to the load demand without running out or in outage mode. There are numerous reliability indicators for the proposed HRES system. EENS and LPSP [61], the index of reliability (IR) [62], LOLP [63], and loss of load expectation are the most popular measures of the reliability of an energy system. These indicators indicate how much of the load has been satisfied. EENS can be calculated using Equation (22) by calculating the amount of energy shortage in the load [64], where P L is the power of the load demand, and P G P is the amount of power purchased from the utility grid.
E E N S = t = 1 8760 P L t + P P H E S & S M E S c h a t P P V t + P B t + P P H E S & S M E S d i s t + P G P t
LPSP can be calculated as the ratio of the EENS with the total energy provided to the connected load using Equation (23). Equation (24) shows how this reliability index is used to figure out how well the HRES can handle the load without running out of energy [65,66].
L P S P = E E N S t = 1 8760 P L t
I R = 1 L P S P
According to Equation (25), LOLP can be mathematically computed by dividing the total number of hours by the 8760 h period during which the power of the load demand exceeds the quantity of energy purchased from the grid and renewable sources [67]. The LPSP and LOLP indices have a 0 to 1 range. A value of 0 implies that there is no lack of energy. The number 1 indicates that each one-hour time step always has an energy deficit. LOLE is an abbreviation for service disruptions in days and is calculated using Equation (26).
L O L P = t = 1 8760 h o u r s # a t P L t + P P H E S & S M E S c h a t > P P V t + P B t + P P H E S & S M E S d i s t + P G P t 8760
L O L E = L O L P ×   Number   of   days   in   one   year  

5.3. Environmental Indicators

This paper explores the influence of a hybrid solar PV–biogas system with SMES and PHES energy storage system on reducing grid energy purchases and completely replacing diesel generators. Equation (27) can be used in this paper to predict GHG emissions hourly [68,69]. In addition, Equation (28) depicts the project’s emissions reduction. These two equations can be combined and computed as an objective function. This aims to give additional information regarding the environmental effects of upgrading a HRES system. The amount of emissions reduced as a result of using renewables instead of traditional fossil fuels to generate energy is defined as P E A [68].
C O 2 E m i s s i o n s = E G P × E E F 1 L o s s e s
P E A = E P V × E E F P V + E B × E E F B + E S M E S × E E F S M E S + E P H E S × E E F P H E S C O 2 E m i s s i o n s
Losses represent transmission and distribution losses, E G P represents energy purchases from the grid, and EEF is the electrical emissions factor. However, base emissions are project emissions, which are deemed insignificant in comparison to the number of emissions offset by hybrid renewable energy resources, as shown in (28). This research looks at C O 2 E m i s s i o n s renewable energy sources because of how they are made and how long they last. As a result, in this study, the average base emissions of hybrid solar PV [70], biogas [71], PHES [72], and SMES energy storage systems are equal to 30.5 gCO2/kWh, 41 gCO2/kWh, 24 gCO2/kWh, and 18.5 gCO2/kWh, respectively.

6. Formulation of Optimization Problem

The cost, reliability, and CO2 emissions function minimization can be solved by proposing optimal sizing equations for each parameter. To determine the appropriate sizes and number of needed generation units, optimization problems must be solved to obtain the optimal component sizing as well as to assure the optimal operation of the proposed microgrid.

6.1. Objective Functions

In this study, as mentioned above, three objective functions such as financial (TNPC), reliability (LPSP), and GHG emissions ( C O 2 E m i s s i o n s ) are considered. Minimization of the objective function in the aforementioned cases is expressed in Equations (29)–(31) as follows:
F 1 = min T N P V = min C a n n t o t a l C R F = min C a n n c a p + C a n n r e p + C a n n O & M + C G P C G S r 1 + r n 1 + r n 1
F 2 = min L P S P = min t = 1 8760 P l o a d t + P P H E S & S M E S c h a t P P V & B t + P P H E S & S M E S d i s t + P G P t t = 1 8760 P l o a d t
F 3 = min C O 2 E m i s s i o n s = min E P V t × E E F P V + E B t × E E F B + E P H E S t × E E F P H E S + E S M E S t × E E F S M E S

6.2. Constraints

The number of solar panels, capacity of biogas generator, maximum install capacity of inverter, maximum install capacity of SMES, maximum installed power of PHES, and water storage sizes are under consideration. Equation (32) imposes constraints on the optimization problem.
N P V m i n N P V N P V m a x P i n v P P V m a x P B m i n P B P B m a x P S M E S m i n P S M E S P S M E S m a x 0 P G P P G P m a x P P H E S m i n P P H E S P P H E S m a x V R e s e r v o i r m i n V R e s e r v o i r V R e s e r v o i r m a x
where N P V m i n , N P V m a x , P B m i n , P B m a x , P P H S m i n , P P H S m a x , P S M E S m i n , P S M E S m a x , V R e s e r v o i r m i n , V R e s e r v o i r m a x represent the maximum and minimum limits of solar panels, the maximum and minimum capacity of the output power of biogas, PHES, and SMES, and the maximum and minimum of the upper reservoir, respectively.

6.3. Optimization Techniques

The proposed metaheuristic optimization technique is a non-dominated sorting whale optimization algorithm (NSWOA) which is discussed and analyzed in detail in this section. The chosen algorithm outcomes are also compared against other metaheuristic optimization algorithms MOGWO and MOPSO. In MATLAB, the algorithms are executed.
Mirjalili and Lewis in 2016 [73] introduced the WOA, which is modeled after the social behavior of humpback whales and is a unique meta-heuristic optimization algorithm. The bubble-net hunting strategy served as the basis for the algorithm. Although WOA has a fast rate of convergence, its efficacy in locating the global optimal solution to multimodal issues with numerous local optimal solutions is inadequate. This approach is inspired by nature and combines the WOA with an optimization technique based on non-dominated sorting and simple to handle multiobjective function problems.
Mirjalili and Lewis in 2014 [74], introduced the grey wolf optimizer (GWO), which is inspired by grey wolves and is modeled in accordance with the leadership hierarchy and hunting mechanisms of grey wolves in nature. Al-Masri and Al-Sharqi in 2020 [75], used the multi-objective grey wolf optimization (MOGWO) approach, and a comprehensive mathematical model was created by researchers for a PV–biogas hybrid energy system. This algorithm looked at things such as reliability, accessibility, and solutions that are not as good as they could be for both on-grid and off-grid systems. A multi-objective and difficult problem can be solved by deriving numerous optimal solutions using the PSO technique. PSO, created by Kennedy and Eberhart in 1995, is an iterative optimization method that simulates social behavior [76]. Ou and Hong in 2014 [77] investigated variable operation as well as control strategies for a HRES system and used the PSO algorithm to evaluate the effectiveness of the solar PV power system. WL Theo et al. in 2017 [78], proposed a study of system planning and optimization strategies suitable for the integration of hybrid energy systems, as well as a comparison of several mathematical programming methodologies. Adewuyi et al. in 2017 [79], proposed how the maximum amount of solar PV that the power system could handle while maintaining system voltage stability was determined using the MOPSO method.

7. Result and Discussion

The proposed solutions try to cut costs, improve reliability, and reduce carbon emissions all at the same time. Depending on how full the PHES and SMES are and how much power the associated load needs for long-term power supply, charging or discharging can happen during peak or off-peak hours. The rating, pricing, and type of HRES are taken into account in the selection process. The HRES with ES components such as solar PV panels, a biogas generator, PHES, SMES, and inverter properties are utilized in this investigation, as shown in Table 1.
As shown in Table 1, each hybrid renewable energy source system component is listed, and their initial cost, maintenance, and operational costs, as well as the technical specifications such as efficiency, rating, life span, and models, are described well with references for further details.
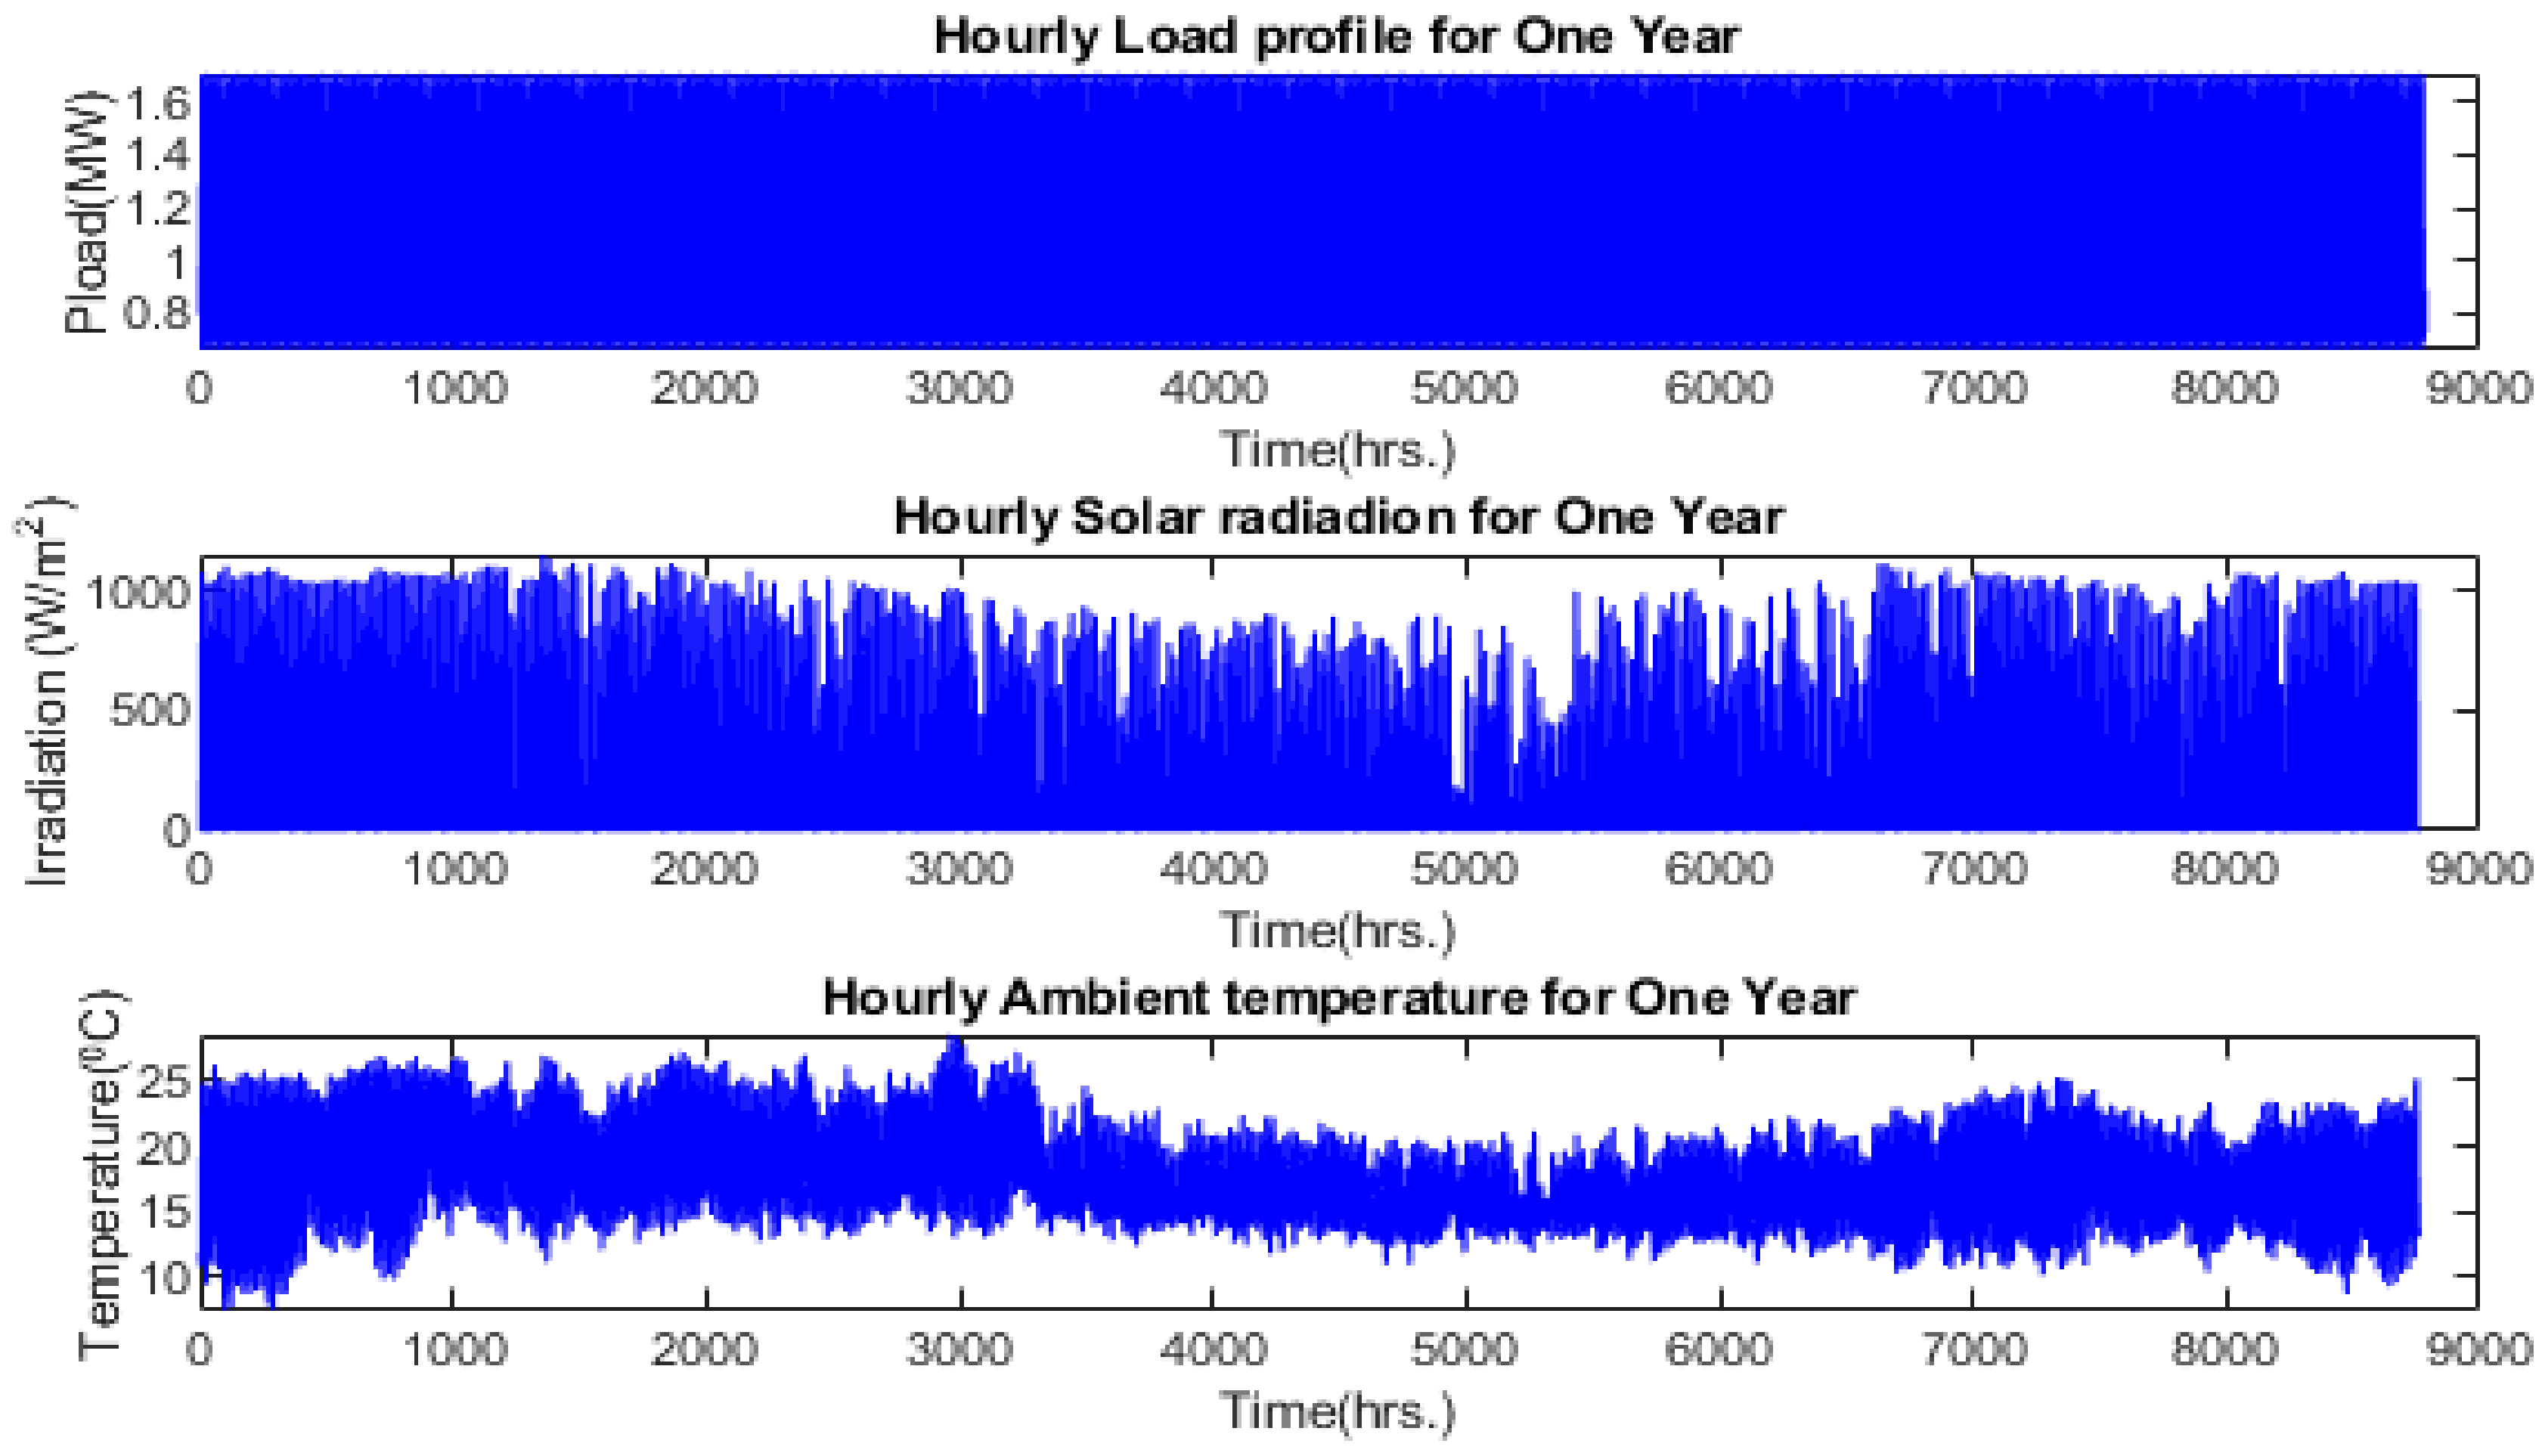
As shown in Figure 7, the minimum, maximum, and average numerical values in one full year for solar PV horizontal global irradiance are 0, 1195.8, and 273.98 W/m2, for ambient temperature, 16.5, 21.25, and 26 °C, and connected load demand are 662.68, 1185.04, and 1707.40 kW, respectively.

7.1. Optimization Applications on Optimal Sizing of HRES Components

This study describes a multi-objective optimization to identify a collection of non-dominant solutions. Every point on the Pareto front is thought of as the best possible solution for the system, and no solution outperforms the others. However, metaheuristic optimization techniques such as NSWOA, MOGWO, and MOPSO are suggested in this study to identify the compromised solution that is regarded as dependable and affordable in one scenario and affordable and ecological in another. In this work, the number of solar PV panels, the capacity of the biogas generator, the capacity of the PHES system, the capacity of the SMES system, and the capacity of the upper reservoir are the decision variables employed in a grid-connected system. In a grid-connected HRES with a PHES-SMES energy storage system, three Pareto frontier optimization instances (NPC vs. LPSP vs. CE) are investigated. Optimal sizing of HRES system components are taking account of those three objective functions. Table 2 shows the capacity of components that have been optimized using various metaheuristic optimization algorithms.
According to Table 2, by using NSWOA the sizing is optimized, and the estimated capacities of the PV modules, the biogas generator, the SMES, the PHES, and the upper reservoir are 5495.44, 860.29 KW, 142.28 KWh, 400.67 KW, and 26,798.14 m3, respectively.

7.2. Result Evaluation of Economical, Reliability, and Carbon Emission Parameters

Among multi-objective optimization methods, Pareto front produces the best solution results. In a multi-objective problem, the best solution for one objective may be the worst solution for another. For example, as NPC numerical values increase, the LPSP value may decrease. The increased capacity of the facility equipment raises the initial cost of installing the renewable energy system, which raises the cost of energy and the levelized cost of energy.
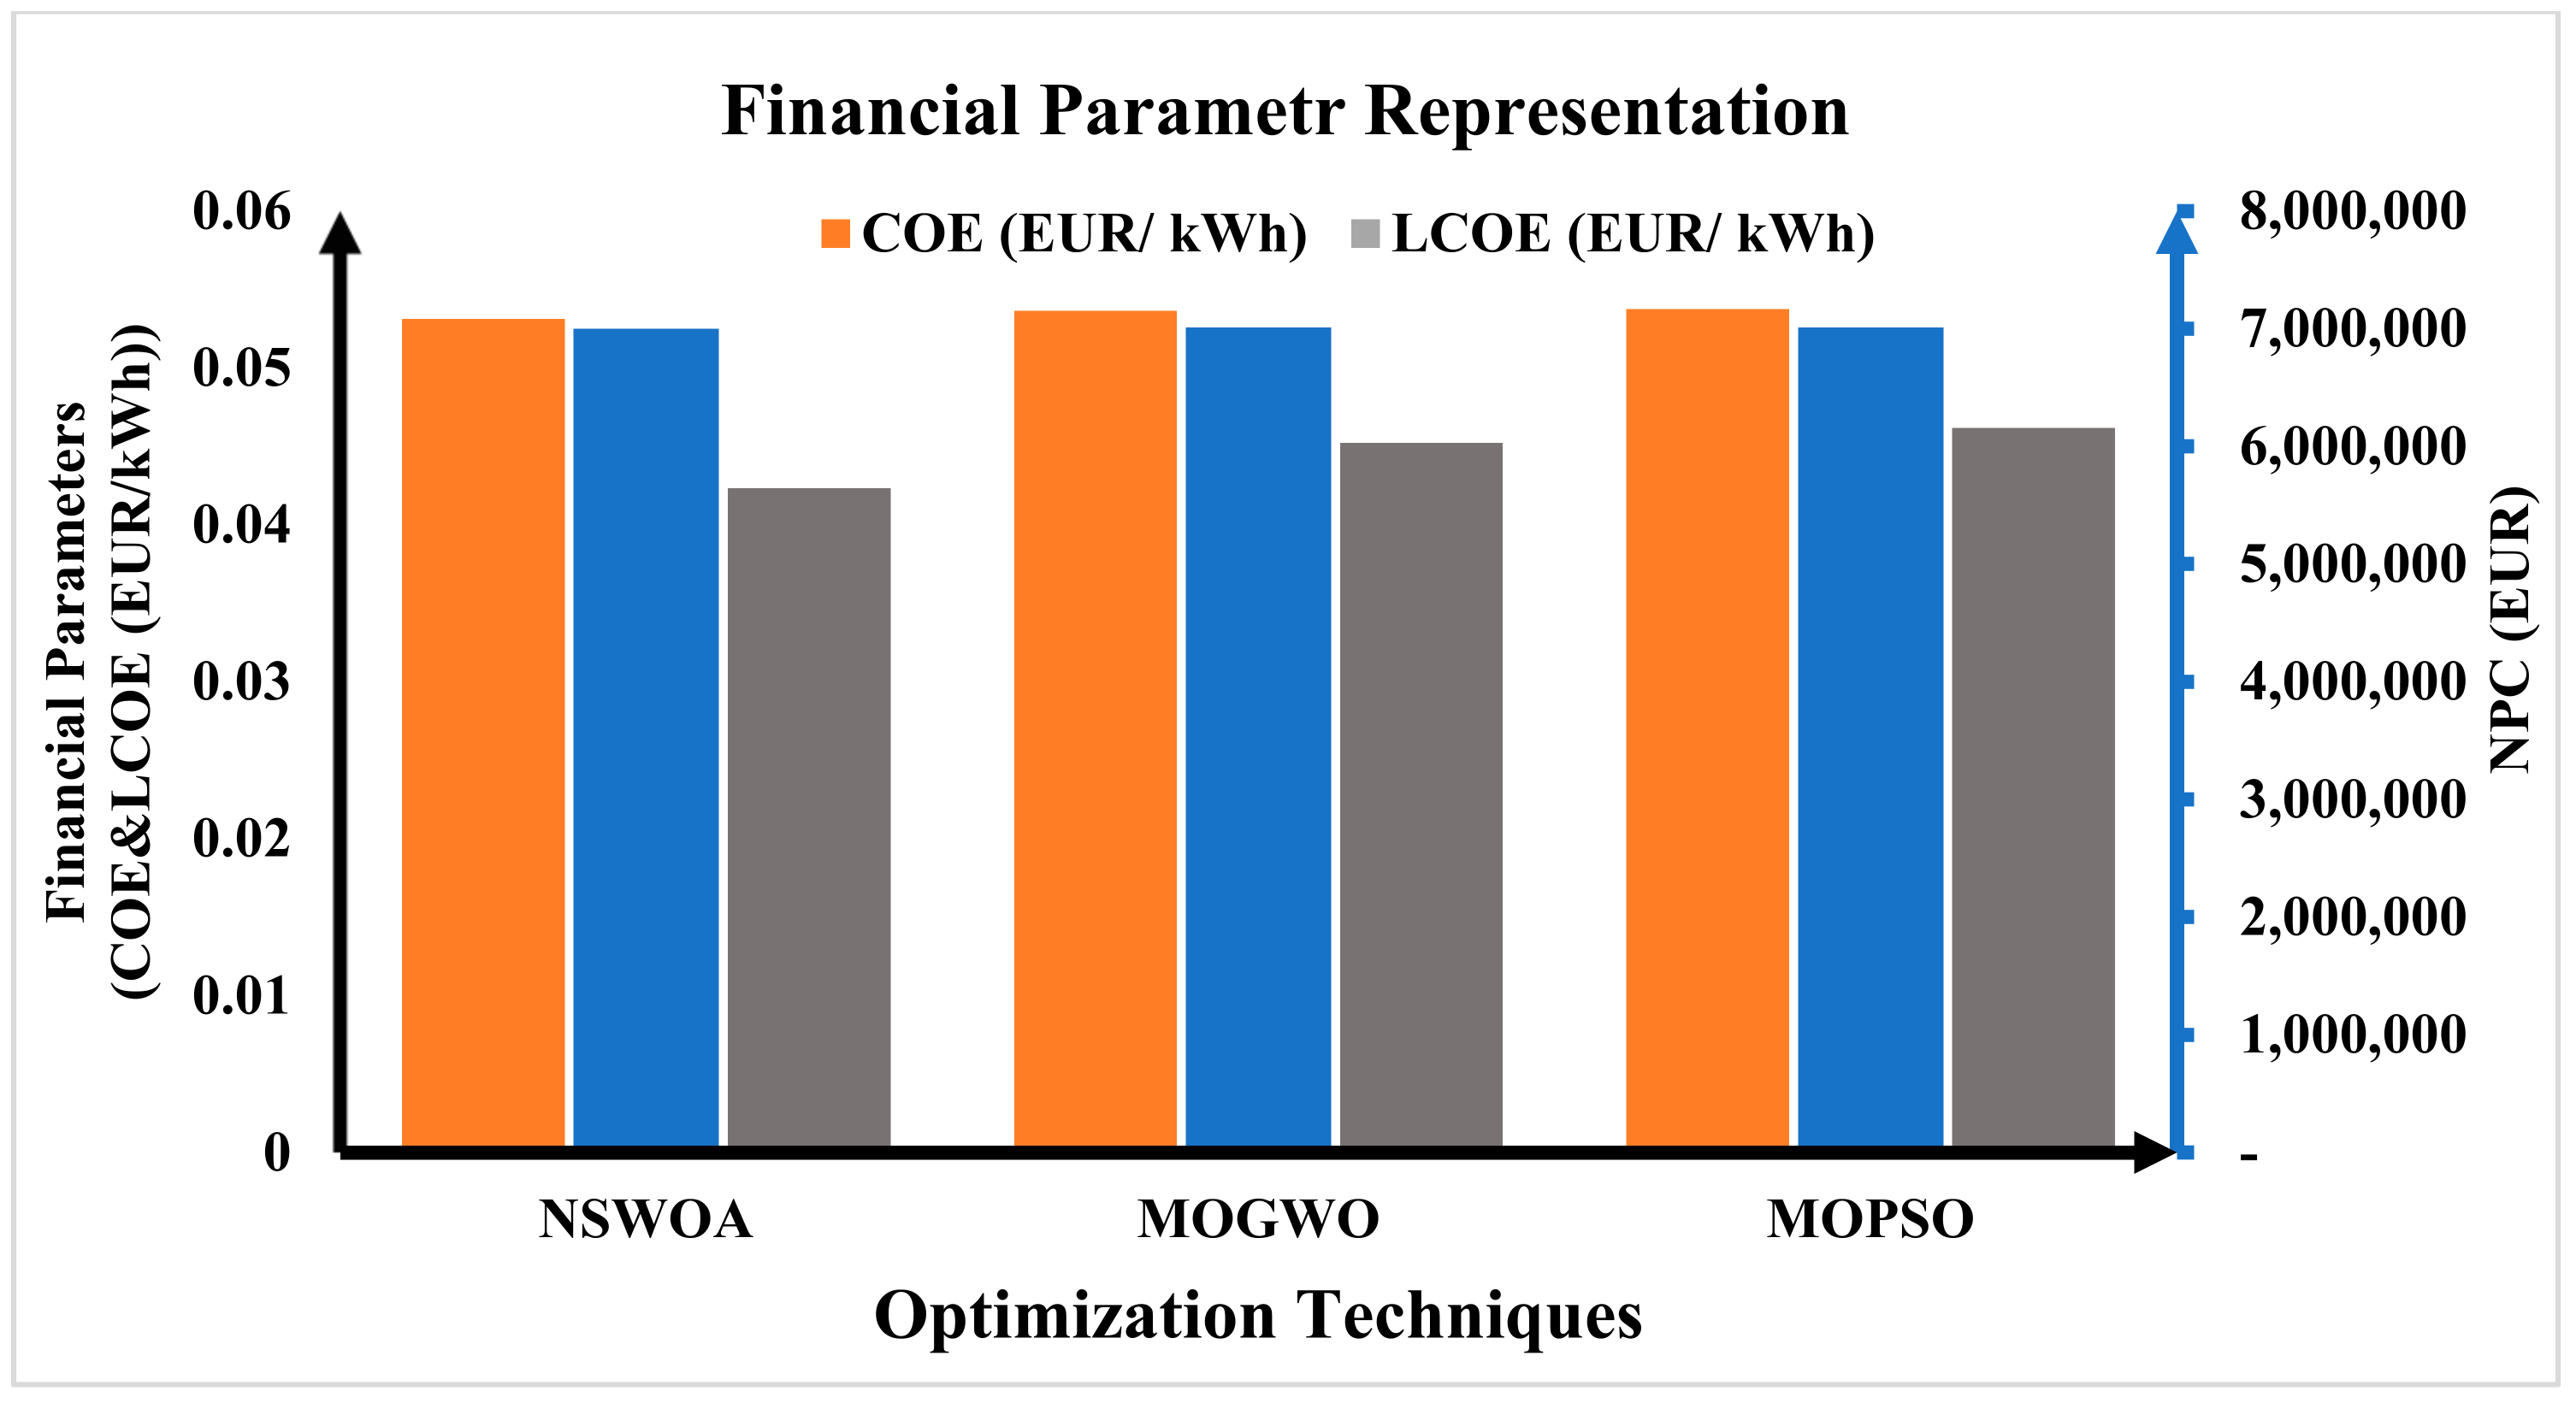
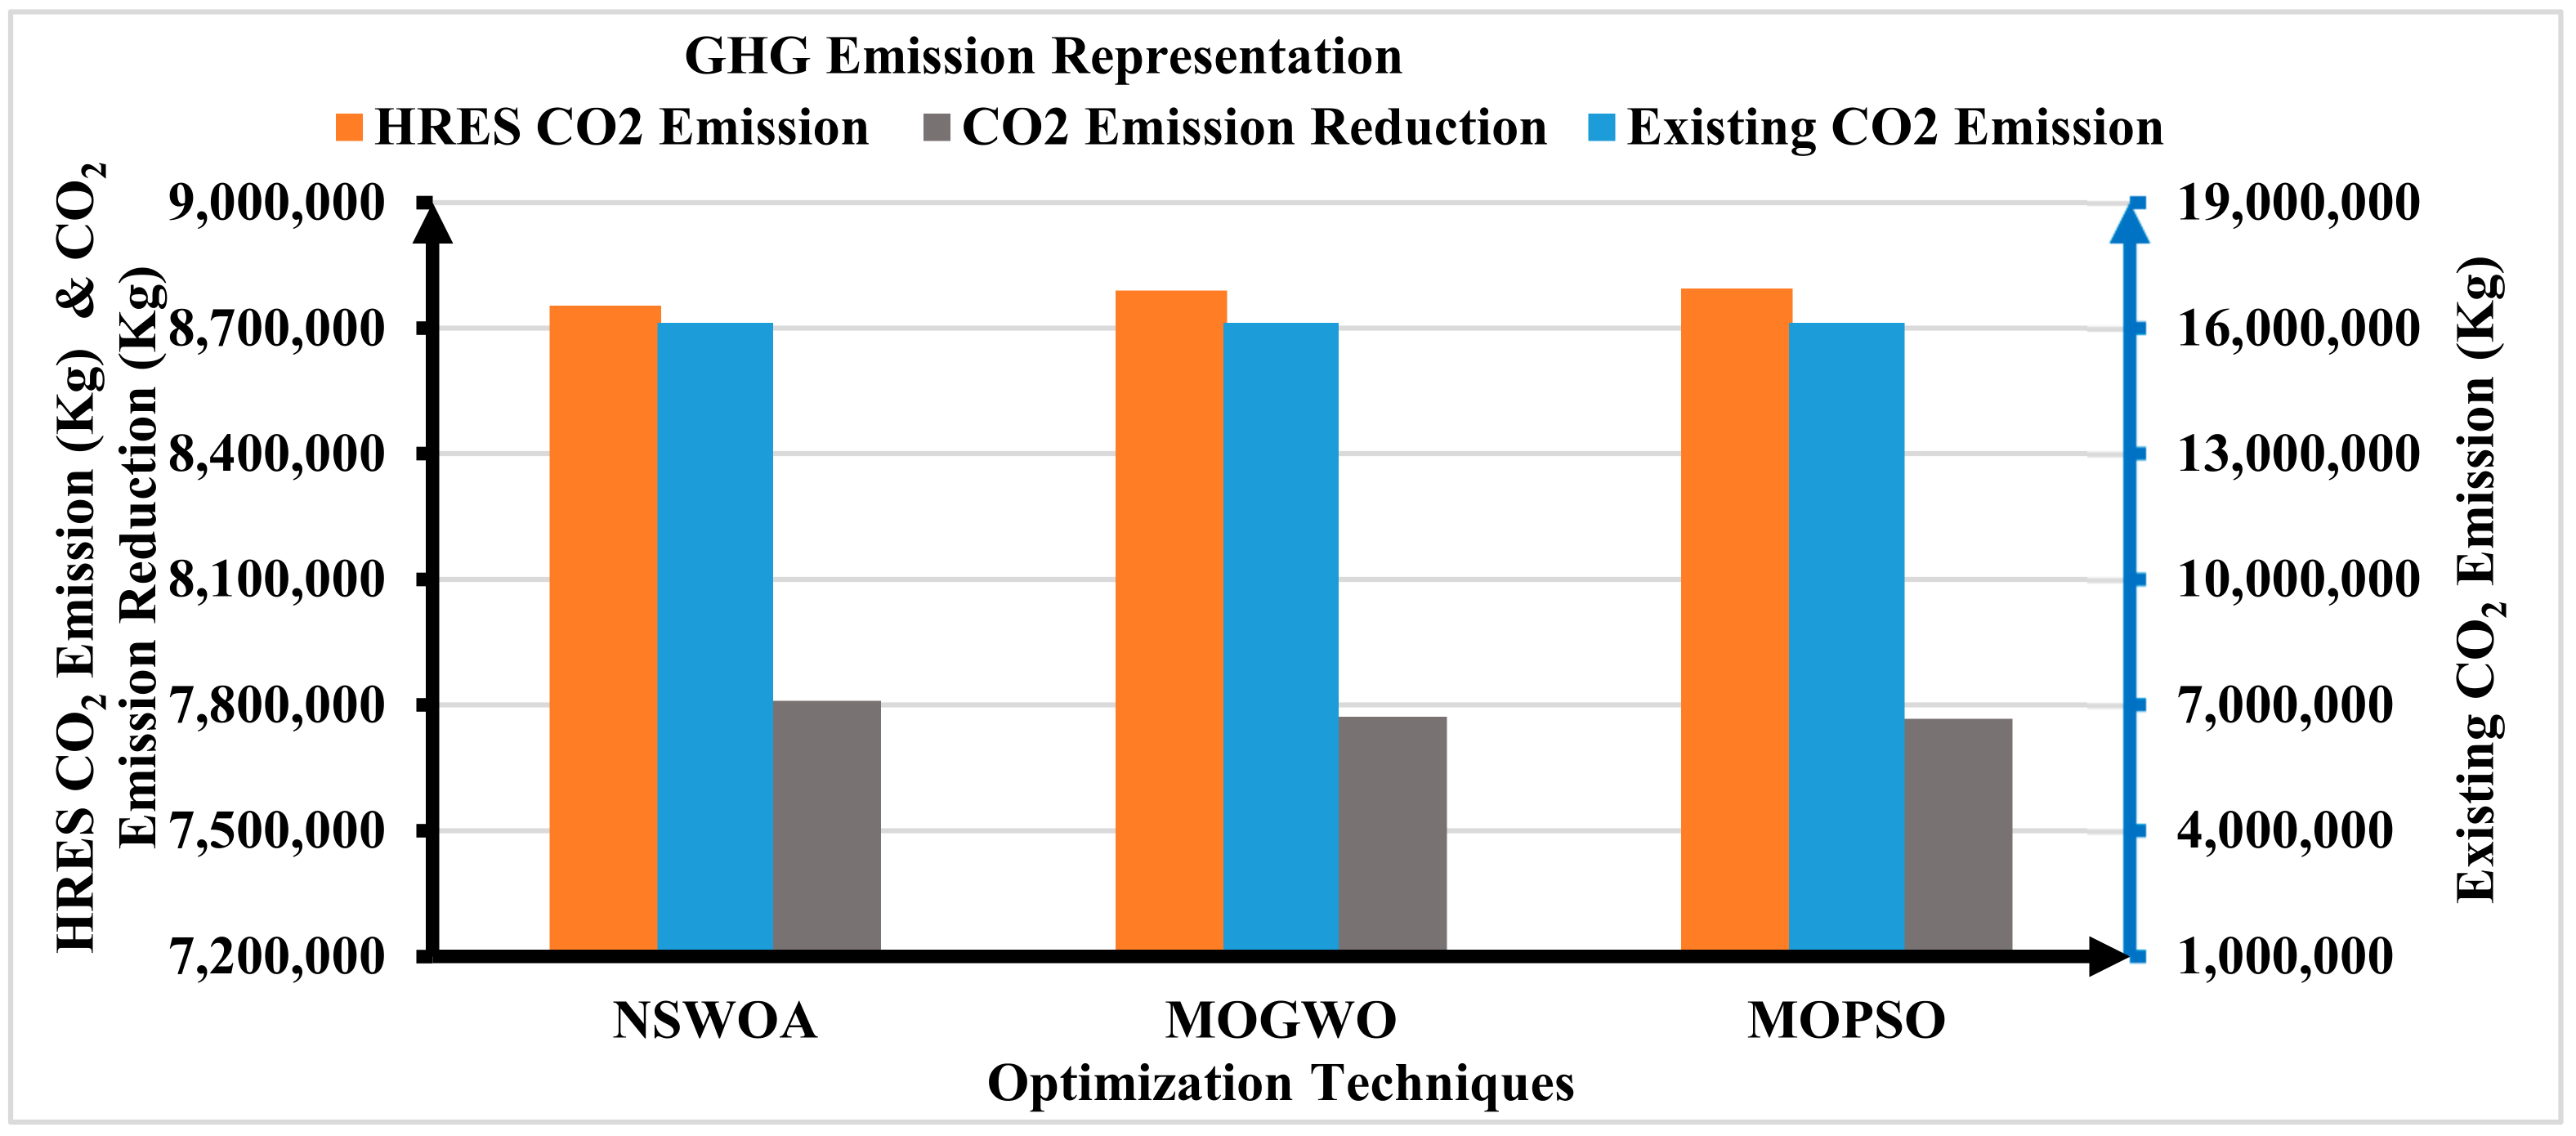
As shown in Table 3, the value of LPSP is predefined below 1%, and the results of each algorithm are nearly similar; especially MOGWO and MOPSO numerical values have small differences. In this study, the total project cost with the 25-year period taken into account, varies very little between the MOGWO and MOPSO algorithms. This allows the results of each algorithm to be validated against each other. Consistent with the NSWOA algorithm results, the total NPC and C O 2 E m i s s i o n s and LPSP are EUR 6.997 × 10⁶, 1.6122 × 10⁷ Kg C O 2 , and 0.0085. The algorithm results, which are total NPC, C O 2 E m i s s i o n s , and LPSP are EUR 7.008 × 10⁶, 1.6122 × 10⁷ Kg C O 2 , and 0.0089 for MOGWO and EUR 7.011 × 10⁶ and 1.6122 × 10⁷ Kg C O 2 and 0.9908 for MOPSO, respectively. According to the recorded results, the existing carbon emission on the distribution network is the same (1.6122 × 10⁷ Kg C O 2 ) for all optimization techniques, whereas HRES C O 2 E m i s s i o n s (Kg C O 2 ), by implementing NSWOA, MOGWO, and MOPSO are 8.7536 × 10⁶, 8.7895 × 10⁶, and 8.7945 × 10⁶ Kg C O 2 , respectively. Based on the analysis of these results, NSWOA has the optimum total NPC, LPSP, and GHG when compared to the other remaining two algorithms. For all values of financial parameters such as NPC, COE, and LCOE, as shown in Figure 8, the NSWOA result is optimal.
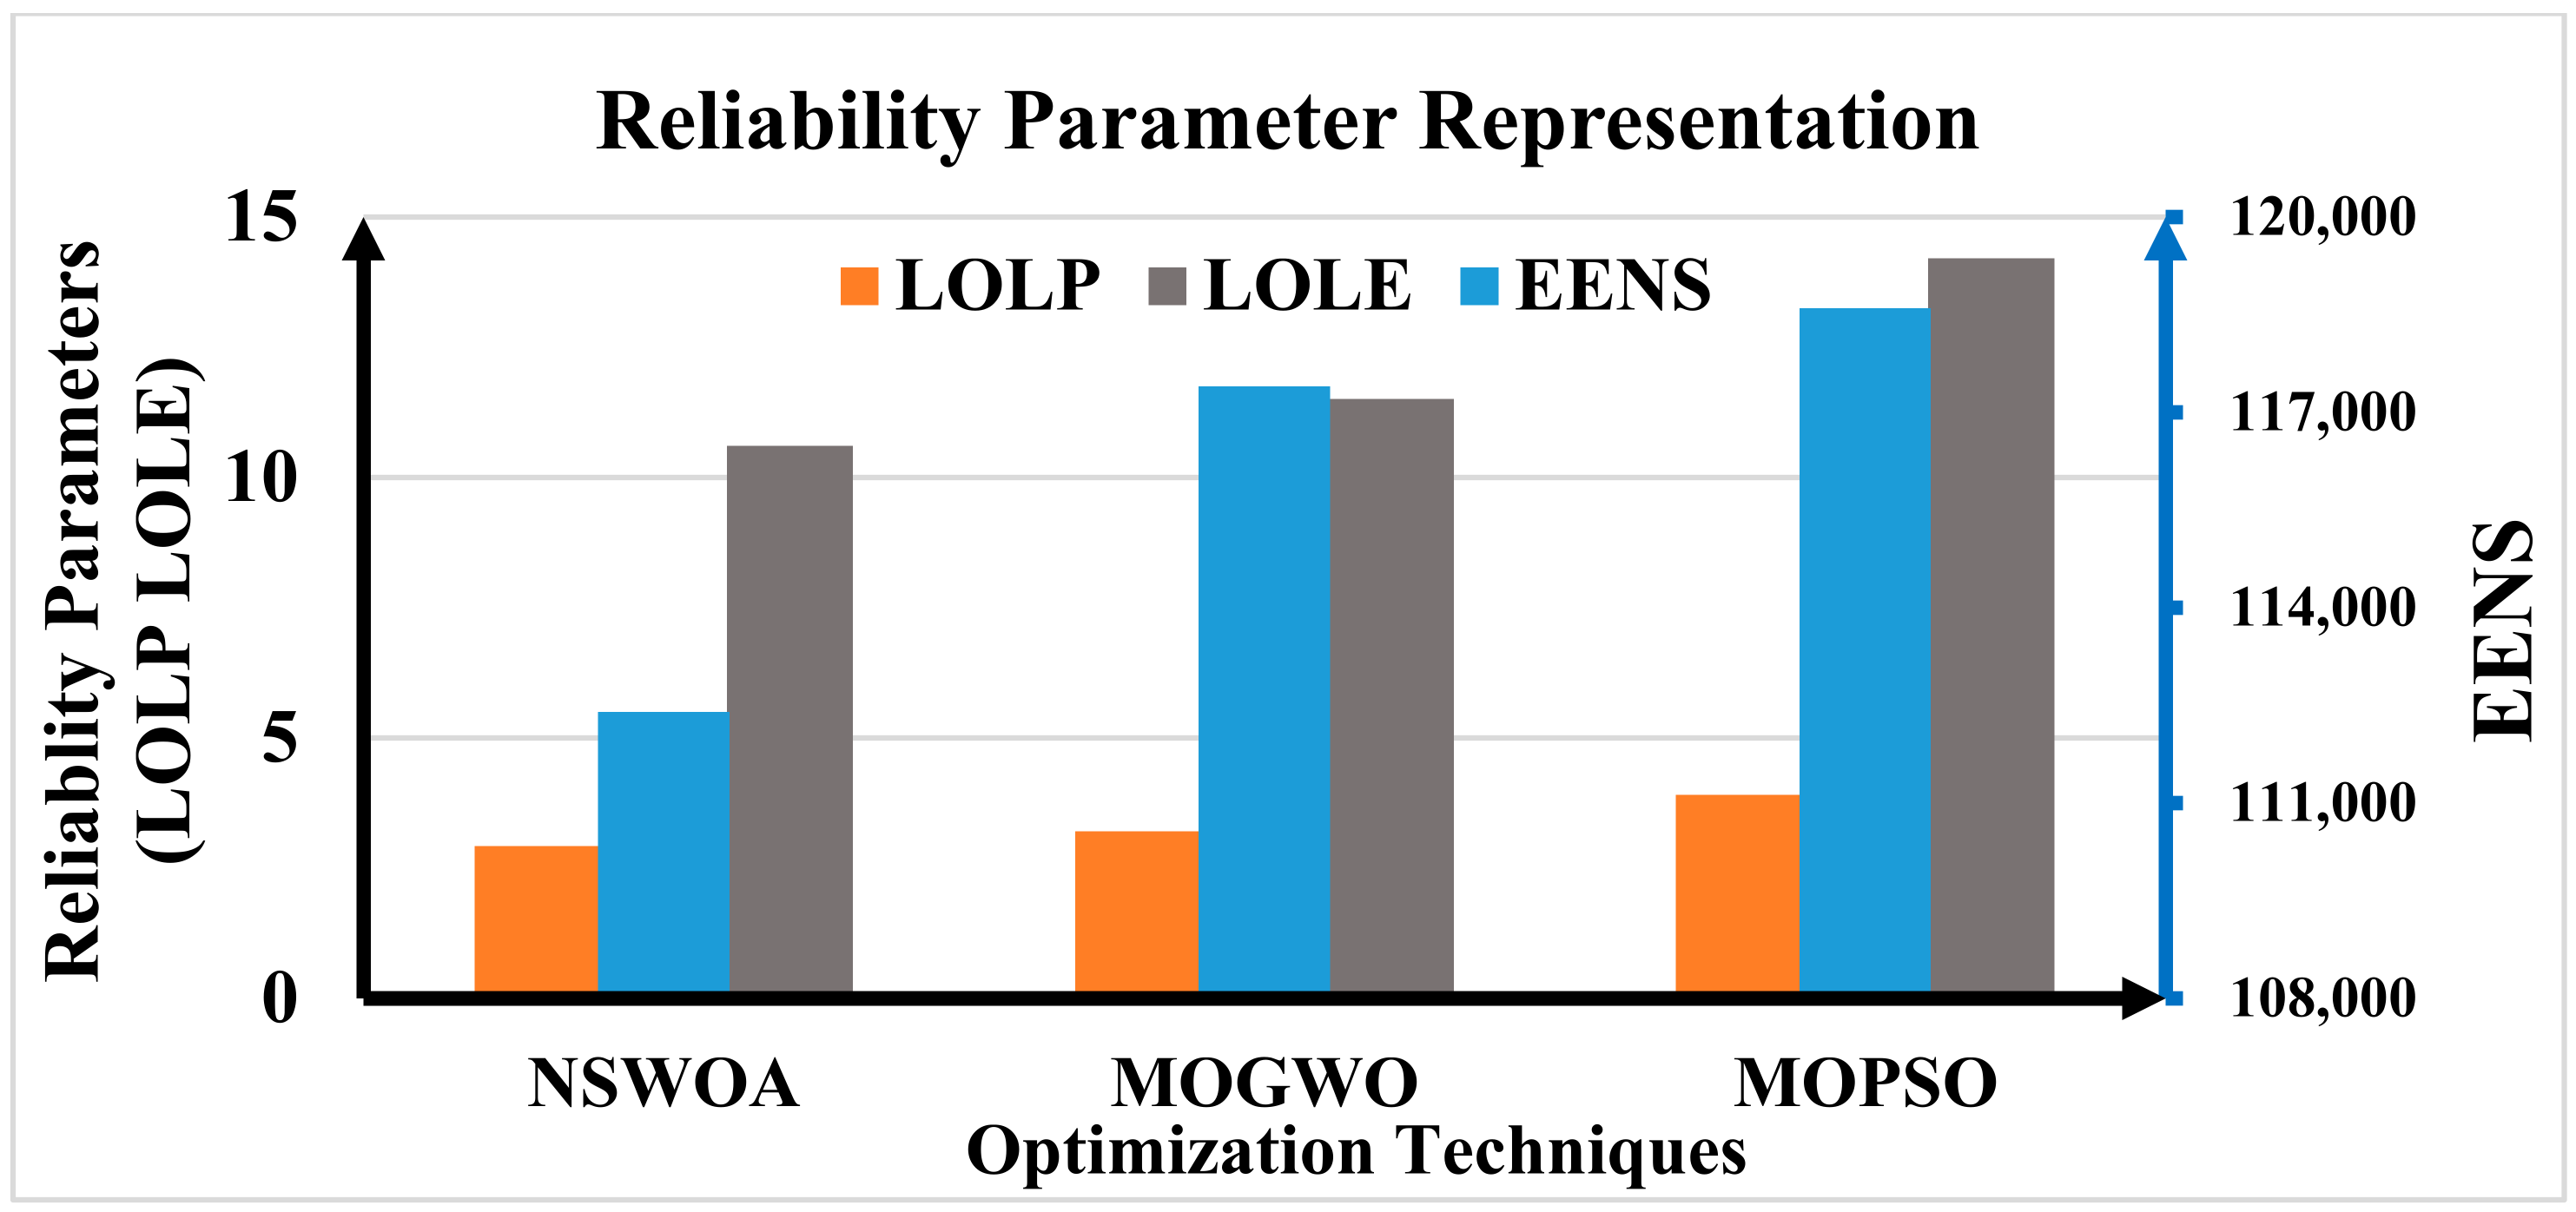
Moreover, the numerical values of the constraints, as well as the participation rate of renewable energy generation with energy storage systems, have a significant impact on the reliability analysis. Figure 9 shows that NSWOA is optimal for all values of reliability parameters such as LOLP, EENS, and LOLE.
Additionally, the GHG emissions analysis is significantly impacted by the numerical values of the constraints as well as the rate at which renewable energy generation is coupled with energy storage systems. As depicted in Figure 10, NSWOA is ideal for all values of GHG emission parameters such as C O 2 E m i s s i o n s (Kg C O 2 ), P H R E S (Kg C O 2 ), and P E A (Kg C O 2 ).

7.3. Analysis and Applications of HRES Optimal Solutions

As the objective functions are used as the criteria for making decisions in this study, the NPC, the LPSP, and CO2 emissions are the criteria. Based on the results of the three algorithms, the remaining analyses were targeted at the results of NSWOA.
The energy share to the connected system load is shown in Figure 11, along with the contribution of each HRES to the energy storage system. The PV system contributes 4.1258 × 10⁶ KWh (43%) of the total installed energy, and the biogas generator system generated 4.4154 × 10⁶ KWh (45%) of the total installed capacity in the hybrid solar PV–biogas with SMES-PHES energy storage project. In addition, PHES generated 1.1582 × 10⁶ KWh (12%) of the project’s overall installed capacity of the proposed hybrid system. Since SMES (1.315 × 10⁵ KWh) is only used to keep peak transition loads steady when switching from one power source to another, it is not counted as a long-sustained energy source.
The cost of the project’s total life cycle is shown in Figure 11, along with the contribution of each component of the HRES to the energy storage system. The PV system contributes 1.2828 × 10⁶ (28%) of the total project costs, and the biogas generator system contributes 1.4757 × 10⁶ (32%) of the system costs in the hybrid solar PV–biogas with SMES-PHES energy storage project. Additionally, 7.1853 × 10⁵ (16%) and 1.0941 × 10⁶ (24%) of the project’s overall costs come from the SMES and PHES, respectively.
The GHG emissions of the system are shown in Figure 11, along with the contribution of each component of the HRES to the energy storage system. The PV system contributes 3.1459 × 10⁶ Kg CO2 emissions (37.33%), and the biogas generator system contributes 4.5258 × 10⁶ Kg CO2 emissions (54%) in the hybrid solar PV–biogas with SMES-PHES energy storage project. Additionally, 0.06082 × 10⁶ Kg CO2 emissions (0.73%) and 0.6949 × 10⁶ Kg CO2 emissions (8%) of the SMES and PHES, respectively.
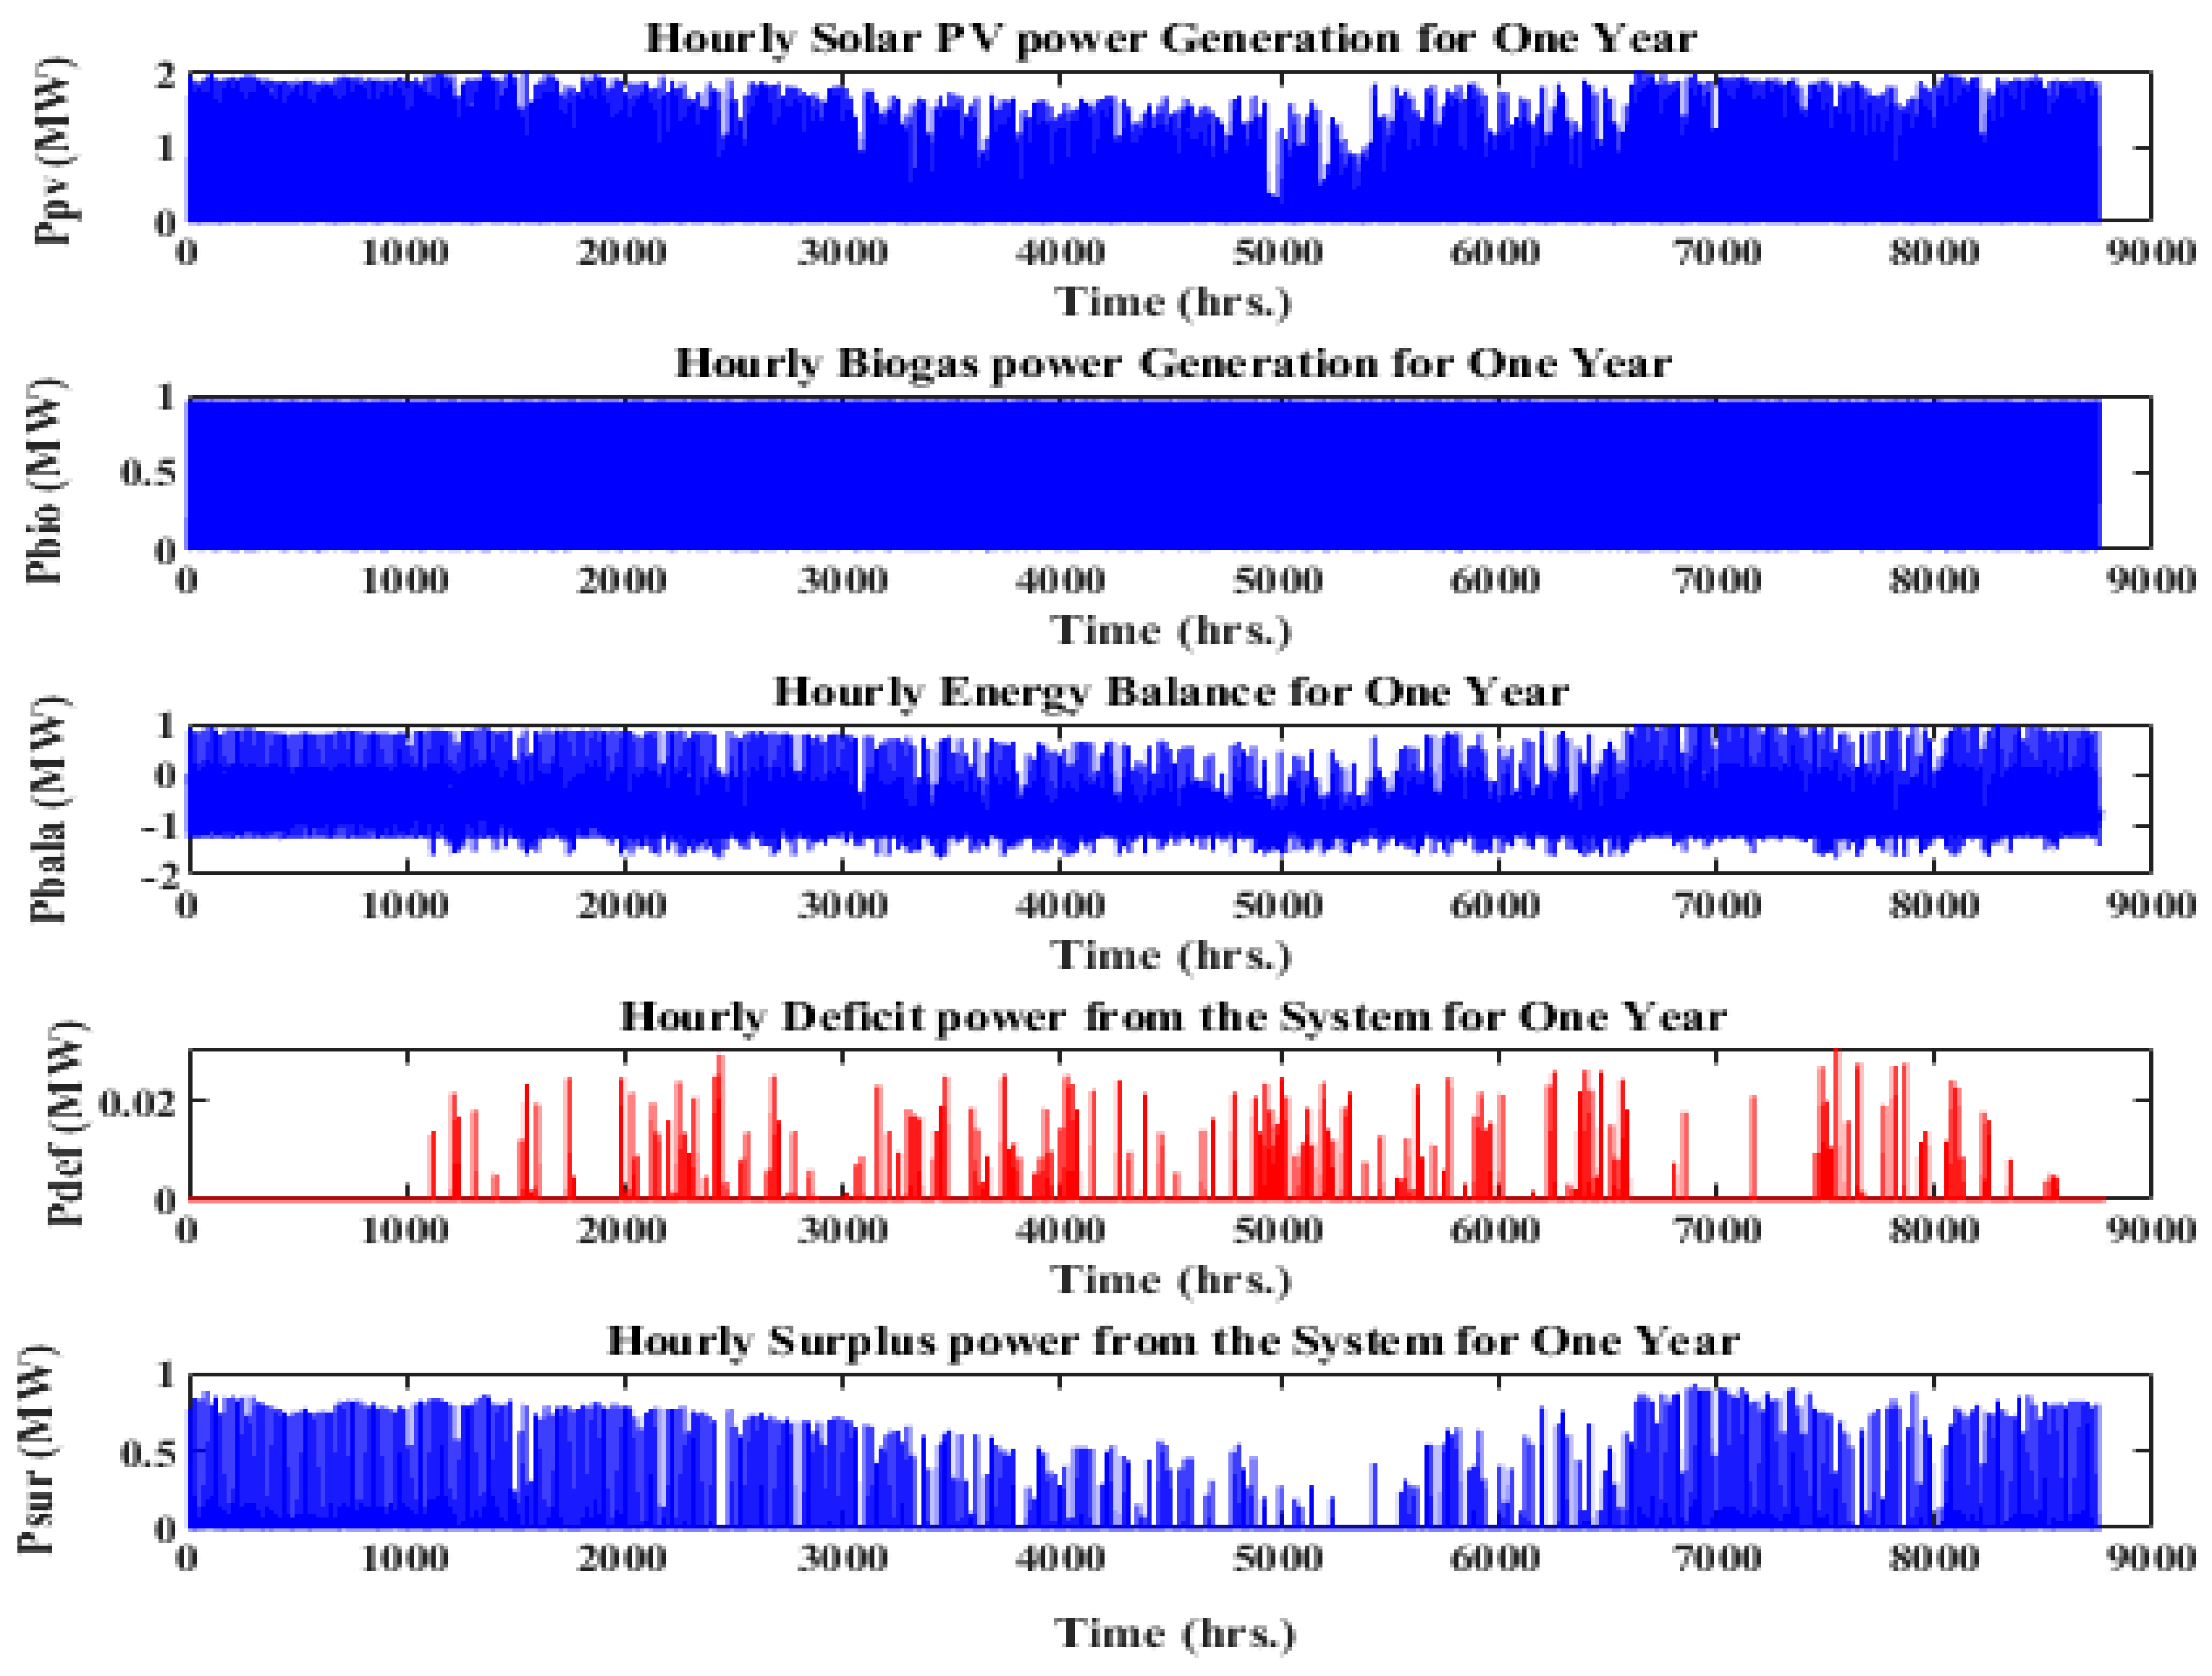
The annual energy conversions from solar PV, biogas generators, and energy balance are 4.1258 GWh, 4.4154 GWh, and 2.3585 GWh, respectively. The hybrid system has surplus and deficit energies that are roughly 0.2582 GWh and 0.00942 GWh, respectively, according to the final energy exchanged with the grid utility and the surplus and deficit. The amount of power exchanged with the electrical network is equal to the amount of energy sent to the nearby electric distribution network. Figure 12 shows the annual output from solar PV, the biogas power plant, energy balance, surplus, and deficit.
The discharging power, charging power, and state of charge of the SMES are continuously changing because of the connected loads, as shown in Figure 13. Due to fast response, these energy storage systems essentially only function when switching between different energy sources to meet demand. The annual energy discharge and charge for the SMES energy storage systems are 0.1315 GWh and 0.1635 GWh, respectively. The SMES can be charged anywhere between 5% and 100%.
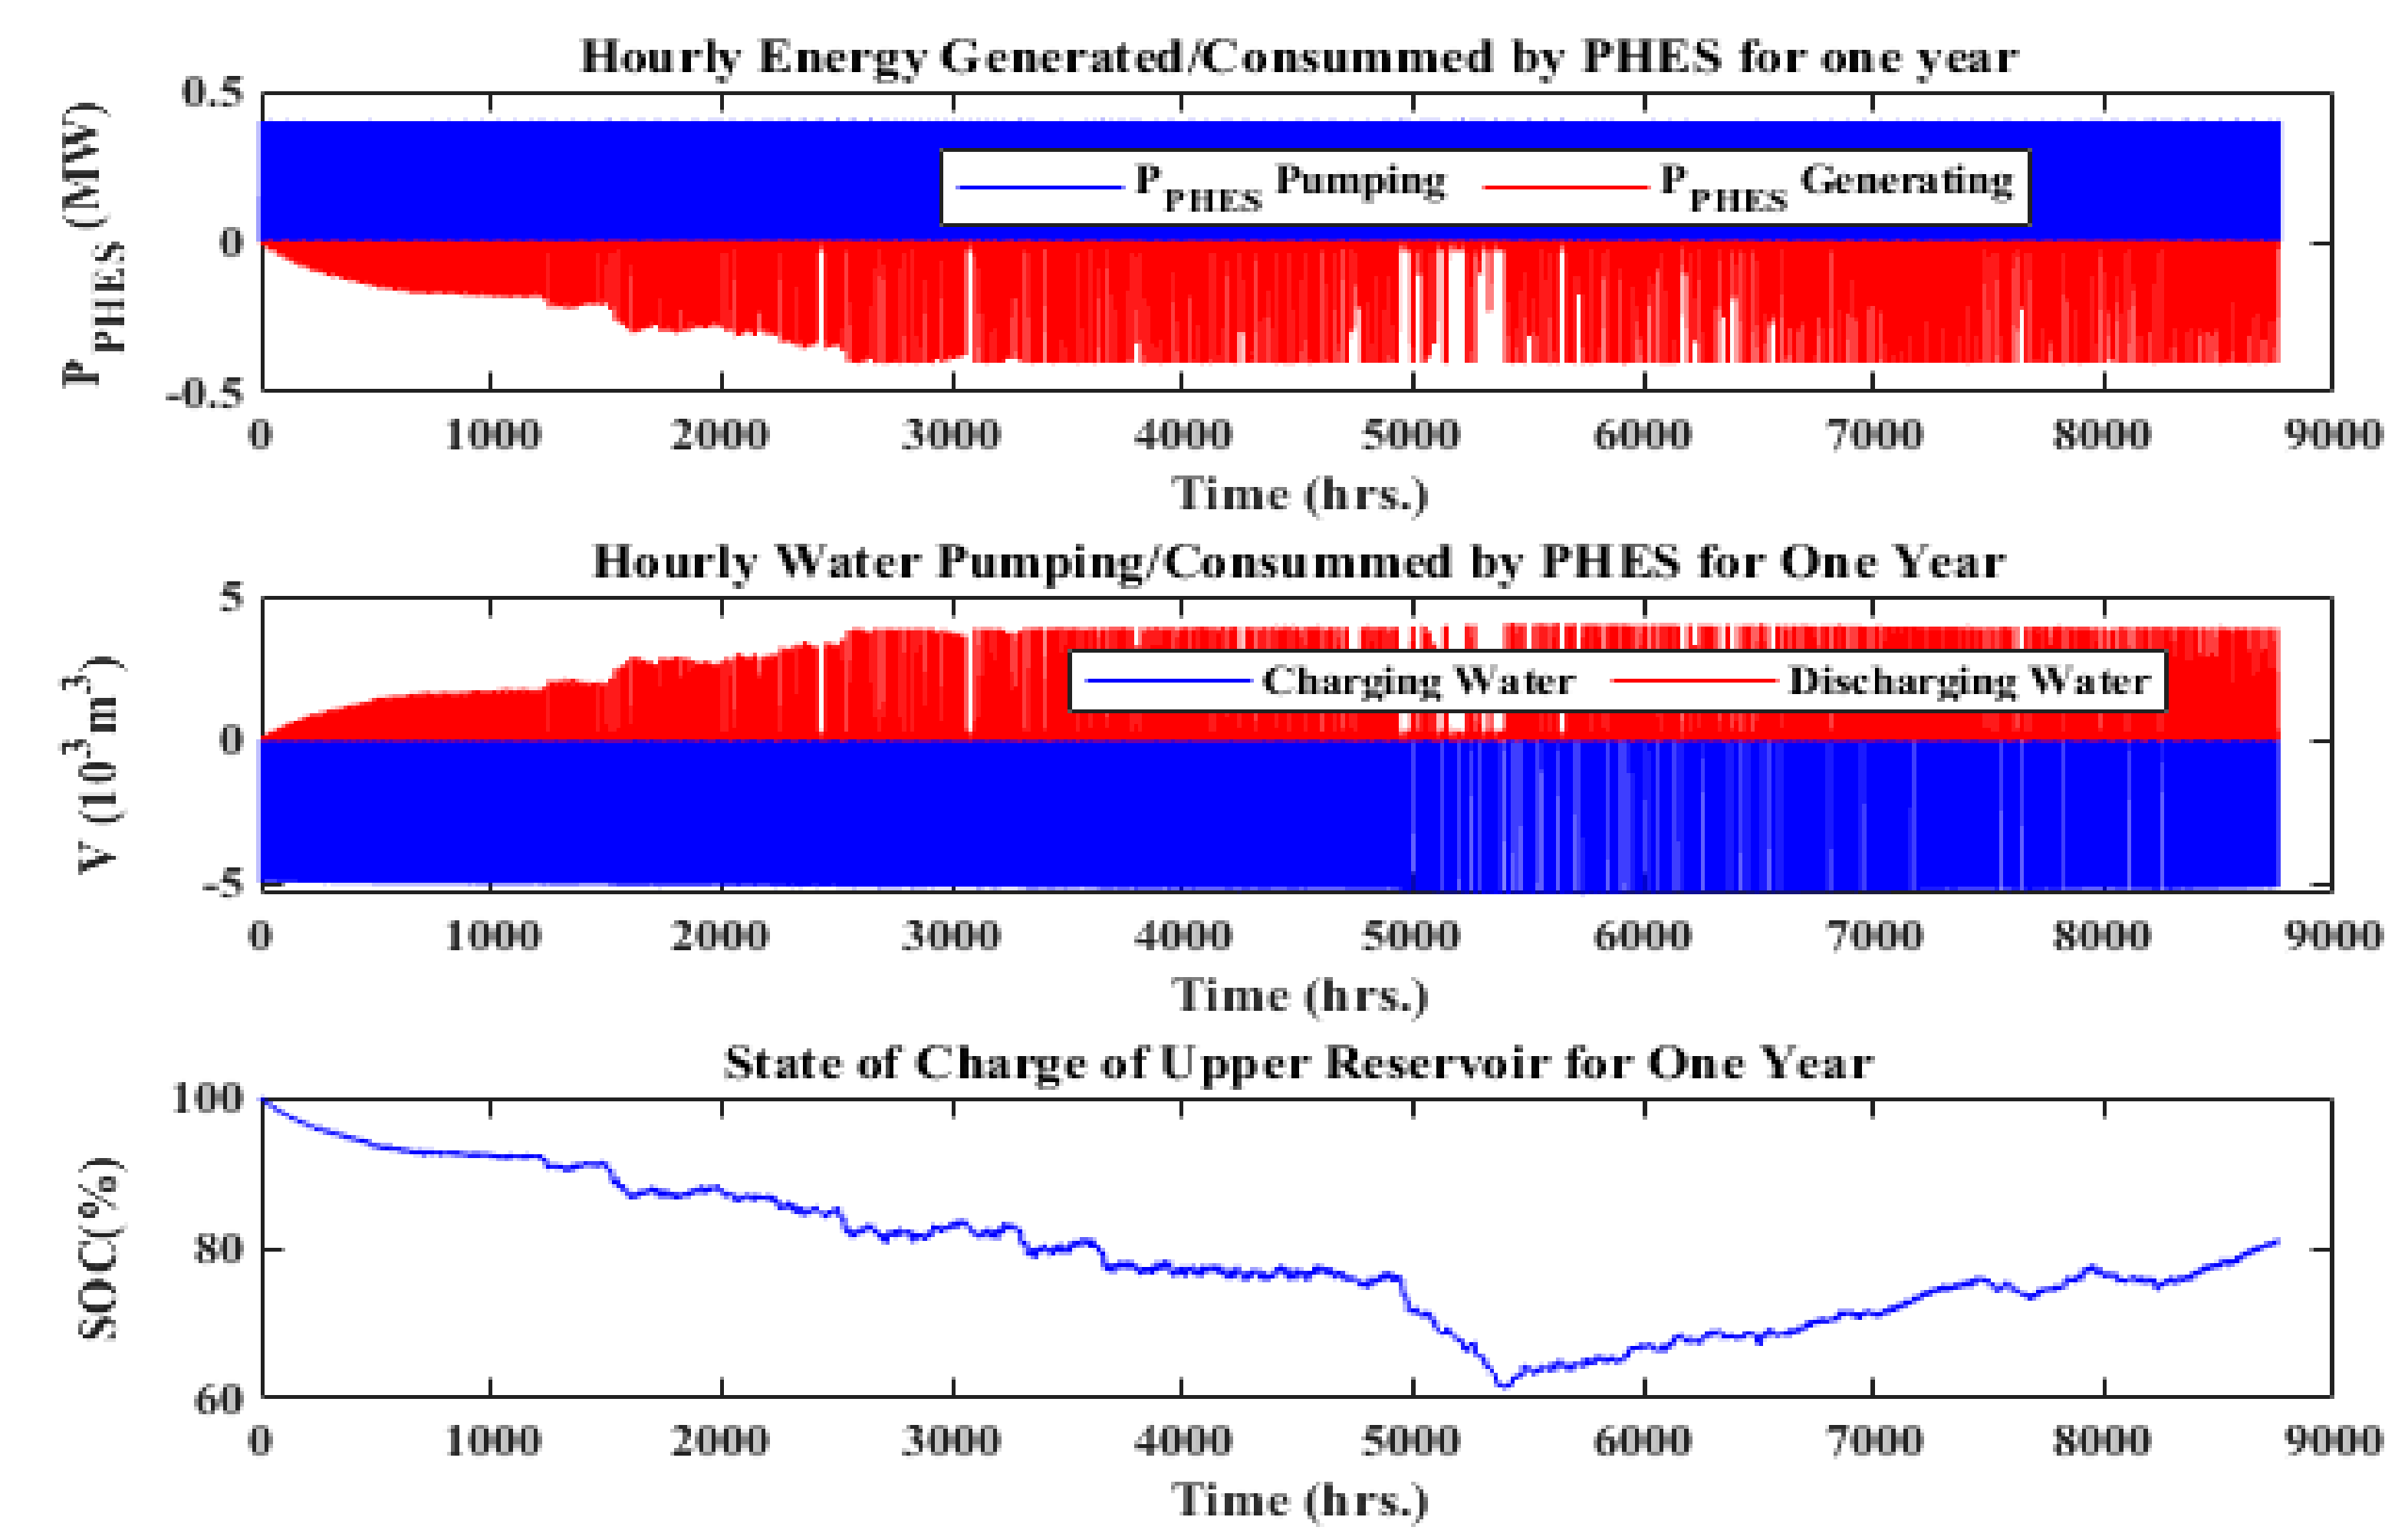
In a proposed hybrid system, Figure 14 shows the consumed energy from solar PV production or any excess power that may be present. Additionally, it displays the water used or discharged during power generation mode, the water charged to the upper reservoir during pumping mode, and the SOC parameter used to regulate the water level in the upper reservoir. The annual energy discharge, generation, and consumption produced by the PHES energy storage system are 0.6847 GWh and 1.0031 GWh, respectively. The upper reservoir’s SOC illustrates the variation in water storage capacity between the full and empty states of the tank. The minimum SOC of 61% for the upper reservoir is reached when the PV energy is at its lowest. Annual water intake and output from the PHES upper reservoir are 4.856 × 10⁶ and 4.527 × 10⁶ m3, respectively.

8. Conclusions

This study presents the design of a grid-connected hybrid PV/biogas system with pumped hydro and super magnetic energy storage for Debre Markos, Ethiopia, based on multiple objective functions, including the effects on cost, reliability, and GHG emissions. Metaheuristic optimization techniques such as NSWOA, MOGWO, and MOPSO are used to find the best size for hybrid systems based on evaluation parameters for financial stability, reliability, and GHG emissions and have been evaluated using MATLAB. A thorough comparison between NSWOA, MOGWO, and MOPSO and the system parameters at 150 iterations has been presented. The outcomes demonstrated NSWOA’s superiority in achieving the best optimum value of the predefined multi-objective function, with MOGWO and MOPSO coming in second and third, respectively. The comparison study has focused on NSWOA’s ability to produce the best NPC, LPSP, and GHG emissions values. Additionally, the simulation results demonstrated that the NSWOA technique outperforms other optimization techniques in its ability to solve the optimization problem. Furthermore, the outcomes show that the designed system has acceptable NPC, LPSP, and GHG emissions values under various operating conditions.

Author Contributions

Conceptualization, T.F.A., A.F.-L., I.A., A.A., B.K. and E.T.; methodology, T.F.A., A.F.-L., I.A., A.A. and B.K.; software, T.F.A., A.F.-L., B.K. and E.T.; validation, T.F.A., A.F.-L., I.A., A.A., B.K. and E.T.; formal analysis, T.F.A., A.F.-L., I.A., A.A., B.K. and E.T.; investigation, T.F.A. and A.F.-L.; resources, T.F.A., A.F.-L., I.A., A.A., B.K. and E.T.; data curation, T.F.A. and A.F.-L.; writing—original draft preparation, T.F.A. and A.F.-L.; writing—review and editing, T.F.A., A.F.-L., I.A., A.A., B.K. and E.T.; visualization, T.F.A., A.F.-L., I.A., A.A., B.K. and E.T.; supervision, T.F.A., A.F.-L., I.A., A.A., B.K. and E.T.; project administration, T.F.A., A.F.-L., I.A., A.A., B.K. and E.T. All authors have read and agreed to the published version of the manuscript.

Funding

This research received no external funding.

Data Availability Statement

Data will be available on request.

Acknowledgments

The authors kindly thank the editor and reviewers who spent their valuable time improving the present paper. Takele Ferede Agajie kindly thanks the MIRET Scholarship program for their financial support, under project No: 614658-PANAF-1-2019-1-KE-PANAF-MOBAF.

Conflicts of Interest

The authors declare no conflict of interest.

Abbreviation and Symbols

P e x c h Exchange Power
η c h a Charging Efficiency
η d i s Discharging Efficiency
P P H E S p u m p Consumed Power for Pumping
E P H E S p u m p Consumed Energy for Pumping
P i n v Inverter Output Power
N P V Number of PV Panels
η i n v Inverter Efficiency
f P V Derating Factor of PV panel
V max Maximum Reservoir Capacity
Q D i s Discharging Water Flow Rate
Q c h a Charging Water Flow Rate
η P u m p Pump Efficiency
P e x c h r a t e d Exchange Rating Power
P P V r Solar Panel Rated Power
E e x c h Exchange Energy
E e x c h min Minimum Exchange Energy
E e x c h max Maximum Exchange Energy
A C P V Annualized Cost of PV Panel
A C B Annualized Cost of Biogas
A C i n v Annualized Cost of Inverter
A C S M E S Annualized Cost of SMES
Δ P t Power Difference between Source and Demand
V t 1 Volume of Water at time t
η T Turbine Efficiency
η P Water Pipe Efficiency
E t g e n Generated Energy by Turbine
E B Energy Balance
P b a l a Power Balance
P P V Solar PV Output Power
P L Connected Load
P B Biogas Generator Output Power
V B Volume of Produced Biogas
C V B Biogas Calorific Value
η B Biogas Generator Efficiency
t B Working Hours of Biogas
Δ t Interval Time
ϑ i Solar Irradiation
τ α Ambient Temperatures
τ p Panel Temperatures
α c Temperature Coefficient
PHESPumped Hydro Energy Storage
A C P H E S Annualized Cost of PHES
C G P Annual Cost of Grid Energy Purchases
C G S Annual Cost of Grid Energy Sales
SMESSuperconducting Magnetic Energy Storage

References

  1. IEA. World Energy Outlook 2018; OECD: Paris, France, 2018. [Google Scholar] [CrossRef]
  2. Pachauri, S.; Kedia, S. Energiewende and Innovation: Are We Transitioning Fast Enough? Analytical Brief on Climate Ambition and Sustainability Action: CASA Brief. Available online: https://worldsdf.org/research/ (accessed on 12 February 2020).
  3. IEA; IRENA; UNSD; World Bank; World Health Organization. Tracking SDG 7: The Energy Progress Report 2019; World Bank: Washington, DC, USA, 2019; Available online: https://openknowledge.worldbank.org/entities/publication/c6829d12-c273-5553-99d5-80f8148e1ebd (accessed on 16 January 2023).
  4. IEA; IRENA; UNSD; World Bank; World Health Organization. Tracking SDG 7: The Energy Progress Report; World Bank: Washington, DC, USA, 2020; Available online: https://www.irena.org/Energy-Transition/Policy/Off-grid-for-Energy-Access (accessed on 20 January 2023).
  5. World Bank. World Development Report 2021: Data for Better Lives; The World Bank: Washington, DC, USA, 2021. [Google Scholar]
  6. IRENA. Accelerating Off-Grid Renewable Energy. 2019. Available online: https://www.irena.org/publications/2015/Jan/Accelerating-Off-Grid-Renewable-Energy (accessed on 29 November 2022).
  7. Abdalla, A.N.; Nazir, M.S.; Tao, H.; Cao, S.; Ji, R.; Jiang, M.; Yao, L. Integration of energy storage system and renewable energy sources based on artificial intelligence: An overview. J. Energy Storage 2021, 40, 102811. [Google Scholar] [CrossRef]
  8. Androniceanu, A.; Sabie, O.M. Overview of Green Energy as a Real Strategic Option for Sustainable Development. Energies 2022, 15, 8573. [Google Scholar] [CrossRef]
  9. Chen, X.; Xiao, J.; Yuan, J.; Xiao, Z.; Gang, W. Application and performance analysis of 100% renewable energy systems serving low-density communities. Renew. Energy 2021, 176, 433–446. [Google Scholar] [CrossRef]
  10. Elmorshedy, M.F.; Elkadeem, M.; Kotb, K.M.; Taha, I.B.; Mazzeo, D. Optimal design and energy management of an isolated fully renewable energy system integrating batteries and supercapacitors. Energy Convers. Manag. 2021, 245, 114584. [Google Scholar] [CrossRef]
  11. Zhongming, Z.; Linong, L.; Xiaona, Y.; Wangqiang, Z.; Wei, L. Global Energy Review 2021. 2021. Available online: https://www.iea.org/reports/global-energy-review-2021 (accessed on 21 December 2022).
  12. Bhattacharjee, S.; Nayak, P.K. PV-pumped energy storage option for convalescing performance of hydroelectric station under declining precipitation trend. Renew. Energy 2018, 135, 288–302. [Google Scholar] [CrossRef]
  13. Xu, X.; Hu, W.; Huang, Q.; Chen, Z. Optimal operation of photovoltaic-pump hydro storage hybrid system. In Proceedings of the 2018 IEEE PES Asia-Pacific Power and Energy Engineering Conference (APPEEC), Kota Kinabalu, Malaysia, 7–10 October 2018; pp. 194–199. [Google Scholar]
  14. Koko, S.P.; Kusakana, K.; Vermaak, H.J. Optimal power dispatch of a grid-interactive micro-hydrokinetic-pumped hydro storage system. J. Energy Storage 2018, 17, 63–72. [Google Scholar] [CrossRef]
  15. Sun, K.; Li, K.-J.; Pan, J.; Liu, Y.; Liu, Y. An optimal combined operation scheme for pumped storage and hybrid wind-photovoltaic complementary power generation system. Appl. Energy 2019, 242, 1155–1163. [Google Scholar] [CrossRef]
  16. Duchaud, J.-L.; Notton, G.; Darras, C.; Voyant, C. Multi-Objective Particle Swarm optimal sizing of a renewable hybrid power plant with storage. Renew Energy 2018, 131, 1156–1167. [Google Scholar] [CrossRef]
  17. Javed, M.S.; Zhong, D.; Ma, T.; Song, A.; Ahmed, S. Hybrid pumped hydro and battery storage for renewable energy based power supply system. Appl. Energy 2019, 257, 114026. [Google Scholar] [CrossRef]
  18. Hashem, M.; Abdel-Salam, M.; El-Mohandes, M.T.; Nayel, M.; Ebeed, M. Optimal placement and sizing of wind turbine generators and superconducting magnetic energy storages in a distribution system. J. Energy Storage 2021, 38, 102497. [Google Scholar] [CrossRef]
  19. Salama, H.S.; Kotb, K.; Vokony, I.; Dán, A. The Role of Hybrid Battery–SMES Energy Storage in Enriching the Permanence of PV–Wind DC Microgrids: A Case Study. Eng 2022, 3, 207–223. [Google Scholar] [CrossRef]
  20. Möhner, A. The evolution of adaptation metrics under the UNFCCC and its Paris Agreement. Adapt. Metr. Perspect. Meas. Aggregating Comp. Adapt. Results 2018, 15, 15–27. [Google Scholar]
  21. Aggarwal, N.K.; Kumar, N.; Mittal, M. Potential of Weed Biomass for Bioethanol Production. In Bioethanol Production; Springer: Berlin/Heidelberg, Germany, 2022; pp. 65–71. [Google Scholar]
  22. Kumar, R.; Channi, H.K. A PV-Biomass off-grid hybrid renewable energy system (HRES) for rural electrification: Design, optimization and techno-economic-environmental analysis. J. Clean. Prod. 2022, 349, 131347. [Google Scholar] [CrossRef]
  23. Hailu, E.A.; Mezgebu, C. Design and simulation of standalone hybrid (solar/biomass) electricity generation system for a rural village in Ethiopia. Int. J. Sci. Eng. Res. 2017, 8, 1570–1574. [Google Scholar]
  24. Alzahrani, A.; Ramu, S.; Devarajan, G.; Vairavasundaram, I.; Vairavasundaram, S. A review on hydrogen-based hybrid microgrid system: Topologies for hydrogen energy storage, integration, and energy management with solar and wind energy. Energies 2022, 15, 7979. [Google Scholar] [CrossRef]
  25. Ebhota, W.S.; Jen, T.-C. Fossil fuels environmental challenges and the role of solar photovoltaic technology advances in fast tracking hybrid renewable energy system. Int. J. Precis. Eng. Manuf.-Green Technol. 2020, 7, 97–117. [Google Scholar] [CrossRef]
  26. De Doile, G.N.D.; Junior, P.R.; Rocha, L.C.S.; Janda, K.; Aquila, G.; Peruchi, R.S.; Balestrassi, P.P. Feasibility of hybrid wind and photovoltaic distributed generation and battery energy storage systems under techno-economic regulation. Renew. Energy 2022, 195, 1310–1323. [Google Scholar] [CrossRef]
  27. Oladigbolu, J.O.; Ramli, M.A.M.; Al-Turki, Y.A. Feasibility Study and Comparative Analysis of Hybrid Renewable Power System for off-Grid Rural Electrification in a Typical Remote Village Located in Nigeria. IEEE Access 2020, 8, 171643–171663. [Google Scholar] [CrossRef]
  28. Li, J.; Liu, P.; Li, Z. Optimal design and techno-economic analysis of a solar-wind-biomass off-grid hybrid power system for remote rural electrification: A case study of west China. Energy 2020, 208, 118387. [Google Scholar] [CrossRef]
  29. Goswami, A.; Sadhu, P.; Sadhu, P.K. Development of a grid connected solar-wind hybrid system with reduction in levelized tariff for a remote island in India. J. Sol. Energy Eng. 2020, 142, 044501. [Google Scholar] [CrossRef]
  30. Aziz, A.S.; Tajuddin, M.; Adzman, M.; Azmi, A.; Ramli, M.A. Optimization and sensitivity analysis of standalone hybrid energy systems for rural electrification: A case study of Iraq. Renew. Energy 2019, 138, 775–792. [Google Scholar] [CrossRef]
  31. Mamaghani, A.H.; Escandon, S.A.; Najafi, B.; Shirazi, A.; Rinaldi, F. Techno-economic feasibility of photovoltaic, wind, diesel and hybrid electrification systems for off-grid rural electrification in Colombia. Renew. Energy 2016, 97, 293–305. [Google Scholar] [CrossRef]
  32. Shi, B.; Wu, W.; Yan, L. Size optimization of stand-alone PV/wind/diesel hybrid power generation systems. J. Taiwan Inst. Chem. Eng. 2017, 73, 93–101. [Google Scholar] [CrossRef]
  33. Javed, M.S.; Ma, T. Techno-economic assessment of a hybrid solar-wind-battery system with genetic algorithm. Energy Procedia 2019, 158, 6384–6392. [Google Scholar] [CrossRef]
  34. Emad, D.; El-Hameed, M.; El-Fergany, A.A. Optimal techno-economic design of hybrid PV/wind system comprising battery energy storage: Case study for a remote area. Energy Convers. Manag. 2021, 249, 114847. [Google Scholar] [CrossRef]
  35. Hatata, A.Y.; Osman, G.; Aladl, M.M. An optimization method for sizing a solar/wind/battery hybrid power system based on the artificial immune system. Sustain. Energy Technol. Assess. 2018, 27, 83–93. [Google Scholar] [CrossRef]
  36. Askarzadeh, A.; Coelho, L.S. A novel framework for optimization of a grid independent hybrid renewable energy system: A case study of Iran. Sol. Energy 2015, 112, 383–396. [Google Scholar] [CrossRef]
  37. Atieh, A.; Charfi, S.; Chaabene, M. Chapter 8—Hybrid PV/Batteries Bank/Diesel Generator Solar-Renewable Energy System Design, Energy Management, and Economics. In Advances in Renewable Energies and Power Technologies; Yahyaoui, I., Ed.; Elsevier: Amsterdam, The Netherlands, 2018; pp. 257–294. [Google Scholar] [CrossRef]
  38. Suresh, M.; Meenakumari, R.; Panchal, H.; Priya, V.; El Agouz, E.; Israr, M. An enhanced multiobjective particle swarm optimisation algorithm for optimum utilisation of hybrid renewable energy systems. Int. J. Ambient Energy 2022, 43, 2540–2548. [Google Scholar] [CrossRef]
  39. Fadli, D.; Purwoharjono, H. Optimal sizing of PV/Diesel/battery hybrid micro-grid system using multi-objective bat algorithm. Int. J. Eng. Sci. 2019, 8, 6–14. [Google Scholar]
  40. Diab, A.A.Z.; Sultan, H.; Mohamed, I.; Kuznetsov, O.; Do, T.D. Application of Different Optimization Algorithms for Optimal Sizing of PV/Wind/Diesel/Battery Storage Stand-Alone Hybrid Microgrid. IEEE Access 2019, 7, 119223–119245. [Google Scholar] [CrossRef]
  41. Arasteh, A.; Alemi, P.; Beiraghi, M. Optimal allocation of photovoltaic/wind energy system in distribution network using meta-heuristic algorithm. Appl. Soft Comput. 2021, 109, 107594. [Google Scholar] [CrossRef]
  42. ArcGIS 10.3: The Next Generation of GIS Is Here. Available online: https://www.esri.com/arcgis-blog/products/3d-gis/3d-gis/arcgis-10-3-the-next-generation-of-gis-is-here/ (accessed on 15 May 2023).
  43. Çetinbaş, İ.; Tamyürek, B.; Demirtaş, M. Sizing optimization and design of an autonomous AC microgrid for commercial loads using Harris Hawks Optimization algorithm. Energy Convers. Manag. 2021, 245, 114562. [Google Scholar] [CrossRef]
  44. Bukar, A.L.; Tan, C.; Lau, K.Y. Optimal sizing of an autonomous photovoltaic/wind/battery/diesel generator microgrid using grasshopper optimization algorithm. Sol. Energy 2019, 188, 685–696. [Google Scholar] [CrossRef]
  45. Mudgal, V.; Reddy, K.; Mallick, T.K. Techno-economic analysis of standalone solar photovoltaic-wind-biogas hybrid renewable energy system for community energy requirement. Futur. Cities Environ. 2019, 5, 11. [Google Scholar] [CrossRef]
  46. Podder, A.K.; Supti, S.A.; Islam, S.; Malvoni, M.; Jayakumar, A.; Deb, S.; Kumar, N.M. Feasibility Assessment of Hybrid Solar Photovoltaic-Biogas Generator Based Charging Station: A Case of Easy Bike and Auto Rickshaw Scenario in a Developing Nation. Sustainability 2021, 14, 166. [Google Scholar] [CrossRef]
  47. Alturki, F.A.; Awwad, E.M. Sizing and cost minimization of standalone hybrid wt/pv/biomass/pump-hydro storage-based energy systems. Energies 2021, 14, 489. [Google Scholar] [CrossRef]
  48. Diab, A.A.Z.; Sultan, H.; Kuznetsov, O.N. Optimal sizing of hybrid solar/wind/hydroelectric pumped storage energy system in Egypt based on different meta-heuristic techniques. Environ. Sci. Pollut. Res. 2020, 27, 32318–32340. [Google Scholar] [CrossRef]
  49. Alotaibi, M.A.; Eltamaly, A.M. A Smart Strategy for Sizing of Hybrid Renewable Energy System to Supply Remote Loads in Saudi Arabia. Energies 2021, 14, 7069. [Google Scholar] [CrossRef]
  50. Kusakana, K. Feasibility analysis of river off-grid hydrokinetic systems with pumped hydro storage in rural applications. Energy Convers. Manag. 2015, 96, 352–362. [Google Scholar] [CrossRef]
  51. Faisal, M.; Hannan, M.; Ker, P.; Hussain, A.; Mansor, M.; Blaabjerg, F. Review of Energy Storage System Technologies in Microgrid Applications: Issues and Challenges. IEEE Access 2018, 6, 35143–35164. [Google Scholar] [CrossRef]
  52. Singh, S.; Joshi, H.; Chanana, S.; Verma, R.K. Impact of Superconducting Magnetic Energy Storage on frequency stability of an isolated hybrid power system. In Proceedings of the 2014 International Conference on Computing for Sustainable Global Development (INDIACom), New Delhi, India, 5–7 March 2014; pp. 141–145. [Google Scholar]
  53. Saranya, S.; Saravanan, B. Optimal size allocation of superconducting magnetic energy storage system based unit commitment. J. Energy Storage 2018, 20, 173–189. [Google Scholar]
  54. Mukherjee, P.; Rao, V.V. Superconducting magnetic energy storage for stabilizing grid integrated with wind power generation systems. J. Mod. Power Syst. Clean Energy 2019, 7, 400–411. [Google Scholar] [CrossRef]
  55. Chen, Z.; Xiao, X.; Li, C.; Zhang, Y.; Zheng, Z.X. Study on unit commitment problem considering large-scale superconducting magnetic energy storage systems. IEEE Trans. Appl. Supercond. 2016, 26, 5701306. [Google Scholar] [CrossRef]
  56. Awan, A.B.; Zubair, M.; Sidhu, G.; Bhatti, A.; Abo-Khalil, A.G. Performance analysis of various hybrid renewable energy systems using battery, hydrogen, and pumped hydro-based storage units. Int. J. Energy Res. 2019, 43, 6296–6321. [Google Scholar] [CrossRef]
  57. Sultan, H.M.; Menesy, A.; Kamel, S.; Korashy, A.; Almohaimeed, S.; Abdel-Akher, M. An improved artificial ecosystem optimization algorithm for optimal configuration of a hybrid PV/WT/FC energy system. Alex. Eng. J. 2021, 60, 1001–1025. [Google Scholar] [CrossRef]
  58. Optimal sizing of grid integrated hybrid PV-biomass energy system using artificial bee colony algorithm—Singh. IET Renew. Power Gener.—Wiley Online Libr. 2016, 10, 642–650. Available online: https://ietresearch.onlinelibrary.wiley.com/doi/full/10.1049/iet-rpg.2015.0298 (accessed on 8 December 2022). [CrossRef]
  59. Podder, A.K.; Das, A.K.; Hossain, E.; Kumar, N.M.; Roy, N.K.; Alhelou, H.H.; Karthick, A.; Al-Hinai, A. Integrated modeling and feasibility analysis of a rooftop photovoltaic systems for an academic building in Bangladesh. Int. J. Low-Carbon Technol. 2021, 16, 1317–1327. [Google Scholar] [CrossRef]
  60. Ma, T.; Yang, H.; Lu, L.; Peng, J. Pumped storage-based standalone photovoltaic power generation system: Modeling and techno-economic optimization. Appl. Energy 2015, 137, 649–659. [Google Scholar] [CrossRef]
  61. Al-Masri, H.M.; Al-Sharqi, A.; Magableh, S.; Al-Shetwi, A.; Abdolrasol, M.; Ustun, T.S. Optimal Allocation of a Hybrid Photovoltaic Biogas Energy System Using Multi-Objective Feasibility Enhanced Particle Swarm Algorithm. Sustainability 2022, 14, 685. [Google Scholar] [CrossRef]
  62. Yang, H.; Zhang, Y.; Ma, Y.; Zhou, M.; Yang, X. Reliability evaluation of power systems in the presence of energy storage system as demand management resource. Int. J. Electr. Power Energy Syst. 2019, 110, 1–10. [Google Scholar] [CrossRef]
  63. Tian, Z.; Seifi, A.A. Reliability Analysis of Hybrid Energy System. Int. J. Reliab. Qual. Saf. Eng. 2014, 21, 1450011. [Google Scholar] [CrossRef]
  64. Upadhyay, S.; Sharma, M.P. Development of hybrid energy system with cycle charging strategy using particle swarm optimization for a remote area in India. Renew. Energy 2015, 77, 586–598. [Google Scholar] [CrossRef]
  65. Arabali, A.; Ghofrani, M.; Etezadi-Amoli, M.; Fadali, M.S. Stochastic performance assessment and sizing for a hybrid power system of solar/wind/energy storage. IEEE Trans. Sustain. Energy 2013, 5, 363–371. [Google Scholar] [CrossRef]
  66. Al-Masri, H.M.K.; Magableh, S.; Abuelrub, A.; Saadeh, O.; Ehsani, M. Impact of Different Photovoltaic Models on the Design of a Combined Solar Array and Pumped Hydro Storage System. Appl. Sci. 2020, 10, 3650. [Google Scholar] [CrossRef]
  67. Nguyen, H.T.; Safder, U.; Nguyen, X.; Yoo, C. Multi-objective decision-making and optimal sizing of a hybrid renewable energy system to meet the dynamic energy demands of a wastewater treatment plant. Energy 2020, 191, 116570. [Google Scholar] [CrossRef]
  68. Bank, A.D. Guidelines for Estimating Greenhouse Gas Emissions of Asian Development Bank Projects: Additional Guidance for Clean Energy Projects; Asian Development Bank: Mandaluyong, Philippines, 2017. [Google Scholar]
  69. Xu, L.; Ruan, X.; Mao, C.; Zhang, B.; Luo, Y. An improved optimal sizing method for wind-solar-battery hybrid power system. IEEE Trans. Sustain. Energy 2013, 4, 774–785. [Google Scholar]
  70. Stages, L.C. Life Cycle Greenhouse Gas Emissions from Solar Photovoltaics; National Renewable Energy Laboratory: Golden, CO, USA, 2012. [Google Scholar]
  71. Amponsah, N.Y.; Troldborg, M.; Kington, B.; Aalders, I.; Hough, R.L. Greenhouse gas emissions from renewable energy sources: A review of lifecycle considerations. Renew. Sustain. Energy Rev. 2014, 39, 461–475. [Google Scholar] [CrossRef]
  72. Ubierna, M.; Santos, C.; Mercier-Blais, S. Water Security and Climate Change: Hydropower Reservoir Greenhouse Gas Emissions. In Water Security under Climate Change; Biswas, A., Tortajada, C., Eds.; Springer: Singapore, 2022; pp. 69–94. [Google Scholar] [CrossRef]
  73. Mirjalili, S.; Lewis, A. The whale optimization algorithm. Adv. Eng. Softw. 2016, 95, 51–67. [Google Scholar] [CrossRef]
  74. Mirjalili, S.; Mirjalili, S.; Lewis, A. Grey wolf optimizer. Adv. Eng. Softw. 2014, 69, 46–61. [Google Scholar] [CrossRef]
  75. Al-Masri, H.M.; Al-Sharqi, A.A. Technical design and optimal energy management of a hybrid photovoltaic biogas energy system using multi-objective grey wolf optimisation. IET Renew. Power Gener. 2020, 14, 2765–2778. [Google Scholar] [CrossRef]
  76. Clerc, M. Particle Swarm Optimization; John Wiley & Sons: Hoboken, NJ, USA, 2010; Available online: https://books.google.cm/books?hl=en&lr=&id=Slee72idZ8EC&oi=fnd&pg=PA5&ots=Rs2FPfhl_1&sig=blk_c2iShAljBtrDXXw1BXEQHXg&redir_esc=y#v=onepage&q&f=false (accessed on 11 December 2022).
  77. Ou, T.-C.; Hong, C.-M. Dynamic operation and control of microgrid hybrid power systems. Energy 2014, 66, 314–323. [Google Scholar] [CrossRef]
  78. Theo, W.L.; Lim, J.; Ho, W.; Hashim, H.; Lee, C.T. Review of distributed generation (DG) system planning and optimisation techniques: Comparison of numerical and mathematical modelling methods. Renew. Sustain. Energy Rev. 2017, 67, 531–573. [Google Scholar] [CrossRef]
  79. Adewuyi, O.B.; Shigenobu, R.; Senjyu, T.; Lotfy, M.; Howlader, A.M. Multiobjective mix generation planning considering utility-scale solar PV system and voltage stability: Nigerian case study. Electr. Power Syst. Res. 2019, 168, 269–282. [Google Scholar] [CrossRef]
  80. Loyyal Website. Luminous Solar. Available online: https://scholar.google.com/scholar?hl=en&as_sdt=0%2C5&q=Loyyal+Website.+%282021%2C+December%29.+Luminous+Solar+Panel+380Watt+%2F+24Volt+Mono+Perc+%5BCommercial%5D.+Luminous+Solar+Panel+380Watt+%2F+24Volt+Mono+Perc.+https%3A%2F%2Floyyal.in%2Fproduct-details%2Fluminous-solar-panel380watt-24volt-mono-perc+%28Accessed+2022-06-17%29&btnG= (accessed on 22 December 2022).
  81. Salama, H.S.; Vokony, I. Voltage and Frequency Control of Balanced/Unbalanced Distribution System Using the SMES System in the Presence of Wind Energy. Electricity 2021, 2, 205–224. [Google Scholar] [CrossRef]
  82. Aquino, T.; Zuelch, C.; Koss, C. Energy Storage Technology Assessment-Prepared for Public Service Company of New Mexico. HDR Report No. 10060535-0ZP-C1001. 30 October 2017. Available online: https://www.pnm.com/documents/396023/1506047/2017+-+HDR+10-30-17+PNM+Energy+Storage+Report.pdf/a2b7ca65-e1ba-92c8-308a-9a8391a87331 (accessed on 1 March 2023).
  83. Mongird, K.; Viswanathan, V.V.; Balducci, P.J.; Alam, M.J.E.; Fotedar, V.; Koritarov, V.S.; Hadjerioua, B. Energy Storage Technology and Cost Characterization Report. PNNL-28866, 1573487; Pacific Northwest National Lab. (PNNL): Richland, WA, USA, 2019. [Google Scholar] [CrossRef]
  84. Schröder, A.; Kunz, F.; Meiss, J.; Mendelevitch, R.; Von Hirschhausen, C. Current and Prospective Costs of Electricity Generation until 2050; Data Documentation from DIW Berlin, German Institute for Economic Research: Berlin, Germany, 2013. [Google Scholar]
  85. Solar Inverter Costs and How to Choose the Right One. Understand Solar, 23 February 2017. Available online: https://understandsolar.com/solar-inverter-costs/ (accessed on 24 November 2022).
  86. Bhattacharjee, S.; Acharya, S. PV–wind hybrid power option for a low wind topography. Energy Convers. Manag. 2015, 89, 942–954. [Google Scholar] [CrossRef]
Figure 1. The map representation of the research site.
Sustainability 15 08264 g001
Figure 2. Hourly load profile on a typical day.
Sustainability 15 08264 g002
Figure 3. Existing distribution network schematic diagram on the study area.
Sustainability 15 08264 g003
Figure 4. Grid-connected hybrid solar PV–biogas with hybrid SMES-PHES schematic diagram.
Sustainability 15 08264 g004
Figure 5. An overview of the suggested system design and analysis methodology.
Sustainability 15 08264 g005
Figure 6. Diagram outlining how a proposed grid-connected hybrid system would operate.
Sustainability 15 08264 g006
Figure 7. Representation of data on the research area’s hourly load demand, solar irradiation, and temperatures per annum.
Sustainability 15 08264 g007
Figure 8. Financial parameters [NPC, COE, and LCOE] representations using NSWOA, MOGWO, and MOPSO techniques.
Sustainability 15 08264 g008
Figure 9. Reliability parameters [EENS, LOLP, and LOLE] representations using NSWOA, MOGWO, and MOPSO techniques.
Sustainability 15 08264 g009
Figure 10. GHG emissions parameters [ C O 2 E m i s s i o n s , P H R E S and P E A ] representations using NSWOA, MOGWO, and MOPSO techniques.
Sustainability 15 08264 g010
Figure 11. Contributions of each energy generation, component’s total life cycle cost, and GHG emissions to the proposed hybrid system.
Sustainability 15 08264 g011
Figure 12. Annual power output from PV, biogas plant, energy balance, surplus and deficit using NSWOA.
Sustainability 15 08264 g012
Figure 13. Represents the annual charging, discharging, and SOC of a SMES energy storage system using an NSWOA.
Sustainability 15 08264 g013
Figure 14. Represents the annual charging, discharging, and SOC of a PHES energy storage system using an NSWOA.
Sustainability 15 08264 g014
Table 1. Technical and financial specifications for HRES system’s component.
Solar panel [80]
Max power380 Wp
Length width 1.976 × 0.991 m
Efficiency 19.41%
Temperature coefficient0.41%
Initial cost 145.845 EUR/kW
O M cost1% of initial cost
Life span25 years
SMES [81]
Energy, ESMES1 MJ
Inductance, LSMES0.5 H
Current, ISMES1 KA
Initial cost 5000 EUR/kW
Voltage, Vdc-link2 KV
Capacitance, Cdc-link0.01 F
PHES [82,83]
Overall efficiency77%
Cost of power conversion165–740 EUR/kW
Fixe OM cost8.5 EUR/kW
Variable OM0.8 EUR/MWh
Life Span30 years
Biogas generator [84]
Initial cost1342.5 EUR/kW
Fixed OM cost71.65 EUR/kW
Variable OM20.7 EUR/MWh
Inverter [85,86]
ModelUnderstandSolar
Initial cost172 EUR/kW
OM cost1% of initial cost
Efficiency95%
Table 2. Optimal sizing of HRES components by three metaheuristic optimization algorithms.
TechniquesType of Renewable Energy Resources
No of PV PanelPHES Capacity (KW)Reservoir Capacity (m3)Capacity of Biogas (KW)SMES Capacity (KWh)
NSWOA5495.44400.6726,798.14860.29142.28
MOGWO5228.58378.9725,296.88936.94142.28
MOPSO5464.31362.8624,995.71941.63142.28
Table 3. Optimized evaluation parameters using various metaheuristic optimization techniques.
Optimization TechniquesNSWOAMOGWOMOPSO
Evaluation Parameters
NPC (EUR)6.997 × 1067.008 × 1067.011 × 106
FinancialCOE (EUR/kWh)0.0531020.0536250.053743
LCOE (EUR/kWh)0.0462180.0468970.046985
EENS1.124 × 1051.174 × 1051.186 × 105
LPSP0.00850.00890.0092
ReliabilityIR0.99150.99110.9908
LOLP2.9253.2043.902
LOLE10.60511.50214.201
Existing   C O 2 E m i s s i o n s   ( Kg C O 2 )1.6122 × 1071.6122 × 1071.6122 × 107
GHG HRES   C O 2 E m i s s i o n s   ( Kg C O 2 ) 8.7536 × 1068.7895 × 1068.7945 × 106
C O 2 E m i s s i o n s   reduction   ( Kg C O 2 ) −7.3679 × 10⁶−7.3325 × 10⁶−7.3275 × 10⁶
Disclaimer/Publisher’s Note: The statements, opinions and data contained in all publications are solely those of the individual author(s) and contributor(s) and not of MDPI and/or the editor(s). MDPI and/or the editor(s) disclaim responsibility for any injury to people or property resulting from any ideas, methods, instructions or products referred to in the content.