Abstract
In order to accomplish economic, social, and environmental objectives, farm diversification is a significant feature in India’s agricultural systems and rural development. It is crucial to examine factors impacting farm productivity, such as socio, structural, and Circular Economy (CE) factors, in order to ensure the sustainability of varied farms. A decision to follow a farm circularity approach is required to increase agricultural production, return on investment, and achieve sustainability, so the current study was designed to move forward in identifying farm efficiency and their influencing drivers in production systems for the successful execution of circularity in future farms. The objective of this paper is to find the existing operational efficiency of farms, variables that impact a farm’s efficiency, the disparities in farm efficiency, and variables dominating farm efficiency. The efficiency behaviours of Indian farms operating in 2020–2022 were studied and regressed against the factors influencing farm performance. A two-step technique and survey data were employed. To assess variations in the relevance of drivers, an input-oriented Data Envelopment Analysis was employed; in the second stage, efficiency ratings were used as a dependent variable in a Tobit regression analysis. Explanatory variables for enhancing farm performance included social, structural, and Circular Economy (CE) drivers. The age of the farmer, total farm area, and dryland area as socio-structural variables, and reduce, recycle, and redesign as CE variables, have proven to affect the farm’s efficiencies significantly. Managerial implications in terms of technical, allocative, cost efficiency, and their drivers have been drawn from study findings. CE has been confirmed to be the strategy over which the farmer has complete control and has been found to have a more significant impact on farm efficiency. Social structural determents are second in terms of their impact. Farmers in the region have cushy access to inputs; however, they are not utilized to their maximum effect. Therefore, the study indicates that inefficient dryland farmers could increase their production by concentrating on a circular economy strategy.
1. Introduction
The lower return per INR invested has resulted in farm cost inefficiency. In India, the cost of cultivation (COC) of crops increases sixfold, but the farmer’s get-back price only increases threefold with the pre-determined price for crops. Due to surplus production, transportation distance, unpredictability in pricing and input availability, and buyer and seller decisions on products, farmers only get the best price sometimes, which further oscillates the return per INR invested scale. Among the necessary agricultural inputs, fertilizer’s contribution to agricultural production is impossible to ignore. Fertilizer usage has increased from 167 lakh tonnes in 2000 [1] to 350 lakh tonnes in 2021 [2], with a price inflation of 60% in 2022. In the long run, increased and inappropriate fertilizer usage decreased the soil quality and intimated the farmer to use more synthetic inputs to sustain the yield.
In the past, farmers declined to use fertilizer, but now, farmers need fertilizer to achieve considerable yields. Marginal and small farmers manage most farms in India, and their access to land, labour, and capital is limited. Lucrative jobs offer more returns than agriculture, which shifts the agricultural population towards urban areas, increases scarcity in the agricultural labour force, and increases the COC and reduces the return per INR invested. Twenty-seven per cent of the rural population migrated to urban areas, which jeopardizes the labour force for agriculture. The frequency of changes in input prices is at its maximum across the country; however, farmers’ revenue did not change. Fertilizer price, 4360 INR ton−1 in 2000 to 27,000 INR ton−1 in 2022 [3], seed price acquired a five-fold increased rate, labour cost rose from 32 INR day−1 in 2000 [4] to 338 INR day−1 in 2022 [5], hired machine cost rose to 600 INR hours −1 and land value increased multiple folds in rural areas. Since the green revolution, we have been self-sufficient in food production, but production in the dryland region is questionable. The situation in the dryland area is critical; sensitivity to credit flow brings decision pressure to use proportionate input to get maximum output. The present situation faced by the farmer will jeopardize the sustainable production of dryland areas in the years to come, though agricultural grain production recorded an increasing trend. It is essential to conserve and make use of India’s dryland region to sustain (ecological sustainability, restore soil fertility, reduce greenhouse gas (GHG) emissions), protect (without causing serious fluctuations in production), and improve (increase farm production with a growing population). In this case, to increase the agricultural production and return per INR invested, the necessary decision following the farm circularity approach is to reduce the COC. In order to optimise the functions of farms, it is crucial to figure out how to maximize their efficiency.
In light of this, in order to boost the development of farms, the following questions must be addressed: What is the practical operational efficiency of farms? What are the variables that impact a farm’s efficiency? What are the disparities in farm efficiency and dominating farm efficiency? So, we are in a position to scale the efficiency of farms and their drivers (socio, structural, and CE variables) to make the right decision. This study uses a two-stage Data Envelopment Analysis (DEA)–Tobit regression analysis. The DEA models have the advantage of simultaneous measurement of the individual farms’ technical, allocative, and cost efficiency [6]. The model offers a flexible approach using diverse data and provides information on decision variables acting at optimum scale or otherwise. Tobit regression was used to find the actual drivers of farm efficiency. The scientific aim of the study was to create a framework for the future to achieve sustainability without deteriorating the return on investment. The findings of this study clearly indicate the operating efficiency of farms helps government policies and investment. The utilitarian aim of the study was to identify the efficiency gap and their synergies in the production system. The objectives of this research paper are to find the existing operational efficiency of the representative farms in the dryland ecosystem—variables/determents that potentially impact farm efficiency and the disparities in farm efficiency—as well as to provide a comprehensive understanding of farm efficiency and its drivers in the dryland ecosystem.
Numerous researchers have explored the connection between farm efficiency factors to reduce input costs and examine the possibilities regarding potential output maximisation with existing technology. The author [7] declared that the age of the farmer, total land size, and recycling unit positively affect efficiency. The research indicates that farmers acquire the skill and knowledge required for selecting appropriate modern agricultural technologies and better planning over time, which leads to effective use of inputs. This is the findings of [8,9,10]. Boubacar et al. [11] stated that the production of resources tended to be influenced by age. Age was a reliable indicator of experience; older farmers were probably more familiar with ethical agricultural practices, which influences efficiency. Conflicting findings were also reported by [12,13]. Farmers with more experience are generally considered to have more knowledge of farming practices but are also more hesitant to adopt modern technologies.
Kwawu et al. [14] accessed the influence of structural variables on the efficiency of farms and found that farm size influenced farm efficiency. Since large farm holdings have more substantial financial resources, which allows farmers to dedicate more area to enhanced technology adoption and greater efficiency, large farms have a high possibility of adopting more features from an improved technology package. This conflicts with the findings of [15,16]; farm size is negatively influenced, showing that a unit % rise in farm size will truncate farm profitability by 2.45%. Underutilization of farm potentiality is the main reason. This is due to the fact that small-scale farmers are ineffective when tackling the prerequisites of operating large farms. If they start large farms incorrectly, such farms will be inexpertly managed, resulting in financial losses because the resources available to them can only support micro and small farms.
Subsequently, Circular Economy (CE) is outlined as a rehabilitative or restorative system in its intention and structure, suggesting the formation of possibilities entailing the transition from an extinction concept to a cradle-to-cradle concept, i.e., through superior design, we can transition from the use of non-renewable energy to the use of renewable energy, from the use of chemicals to their elimination, and from the production of large amounts of waste to its exclusion [17]. Some authors [18,19,20,21] used the CE approach and livestock waste management strategy to increase the nitrogen dynamics to fulfil crop nutritional demands, truncate GHG emissions, and abridge negative environmental footprints. The authors [22] analyzed the use of the circular economy strategy and proved the problem of an unsustainable linear economy could be solved via vermicomposting.
Using variable return to scale (VRS) data envelopment analysis [23] evaluated the technical efficiency of pearl millet farmers. They found that 81% of farm inputs are technically efficient, and farmers can produce the same output with a 19% reduction in farm input usage. Using allocative efficiency [24] proved that improvement in allocative efficiency increases the farm’s cost efficiency. Nkegbe [25] showed that using the cost frontier models resulted in peasant farmers in traditional agriculture settings being efficient in resource allocation. Addressing the study area’s research problem, many studies on efficiency analysis have been conducted, but the determinants of farm inefficiencies in the region and country are limited, and usage of cross-sectional data in the study may be subject to limitations; however, the authors have sought to minimise such limitations. Aside from prior investigations, this study has two phases of empirical analysis. Furthermore, the findings from this research may have practical ramifications for policymakers seeking to rationalise input resources in the future, especially in the dryland region in the country. Hence, this study is a pioneer to focus on applying a two-stage DEA–Tobit regression to analyze dryland farm efficiency and its determents. The interaction of the dryland farm component and its determents are represented in Figure 1.

Figure 1.
Interaction of individual and circular system.
- Represents the nutrient circularity between the soil and plant system, i.e., plant nutrient uptake from soil and a considerable amount of nutrients return to soil through residue incorporation (the system is linear).
- Represents the nutrient circularity between the soil and animal system, i.e., during grazing, the animal waste (urine and dung) adds nutrients to the soil (the system is linear).
- Represents the partial circular system, i.e., combination (a) and (b).
- Represents the complete circular system. This is the combination of an internal (mixed crop–livestock and household) and external system (sale produce). When the production system satisfies the demand of the internal system and excess is supplied to the external system, it is considered to be a complete circular economic production system.
2. Materials and Methods
2.1. Study Area
The study was conducted in the Western Zone (WZ) of Tamil Nadu (TN), India. This zone constitutes an area of 15,678 sq. km (15,67,800 ha). The major soils of the zone were red loamy and black soil [26]. The primary irrigation sources are canals, tanks, and well irrigation [27,28,29,30,31]. Rainy months of the zone can be grouped into three seasons, viz., summer rain (March to May), South–West monsoon rain (June to the middle of September) and North–East monsoon rain (October to December). The average rainfall received in the zone was 715 mm [32]. The average precipitation in the other zones of Tamil Nadu was 1105 mm for the Northeastern Zone, 1105 mm for the Cauvery Delta Zone, 857 mm for the Southern Zone, 875 mm for the Northwestern Zone, 2124 mm for the Hilly Zone, and 1420 mm for the High Rainfall Zone. The average rainfall of India was 1200 mm, while the state’s rainfall was 937.5 mm, 28% less than the national average. The area under cultivation is 6,98,105 hectares [27,28,29,30,31], which is 44.5% of the total area. Approximately 85% of the rural population in this zone is associated with agricultural activities. Most of the farms in this zone were marginal and small, following mixed crop–livestock production systems (MCLS) that produce crops such as sorghum, groundnut, maize, ragi, vegetables, and coconut [27,28,29,30,31]. Many people live below the poverty level as the zone sits at a 0.012 MPI (Multidimensional Poverty Index) score, and healthy food insecurity is high [33]. This has resulted in increased food insecurity and a high risk of undernourishment and poverty in the zone. As a result, living below the poverty line contributed immensely to decreasing agricultural productivity via lower credit flow, farm labour shortages, etc. Conducting the study in the representative district dryland areas will be of significant importance in permitting analysis, as they are from different environments yet contribute immensely to the agricultural economy of the zone.
To choose the representative district of the Western Zone, drought-prone areas were located using an analysis of meteorological data, and the demographic characteristics of farms were acquired using secondary sources of data from project reports, government data books, and yearly reports to explore an increasing discrepancy in dry land farming productivity. The preliminary survey was conducted to understand the scope of the study in the region. The preliminary field visit assisted us in confirming the practical difficulties faced by farmers regarding crop management (sowing, weeding, harvesting, storage), livestock management (proportionate number of cattle, non-dairy cattle, sheep, goat, poultry birds, fodder and feed requirements and their availability), resource management (water availability, nutrient availability, and farm waste utility), and farming groups that are vulnerable to climate change. Based on the visit and discussion with the local government authority of dryland areas, three districts, namely Tiruppur, Erode, and Dindigul in the WZ of TN, were selected for the 2020–2022 growing season, as shown in Figure 2. A cross-sectional research methodology was used in this study to gather data since it was effective in terms of time, resources, precision, and accuracy.
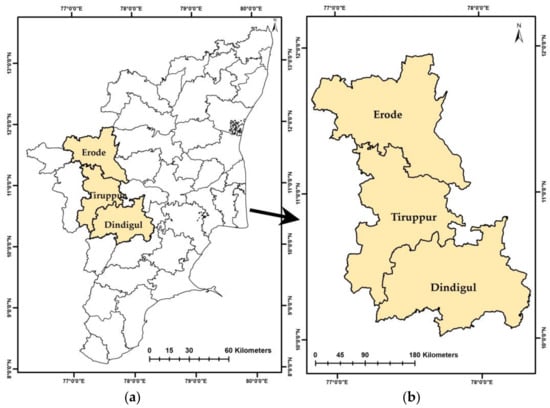
Figure 2.
Location map of the study area. (a) Tamil Nadu state map. (b) Represents the map of the WACZ of Tamil Nadu.
2.2. Sampling Protocol and Size
Dryland farmers were the intended audience with mixed crop–livestock production systems (MCLS) in the Western Zone of Tamil Nadu. The basis for the selection was that mixed crop-livestock production systems have been dominant and practised for ages in the zone. The sampling frame comprised dryland farmers, while the household head served as the sampling unit. In order to survey the Western Zone for this investigation, multi-stratified sampling techniques were used. This strategy is sensible and provides an accurate depiction of the intended occupants:
- Two blocks from each district were chosen due to their active and assertive participation and involvement in the dryland agricultural system. Based on the concentration of dryland production within the block, two villages were chosen as study sites (Figure 3).
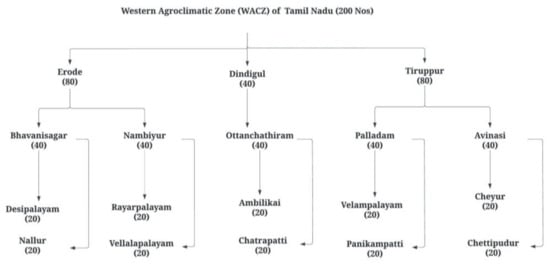 Figure 3. Sample location of the study area.
 - Farmers were stratified into crop producers (HC), crop with livestock producers (HCL), crop with livestock and bird producers (HCLB), crop with birds, supplementary unit producers (HCBS), crop with livestock, bird, and supplementary unit (HCLBS) producers.
Dryland farmers from all groups were intentionally chosen. The study’s sample size was 200 dryland farmers from the dryland production system.
2.3. Data Tracking
Primary data were collected from the dryland farmers from January 2020 to January 2022 using a close-ended survey questionnaire that was pretested by competent enumerators and a superintendent. The questionnaire includes brief and precise questions regarding the production, market value, and input usage. Details regarding the socio-economic characteristics of farmers, crops grown, inputs used with quantities and unit prices, quantities of output produced, and unit prices were also collected. Furthermore, in-person interviews with respondents were carried out to gather the specific data required to accomplish the study’s main objective. Secondary data used for this study were gathered from a wide range of sources, including scientific publications, annual government reports, and other internet sources. These collected data were helpful in comparing survey results and validating the survey.
2.4. Data Analysis Data Envelopment Analysis (DEA)
This paper utilizes the Data Envelopment Analysis (Computer) Program (DEAP) concerned with the use of Data Envelopment Analysis (DEA) methods. Farrel (1957) instigated the modern efficiency measurement, which educed Debreu’s (1951) and Koopmans’ (1951) body of work to calibrate firm efficiency, which could account for abound inputs. He postulated that a firm’s efficiency is composed of two components: technical efficiency, which reflects the firm’s ability to achieve maximal output from a given set of inputs, and allocative efficiency, which reflects the ability of a firm to use and allocate the existing inputs in optimal proportion with their respective prices. These two efficiency metrics are then integrated to measure total economic efficiency. Comparing different farming systems shows the difference between their TE scores, which is possibly related to the different technologies used by the two farming systems. In their contribution, they not only compare different farming practices but also different livestock productions and cropping systems. These results have important implications at the political level to better advise decision-making in farming. Analysis of the allocative and economic efficiency of smallholder farmers in mixed crop–livestock production could inform the government to take steps in the improvement of efficiency gaps (educational level of households, expansion of non-farm sectors, and reform of extension sectors). DEAP Version 2.0 execution typically requires five files: the executable file DEAP.EXE, the startup file DEAP.000, a data file VRS.DTA, an instruction file VRS.INS, and an output file VRS.OUT. The executable and startup files were supplied on the disk or in downloadable format. Prior to execution, the data and instruction files were created. Throughout execution, DEAP creates the output file. The data file was created with the farm output farm−1 year−1, farm input usage farm−1 year−1 and input price. The data file name, output file name, the number of operating Decision-Making Units (DMUs), and the number of outputs were all specified in the instruction file and inputs used with the selection of input orientation following variable return to scale.
The non-parametric mathematical programming approach to frontier estimation is the data envelopment analysis (DEA). Two different technical and allocative efficiencies can be measured if one has price data and is ready to consider a behavioral goal, such as cost minimization or revenue maximization. The input-oriented variable return to scale (VRS) DEA model could be used for cost minimization.
Any particular orientation should be chosen depending on the quantities that the farmer has the greatest influence over. This study uses the input-oriented method to compute cost-effectiveness. This approach was chosen because farmers have more control over their inputs than in their outputs in agricultural production [34]. Input-oriented metrics can be used to assess the DMU as a solution to linear programming [35].
A cost-effective input-oriented variable returns to scale model was used to evaluate the production system efficiency. The analysis was transacted using software designed by [6], which encompasses technical, allocative, and economic efficiency [36]. The DMU aims to minimize the usage of inputs in general and seed, fodder, fertilizer, and labour to attain the desired output level. The production frontier was constructed in the DEA approach based on linear programming to ascertain efficiency.
The finest DMU performs at 100% technical efficiency (efficiency score = 1), whereas the least efficient DMU operates at a percentage less than 100% (efficiency score < 1). Allocative efficiency, also known as pricing efficiency, is determined by the cost of inputs. It is commensurate to the input costs to output, and it is rational when marginal cost corresponds to marginal revenue. The allocative efficiency of DMU is the allocation of inputs in connection to its price for output level. As a result, cost efficiency is the result of technical and allocative efficiencies.
2.5. Tobit Regression Analysis
Efficiency scores from phase one have been used as a dependent variable in the Tobit regression in the second step. When the dependent variable exhibits some censoring, this model is used. Its general formulation is as follows:
where, ) independently and ….,.
However, we measure only if for some cutpoints L (lower limit) and U (upper limit) or or , whichever is closer. The Tobit model is a multiple linear regression model, but the responses are censored if they fall below or above certain cut points [37]. The Tobit regression is also known as a censored regression and was highly preferred in this study because it is an econometric and biometric modelling method. The type I Tobit model has been used. The above and below cutpoints were taken as 1 and 0 according to the dependent variable (technical, allocative and cost efficiencies). Age of the household head, level of education, experience in farming, household size, i.e., number of members in a family, total farm area, total dryland area and total dryland with contingent irrigation were considered as socio-demographic independent parameters in the Tobit model and circular economy principles followed mostly in surveyed farms, viz., reduce, reuse, and recycle were fixed as CE-based independent variables. To understand the cause and effect of these variables on farm efficiencies, a type I Tobit regression analysis was employed. The Tobit regression was performed using the R software package v. 4.2.1 [38].
2.6. Data Description and Key Variables
The survey data served as the foundation for a two-stage procedure that included (1) Data Envelopment Analysis (DEA) at the initial stage and (2) Tobit regression at the second phase. Table 1 lists the variables employed in the DEA.

Table 1.
Variables used in DEA efficiency analysis.
Table 2 represents the indicators employed as independent variables in the Tobit analysis. The parameters influencing a farm’s efficiency have been categorized in three sets of hands: (a) Social variables, (b) Structural variables, (c) Circular Economy (CE) variables.
Table 2.
Variables used in Tobit regression are described in detail.
2.7. Statistical Analysis
Efficiency is the farm’s performance in quantity produced compared to the amount of input used. Principal Component Analysis (PCA) was executed to determine the input variable’s influence on the efficiency of dryland farms. PCA reduces the dimension of inputs to select the relevant standard general components of variables that influence farm efficiency. The eigenvalue of PCs measures the variance of the variables. More variance is explained by a factor having an eigenvalue less than one. To explore the relationship between the production system group and efficiency performance Games Holmes pairwise comparison test was performed. Another nonparametric approach used to compare group combinations among DMUs is the Games-Howell post hoc test. Descriptive statistics were used among the determents of efficiency, such as Socio structural and CE variables.
3. Results
3.1. Principal Component Analysis (PCA)
In total, nine variables were used in PCA and three principal components (PC) with eigenvalues greater than one (Table 3). The PCA results confirm the variability of the data set. The first two components of PCA explain 77% of the cumulative variance of the DMU. It was found that the PC1, the highest variation, was about 45% of the variability in the data set. It was closely related to variables such as sorghum seed usage, livestock feed/fodder usage, urea usage, and machinery usage. Acknowledging the feeding challenges of livestock in study areas, farmers progressively look for novel options to elevate their productivity and efficiency of crop–livestock enterprises. One such option in dry areas is to feed sorghum, potentially mitigating drought prevalence. In comparison to other crops, sorghum significantly improves the environmental sustainability, profitability, and resilience of the entire farm system.
Table 3.
Eigenvalues of variable PC.
Despite the recent reorientation of crop improvement programs, the decision to adopt a new variety by a farmer is a complicated process controlled by social, structural, economic, and technological factors. Feed scarcity, particularly during the dry season, has long been recognised as one of the major factors limiting livestock productivity in Tamil Nadu’s Western Zone. This suggests a prominent role for sorghum crops in addressing this challenge. In India, sorghum, maize and groundnut are prime dryland crops in the mixed crop–livestock systems. Figure 4a,b, Figure 5a,b and Figure 6a,b illustrate land coverage and production trends for these crops over the decade. Figure 4c,d and Figure 5c,d display the sorghum and maize production in dryland areas of the Western Zone of Tamil Nadu. As a result of current climate change threats, sorghum production is hampered by frequent dry spells and erratic rainfall. This is evident in Figure 4a–d, Figure 5a–d and Figure 6a,b, where land coverage and production have fluctuated for a large portion of the study area over the last decade.
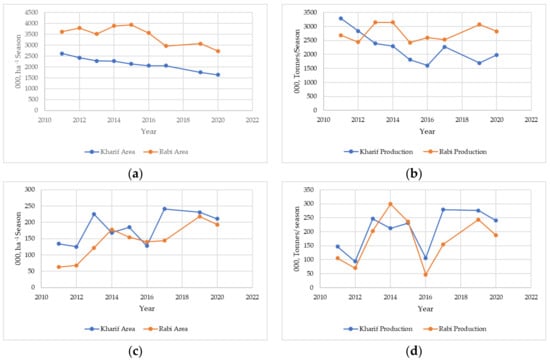
Figure 4.
(a) Sorghum area of India. (b) Sorghum production of India. (c) Sorghum area of Tamil Nadu. (d) Sorghum production of Tamil Nadu.
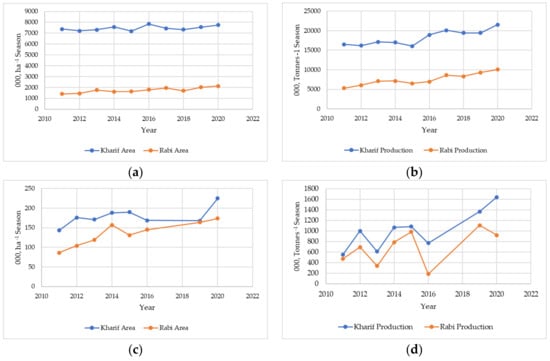
Figure 5.
(a) Maize area of India. (b) Maize production of India. (c) Maize area of Tamil Nadu. (d) Maize production of Tamil Nadu.
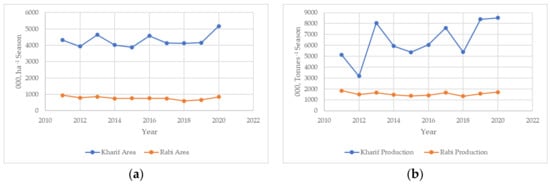
Figure 6.
(a) Groundnut area of India. (b) Groundnut production of India.
Due to its historical reputation, palatability and digestibility, risk of deterioration during storage, and seasonal supply constraints, sorghum is currently regarded as the second-best option in animal and poultry feed. As a result, sorghum is frequently employed when maize is too expensive to ration [39]. Feed sorghum is now priced 5–15% less than maize in India, and it has been proposed that widening this gap might increase its appeal to the feed sector [40]. The dairy sector has a strong need for fodder in urban and peri-urban regions; thus, farmers frequently sell sorghum stalks for animal feed. Furthermore, under stress conditions such as heat and drought, sorghum is better adapted and produced more yield than corn [41,42]. This might be the probable reason sorghum was fed to the livestock in the area of study.
The primary crop in the study area is sorghum, which obviously influenced the machinery used in the study area for initial field preparation more than the other dominant crops. Farmers in the study area preferred nitrogenous fertilizer over other complex mixtures of fertilizer for sorghum cultivation to meet the fodder and feed requirements of birds and animals, which results in the usage of urea more than the DAP and MOP fertilizers. Nitrogenous fertilizer increases the biomass of crops and crude protein content and reduces the crude fibre content [43]. The nitrogen application affects sorghum forage production and improves its quality from the viewpoint of protein contents. Nitrogenous fertilizer was used to prevent plant deficiencies, make plants greener, and improve the palatability of the feed to increase and maintain the yield [44]. PC2 was about 32% of the variability in the data set. It was closely related to the DAP and MOP. The PC1 suggests a positive correlation between sorghum crop seed (0.86), animal feed (0.79), machinery usage (0.96), and urea usage (0.79). A PC2 correlation was observed between the DAP (0.85) and MOP (0.80), which was not strongly associated with sorghum (0.185) and maize (0.284) cultivation and confirms the majority of farmers’ disinterest in the usage of complex fertilizers for crop production in the study area. PC3 represents maize seed usage (0.95), which has a close association with feed and fodder production (0.452), confirming the usage of maize as alternate feed to the livestock next to the sorghum in the study area Figure 7 and Figure 8.
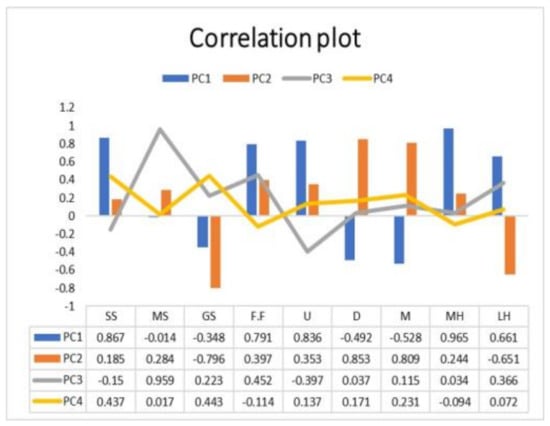
Figure 7.
Correlation of DEA inputs and PCs.
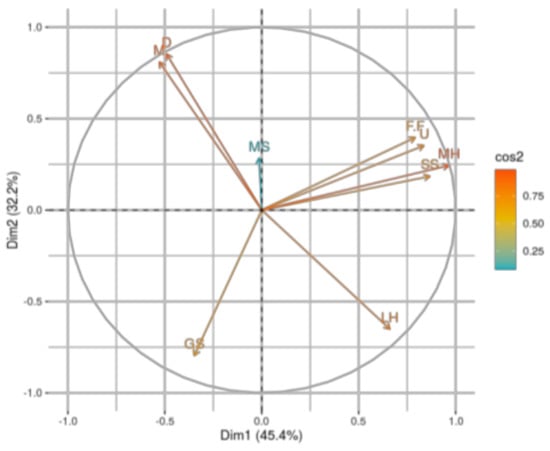
Figure 8.
DEA variable PCA.
3.2. Descriptive Statistics
Table 4 reports the mean values of input parameters used in efficiency analysis in the DEA. Following the table, the average external seed usage is high for HCBS (142.84 kg ha−1), average fertilizer usage was high for the HCLB group (4 bag ha−1), the sum of the machine and human labour hours were higher for the HCBS group (1215.46 h ha−1), external feed and fodder usage higher for HCL group (3413.83 kg ha−1). Generally, a farm that supports birds and cattle as a component expressed higher external input usage. This increased the technical and allocative efficiency of farms and improved economic efficiency. Due to the increasing demand for poultry meat and milk with the growing population, the farms that have birds and livestock as component increase year-round credit availability, which helps to carry out timely farm operations and impacts the economic efficiency of farms by supplying external farm inputs. However, farmers could meet the feed and fodder requirement of livestock and birds with a lower livestock population and the cultivation of sorghum, maize, and groundnut on their own rather than relying on commercial purchases, which reduces the number of external purchases.
Table 4.
Descriptive statistics of DEA Variables.
In commercial production, maize and soybean were essential to feed poultry birds; however, the frequent occurrence of droughts and climate change led to fluctuations in crop production and lower recorded yields in soybean. Furthermore, genetically modified crops were banned in India, and commercial production of soybean in India faced difficulties. Following this ban, the COVID-19 pandemic and other unknown diseases made people shift from broiler production to the backyard poultry market to get country chickens, though the price margin was high, which ultimately influenced the cost efficiency of farms. This challenges the findings of [45]. Backyard poultry production is a low-input, high-return business and an age-old profession of rural families in India [46]. It is an enterprise with a modest initial investment and greater economic returns that can be comfortably regulated by women, children, and elderly members of households, thus increasing the cost efficiency of farms. This conflicts with the findings of [47], which assessed the profit efficiency and its determinants of layer production. On average, layer investors regulate it with a profit margin of about 46%. This implies that engaging layer producers through services (veterinary officers) in the detection of poultry diseases at an early stage could be vital in truncating the inefficiency levels to achieve higher profits and gains.
The standard deviation value among seed usage in farms for ground nut is 47.99, followed by maize at 16.39 and sorghum at 3.43, which was due to the varied grain weight between the crop seed, the cultivation area of crops, market price variation, availability of seed material, and awareness about groundnut food and feed values in dryland area. The sale price of groundnut is 5527 INR quintal−1 which is higher than the maize 2302 INR quintal−1 and sorghum 3112 INR quintal−1 [48]. The average 100-grain weight of groundnut is 47 g, 39 g for maize, and 2.6g for sorghum [49,50,51]. All these combined factors made higher dispersion in seed usage in the study area and confirmed the heterogeneity in crop cultivation in the Western Zone of Tamil Nadu. The urea recorded a higher SD value of 1.23, followed by the DAP at 0.62 and MOP at 0.12; this was due to the higher availability and awareness about the usage of nitrogenous fertilizer than other complex fertilizers in the study area. Farmers in the study area used urea more and at a different rate than the DAP and MOP. This is probably due to the farm size, crop preference, fertilizer availability, subsidy distribution pattern, visual yield benefits of nitrogenous fertilizer, educational status of the farmer, and interaction with the extension agency. Among the labour hours, human labour hour usage was recorded with a maximum SD Value of 406.70, while machine labour hours had an SD value of 1.79 due to land fragmentation in the study area. Most of the farmers observed had marginal and/or small farms, most of them were middle and old-age farmers, and their primary source of income was only through agriculture, which made them involved in agricultural activities, obviously resulting in increased human labour usage in agriculture. For the fodder and feed requirement, the SD value was 1794.18. However, the coefficient of variations (CV) values were dispersed between 27.75% for machine hours and 144% for the maize seed, which denotes a higher dispersion among the variable used in the efficiency analysis.
Table 5 depicts the descriptive statistics of independent variables used in Tobit regression. As shown in the table, the mean age of farmers is 51.82 years old, and most are illiterate, with a mean score of 2.43. The experience of the farmers in the study area varied between two to sixty, and household size ran between two to seven. The total farm area depicted between 0.50 hectares to 17 hectares, in which the dryland area was expanded by up to 10 hectares while the dryland area with contingent irrigation expanded by up to 17 hectares. Potential dryland areas and dryland areas with the contingent irrigation of farms were not well utilized to achieve the actual yield due to frequent drought, fluctuations in minimum and maximum temperature, rainfall change patterns, and lack of credit availability to use improved packages.
Table 5.
Tobit regression descriptive statistics.
Furthermore, the mean recycle score was 0.85, followed by a redesign score of 0.12, and a reduce score of 0.10 out of 1. This demonstrates that farmers in the study area were more likely to accept and use the recycling practice than the other Circular Economy (CE) practices. The SD value of CE variables indicated that reduce, reuse, and redesign strategy values do not differ much statistically and ranges between 0.29 and 0.36 confirm the strategy linkages in the production system. Concerning the CV, the dispersion of values held between 0.42 and 3.09 affirms the CE adoption strategy in the Western Zone of Tamil Nadu and proves that only some of the production system follows the CE strategy. The redesign and reduce practice exists in dryland farms, but their intense following could be better. The CE variables scores indicate the existence of on-farm resource wastages in the study area. Among the drivers of inefficiency, the CE drivers were the farmers have utmost control, and managing them might influence the efficiency of farms in the study area. The inefficiency of farms was examined by [52], who found that nutrient recycling through composting, mulching, and residue incorporation can reduce the external purchase of inputs and improve soil quality indicators. According to [53], residue recycling saves the input cost and results in a percentile boost in organic carbon, available nitrogen, phosphorous, and potassium, which reduces the external input supply to improve farm efficiency.
3.3. Data Envelopment Analysis (DEA) of Agricultural Farms
The results of Figure 9, Figure 10 and Figure 11 show the mean technical, allocative, and economic efficiency of different farm groups (HC, HCBS, HCL, HCLB, and HCLBS). The efficiency of HC farms was 98%, 60%, and 59%; 100%, 92% and 92% for HCBS farms; 87%, 56% and 50% for HCL farms; 80%, 75%, 66% for HCLB farms; and 97%, 63% and 63% for the HCLBS farm. Thus, the results from different farm groups reveal inefficiencies in the production system in the Western Zone of Tamil Nadu.
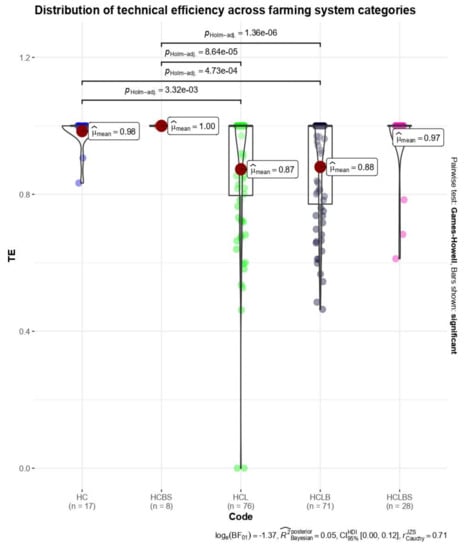
Figure 9.
Technical efficiency.
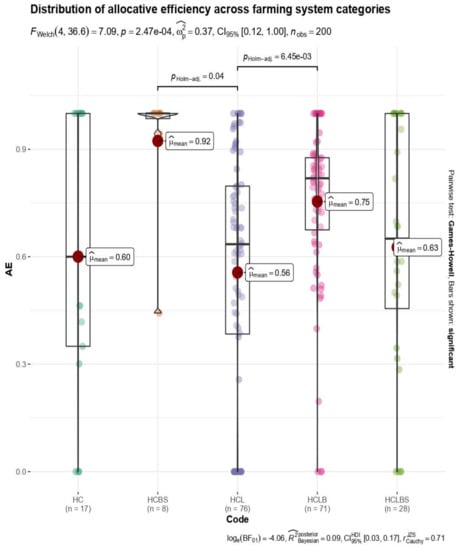
Figure 10.
Allocative efficiency.

Figure 11.
Cost efficiency.
The HCBS farms have higher technical, allocative, and economic efficiencies than all other farm groups. However, the findings indicate that there are still significant inefficiencies in using inputs for the corresponding output levels. The mean technical, allocative and economic efficiency estimates between different farm groups were statistically significant. The Games–Howell test confirms the significant difference among the production system group at the 0.001% level for technical efficiency. The significant difference between HC and HCL is 3.32 × 10⁻³; between HC and HCLB, it is 4.73 × 10⁻⁴; between HCBS and HCL, it is 8.64 × 10⁻⁵; and between HCBS and HCLB, it is 1.36 × 10⁻⁶, respectively. This confirms the resource disparity and heterogeneity among the production system group. Regarding allocative efficiency, a significant difference was observed between the HCBS and HCL groups at the 0.05% level (p = 0.04), while the HCL and HCLB were significantly different at 0.001% (p = 6.45 × 10⁻³). Regarding cost efficiency, the HCBS and HCL significantly differed at 0.01% (p = 0.01) (Supplementary Tables S1–S10).
Even though farmers cultivate dryland crops such as sorghum, groundnuts, and maize, their cultivation extends to vegetable, flower, and commercial tree production, significantly influencing the production system package. This heterogeneity technology intervention for cultivation is reflected in the allocative efficiency and cost efficiency of farms at the meagre level; the allocative efficiency results denoted that whatever technology package the farmer preferred was available at an almost identical cost within the group, but significant differences were found between the HCBS with HCL and HCL with HCLB groups.
3.4. Tobit Regression Analysis
The Tobit results presented in Figure 12, Figure 13 and Figure 14 show the positive association between the age of the head, farm size, dryland area, reduce, redesign and recycle determent. The relationship between the Social, structural, and CE variables with the farm’s technical, allocative, and economic efficiency was statistically tested. The test results show that the mean difference in scores is significant at 1%, 5%, and 10%. The association between age and the technical, allocative, and economic efficiency of farms shows that the mean difference in technical, allocative, and economic efficiency scores is statistically different at 1% (p = 0.01), 1% (p = 8.28 × 10⁻³), and 1% (p = 0.01) levels of significance. Results of the statistical tests on the relationship between farm size and technical efficiency reveal that at a 5% level of significance, the mean difference in scores is statistically significant (p = 0.03). The dryland area significantly differed at 5% (p = 0.02) for allocative efficiency and cost efficiency (p = 0.05). The CE reduce strategy significantly differed at 10% (p = 0.07), redesign at 0.1% (p = 1.11 × 10⁻³), and recycle at 5% (p = 0.04) for technical efficiency. For allocative efficiency, there were no significant differences observed with CE variables. Regarding cost efficiency redesign, the CE strategy significantly differed at 5% (p = 0.05). The overall Tobit regression was significant at the 0.1% (p < 0.001) level for all efficiencies. The sign of these variables implies that efficiency increases with these sensitive variables. The age of the farmer implies that the technical efficiency of production increased with the age of the farmer. This proves that older farmers were more economically efficient in production. The fact that the farming experience of households increases with age, as well as resource empowerment, leads to an increase in cost efficiency. The significant influence of total farm size and CE strategy on technical efficiency is critical, indicating that marginal and smaller farms are more technically effective than larger farms. Most of the experimental farms were marginal and small, and their dependency on the external source of farm input was minimal due to the lack of credit availability and internal input production, which led to indigenous farm management. So, these farms are left to use previous farm-produced seeds or to go through a local exchange of seeds between the farms with farm-recycled animal waste, bird waste, kitchen waste, and crop waste. With this management practice, the technical and allocative efficiency of the farm was stable and resulted in the economic efficiency of the farm to stay between moderate and high levels.
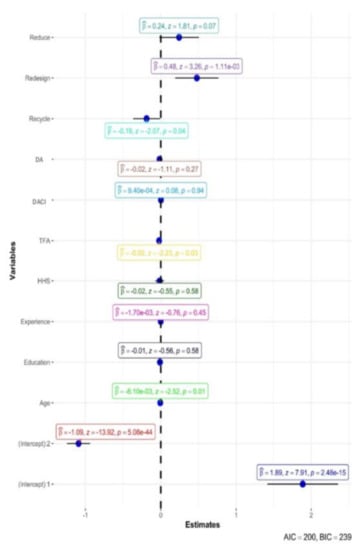
Figure 12.
Tobit- Technical efficiency.
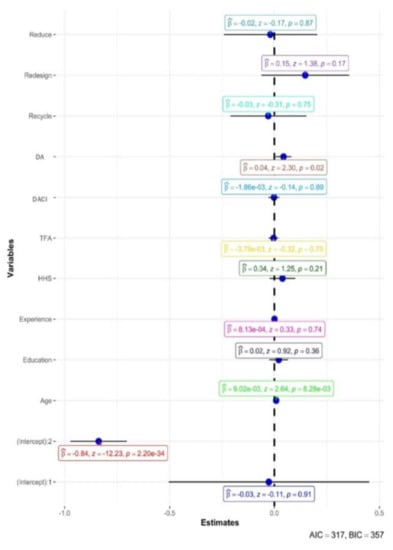
Figure 13.
Tobit- Allocative efficiency.
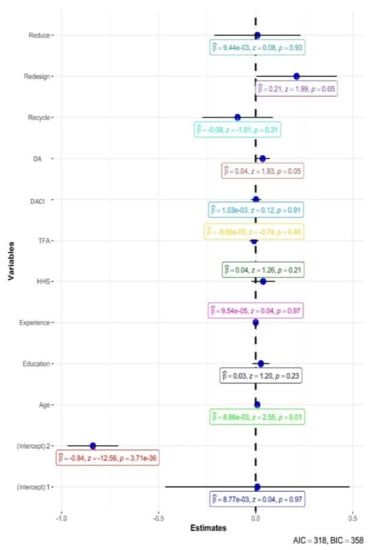
Figure 14.
Tobit- Cost efficiency.
4. Discussion
India has suffered from food shortages with occasional drought and famine. The rapidly growing population created more pressure on agriculture, and the country suffered from a lack of food grains in 1950. The government has sponsored a national initiative to address food self-sufficiency concerns about food security that have existed in the nation since the early years of its independence. Numerous strategies have expanded output, which has had an equal number of beneficial and negative effects on society and the environment. During the transition years, input cost, agricultural productivity, production, and gross sown area have all surged. Nonetheless, the nation continues to rank among the largest producers, consumers, and exporters of agricultural goods but the differences in production efficiency, and return on the INR invested hampers farm sustainability and economic returns. Therefore, it is crucial to analyze the efficiency of farms.
Diversified farming is an old strategic production system followed in India; there is a need to analyze the performance of farms in the country. In this regard, study looked at farms’ technical, allocative, and economic efficiency, as well as the factors that contribute to inefficiencies. A farm’s capacity to achieve the maximum level of production with a given set of inputs refers to TE. The evaluation of the farm’s TE enables the decision-making knowledge of the farmers. The TE analysis assumes an optimal degree of input transformation and the analysis computes the farmer’s actual capacity to convert resources into farm output. The difference between the optimal level of efficiency and the actual farm’s TE measures technical inefficiency, which is understood as farms failing to produce the maximum output to the given inputs. Thus, the technical efficiency (TE) is calculated based on the ratio between the output obtained by the farm and the optimal standard. Analyses were accomplished in the WZ of TN. Farm-level data, such as land, seeds, synthetic fertilizers, and labour force, were itemized by their significance in production, DEA was performed, and determents were found with Tobit regression analysis. This study discovered that all inputs used in the production system have uniquely and positively influenced total output, confirming farmers have good access to inputs in this region. However, the technical, allocative, and cost-efficiency scores of DMUs differed, and few farmers were found to be technical, allocative, and cost-efficient in their production. As an outcome, inefficient DMUs have a lot of opportunity to boost their efficiency. Beshir et al. [54] examined the economic efficiency of crop and animal production and proposed that efficiency development is one of the viable pathways for expanding agricultural production, with education, farm household assessments, extension service, and finance availability as drivers.
It is interesting to note that incompetent farmers may not become efficient/competent by reducing inputs or the costs of inputs. Thence, we considered incorporating several socio-structural and CE variables to identify the inefficiencies’ determinants. These determinants divulge specific aspects to increase their efficiency. Findings indicate that farmers’ age, total farm size, dryland area, recycle, reduce, and redesign were efficiency determinants. This implies that aged farmers, farm size, and farms following the CE strategy were found to be more economically efficient. In sum, the causes of inefficiencies may be due to inappropriate use or misallocation of input resources and their determinants. The efficiency analysis of the crop livestock production system to advise the policy implementation should consider improvements in sociodemographic characteristics (education, knowledge on technology management, and institutional factors). Empirical analyses on technical, allocative, and cost efficiency and the knowledge of tangible constraints in resource utilization are essential for framing the policy in the future. We could only manage and conduct 200 direct contact interviews with farmers due to time and budget constraints. A greater sample size would likely lead to much more fair outcomes. We give the following recommendations based on the study’s findings:
- The primary emphasis should be on improving the reuse and redesign strategy and developing new methods for decreasing nutrient wastage. In this regard, the roles of Universities and research institutions should be strengthened.
- The government should create extension services and comprehensive training programmes for agricultural and allied producers regarding the CE strategy.
5. Conclusions
The large body of literature focuses on farm diversification and its drivers, but only a few studies have investigated farm efficiency with its circular economy (CE) drivers. Our findings suggest that dryland farm efficiency and its drivers are at the farm level in India. Additionally, our results contribute to clarifying and comparing the role played by different strategies that farmers use in enhancing the financial performance of farms. The CE, farm size, and social determents are confirmed to be the strategy with the most significant impact. The findings of this study demonstrate that although farmers in this area have convenient access to input supplies, they still need to use those inputs judiciously and proportionately. Therefore, we suggest that inefficient dryland farmers can boost their output by conserving already-existing resources while paying special attention to CE drivers.
Supplementary Materials
The following supporting information can be downloaded at: https://www.mdpi.com/article/10.3390/su15108332/s1. Table of the efficiency analysis and input usage by firms were depicted in Tables (S1–S10). Table S1: Efficiency results of firms in HCL group, Table S2: Input usage by firms in HCL group, Table S3: Efficiency results of firms in HCBS group, Table S4: Input usage by firms in HCBS group, Table S5: Efficiency results of firms in HCLB group, Table S6: Input usage by firms in HCLB group, Table S7: Efficiency results of firms in HC group, Table S8: Input usage by firms in HC group, Table S9: Efficiency results of firms in HCLBS group, Table S10: Input usage by firms in HCLBS group.
Author Contributions
G.A.B.; execution of survey and original draft preparation, V.G.; designed the concept, methodology, and overall supervision, A.S.; Research activity coordination and post-review editing, M.P.; DEA Software and reviewing, S.I.; statistical analysis and data curation, M.R.; review and editing, K.B. and B.N.; graph visualization and reviewing, K.S., R.G. and S.P.; primary data curation and overall supervision. All authors have read and agreed to the published version of the manuscript.
Funding
This research received no external funding.
Institutional Review Board Statement
Not applicable.
Informed Consent Statement
Not applicable.
Data Availability Statement
Not applicable.
Acknowledgments
The financial support from the Indian farmers fertilizer cooperative, Chennai, Tamil Nadu. In the project of evaluating the field efficacy of nano fertilizer in major crops assessing its impact on the green house gas emission and carbon foot print, Tamil Nadu Agricultural University are greatly acknowledged. We are grateful to the farmers of the study area for giving valuable information. Their responses have contributed to our analyses and suggest new lines of approach for future study.
Conflicts of Interest
The authors declare no conflict of interest.
References
- IndiastatAgri. Available online: https://www.indiastat.com/data/agriculture/requirement-availability-and-sales-of-fertilisers (accessed on 10 August 2022).
- IndiastatAgri. Available online: https://www.indiastat.com/data/agriculture/consumption-of-fertiliser-nurtients (accessed on 12 August 2022).
- IndiastatAgri. Available online: https://www.indiastat.com/data/agriculture/fertiliser-prices (accessed on 13 August 2022).
- IndiastatAgri. Available online: https://www.indiastatagri.com/table/labour-workforce/selected-state-wise-average-daily-wage-rates-agric/71279# (accessed on 14 August 2022).
- IndiastatAgri. Available online: https://www.indiastatagri.com/table/labour-and-workforce/monthly-average-daily-wage-rates-harvesting-winnow/841232# (accessed on 16 August 2022).
- Coelli, T. Centre for Efficiency and Productivity Analysis (CEPA) Working Papers; Department of Econometrics, Universíty of New England: Armidale, Australia, 1996. [Google Scholar]
- Raheli, H.; Rezaei, R.M.; Jadidi, M.R.; Mobtaker, H.G. A two-stage DEA model to evaluate sustainability and energy efficiency of tomato production. Inf. Process. Agric. 2017, 4, 342–350. [Google Scholar] [CrossRef]
- Horvat, A.M.; Radovanov, B.; Popescu, G.H.; Panaitescu, C. A two-stage DEA model to evaluate agricultural efficiency in case of Serbian districts. Econ. Agric. 2019, 66, 965–974. [Google Scholar]
- Guney, O.I. Eco-Efficiency in Farm Management for Sustainable Agriculture: A Two-Stage Data Envelopment Analysis in Wheat Production. Pol. J. Environ. Stud. 2021, 30, 5549–5557. [Google Scholar] [CrossRef] [PubMed]
- Rade, P.; Kleut, Z.; Dokic, D. Exploring the drivers of efficiency in organic and conventional soybean production. Custos E Agronegocio 2018, 14, 214–229. [Google Scholar]
- Boubacar, O.; Hui-qiu, Z.; Rana, M.A.; Ghazanfar, S. Analysis on technical efficiency of rice farms and its influencing factors in south-western of Niger. J. Northeast Agric. Univ. 2016, 23, 67–77. [Google Scholar] [CrossRef]
- Ayaz, S.; Anwar, S.; Sial, M.H.; Hussain, Z. Role of agricultural credit on production efficiency of farming sector in Pakistan—A data envelopment analysis. Pak. J. Life Soc. Sci. 2011, 9, 38–44. [Google Scholar]
- Sherzod, B.; Kim, K.R.; Lee, S.H. Agricultural transition and technical efficiency: An empirical analysis of wheat-cultivating farms in Samarkand Region, Uzbekistan. Sustainability 2018, 10, 3232. [Google Scholar] [CrossRef]
- Kwawu, J.D.; Sarpong, D.B.; Agyire-Tettey, F. Technology adoption intensity and technical efficiency of maize farmers in the Techiman municipality of Ghana. Afr. J. Sci. Technol. Innov. Dev. 2022, 14, 532–545. [Google Scholar] [CrossRef]
- Wongnaa, C.A.; Awunyo-Vitor, D.; Mensah, A.; Adams, F. Profit efficiency among maize farmers and implications for poverty alleviation and food security in Ghana. Sci. Afr. 2019, 6, 206. [Google Scholar] [CrossRef]
- Rahman, S.; Kazal, M.M.H.; Begum, I.A.; Alam, M.J. Competitiveness, profitability, input demand and output supply of maize production in Bangladesh. Agriculture 2016, 6, 21. [Google Scholar] [CrossRef]
- Patwa, N.; Sivarajah, U.; Seetharaman, A.; Sarkar, S.; Maiti, K.; Hingorani, K.J. Towards a circular economy: An emerging economies context. J. Bus. Res. 2021, 122, 725–735. [Google Scholar] [CrossRef]
- Doyeni, M.O.; Barcauskaite, K.; Buneviciene, K.; Venslauskas, K.; Navickas, K.; Rubezius, M.; Baksinskaite, A.; Suproniene, S.; Tilvikiene, V. Management of Nitrogen Flow in Livestock Waste System Towards an Efficient Circular Economy in Agriculture. Waste Manag. Res. 2023, 41, 701–712. [Google Scholar] [CrossRef]
- Sutomo, B. Circular Economy on Cattle-Oil Palm Integration System to Realize Sustainable Agriculture (Case Study: District Penawar Aji TulangBawang). Int. J. Environ. Sci. 2022, 7, 14–27. [Google Scholar]
- Singh, E.; Mishra, R.; Kumar, A.; Shukla, S.K.; Lo, S.L.; Kumar, S. Circular economy-based environmental management using biochar: Driving towards Sustainability. Process Saf. Environ. Prot. 2022, 163, 585–600. [Google Scholar] [CrossRef]
- Kuipers, A.; Galama, P.; Leso, L.; Bruegemann, K.; Klopcic, M. A Composting Bedding System for Animals as a Contribution to the Circular Economy. Processes 2022, 10, 518. [Google Scholar] [CrossRef]
- Kamar Zaman, A.M.; Yaacob, J.S. Exploring the potential of vermicompost as a sustainable strategy in circular economy: Improving plants’ bioactive properties and boosting agricultural yield and quality. Environ. Sci. Pollut. Res. 2022, 29, 12948–12964. [Google Scholar] [CrossRef]
- Mukhtar, U.; Mohamed, Z.; Shamsuddin, M.N.; Sharifuddin, J.; Iliyasu, A. Application of data envelopment analysis for technical efficiency of smallholder pearl millet farmers in Kano state, Nigeria. Bulg. J. Agric. Sci. 2018, 24, 213–222. [Google Scholar]
- Long, L.K. Cost efficiency analysis in aquaculture: Data envelopment analysis with a two-stage bootstrapping technique. Aquac. Econ. Manag. 2022, 26, 77–97. [Google Scholar] [CrossRef]
- Nkegbe, P.K. Credit access and technical efficiency of smallholder farmers in Northern Ghana: Double bootstrap DEA approach. Agric. Financ. Rev. 2018, 78, 626–639. [Google Scholar] [CrossRef]
- TNAU Agritech Portal, Agriculture, Soil: Types of Soil-Agroclimatic Zones. Available online: https://agritech.tnau.ac.in/agriculture/agri_soilresource_agroclimate.html (accessed on 24 November 2022).
- District Census Handbook 2011. Available online: https://coimbatore.nic.in/document/census-handbook-2011/ (accessed on 24 November 2022).
- District Census Handbook 2011. Available online: https://tiruppur.nic.in/document/census/ (accessed on 24 November 2022).
- District Census Handbook 2011. Available online: https://erode.nic.in/documents/census/ (accessed on 24 November 2022).
- District Census Handbook 2011 (Part–A). Available online: https://karur.nic.in/document/district-census-handbook-2011-part-a/ (accessed on 24 November 2022).
- District Census Handbook 2011. Available online: https://censusindia.gov.in/nada/index.php/catalog/1121 (accessed on 24 November 2022).
- TNAU Agritech Portal, Agriculture, Agrometerology, Cropping Pattern, Western Zone. Available online: https://agritech.tnau.ac.in/agriculture/agri_agrometeorology_croppingpattern_westernzone.html (accessed on 24 November 2022).
- Multidimensional Poverty Index for Tamil Nadu. State Planning Commmission; Government of Tamilnadu: Chennai, India, 2022; pp. 4–11. Available online: https://spc.tn.gov.in/spc_reports/MDPI_FTM.pdf (accessed on 24 November 2022).
- Government of Tamil Nadu. Available online: https://cms.tn.gov.in/sites/default/files/documents/agri_e_pn_2022_23.pdf27 (accessed on 17 August 2022).
- Coelli, T.J.; Rao, D.S.P.; O Donnell, C.J.; Battese, G.E. An Introduction to Efficiency and Productivity Analysis, 2nd ed.; Springer Science and Business Media: New York, NY, USA, 2005; pp. 41–81. [Google Scholar]
- Koc, B.E.A.; Gul, M.; Parlakay, O. Determination of technical efficiency in second crop maize growing farms in Turkey: A case study for the East Mediterranean in Turkey. Asian. J. Anim. Vet. Adv. 2011, 6, 488–498. [Google Scholar] [CrossRef]
- Thomas, W.Y. The VGAM Package for Categorical Data Analysis. J. Stat. Softw. 2010, 32, 1–34. [Google Scholar]
- R Core Team. R. A Language and Environment for Statistical Computing; R Foundation for Statistical Computing: Vienna, Austria, 2022; Available online: https://www.R-project.org/ (accessed on 19 October 2022).
- Kleih, U.; Ravi, S.B.; Rao, B.D.; Yoganand, B. Industrial Utilization of Sorghum in India; Working Paper Series No. 4. Patancheru 502 324; International Crops Research Institute for the Semi-Arid Tropics: Patancheru, India, 2000; p. 44. [Google Scholar]
- Mundia, C.W.; Secchi, S.; Akamani, K.; Wang, G.J. A regional comparison of factors affecting global sorghum production: The case of North America, Asia and Africa’s Sahel. Sustainability 2019, 11, 2135. [Google Scholar] [CrossRef]
- Staggenborg, S.A.; Dhuyvetter, K.C.; Gordon, W.J. Grain sorghum and corn comparisons: Yield, economic, and environmental responses. Agron. J. 2008, 100, 1600–1604. [Google Scholar] [CrossRef]
- Nematpour, A.; Eshghizadeh, H.R.; Zahedi, M.J. Comparing the corn, millet and sorghum as silage crops under different irrigation regime and nitrogen fertilizer levels. Int. J. Plant Prod. 2021, 15, 351–361. [Google Scholar] [CrossRef]
- Almodares, A.; Jafarinia, M.; Hadi, M. The effects of nitrogen fertilizer on chemical compositions in corn and sweet sorghum. Am. Eurasian J. Agric. Environ. Sci. 2009, 6, 441–446. [Google Scholar]
- Chapke, R.R.; Tonapi, V.A.J. Adoption and socio-economic benefits of improved post-rainy sorghum production technology. Agric. Res. 2019, 8, 270–278. [Google Scholar] [CrossRef]
- Suresh, K.; Chandrakanth, M. Economic efficiency of improved red gram variety (BRG-2) in Karnataka: A DEA analysis. Econ. Aff. 2016, 61, 81–88. [Google Scholar] [CrossRef]
- Gulati, A.; Ganguly, K.; Wardhan, H. Agricultural Value Chains in India, Ensuring Competitiveness, Inclusiveness, Sustainability, Scalability, and Improved Finance; Springer Nature: Singapore, 2022. [Google Scholar]
- Krishi Jagran. Available online: https://krishijagran.com/featured/backyard-poultry-farming-a-low-input-business-with-high-economic-returns/ (accessed on 11 August 2022).
- IndiastatAgri. Available online: https://www.indiastat.com/table/agriculture/state-wise-farm-harvest-prices-principal-crops-sea/1433367# (accessed on 2 January 2023).
- Sukrutha, B.; Akkareddy, S.; Vemireddy, L.; Kumar, A.N.; Latha, P.; Nagamadhuri. Identification of multi-trait donor sources in groundnut (Arachis hypogaea L.) for yield and seed quality improvement. Electron. J. Plant Breed. 2022, 13, 1024–1035. [Google Scholar]
- Priyadharshini, C.; Gnanachitra, M.; Balachandar, D.; Jayanthi. Assessment of Shelf-life and Efficacy of the Seed-Coating Delivery System of Biofertilizers in Maize. Int. J. Plant Soil Sci. 2022, 34, 548–558. [Google Scholar] [CrossRef]
- Elangovan, M.; Annapurna, A.; Patil, R.; Patroti, P.; Pandey, S.; Pandey. Characterization of 2500 Indigenous Collections of sorghum (Sorghum bicolar L.) germplasm. Indian J. Plant Genet. Resour. 2020, 33, 295–299. [Google Scholar] [CrossRef]
- Yevu, M.; Onumah, E.E. Profit efficiency of layer production in Ghana. Sustain. Futures 2021, 3, 100057. [Google Scholar] [CrossRef]
- Paramesh, V.; Ravisankar, N.; Behera, U.; Arunachalam, V.; Kumar, P.; Solomon Rajkumar, R.; Dhar Misra, S.; Mohan Kumar, R.; Prusty, A.; Jacob, D. Integrated farming system approaches to achieve food and nutritional security for enhancing profitability, employment, and climate resilience in India. Food Energy Secur. 2022, 11, e321. [Google Scholar] [CrossRef]
- Beshir, H.; Emana, B.; Kassa, B.; Haji, J. Economic efficiency of mixed crop-livestock production system in the north eastern highlands of Ethiopia: The stochastic frontier approach. J. Dev. Agric. Econ. 2012, 1, 10–20. [Google Scholar]


Disclaimer/Publisher’s Note: The statements, opinions and data contained in all publications are solely those of the individual author(s) and contributor(s) and not of MDPI and/or the editor(s). MDPI and/or the editor(s) disclaim responsibility for any injury to people or property resulting from any ideas, methods, instructions or products referred to in the content. |
© 2023 by the authors. Licensee MDPI, Basel, Switzerland. This article is an open access article distributed under the terms and conditions of the Creative Commons Attribution (CC BY) license (https://creativecommons.org/licenses/by/4.0/).