Abstract
Based on the perspective of regional resource mismatch, we explore the impact of the China Railway Express (CRE) opening by applying the difference-in-difference method (DID). The study found that the CRE has aggravated the degree of regional resource misallocation, and this conclusion was still valid after robustness tests. The heterogeneity analysis shows that the role of CRE in the western region and large-scale urban resource mismatch is more obvious. In terms of impact mechanism, the large subsidies and disorderly competition of local governments have a negative impact on the market-oriented normal operation of CRE, which is an important mechanism to aggravate the degree of regional resource mismatch. Therefore, in order to alleviate the policy impact of CRE on regional resource misallocation and improve the quality of the development of the CRE, the state, local governments, enterprises, and other forces should work together to establish a benign interaction between the government and the market.
1. Introduction
According to the China Railway Express Construction and Development Plan (2016–2020), China Railway Express (CRE) is defined as an international intermodal train for transporting containers and other railways running in China, Europe, and countries along “the Belt and Road” with a fixed number of trains, fixed lines, schedules and full running time. Year 2023 marks the 10th anniversary of “the Belt and Road” initiative. As a demonstration project of “the Belt and Road”, after decades of accumulation, the CRE is playing an increasingly important role in international trade. In terms of the scale of operations, the number of CRE operations increased from 17 in the first year of 2011 to 16,000 at the end of 2022, showing a super-rapid development trend; in terms of promoting China–EU economic and trade exchanges, the Chinese government has vigorously developed China–EU bilateral economic and trade exchanges (as shown in Figure 1). In recent years, CRE’s transportation capacity has been continuously improved. In 2018, the transportation of goods was less than one million TEUs, only 541,000 TEUs, but in 2022, the index was as high as 6.04 million TEUs, achieving leapfrog growth. In terms of connectivity with European countries and cities, by the end of 2022, CRE’s network operation range will support the connectivity of 108 domestic cities and 208 cities, effectively expanding the “circle of friends” of the China–EU trade.
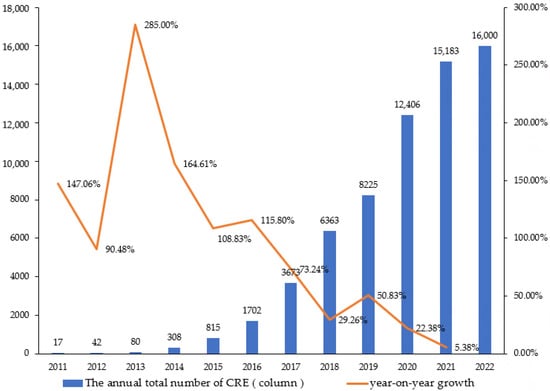
Figure 1.
Changes in the number and growth rate of CRE.
There is no doubt that CRE has made many remarkable achievements since its opening. However, it must also be noted that with the rapid development of CRE, the problems of excessive subsidies, disorderly competition, and “heavy quantity and light quality” of local governments are more serious [1]. In order to promote the rapid development of CRE, local governments have introduced preferential policies for a large number of subsidies, which not only enhances the dependence of enterprises [2], but also aggravates the vicious game between local governments to seize the supply of goods and increase the number of CRE issued by means of empty containers. Although the Ministry of Finance required local governments to reduce the subsidy standards of CRE in a certain proportion year by year to promote the market-oriented development of CRE as early as 2018, due to the lack of supervision mechanism, many regions only changed the means of subsidies, and the phenomenon of unreasonable subsidies is still widespread. Disorderly competition among regions, fragmented, and blind competition for supply have led to low resource utilization efficiency and a waste of a large amount of capacity [3,4]. This not only increases the government’s financial burden, but also may lead to market distortion and resource mismatch [5], which seriously restricts the high-quality development of CRE. Therefore, from the perspective of regional resource mismatch, this paper uses the difference-in-difference method to examine the impact of the opening of China–Europe trains, and tries to explore the answers to the following questions:
- (1)
- Will the opening of the China Railway Express affect the degree of regional resource misallocation?
- (2)
- If there is a significant relationship between China Railway Express and regional resource misallocation, what is the specific transmission mechanism? Does it have different effects on cities of different locations and sizes in China?
The answers to the above questions can further clarify the future development direction of the China Railway Express, and it is of great theoretical and practical significance for promoting the sustainable and healthy operation of CRE and accelerating the interconnection of infrastructure and international trade.
This paper may provide marginal contributions in the following areas compared to existing research: (1) From the perspective of regional resource mismatch, this paper expands the research perspective of the impact effect of CRE opening and enriches the research literature on CRE and resource mismatch to a certain extent. (2) It analyzes the theoretical basis of the impact of the opening of the CRE on regional resource misallocation and its transmission mechanism based on the subsidy effect and competition effect from the two levels of enterprises and cities, and deepens the understanding of the policy effect of “the Belt and Road” connectivity and regional resource allocation. (3) A heterogeneity analysis provides a certain practical value for different regions and cities of different sizes to further optimize the construction system of CRE, and effectively promotes the healthy development of CRE and alleviates regional resource mismatch.
The rest of this article is as follows. Section 2 and Section 3 are the literature review and transmission mechanisms discussion. Section 4 is the model setting and variable selection. In Section 5, we conducted an empirical analysis, and based on this, we carried out a robustness test, and then carried out a heterogeneity analysis and mechanism analysis. The conclusions and implications are given in Section 6.
2. Literature Review
By combing the existing research results of academic circles at home and abroad, the literature related to this paper mainly involves the following two categories.
One is to discuss the connotation, measurement, causes, and solutions of resource misallocation. From the perspective of resource allocation, resource “mismatch” is proposed relative to the “effective allocation” of resources. A perfectly competitive market will promote the optimal allocation of resources, and the configuration results that deviate from the competition will lead to resource mismatch [6]. Specifically, in an economy of complete information and complete competition, all factors of production can flow freely. When the market finally reaches a competitive equilibrium, the allocation of production factors and output reaches Pareto optimality. However, when there are frictions and obstacles that affect the free flow of factors, the factor market will be distorted, and the factors of production will flow from more efficient enterprises to less efficient enterprises. The allocation of resources deviates from the Pareto optimal state, which in turn causes the efficiency of resource allocation and the loss of output. At this time, a resource mismatch will occur.
There is no uniform standard for the measurement of resource mismatch in academia. According to the Hsieh and Klenow model (HK model) [7], under the assumption of convexity of production technology, when the optimal allocation of resources is achieved, the marginal output value of factor inputs is equal among enterprises. However, economic distortions caused by incomplete information, imperfect market, and government intervention will lead to differences in the marginal output of factor input among different enterprises. Production factors flow from enterprises with high marginal returns to enterprises with low marginal returns. At this time, the allocation of resources deviates from the Pareto optimal level. Therefore, the dispersion degree of the marginal output value of factors among enterprises can be used to measure resource misallocation. At present, this method is widely recognized by the academic community. In recent years, many scholars have used the HK model to measure resource misallocation at the macro level by using the productivity distribution dispersion at the micro level [8,9,10,11,12]. On this basis, some scholars conducted a comparative analysis of the degree of resource misallocation among different countries [13,14]. In terms of the causes of resource misallocation, the existing literature believes that the interaction of various factors in economic activities leads to the result of resource misallocation [15]. Different scholars have conducted a lot of research on this based on different dimensions. At the regional level, some scholars have found that government intervention and administrative behavior are often one of the main drivers among various factors that deviate from competition [16]. Market segmentation, government corruption, and financial friction may be important sources of increased resource misallocation [17,18,19]. At the industry level, previous research has shown that financial subsidies and administrative market entry barriers distort the allocation of resources within the industry, while labor mobility controls and financial repression were found to have a negative impact on inter-industry resource misallocation [16]. At the enterprise level, the current mainstream view is that lower market concentration, greater customs barriers, and stronger political connections significantly aggravate the degree of corporate resource mismatch [20,21,22]. Underdeveloped geographical markets can also hinder factor mobility, which in turn affects factor prices and leads to improper resource allocation [23]. Some scholars try to explore ways to effectively alleviate resource misallocation by examining the mechanism of correcting distortions. Specifically, existing studies have found that industrial intelligence, fiscal incentive policies, and digital development have a significant improvement effect on resource misallocation [24,25,26], and based on these, suggestions for optimizing resource allocation are proposed.
The other type of literature focuses on the economic and trade impact of the opening of CRE. As a flagship project and iconic brand to jointly build the Belt and Road, the relevant research results of CRE have become increasingly fruitful in recent years. Many scholars have conducted policy evaluations on CRE from different perspectives and levels, and unanimously concluded that the opening of CRE has a positive effect. Specifically, CRE has unique comparative advantages in terms of transportation time and environmental pollution [27]. It can improve the environmental efficiency of relevant cities [28], significantly reduce the cost of enterprises participating in international trade [29], and make the region better connect with other regions or countries [30]. At the same time, CRE has improved the level of urban innovation [31], strengthened the learning effect, competition effect, and imitation effect between regions [32], and forced domestic enterprises to carry out technological innovation [29], attracting more enterprises to enter [33], promoting the upgrading of industrial structure [32], which contribute to the improvement of productivity at the enterprise level and the city level [34,35], and then provide conditions for high-quality economic development [36]. However, due to the fact that the competitiveness of CRE in terms of operating price and transportation timeliness is always inferior to that of sea transportation, CRE was basically in a state of loss in the early stage of operation. Thus, the government attempted to intervene through preferential policies such as subsidies to cultivate the normal operation mechanism of CRE [2].
Studies have shown that when the market mechanism is not perfect, government intervention may be conducive to the realization of optimal allocation of resources to a certain extent, but it will inevitably lead to efficiency distortion, which will lead to resource mismatch [37]. For a long time, the government’s strong support has played a positive role in promoting the rapid development of CRE [38]. Today, the success of CRE depends largely on the large subsidies of the Chinese government [39], which shows that its political effect is significant. However, at the same time, the distorting effect of subsidies on transport prices may also have negative social effects: excessive government intervention restricts the functioning of the market-oriented operation mechanism, making the CRE market fail to operate in an optimal state. This deviation from the competitive equilibrium has caused social welfare losses and serious resource mismatch problems [40].
It Is not difficult to find that the current literature on CRE and resource mismatch is not uncommon, but the relevant research on CRE mainly focuses on the economic and trade effects of the opening of CRE. Most of the research on resource mismatch was the analysis of the current situation and influencing factors of resource mismatch, and few studies examined the impact of the opening of CRE from the perspective of resource mismatch. In view of this, this paper attempts to use the DID method to explore the relationship between CRE and regional resource misallocation, in order to provide reference suggestions for the sustainable development of CRE and how to make better use of CRE to promote local high-quality development.
3. Transmission Mechanisms Discussion
CRE is a strategic task supported and developed by local governments, aiming at promoting the development of foreign trade and logistics industry, opening up the global supply chain, and achieving complementary advantages. With the support of policies, CRE has developed rapidly. However, with the continuous growth of CRE traffic in recent years, a series of problems brought about by government intervention have gradually emerged [41].
On the one hand, CRE in various regions generally relies on subsidies to balance profits and losses, resulting in the emergence of “abandoning sea transport and choosing rail transport” and other phenomena that violate the general rules of market transportation in the Yangtze River Delta and the Pearl River Delta [42], wasted a lot of logistics resources, disrupted the normal market order, and also caused a certain negative impact on social welfare [40]. At the beginning of CRE operation, due to the high operating cost, the development was greatly limited. In order to promote the rapid development of CRE, local governments have introduced preferential policies for a large number of subsidies, thus ensuring the normal operation of CRE. From the local government’s point of view, the implementation of the CRE project can not only bring employment, taxation, and economic growth to the local population, but also become a ‘stepping stone’ to the national policy. Therefore, in pursuit of GDP, many places have actively promoted the CRE, giving export enterprises many subsidies and preferential policies. However, in recent years, the government’s unreasonable subsidies to CRE have led to excessive government participation in the operation of CRE. Some companies in a loss-making state even made profits after receiving subsidies, which may enable low-productivity enterprises that should have withdrawn from the market to continue to survive. The dependence of enterprises has increased, and the phenomenon of ‘subsidized prosperity and non-subsidized death’ has emerged [43]. Although the Ministry of Finance asked local governments to implement the “retreat slope” subsidy policy in 2018 to promote the market-oriented development of CRE, in order to form the advantages of CRE operation, various localities have made the actual subsidy far exceed the slope subsidy standard through various methods such as land transfer, capital injection, station subsidy or tax relief, and provincial and municipal policies to support CRE. The problem of unreasonable subsidies still exists. This not only increases the financial burden of the government, but also may lead to market distortion and resource mismatch [5], which seriously restricts the high-quality development of CRE.
On the other hand, in order to increase the volume of local trains, different regions work in their own ways and collect goods separately, resulting in frequent occurrences of empty containers and goods backflow in CRE. The competition between local governments brought about by narrow local interests has led some trains to break away from the positioning of basic transportation functions and become one of the obstacles to the long-term sustainable development of CRE [44]. Since the opening of CRE in 2011, the scale of operation has continued to grow rapidly for more than ten years, and the goal of “5000 trains per year” determined by the CRE Construction and Development Plan (2016–2020) has been achieved two years in advance. However, behind the surge in numbers is competition between local governments brought about by narrow local interests. In the context of local governments pursuing political dividends, the CRE that originally emerged in inland cities to promote trade and enhance logistics has gradually evolved into a vicious game of increasing the number of empty containers and blindly seizing supplies. In order to obtain the top position in the number list of CRE, the waste of operating resources is even increased. For example, the Chongqing Rail Express and Chengdu Rail Express returning from Germany were not fully loaded, and the optimal solution should be to merge the goods first and then repack them after returning home. However, in the case of the ‘number of trains’ incentive, the two places were separated. There was no mutual cooperation, saving resources, reducing costs enthusiasm, the locals only considered their own interests and increased the number of local trains blindly, still choosing to operate separately, which not only reduces the operational efficiency of CRE, but also forms a lot of idle and waste of resources. In addition, there is disorderly competition on the train lines. In the current CRE, there are serious problems of similarity or duplication in many trains from different regions of China to the same country or region in Europe [45]. Moreover, many cities have opened CRE in some provinces. It is common for cities to compete for starting points, fulcrums, and hubs, which lead to excessive shifts and scattered transport capacity, aggravating the problems of high no-load rate of CRE, wasting of resources, increasing of logistics costs and difficulty of foreign negotiations, and distorting the general law of market resource allocation to a certain extent. It has a negative impact on the market-oriented normal operation of CRE [1]. The transmission mechanisms are shown in Figure 2.
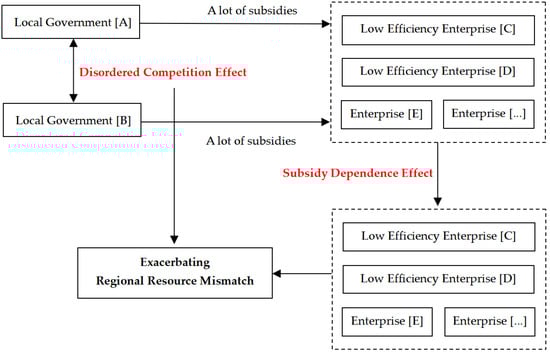
Figure 2.
Transmission Mechanisms (Taking two regions as examples).
Based on the above analysis, the author puts forward the following research hypotheses:
H1.
The opening of China Railway Express has aggravated the degree of regional resource mismatch.
H2.
China Railway Express enhances enterprise dependence through subsidy effect, and competition effect distorts market resource allocation, thus affecting regional resource mismatch.
4. Model Specification and Data
As a major achievement of the Belt and Road construction, the operation of the CRE is determined by national policies, and local governments only act as policy implementers. In other words, the choice of CRE cities is relatively exogenous, which provides a good condition for us to adopt the double difference method to empirically test the impact of CRE on resource mismatch. Taking into account the availability of data and the adjustment of administrative divisions in some cities during the sample period, the sample cities used in the empirical analysis finally totaled 221 cities.
When using the difference-in-difference method, the determination of the start time of the experimental group, the control group and the policy shock is the key. This paper sets the cities that have not passed the CRE and the years before the opening of CRE as the control group. The specific empirical model is as follows:
Among them, the subscript represents the city, represents the time, and represents the degree of resource misallocation of city in year . denotes the dummy variable of the experimental group, which is 1 if the region is the city that opened the CRE, otherwise it is 0. represents the time dummy variable, which is 0 before the opening of the CRE and 1 after the opening. is the mechanism variable, is the control variable, and are the regional fixed effect and time fixed effect respectively, and is the random error term.
Based on the data of Chinese listed companies and prefecture-level cities from 2009 to 2019, this paper studies the impact of the opening of CRE on regional resource mismatch. The enterprise-level data comes from the CSMAR database, and the city-level data comes from the China City Statistical Yearbook over the years. The information such as the opening city and opening time of CRE is manually sorted out according to the public information such as the website of China Railway Container Transportation Co., Ltd. (Beijing, China) and the local railway bureau.
The explained variable of this paper is regional resource misallocation. The construction method of this variable is as follows: firstly, the total factor productivity (TFP) of listed companies in various regions from 2009 to 2019 is calculated by semi-parametric LP method. The LP method is widely used in the calculation of enterprise productivity because it uses intermediate input as a proxy variable to effectively overcome the problem of sample discarding due to zero investment and the simultaneous equation problem [46]. Secondly, drawing on the practice of Bai et al. [46], the standard deviation of the total factor productivity distribution of enterprises in the region is used to describe the degree of resource mismatch. The economic meaning is that if there is no distortion of resource allocation, production factors will flow freely from low-productivity enterprises to high-productivity enterprises in order to obtain higher returns. High-productivity enterprises will merge with low-productivity enterprises or squeeze the latter out of the market. In an ideal situation, the TFP of all enterprises should converge. The greater the difference in TFP levels between enterprises, that is, the higher the value of the index, the more serious the distortion of resource allocation [47].
In order to reduce the influence of other unobserved factors on the regression results, this paper selects the following control variables with reference to the existing research [5]:
- (1)
- Economic development level (lnpcgdp).
Some scholars have pointed out that economic development can indirectly affect resource allocation by affecting enterprise productivity or enterprise scale, and believe that there is a positive correlation between economic growth and the rationality of resource allocation [48]. Therefore, this paper selects the level of economic development as one of the control variables, using per capita GDP to measure its size.
- (2)
- Infrastructure construction level (lninfra).
Many scholars have shown that infrastructure construction will have an impact on resource allocation [49,50]. Based on the cross-regional nature of transportation infrastructure and resource factor flow, some scholars have pointed out that the difference in infrastructure construction is one of the internal causes of inter-regional resource misallocation [51]. Therefore, this paper incorporates the level of infrastructure construction into the control variable, and uses the per capita urban road area to represent its size.
- (3)
- Human capital level (lnhumcap).
As one of the important input factors, human capital plays a decisive role in the size of total factor productivity, which affects the measurement of resource mismatch in this paper. This paper uses the level of per capita education expenditure to represent the level of human capital.
- (4)
- Financial development level (finance).
As early as 2005, Levine studied the mechanism of financial development promoting economic growth from a macro perspective by mobilizing savings, promoting investment and improving the efficiency of resource allocation [52]. It can be seen that financial development can have a significant impact on resource mismatch. This paper uses the ratio of total deposits and loans of financial institutions to GDP to represent the level of financial development.
- (5)
- Informatization level (lninform).
The continuous development of information technology has profoundly affected China’s economic operation mode and individual economic behavior, penetrated into various aspects such as resource circulation, labor mobility, and international trade, and has become an important means of allocating resources. In this paper, the total amount of post and telecommunications business per capita is used to represent the level of informatization.
- (6)
- Government expenditure level (govexp).
When the government intervenes in the market unreasonably, the market will not be able to freely withdraw inefficient enterprises, and high-efficiency enterprises will not be able to obtain more factor resources, thus aggravating the distortion effect of resource allocation [53]. Therefore, this paper uses the ratio of government fiscal expenditure to GDP to represent the level of government expenditure to reflect the degree of government intervention in the market.
- (7)
- Industrial structure (industry).
Liao and Zhang pointed out in their research that the problem of industrial structure will lead to the waste of a large number of factor resources and the inefficiency of resource allocation [48], thus further aggravating the degree of resource misallocation. This paper draws on the practice of Fang and Zhao [5], and constructs the corresponding coefficient to measure the industrial structure. The specific calculation method is: the proportion of the three industries in the regional GDP is given one, two, and three times respectively, and then the sum is obtained.
In addition, in order to avoid the problem of heteroscedasticity caused by excessive numerical difference, this paper takes the natural logarithm of some variables with larger values. At the same time, all continuous variables are tailed by 1% quantile to reduce the influence of possible outliers. The descriptive statistical results of variables are shown in Table 1.

Table 1.
Descriptive statistics of variables.
5. Results
5.1. DID Estimation
This paper regards the launch of CRE as a quasi-natural experiment, and uses the DID method to empirically test the impact of CRE on resource misallocation. The results are shown in Table 2. Columns (1) and (2) report the regression results of only controlling regional fixed effects and year fixed effects respectively. Column (3) reports the regression results of controlling both regional fixed effects and year fixed effects. Column (4) reports the regression results after adding control variables on the basis of Column (3). It can be seen from Table 2 that the coefficients of the core explanatory variables of all columns are positive and significant at the 1% level, whether or not the control variables are added. At the same time, the R-squared after adding the control variable is greater than the R-squared without adding the control variable, and the R-squared of the two-way fixed effect is greater than the R-squared without introducing the two-way fixed effect, that is, adding the control variable and introducing the two-way fixed effect can improve the fitting effect, which shows that the introduced control variables are all important variables affecting regional resource misallocation. In summary, the coefficients obtained in the multi-period DID regression results of model (4) with control variables and two-way fixed effects can better reflect the impact of CRE on regional resource mismatch. Therefore, it can be preliminarily determined from the results that the opening of CRE has aggravated regional resource mismatch to a certain extent.
Table 2.
The impact of the opening of CRE.
5.2. Robustness Test
5.2.1. Parallel Trend Test
The multi-period DID method requires the experimental group and the control group to have the same growth trend before the implementation of the policy, that is, to meet the parallel trend conditions. In order to test this condition, this paper draws on the research results of Wang and Ge [54], and multiplies the dummy variables of the current and five periods before and after the opening of the CRE with the dummy variables of the experimental group as the core explanatory variables for regression. As shown in Figure 3, the regression coefficients of the core explanatory variables in the current and previous periods of the policy are not significant, indicating that the experimental group and the control group have the same change trend before the opening of the CRE, basically meeting the parallel trend hypothesis. In addition, the regression coefficient after the implementation of the policy in Figure 3 shows a significant upward trend, which reflects that the impact of CRE on regional resource misallocation has certain long-term and stability, and also shows that this effect does not appear immediately.
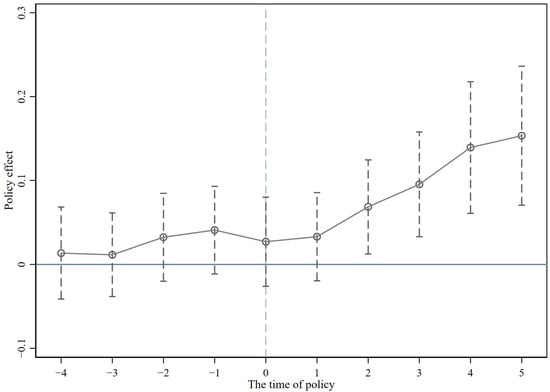
Figure 3.
The result of the parallel trend test.
5.2.2. Placebo Test
Since some unobservable missing variables cannot be controlled as fixed effects, a placebo test is needed to examine whether the changes in the samples after the implementation of the policy are affected by other random factors. Drawing on the practice of Jin and Zhang [55], we randomly selected a year in the sample period as the policy time of the sample object by means of fictitious policy time, and based on this counterfactual sample, we carried out multi-period double difference regression, repeated the above process 500 times, and obtained the coefficient estimation results of the random sample. As shown in Figure 4, the kernel density distribution map basically shows a normal distribution. The estimation coefficients of the dummy variables of the random sample policy are mostly distributed near 0, and the p value is greater than 0.1, indicating that the estimation results of the random sample are not significant and there is a big difference between the estimation results of the real sample. There is no significant estimation error caused by missing variables. The main conclusions of this paper have good robustness.
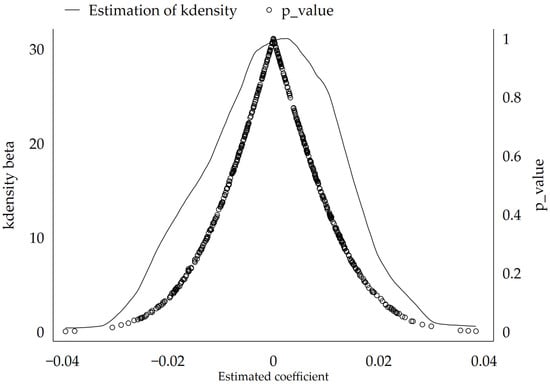
Figure 4.
The result of the placebo test.
5.2.3. Replacement of Proxy Variables for Resource Misallocation
In order to make the results of this paper more robust, we have changed the measurement of resource misallocation. Referring to the research results of Bai et al. [46], we use the ratio of the productivity of 90% quantile enterprises to the productivity of 10% quantile enterprises in a region as an indicator to measure the degree of regional resource misallocation, and re-regression of Equation (1). The results are shown in Table 3 column (1). Similar to the results of Table 2, the regression coefficient of the interaction term Treat × Post is significantly positive. The above results show that the CRE will have a negative impact on the allocation of regional resources, and still support the previous conclusions.
Table 3.
The results of robustness checks.
5.2.4. PSM-DID
This paper uses the PSM-DID model to alleviate the endogenous problems caused by sample selection errors. Since the CRE policy is implemented in stages, this paper takes the cities that opened CRE during the sample survey period as the control group, and uses the nearest neighbor matching, kernel matching, and radius matching methods to test the robustness of the control group. The regression results are shown in Table 3 columns (2)–(4). It is not difficult to see from the table that the coefficients of policy variables are significant at the 1% significance level, and different matching methods have strong robustness, which further supports the theoretical analysis of this paper.
5.2.5. Sample Sensitivity Test
This section uses two methods to test sample sensitivity. First of all, considering that “the Belt and Road” initiative was proposed in 2013 and formally implemented in 2014, 2014 was used as a policy shock time, and it was multiplied by the experimental group dummy variable as the core explanatory variable for regression. The results of Table 4 column (1) show that the CRE under “the Belt and Road” initiative has a significant positive effect on regional resource mismatch. Secondly, in order to exclude the impact of the Belt and Road Initiative itself on regional resource misallocation, only the samples after 2013 are selected for regression. It can be seen from Column (2) of Table 4 that the core explanatory variables are still significantly positive, that is, the above empirical conclusions are robust.
Table 4.
The results of the sample sensitivity test.
5.3. Heterogeneity Test
The regional characteristics of the study area may have a completely different impact on the effect of the introduction of new policies. Scholars such as Cavallaro et al. have provided strong evidence based on the research on high-speed rail [56]. Their research found that some medium-sized cities along the route have significantly reduced their competitiveness after the implementation of completely isolated high-speed rail projects. Therefore, this section attempts to carry out heterogeneity analysis from both geographical location and city size.
5.3.1. Heterogeneity Test of City Location
Due to the vast territory of China, the different locations of cities may affect the implementation of policies. This paper examines regional differences by setting virtual variables of urban location, and the regression results are shown in Table 5. The results show that only the estimation coefficient of column (3) (western region) is significantly positive at the 99% confidence level, while the estimation coefficients of column (1) (eastern region) and column (2) (central region) are not significant, indicating that compared with the central and eastern cities, the opening of CRE in western cities has a greater impact on regional resource mismatch, which verifies the characteristics of regional heterogeneity in the role of CRE in resource allocation to a certain extent. This may be because most of the cities opened by CRE are located in the western part of China’s inland, and they do not have obvious advantages in the eastern coastal areas in terms of economic foundation and resource endowment, while the underdeveloped geographical market will face poor factor mobility and weak market competition, which is reflected in a higher degree of resource mismatch. At the same time, the local governments of the western inland cities will strongly support the CRE operation for the sake of promoting regional development. In order to promote the rapid development of CRE, these regions often issue more preferential subsidy policies to attract sources of goods and stimulate the growth of the number of CRE, which is more likely to aggravate the mismatch of regional resources.
Table 5.
The results of the heterogeneity test.
5.3.2. Heterogeneity Test of City Size
The above analysis shows that the CRE opening policy will have a significant positive effect on regional resource misallocation, but for cities of different sizes, this effect may be quite different. Some scholars have reached similar conclusions based on the impact of high-speed rail on the trend of regional opportunity differences [57]. In order to verify the difference in city size in the process of resource mismatch in the area affected by the CRE, this paper divides the sample of prefecture-level cities according to the “Notice on Adjusting the Standard of City Size Division” issued by the State Council in 2014, with the permanent population of the urban area as the statistical caliber. The permanent population of 1 million and below is set as small and medium-sized cities (column 4), the permanent population of more than 1 million and less than 5 million is set as large cities (column 5), and the permanent population of more than 5 million is set as mega and mega cities (column 6). From Table 5 column (4) to column (6), it can be seen that the opening of CRE has a significant positive impact on the increase of urban resource mismatch except for small and medium-sized cities, indicating that the opening of CRE is more likely to lead to the increase of resource mismatch in large cities, which is similar to Jiang’s [58] research conclusion on urban administrative level and regional resource mismatch. The reason may be that compared with small and medium-sized cities, big cities have more resources, and a stronger motivation for government intervention, which is reflected in the stronger financial strength, which will give enterprises more advantageous subsidy policies, thus increasing the dependence of enterprises in cities on subsidies. At the same time, in order to win the ranking of the number of CRE, the disorderly competition among cities is more intense, which further causes the distortion of resource allocation.
5.4. Mechanism Test
5.4.1. Subsidy Dependence Effect
The government’s subsidy to CRE was originally intended to promote its better and faster development. However, as local governments continue to increase subsidies to seize resources, excessive government intervention has caused enterprises to have subsidy dependence and disrupted the normal market-oriented operation process of CRE. Based on this, this paper refers to the method of Li et al. [59]. In the treatment group, only enterprises in Yiwu and Suzhou, which have canceled government subsidies, are retained, and all others are used as the control group. The results are shown in Column (1) of Table 6. It can be seen that the Treat×Post coefficient is negative and significant at the level of 5%, indicating that the cancellation of subsidies can effectively alleviate resource mismatch. This reflects the development dilemma of CRE, that is, the government’s subsidy support for CRE aggravates the regional resource mismatch, and also highlights the excessive participation of the government disrupts the market competitiveness of CRE.
Table 6.
The results of the mechanism test.
In addition, we use Equation (2) to further verify the mechanism. Specifically, this paper groups the samples in the city according to the median of the total factor productivity of enterprises in different regions, defines the enterprises below the median as low-efficiency enterprises, and the enterprises above the median as high-efficiency enterprises, and constructs a variable (lowzb) to represent the proportion of low-productivity enterprises. The larger the variable, the higher the survival rate of low-efficiency enterprises in the region, and the interaction term (Treat × Post × lowzb) is constructed to verify whether the subsidy effect affects the effect of resource mismatch in the CRE region by prolonging the exit of low-productivity enterprises from the market. Column (2) of Table 6 shows that the coefficient of the interaction term is significantly positive, which proves that the proportion of high low-productivity enterprises has increased the CRE. Therefore, in the long run, the sustained and healthy operation of CRE requires the orderly withdrawal of government departments and the effective implementation of market regulation.
5.4.2. Disordered Competition Effect
The data of CRE show that the similarity of some routes in the same or adjacent areas is very high, resulting in an increase in the number of departures in the same channel. At present, the Yuxinou Rail Express and Rongou Rail Express on the western line are more coincident with the Zhengou Rail Express station on the middle line, and the competition between the hubs is fierce [58,59]. There are also Xiangou Rail Express and Hanxinou Rail Express on the middle line. The two places are not only close to each other, but also the supply of goods is mainly concentrated in the central and southern regions, and the supply competition is also serious. In view of this, it is similar to the existing literature [59], this paper classifies Chongqing, Chengdu, Zhengzhou, Wuhan and Changsha, which have obvious homogenization of lines, into the treatment group, and the others into the control group. The interaction coefficient of column (3) in Table 6 is significantly positive, reflecting that the blind competition of local governments is not conducive to the optimal allocation of resources in the region.
In addition, the variable crenumber representing the number of CRE is introduced, and Equation (2) is used to verify whether the competition effect is reflected a certain extent by the vicious game of the number of CRE. As shown in column (4) of Table 6, the coefficient of Treat × Post × crenumber is significantly positive, which further indicates that the disorderly competition of blindly increasing the number of CRE will increase the resource mismatch between regions. It can be seen that in order to promote the effective allocation of resources between regions, in the future, all regions should make reasonable plans in the aspects of route layout and the number of operations of CRE in combination with the actual situation, so as to improve the overall operation quality of CRE.
6. Conclusions and Policy Implications
6.1. Conclusions
Based on the perspective of the opening of CRE, this paper analyzes the mechanism and path of government intervention in distorting market resource allocation, and uses the multi-period difference-in-differences method to empirically test the impact of CRE on regional resource misallocation. The study found that: (1) the opening of CRE will aggravate the misallocation of regional resources, and the conclusion is still valid after the robustness test. (2) Heterogeneity analysis shows that from different regions, CRE significantly aggravates the degree of resource misallocation in the western region, but has no significant impact on the eastern and central regions, which may be related to the difference in the distribution of cities and government support. From the perspective of city size, CRE has a more obvious effect on the distortion of resource allocation in large-scale cities, which is mainly affected by regional resource endowment and government intervention motivation. (3) As far as the influence mechanism of the opening of CRE on regional resource misallocation is concerned, a large number of subsidies and disorderly competition of local governments are important mechanisms to aggravate the degree of regional resource misallocation, which is the embodiment of excessive government intervention in the market. (4) Further research finds that at the enterprise level, it may be due to the unreasonable subsidies of local governments that enhance the dependence of enterprises, so that low-productivity enterprises that should have withdrawn from the market can continue to survive; at the city level, it is mainly caused by the disorderly competition between local governments brought about by narrow local interests, which is manifested in the vicious game of the number of lines and lines. This has distorted the general law of market resource allocation to a certain extent and has a negative impact on the normal operation of CRE.
6.2. Policy Implications
The conclusions of this paper have important policy implications for promoting the sustainable and healthy operation of CRE, accelerating the interconnection of infrastructure and international trade, and alleviating regional resource misallocation. First, the relevant departments of the state should further improve the evaluation system of CRE in the future, standardize and improve the subsidy behavior of local governments, and resolutely eliminate the vicious competitive subsidies between local governments to CRE. In this regard, the state should improve the relevant supervision regulations, establish relevant special fund supervision institutions, conduct real-time supervision on the use of funds related to CRE, the operating cost and income of platform enterprises, strictly supervise the subsidy behavior of local governments, improve the utilization efficiency of funds, and standardize the operation of CRE. Second, local governments should take the construction of a unified market and the maintenance of fair competition as the basic principles, thoroughly implement the management policy of subsidies for CRE, gradually dynamically adjust the intensity and timeliness of subsidies for CRE, reduce direct participation, focus on coordinating various types of competition and cooperation, adhere to the market-oriented principle, pay more attention to the market main body status of enterprises, encourage enterprises to participate widely, advocate the cultivation of economic and efficient CRE lines in the market competition of survival of the fittest, and promote the market-oriented operation of CRE. Third, enterprises should correctly understand the significance of CRE subsidies, reduce their dependence on government subsidies, and make good use of the trade advantages of CRE. While strengthening trade with foreign high-tech enterprises, they should actively carry out cooperation and exchanges with domestic excellent enterprises, improve their own production efficiency and market competitiveness through scientific research and innovation, and pursue their own benign growth based on long-term development.
Author Contributions
L.-Y.H. is a full professor of economics. S.L. is a Master’s degree candidate supervised by L.-Y.H. Both authors contributed significantly to the project. L.-Y.H. acquired all the funding support. S.L. calculated the results under L.-Y.H.’s supervision. L.-Y.H. and S.L. analyzed the data, discussed the results, and co-wrote the manuscript. All authors have read and agreed to the published version of the manuscript.
Funding
This work was supported by the National Major Project of the National Social Science Fund of China (Grant No. 20&ZD109).
Institutional Review Board Statement
Not applicable.
Informed Consent Statement
Not applicable.
Data Availability Statement
The data presented in this study are available on request from the corresponding author.
Conflicts of Interest
The authors declare that there are no conflict of interest involved.
References
- Xu, Y.M.; Xing, L.Z.; Dong, X.L. Research on the Trade Routes of CRE under the Belt and Road Initiative. Intertrade 2019, 80–86. Available online: https://www.cnki.net/kcms/doi/10.14114/j.cnki.itrade.2019.02.013.html (accessed on 30 January 2023).
- Li, M.Y.; Wang, B.; Pan, X.J. Design of CR Expres’s Subsidy Slope Strategy under the Background of “One Belt and One Roa”. J. Xi’Univ. Financ. Econ. 2022, 35, 109–120. [Google Scholar]
- Ma, Y.; Shi, X.; Qiu, Y. Hierarchical Multimodal Hub Location with Time Restriction for China Railway (CR) Express Network. IEEE Access 2020, 8, 61395–61404. [Google Scholar] [CrossRef]
- Du, Y.Y.; Zhou, W.Y.; Lian, F. A scheme for passenger service-like back-haul for CRE trains. Transp. Policy 2022, 120, 56–68. [Google Scholar] [CrossRef]
- Fang, H.; Zhao, S.L. Has CR-express Train Improved the Productivity of Export Enterprises—Mechanism Research Based on Mutual Promotion of Dual Circulation. J. Int. Trade 2022, 68–86. Available online: https://www.cnki.net/kcms/doi/10.13510/j.cnki.jit.2022.03.004.html (accessed on 30 January 2023).
- Wang, B.T.; Chen, J.H.; Wang, X.L. Province-Managing-County Reform, Resource Allocation and High-quality Enterprise Development. Res. Econ. Manag. 2021, 42, 73–88. [Google Scholar]
- Hsieh, C.; Klenow, P.J. Misallocation and manufacturing TFP in China and India. Q. J. Econ. 2009, 124, 1403–1448. [Google Scholar] [CrossRef]
- Brandt, L.; Tombe, T.; Zhu, X. Factor market distortionscrosss time, space, and sectors in China. Rev. Econ. Dyn. 2013, 16, 39–58. [Google Scholar] [CrossRef]
- Leon-Ledesma, M.; Christopoulos, D. Misallocation, aaccess to finance, and public credit: Firm-level evidence. Asian Dev. Rev. 2016, 33, 119–143. [Google Scholar] [CrossRef]
- Gopinath, G.; Kalemli-Özcan, S.; Karabarbounis, L.; Villegas-Sanchez, C. Capital allocation and productivity in South Europe. Q. J. Econ. 2017, 132, 1915–1967. [Google Scholar] [CrossRef]
- Wu, Y.; Heerink, N.; Yu, L. Real estate boom and resource misallocation in manufacturing industries: Evidence from China. China Econ. Rev. 2020, 60, 101400. [Google Scholar] [CrossRef]
- Zhang, X.; Zhang, W.; Lee, P.T.W. Importance rankings of nodes in the CRE network under the Belt and Road Initiative. Transp. Res. Part A Policy Pract. 2020, 139, 134–147. [Google Scholar] [CrossRef] [PubMed]
- Gilchrist, S.; Sim, J.W.; Zakrajšek, E. Misallocation and financial market frictions: Some direct evidence from the dispersion in borrowing costs. Rev. Econ. Dyn. 2013, 16, 159–176. [Google Scholar] [CrossRef]
- Kalemli-Ozcan, S.; Sorensen, B. Misallocation, property rightis, and access to finance: Evidence from with in and across Africa. In Africean Successe; University of Chicago Press: Chicago, IL, USA, 2016. [Google Scholar]
- He, L.Y.; Qi, X.F. Resource misallocation and energy-related pollution. Int. J. Environ. Res. Public Health 2021, 18, 5158. [Google Scholar] [CrossRef]
- Han, J.; Zheng, Q.L. How Does Government Intervention Lead to Regional Resource Misallocation—Based on Decomposition of Misallocation within and between Industries. Chin. Ind. Econ. 2014, 69–81. Available online: https://www.cnki.net/kcms/doi/10.19581/j.cnki.ciejournal.2014.11.006.html (accessed on 30 January 2023).
- Bian, Y.; Song, K.; Bai, J. Market segmentation, resource misallocation and environmental pollution. J. Clean. Prod. 2019, 228, 376–387. [Google Scholar] [CrossRef]
- Wang, S.; Zhao, D.; Chen, H. Government corruption, resource misallocation, and ecological efficiency. Energy Econ. 2019, 85, 104573. [Google Scholar] [CrossRef]
- Wang, Y.L.; Lei, X.D.; Yang, F.; Zhao, N. Financial friction, resource misallocation and total factor productivity: Theory and evidence from China. J. Appl. Econ. 2021, 24, 393–408. [Google Scholar] [CrossRef]
- Nguyen, P.T.; Nguyen, M.K. Resource Misallocation of SMEs in Vietnamese Manufacturing Sector. J. Small Bus. Enterp. Dev. 2019, 26, 290–303. [Google Scholar] [CrossRef]
- Fossati, R.; Rachinger, H.; Stivali, M. Extent and potential determinants of resource misallocation: A cross-sectional study for developing countries. World Econ. 2020, 44, 1338–1379. [Google Scholar] [CrossRef]
- González, F.; Prem, M. Losing your dictator: Firms during political transition. J. Econ. Growth 2020, 25, 227–257. [Google Scholar] [CrossRef]
- Deng, Z.Q.; Jiang, N.; Song, S.F.; Pang, R.Z. Misallocation and price distortions: A revenue decomposition of medical service providers in China. China Econ. Rev. 2021, 65, 101574. [Google Scholar] [CrossRef]
- Wang, S.J.; Li, M.Y. Does industrial intelligence improve resource misallocation? An empirical test based on China. Environ. Sci. Pollut. Res. 2022, 29, 77973–77991. [Google Scholar] [CrossRef] [PubMed]
- Xu, J.W.; Kun, L. The impact of incentive policies on foreign direct investment misallocation. J. Interdiscip. Math. 2018, 21, 469–478. [Google Scholar]
- Chen, P. Relationship between the digital economy, resource allocation and corporate carbon emission intensity: New evidence from listed Chinese companies. Environ. Res. Commun. 2022, 4, 075005. [Google Scholar] [CrossRef]
- Wang, Q.Z.; Chen, J.M.; Tseng, M.L.; Luan, H.M.; Ali, M.H. Modelling green multimodal transport route performance with witness simulation software. J. Clean. Prod. 2020, 248, 119245. [Google Scholar] [CrossRef]
- Hu, S.; Wang, A.L.; Du, K.R.; Si, L.L. Can CRE improve environmental efficiency? Evidence from China’s cities. Environ. Impact Assess Rev. 2022, 99, 107005. [Google Scholar] [CrossRef]
- Wang, X.Y.; Bu, L.F. International Export Trade and Enterprise Innovation: Research Based on a Quasi-natural Experiment of “CR Express”. Chin. Ind. Econ. 2019, 80–98. Available online: https://www.cnki.net/kcms/doi/10.19581/j.cnki.ciejournal.2019.10.005.html (accessed on 28 January 2023).
- Zhang, X.J.; Li, Y.S.; Zhao, X.L. Research on the Effect of CR-express on Trade Growth in Inland Regions. J. Financ. Econ. 2019, 45, 97–111. [Google Scholar]
- Fang, H.; Xie, H.P. The Impact of China-Europe Railway Express on Urban Total Factor Productivity. Rev. Econ. Manag. 2022, 38, 38–52. [Google Scholar]
- Li, J.; Min, Y.; Wang, X. Launching the CR Express and Industrial Upgrading: Research Based on a Quasi-natural Experiment of 285 Prefecture-level Cities in China. Ind. Econ. Res. 2021, 69–83. Available online: https://www.cnki.net/kcms/doi/10.13269/j.cnki.ier.2021.03.006.html (accessed on 25 January 2023).
- Fang, X.M.; Lu, Y.X.; Wei, J. The Impact of China Railway Express on the Openness of China’s Urban Trade: Based on the Perspective of the Belt and Road Construction. Int. Econ. Trade Res. 2020, 36, 39–55. [Google Scholar]
- Gu, N.H.; Zhang, R.Z. Can the CR⁃Express Boost the TFP of Manufacturing Enterprises: A Quasi⁃natural Experiment based on the Data of China’s Listed Manufacturing Companies. Soc. Sci. Guangdong 2022, 5–14. Available online: https://www.cnki.net/kcms/doi/10.3969/j.issn.1000-114X.2022.03.001.html (accessed on 25 January 2023).
- Zhang, J.Q.; Gong, E.Z. The Impact of CRE on Total Factor Productivity of Chinese Cities. World. Econ. Stud. 2021, 106–119. Available online: https://www.cnki.net/kcms/doi/10.13516/j.cnki.wes.2021.11.008.html (accessed on 21 January 2023).
- Wei, D.M.; Gu, N.H. International Transport Channel and High-quality Economic Development—Evidence from the Sino-Euro Cargo Railway in Service. J. Int. Trade 2021, 34–48. Available online: https://www.cnki.net/kcms/doi/10.13510/j.cnki.jit.2021.12.001.html (accessed on 28 January 2023).
- Jiang, T.; Sun, K.P.; Nie, H.H. Administrative Rank, Total Factor Productivity and Resource Misallocation in Chinese Cities. Manag. World 2018, 34, 38–50. [Google Scholar]
- Choi, K.S. The Current Status and Challenges of CRE (CRE) as a Key Sustainability Policy Component of the Belt and Road Initiative. Sustainability 2021, 13, 5017. [Google Scholar] [CrossRef]
- Li, S.; Lang, M.; Yu, X.; Zhang, M.; Jiang, M.; Tsai, S.; Wang, C.K.; Bian, F. A Sustainable Transport Competitiveness Analysis of the CRE in the Context of the Belt and Road Initiative. Sustainability 2019, 11, 2896. [Google Scholar] [CrossRef]
- Yang, Z.W. Market Structure, Welfare Analysis and Strategy Selection of CRE. Gov. Stud. 2019, 35, 97–103. [Google Scholar]
- Cheng, Z.L.; Zhao, L.J.; Wang, G.X.; Li, H.Y.; Hu, Q.M. Selection of consolidation center locations for CRE to reduce greenhouse gas emission. J. Clean Prod. 2021, 305, 126872. [Google Scholar] [CrossRef]
- Wang, J.E.; Jing, Y.; Wang, C.J. Study on Better Organization of China-Europe Express Train. Bull. Chin. Acad. Sci. 2017, 32, 370–376. [Google Scholar]
- Xu, Z.Y.; Xia, J.C.; Yuan, H. The Achievement, Problems and Countermeasures of the Construction of China-Europe Freight-Train. Intertrade 2021, 45–51. Available online: https://www.cnki.net/kcms/doi/10.14114/j.cnki.itrade.2021.09.007.html (accessed on 21 January 2023).
- Ma, B. CRE to Europe: Developments, Problems and Solutions. Int. Stud. 2018, 72–86. Available online: https://www.cnki.net/kcms/doi/10.3969/j.issn.0452-8832.2018.06.006.html (accessed on 25 January 2023).
- Ma, Y.T.; Johnson, D.; Wang, J.Y.T.; Shi, X.L. Competition for rail transport services in duopoly market: Case study of China Railway (CR) Express in Chengdu and Chongqing. Res. Transp. Bus. Manag. 2021, 38, 100529. [Google Scholar] [CrossRef]
- Bai, D.B.; Zhang, Y.Y.; Tang, Q.Q. Establishment of Development Zones and Mismatch of Regional Resources: Theoretical Mechanism and Empirical Identification. J. Financ. Econ. 2020, 46, 49–63. [Google Scholar]
- Doms, M.; Bartelsman, E. Understanding Productivity: Lessons from Longitudinal Microdata. J. Econ. Lit. 2000, 38, 569–594. [Google Scholar] [CrossRef]
- Liao, C.W.; Zhang, Z.D. Stable Economic Growth, Industrial Structure Upgradingand Resource Mismatch. Inq. Econ. Issues 2020, 11, 16–26. [Google Scholar]
- Shao, S.; Tian, Z.; Yang, L. High Speed Rail and Urban Seervice Industry Agglomeration: Evidence from China’s Yangtze River Delta Region. J. Transp. Geogr. 2017, 64, 1174–1183. [Google Scholar] [CrossRef]
- Chen, Z.; Haynes, K.E. Impact of high-speed rail on regionaleconomic disparity in China. J. Transp. Geogr. 2017, 65, 80–91. [Google Scholar] [CrossRef]
- Baum-Snow, N.J.V.; Henderson, M.A.; Turner, L. Brandt. Does Investment in National Highways Help or Hurt Hinterland City Growth? J. Urban Econ. 2020, 115, 103124. [Google Scholar] [CrossRef]
- Levine, R. Finance and growth: Theory and evidence. Handb. Econ. Growth 2005, 1, 865–934. [Google Scholar]
- Restuccia, D.; Rogerson, R. Misallocation and productivity. Rev. Econ. Dyn. 2013, 16, 1–10. [Google Scholar] [CrossRef]
- Wang, F.; Ge, X. Can Low-carbon Transition Impact Employment—Empirical Evidence from Low-carbon City Pilot Policy. Chin. Ind. Econ. 2022, 81–99. Available online: https://www.cnki.net/kcms/doi/10.19581/j.cnki.ciejournal.2022.05.004.html (accessed on 21 January 2023).
- Jin, X.Y.; Zhang, W.F. Artificial Intelligence and Firms’ Export Expansion: The Technological Mark of Trade Revolution. J. Int. Trade 2022, 70–87. Available online: https://www.cnki.net/kcms/doi/10.13510/j.cnki.jit.2022.09.010.html (accessed on 21 January 2023).
- Cavallaro, F.; Bruzzone, F.; Nocera, S. Effects high-speed regional accessibility. Transportation 2022, 1–37. [Google Scholar] [CrossRef]
- Bruzzone, F.; Cavallaro, F.; Nocera, S. The Effects of High-Speed Rail on Accessibility and Equity: Evidence from the Turin-Lyon Case-Study. Socioecon. Plann. Sci. 2023, 85, 101379. [Google Scholar] [CrossRef]
- Jiang, Y.; Sheu, J.B.; Peng, Z.; Yu, B. Hinterland patterns of China Railway (CR) express in China under the Belt and Road Initiative: A preliminary analysis. Transp. Res. Part E Logist. Transp. Rev. 2018, 119, 189–201. [Google Scholar] [CrossRef]
- Li, J.; Min, Y.; Wang, X. Research on the Impact of CR-express Train on City Innovation: On the Innovation Effect of CR-express Train under the policy dilemma. World Econ. Stud. 2020, 57–74. Available online: https://www.cnki.net/kcms/doi/10.13516/j.cnki.wes.2020.11.005.html (accessed on 21 January 2023).


Disclaimer/Publisher’s Note: The statements, opinions and data contained in all publications are solely those of the individual author(s) and contributor(s) and not of MDPI and/or the editor(s). MDPI and/or the editor(s) disclaim responsibility for any injury to people or property resulting from any ideas, methods, instructions or products referred to in the content. |
© 2023 by the authors. Licensee MDPI, Basel, Switzerland. This article is an open access article distributed under the terms and conditions of the Creative Commons Attribution (CC BY) license (https://creativecommons.org/licenses/by/4.0/).