_Li.png)
The Impact of Fast-Food Density on Obesity during the COVID-19 Lockdown in the UK: A Multi-Timepoint Study on British Cohort Data


Abstract
1. Introduction
2. Literature Review
3. Data and Methodology
3.1. Obesity and Other Health Data
3.2. Food Environment and Covariates
- (1)
- Fast-Food Proportion (FFP): The first food environment measure was fast-food proportion. This was calculated by dividing the counts of fast-food outlets and fish-and-chips stores over all outlet types. These include bakeries, butchers, cafes, confectioners, convenience stores, delicatessens, fishmongers, grocers, organic stores, restaurants and supermarkets. This variable is the main explanatory variable in the model.
- (2)
- Retail, Food, Environment Index (RFEI): In addition, an RFEI was introduced. Originally proposed by Babey et al. (2008) [54] and modified by Cooksey-Stowers et al. (2017) [8], RFEI can be defined as the ratio of the number of fast-food outlets, fish-and-chips stores, confectioners and convenience stores to the number of supermarkets, grocers and organic stores. These classifications broadly fall into the unhealthy and the healthy outlets. While fast-food outlets, confectioners and the rest sell predominantly unhealthy, energy-dense foods, supermarkets, grocers and organic stores are considered to sell many healthy food options.
3.3. Statistical Analysis
4. Results
4.1. Descriptive Statistics
4.2. Fast Food and Obesity
5. Discussion
5.1. Summary
5.2. Implications
5.3. Limitations, Recommendations and Future Directions
6. Conclusions
Author Contributions
Funding
Institutional Review Board Statement
Informed Consent Statement
Data Availability Statement
Conflicts of Interest
References
- World Health Organization (WHO). Obesity, 2021. Available online: https://www.who.int/news-room/facts-in-pictures/detail/6-facts-on-obesity (accessed on 19 December 2022).
- National Health Service. Statistics on Obesity, Physical Activity and Diet, England, 2020. Available online: https://digital.nhs.uk/data-and-information/publications/statistical/statistics-on-obesity-physical-activity-and-diet/england-2020/part-3-adult-obesity-copy#overweight-and-obesity-prevalence (accessed on 19 December 2022).
- National Health Service. Obesity, 2019. Available online: https://www.nhs.uk/conditions/obesity/ (accessed on 19 December 2022).
- Public Health England. Health Matters: Obesity and the Food Environment, 2017. Available online: https://www.gov.uk/government/publications/health-matters-obesity-and-the-food-environment/health-matters-obesity-and-the-food-environment--2 (accessed on 4 December 2022).
- Hummel, E.; Wittig, F.; Schneider, K.; Gebhardt, N.; Hoffmann, I. The complex interaction of causing and resulting factors of overweight/obesity. Increasing the under-standing of the problem and deducing requirements for prevention strategies. Ernaehrungs Umsch. Int. 2013, 60, 2–7. [Google Scholar]
- Centers for Disease Control and Prevention. General Food Environment Resources 2014. Available online: https://www.cdc.gov/healthyplaces/healthtopics/healthyfood/general.htm# (accessed on 24 February 2022).
- Corfe, S. What Are the Barriers to Eating Healthily in the UK. Social Market Foundation, 2018. Available online: http://www.smf.co.uk/publications/barriers-eating-healthily-uk (accessed on 2 March 2022).
- Cooksey-Stowers, K.; Schwartz, M.B.; Brownell, K.D. Food swamps predict obesity rates better than food deserts in the United States. Int. J. Env. Res. Public Health 2017, 14, 1366. [Google Scholar] [CrossRef] [PubMed]
- Swinburn, B.; Egger, G.; Raza, F. Dissecting obesogenic environments: The development and application of a framework for identifying and prioritizing environmental interventions for obesity. Prev. Med. 1999, 29, 563–570. [Google Scholar] [CrossRef]
- Maddock, J. The relationship between obesity and the prevalence of fast food restaurants: State-level analysis. Am. J. Health Promot. 2004, 19, 137–143. [Google Scholar] [CrossRef]
- Prentice, A.M.; Jebb, S.A. Fast foods, energy density and obesity: A possible mechanistic link. Obes. Rev. 2003, 4, 187–194. [Google Scholar] [CrossRef]
- Parmenter, K.; Waller, J.; Wardle, J. Demographic variation in nutrition knowledge in England. Health Educ. Res. 2000, 15, 163–174. [Google Scholar] [CrossRef]
- Wardle, J.; Parmenter, K.; Waller, J. Nutrition knowledge and food intake. Appetite 2000, 34, 269–275. [Google Scholar] [CrossRef]
- Burgoine, T.; Forouhi, N.G.; Griffin, S.J.; Wareham, N.J.; Monsivais, P. Associations between exposure to takeaway food outlets, takeaway food consumption, and body weight in Cambridgeshire, UK: Population based, cross sectional study. BMJ 2014, 348, g1464. [Google Scholar] [CrossRef] [PubMed]
- Moore, L.V.; Diez Roux, A.V. Associations of neighborhood characteristics with the location and type of food stores. Am. J. Public Health 2006, 96, 325–331. [Google Scholar] [CrossRef]
- Maguire, E.R.; Burgoine, T.; Monsivais, P. Area deprivation and the food environment over time: A repeated cross-sectional study on takeaway outlet density and supermarket presence in Norfolk, UK, 1990–2008. Health Place 2015, 33, 42–147. [Google Scholar] [CrossRef]
- Ellaway, A.; Anderson, A.; Macintyre, S. Does area of residence affect body size and shape? Int. J. Obes. 1997, 21, 304–308. [Google Scholar] [CrossRef] [PubMed]
- World Health Organization (WHO). Obesity and Overweight, 2022. Available online: https://www.who.int/news-room/fact-sheets/detail/obesity-and-overweight (accessed on 4 March 2023).
- Wrigley, N. ‘Food deserts’ in British cities: Policy context and research priorities. Urban Stud. 2002, 39, 2029–2040. [Google Scholar] [CrossRef]
- Cummins, S.; Macintyre, S. The location of food stores in urban areas: A case study in Glasgow. Br. Food J. 1999, 101, 545–553. [Google Scholar] [CrossRef]
- Donkin, A.J.; Dowler, E.A.; Stevenson, S.J.; Turner, S.A. Mapping access to food in a deprived area: The development of price and availability indices. Public Health Nutr. 2000, 3, 31–38. [Google Scholar] [CrossRef] [PubMed]
- Procter, K.L.; Clarke, G.P.; Ransley, J.K.; Cade, J. Micro-level analysis of childhood obesity, diet, physical activity, residential socio-economic and social capital variables: Where are the obesogenic environments in Leeds? Area 2008, 40, 323–340. [Google Scholar] [CrossRef]
- Simmons, D.; McKenzie, A.; Eaton, S.; Cox, N.; Khan, M.A.; Shaw, J.; Zimmet, P. Choice and availability of takeaway and restaurant food is not related to the prevalence of adult obesity in rural communities in Australia. Int. J. Obes. 2005, 29, 703–710. [Google Scholar] [CrossRef] [PubMed]
- Morland, K.; Roux, A.V.D.; Wing, S. Supermarkets, other food stores, and obesity: The atherosclerosis risk in communities study. Am. J. Prev. Med. 2006, 30, 333–339. [Google Scholar] [CrossRef]
- Li, F.; Harmer, P.; Cardinal, B.J.; Bosworth, M.; Johnson-Shelton, D. Obesity and the built environment: Does the density of neighborhood fast food outlets matter? Am. J. Health Promot. 2009, 23, 203–209. [Google Scholar] [CrossRef]
- Farrington, D.P. Longitudinal research strategies: Advantages, problems, and prospects. J. Am. Acad. Child Adolesc. Psychiatry 1991, 30, 369–374. [Google Scholar] [CrossRef]
- Sturm, R.; Datar, A. Body mass index in elementary school children, metropolitan area food prices and food outlet density. Public Health 2005, 119, 1059–1068. [Google Scholar] [CrossRef]
- Fraser, L.K.; Edwards, K.L. The association between the geography of fast-food outlets and childhood obesity rates in Leeds, UK. Health Place 2010, 16, 1124–1128. [Google Scholar] [CrossRef] [PubMed]
- Jeffery, R.W.; Baxter, J.; McGuire, M.; Linde, J. Are fast food restaurants an environmental risk factor for obesity? Int. J. Behav. Nutr. Phys. Act. 2006, 3, 2. [Google Scholar] [CrossRef]
- Burgoine, T.; Sarkar, C.; Webster, C.J.; Monsivais, P. Examining the interaction of fast-food outlet exposure and income on diet and obesity: Evidence from 51,361 UK Biobank participants. Int. J. Behav. Nutr. Phys. Act. 2018, 15, 1–12. [Google Scholar]
- Jones, A.; Bentham, G.; Foster, C.; Hillsdon, M.; Panter, J. Tackling Obesities: Future Choices–Obesogenic Environments–Evidence Review; Government Office for Science: London, UK, 2007. [Google Scholar]
- Fraser, L.K.; Edwards, K.L.; Cade, J.; Clarke, G.P. The geography of fast food outlets: A review. Int. J. Environ. Res. Public Health 2010, 7, 2290–2308. [Google Scholar] [CrossRef]
- Bridle-Fitzpatrick, S. Food deserts or food swamps? A mixed-methods study of local food environments in a Mexican city. Soc. Sci. Med. 2015, 142, 202–213. [Google Scholar] [CrossRef] [PubMed]
- Partridge, J. Just Eat Takeaway Orders Soar on Back of European Lockdowns, 2021. Available online: https://www.theguardian.com/business/2021/jan/13/just-eat-takeaway-orders-soar-on-back-of-european-lockdowns-covid (accessed on 5 April 2021).
- Rundle, A.; Neckerman, K.M.; Freeman, L.; Lovasi, G.S.; Purciel, M.; Quinn, J.; Richards, C.; Sircar, N.; Weiss, C. Neighborhood food environment and walkability predict obesity in New York City. Environ. Health Perspect. 2009, 117, 442–447. [Google Scholar] [CrossRef]
- Clarke, G.; Eyre, E.; Guy, C. Deriving Indicators of access to food retail provision in British Cities; Studies of Cardiff, Leeds and Bradford. Urban Stud. 2002, 39, 2041–2060. [Google Scholar] [CrossRef]
- MacIntyre, S.; McKay, L.; Cummins, S.; Burns, C. Out-of-home food outlets and area deprivation: Case study in Glasgow, UK. Int. J. Behav. Nutr. Phys. Act. 2005, 2, 16–22. [Google Scholar] [CrossRef]
- Cummins, S. Commentary: Investigating neighbourhood effects on health: Avoiding the local trap. Int. J. Epidemiol. 2007, 36, 355–357. [Google Scholar] [CrossRef]
- MacDonald, L.; Cummins, S.; Macintyre, S. Neighbourhood fast food environment and area deprivation: Substitution or concentration? Appetite 2007, 49, 251–254. [Google Scholar] [CrossRef]
- Edwards, K.L.; Clarke, G.P. The design and validation of a spatial microsimulation model of obesogenic environments in Leeds: SimObesity. Soc. Sci. Med. 2009, 69, 1127–1134. [Google Scholar] [CrossRef] [PubMed]
- Burns, C.M.; Inglis, A.D. Measuring food access in Melbourne: Access to healthy and fast foods by car; bus and foot in an urban municipality in Melbourne. Health Place 2007, 13, 877–885. [Google Scholar] [CrossRef] [PubMed]
- Timperio, A.; Ball, K.; Roberts, R.; Campbell, K.; Andrianopoulos, N.; Crawford, D. Children’s fruit and vegetable intake: Associations with the neighbourhood food environment. Prev. Med. 2008, 46, 331–335. [Google Scholar] [CrossRef] [PubMed]
- Thornton, L.E.; Bentley, R.J.; Kavanagh, A.M. Fast food purchasing and access to fast food restaurants: A multilevel analyses of VicLANES. Int. J. Behav. Nutr. Phys. Act. 2009, 6, 28–38. [Google Scholar] [CrossRef]
- Pearce, J.; Blakely, T.; Witten, K.; Bartie, P. Neighbourhood deprivation and access to fast food retailing. Am. J. Prev. Med. 2007, 32, 375–382. [Google Scholar] [CrossRef]
- Pearce, J.; Hiscock, R.; Blakely, T.; Witten, K. A national study of the association between neighbourhood access to fast—Food outlets and the diet and weight status of local residents. Health Place 2009, 15, 193–197. [Google Scholar] [CrossRef]
- Smoyer-Tomic, K.E.; Spence, J.; Raine, K.D.; Amrhein, C.; Yasenovsky, V.; Cutumisu, N.; Hemphill, E.; Healy, J. The association between neighbourhood socioeconomic status and exposure to supermarkets and fast food outlets. Health Place 2008, 14, 740–754. [Google Scholar] [CrossRef]
- Lichter, D.T.; Parisi, D.; De Valk, H. Residential segregation. Pathw. Poverty Inequal. Rep. 2016, 65–74. [Google Scholar]
- Elliott, J.; Shepherd, P. Cohort profile: 1970 British birth cohort (BCS70). Int. J. Epidemiol. 2006, 35, 836–843. [Google Scholar] [CrossRef]
- Chamberlain, R.; Chamberlain, G. 1970 British Cohort Study: Birth and 22-Month Subsample, 1970–1972, 3rd ed.; UK Data Service: Manchester, UK, 2013. [Google Scholar] [CrossRef]
- University College London; Institute of Education; Centre for Longitudinal Studies. COVID-19 Survey in Five National Longitudinal Cohort Studies: Millennium Cohort Study, Next Steps, 1970 British Cohort Study and 1958 National Child Development Study, 2nd ed.; UK Data Service: Manchester, UK, 2020. [Google Scholar] [CrossRef]
- University of London; Institute of Education; Centre for Longitudinal Studies. 1970 British Cohort Study: Forty-Six-Year Follow-Up, 2016–2018; UK Data Service: Manchester, UK, 2019. [Google Scholar] [CrossRef]
- University of London; Institute of Education; Centre for Longitudinal Studies; Butler, N.; Bynner, J. 1970 British Cohort Study: Ten-Year Follow-Up, 1980, 6th ed.; UK Data Service: Manchester, UK, 2016. [Google Scholar] [CrossRef]
- Centers for Disease Control and Prevention. Calculating BMI Using the Metric System. 2014. Available online: https://www.cdc.gov/nccdphp/dnpao/growthcharts/training/bmiage/page5_1.html#:~:text=With%20the%20metric%20system%2C%20the,by%2010%2C000%2C%20can%20be%20used (accessed on 21 December 2022).
- Babey, S.H.; Diamant, A.L.; Hastert, T.A.; Harvey, S. Designed for Disease: The Link between Local Food Environments and Obesity and Diabetes; UCLA Center for Health Policy Research: Los Angeles, CA, USA, 2008; Available online: https://escholarship.org/uc/item/7sf9t5wx (accessed on 19 December 2022).
- Casson, R.J.; Farmer, L.D. Understanding and checking the assumptions of linear regression: A primer for medical researchers. Clin. Exp. Ophthalmol. 2014, 42, 590–596. [Google Scholar] [CrossRef]
- Tedstone, A. Putting Healthier Food Environments at the Heart of Planning. 2018. Available online: https://publichealthmatters.blog.gov.uk/2018/06/29/putting-healthier-food-environments-at-the-heart-of-planning/ (accessed on 19 December 2022).
- Cavill, N.; Rutter, H. Healthy People, Healthy Places Briefing: Obesity and the Environment: Regulating the Growth of Fast Food Outlets; Public Health England: London, UK, 2013. [Google Scholar]
- Stafford, M.; Marmot, M. Neighbourhood deprivation and health: Does it affect us all equally? Int. J. Epidemiol. 2003, 32, 357–366. [Google Scholar] [CrossRef] [PubMed]
- Ministry of Housing, Communities and Local Government (MHCLG), National Planning Policy Framework. 2019. Available online: https://assets.publishing.service.gov.uk/government/uploads/system/uploads/attachment_data/file/810197/NPPF_Feb_2019_revised.pdf (accessed on 19 December 2022).
- Myers, C.A.; Broyles, S.T. Fast food patronage and obesity prevalence during the COVID-19 pandemic: An alternative explanation. Obesity 2020, 28, 1796–1797. [Google Scholar] [CrossRef]
- Ashby, N.J. Impact of the COVID-19 pandemic on unhealthy eating in populations with obesity. Obesity 2020, 28, 1802–1805. [Google Scholar] [CrossRef] [PubMed]
- Albalawi, A.; Hambly, C.; Speakman, J.R. The impact of the novel Coronavirus movement restrictions in the UK on food outlet usage and Body Mass Index. Obes. Sci. Pract. 2021, 7, 302–306. [Google Scholar] [CrossRef] [PubMed]
- Robinson, E.; Boyland, E.; Chisholm, A.; Harrold, J.; Maloney, N.G.; Marty, L.; Mead, B.R.; Noonan, R.; Hardman, C.A. Obesity, eating behavior and physical activity during COVID-19 lockdown: A study of UK adults. Appetite 2021, 156, 104853. [Google Scholar] [CrossRef]
- Zou, G. A modified Poisson regression approach to prospective studies with binary data. Am. J. Epidemiol. 2004, 159, 702–706. [Google Scholar] [CrossRef]


| Model 1 FFP | Model 2 Adj. FFP | Model 3 FREI | Model 4 Adj. RFEI | |
|---|---|---|---|---|
| Sweep 9 (2016) | 5138 | 3624 | 3805 | 2627 |
| CSW1 (April–May 2020) | 1733 | 1253 | 1285 | 904 |
| CSW2 (September–October 2020) | 656 | 470 | 466 | 327 |
| Statistic | N | Mean | Std. Dev. | Min | Max |
|---|---|---|---|---|---|
| Fast-Food Proportion (Independent) | 5138 | 0.29 | 0.17 | 0 | 1 |
| RFEI (Independent) | 3805 | 7.61 | 6.49 | 0 | 88 |
| BMI (Dependent) | 5637 | 28.39 | 5.32 | 16.33 | 61.69 |
| Income (Covariates) | 5637 | 23,104 | 59,675 | 0 | 1,600,000 |
| Maths Ability at Age 10 Years (Covariates) | 4217 | 46.86 | 11.43 | 5 | 72 |
| Statistic | N | Mean | Std. Dev. | Min | Max |
|---|---|---|---|---|---|
| Fast-Food Proportion (Independent) | 2293 | 0.28 | 0.17 | 0 | 1 |
| RFEI (Independent) | 1722 | 7.71 | 6.51 | 0 | 66 |
| BMI (Dependent) | 1949 | 27.80 | 5.32 | 16.53 | 66.22 |
| Maths Ability at Age 10 Years (Covariates) | 2029 | 48.46 | 11.07 | 8 | 71 |
| Statistic | N | Mean | Std. Dev. | Min | Max |
|---|---|---|---|---|---|
| Fast-Food Proportion (Independent) | 968 | 0.29 | 0.16 | 0 | 1 |
| RFEI (Independent) | 699 | 8.45 | 7.17 | 0 | 47 |
| BMI (Dependent) | 735 | 27.68 | 5.04 | 14.46 | 56.34 |
| Maths Ability at Age 10 Years | 831 | 47.70 | 11.24 | 10 | 71 |
| CHARACTERISTICS OF BCS70 PARTICIPANTS: CATEGORICAL COVARIATES | |||
|---|---|---|---|
| Covariate | % in Sweep 9 | % in CSW1 | % in CSW2 |
| Sex: | |||
| 1 = Male | 51.7 | 46.6 | 52.6 |
| 2 = Female | 48.3 | 53.4 | 47.4 |
| Financial Manageability: | |||
| 1 = Much worse off | - | 9.92 | 9.03 |
| 2 = Little worse off | - | 23 | 19.8 |
| 3 = Same | - | 43.3 | 52.3 |
| 4 = Little better off | - | 20.4 | 15.4 |
| 5 = Much better off | - | 3.39 | 3.45 |
| Highest Qualification: | |||
| 0 = no qualification | 25.8 | 18.4 | 25.7 |
| 1 = GCSE d-e | 0.39 | 0.333 | 0.41 |
| 2 = CSES 2-5, other scottish qual | 6.08 | 4.78 | 4.73 |
| 3 = GCSEs a-c, good scottish standards | 24.8 | 24.2 | 25.9 |
| 4 = AS or 1 A level | 1.9 | 2.2 | 1.65 |
| 5 = 2+ A levels, scot higher | 4.22 | 5.37 | 4.22 |
| 6 = diploma | 8.94 | 10.8 | 8.44 |
| 7 = degree level | 21.8 | 26.2 | 23.7 |
| 8 = higher degree | 6.07 | 7.74 | 5.25 |
| Housing Tenure: | |||
| 1 = Own outright | 14.3 | 12.2 | 23.8 |
| 2 = Own, mortgage | 67.6 | 51.2 | 61.4 |
| 3 = Shared equity | 0.869 | 2.44 | 0.62 |
| 4 = Rent | 15.3 | 24.4 | 13.1 |
| 5 = Rent free | 1.95 | 9.76 | 1.06 |
| Social Class: | |||
| 1 = Higher managerial | 0 | 0 | 0 |
| 1.1 = Large employers | 5.39 | 7.26 | 6.91 |
| 1.2 = Higher professionals | 14 | 16.4 | 12.6 |
| 2 = Lower managerial | 33 | 30.9 | 31.5 |
| 3 = Intermediate | 13.7 | 18.5 | 18.2 |
| 4 = Small employers | 9.17 | 5.23 | 6.64 |
| 5 = Lower supervisory | 9.21 | 5.01 | 5.14 |
| 6 = Semi-routine | 8.99 | 10.8 | 10.6 |
| 7 = Routine | 6.56 | 5.97 | 8.41 |
| 8 = Long term unemployed | 0 | 0 | 0 |
| Father’s social class at birth: | |||
| 1 = Professional | 6.94 | 7.94 | 6.54 |
| 2 = Managerial | 14.7 | 16.9 | 14 |
| 3 = Non-manual skilled | 14.7 | 16.2 | 15.3 |
| 4 = Skilled manual | 46.6 | 43.4 | 47.8 |
| 5 = Semi-skilled | 12.7 | 11.8 | 13 |
| 6 = Unskilled | 4.39 | 3.8 | 3.42 |
| Overweight/Obese: | |||
| FALSE | 27.4 | 32.4 | 31 |
| TRUE | 72.6 | 67.6 | 69 |
| Obese: | |||
| FALSE | 66.8 | 71.6 | 73.1 |
| TRUE | 33.2 | 28.4 | 26.9 |
| Self reported Obesity: | |||
| 0 = Obese | - | 9.25 | 11.2 |
| 1 = Not obese | - | 90.7 | 88.8 |
| CHARACTERISTICS OF BCS70 PARTICIPANTS: CATEGORICAL COVARIATES, STRATIFIED BY FOOD ENVIRONMENT | ||||||
|---|---|---|---|---|---|---|
| Covariate | % in Sweep 9 | % in CSW1 | % in CSW2 | |||
| Fast Food Proportion | RFEI | Fast Food Proportion | RFEI | Fast Food Proportion | RFEI | |
| Sex: | ||||||
| 1 = Male | 0.29 | 7.72 | 0.28 | 7.76 | 0.29 | 8.44 |
| 2 = Female | 0.29 | 7.49 | 0.28 | 7.74 | 0.29 | 8.45 |
| Financial Manageability: | ||||||
| 1 = Much worse off | - | - | 0.27 | 7.72 | 0.26 | 8.22 |
| 3 = Same | - | - | 0.29 | 7.91 | 0.29 | 8.51 |
| 5 = Much better off | - | - | 0.24 | 7.56 | 0.34 | 10.77 |
| Highest Qualification: | ||||||
| 0 = no qualification | 0.30 | 7.95 | 0.29 | 7.75 | 0.29 | 8.26 |
| 3 = GCSEs a-c, good scottish standards | 0.30 | 7.81 | 0.29 | 7.98 | 0.31 | 9.38 |
| 5 = 2+ A levels, scot higher | 0.28 | 6.66 | 0.26 | 6.95 | 0.30 | 7.59 |
| 7 = degree level | 0.28 | 7.19 | 0.27 | 7.79 | 0.27 | 7.76 |
| Housing Tenure: | ||||||
| 2 = Own, mortgage | 0.30 | 7.48 | 0.30 | 8.01 | 0.29 | 7.93 |
| 4 = Rent | 0.29 | 7.95 | 0.23 | 9.98 | 0.27 | 9.10 |
| Social Class: | ||||||
| 1.2 = Higher professionals | 0.29 | 6.84 | 0.27 | 7.02 | 0.26 | 7.92 |
| 3 = Intermediate | 0.31 | 7.93 | 0.30 | 8.02 | 0.30 | 8.11 |
| 7 = Routine | 0.31 | 8.34 | 0.28 | 6.85 | 0.30 | 7.78 |
| Father’s social class at birth: | ||||||
| 1 = Professional | 0.26 | 6.45 | 0.23 | 6.36 | 0.23 | 6.23 |
| 3 = Non-manual skilled | 0.28 | 7.00 | 0.29 | 7.18 | 0.27 | 7.12 |
| 4 = Skilled manual | 0.30 | 7.98 | 0.30 | 7.84 | 0.30 | 8.67 |
| 6 = Unskilled | 0.32 | 8.62 | 0.31 | 9.45 | 0.31 | 11.49 |
| Overweight/Obese: | ||||||
| FALSE | 0.28 | 7.40 | 0.27 | 7.59 | 0.28 | 7.99 |
| TRUE | 0.30 | 7.68 | 0.29 | 7.72 | 0.29 | 8.34 |
| Obese: | ||||||
| FALSE | 0.28 | 7.37 | 0.28 | 7.41 | 0.29 | 7.86 |
| TRUE | 0.31 | 8.07 | 0.31 | 8.29 | 0.30 | 9.20 |
| Self reported Obesity: | ||||||
| 0 = Obese | - | - | 0.32 | 8.18 | 0.27 | 8.42 |
| 1 = Not obese | - | - | 0.28 | 7.65 | 0.29 | 8.45 |
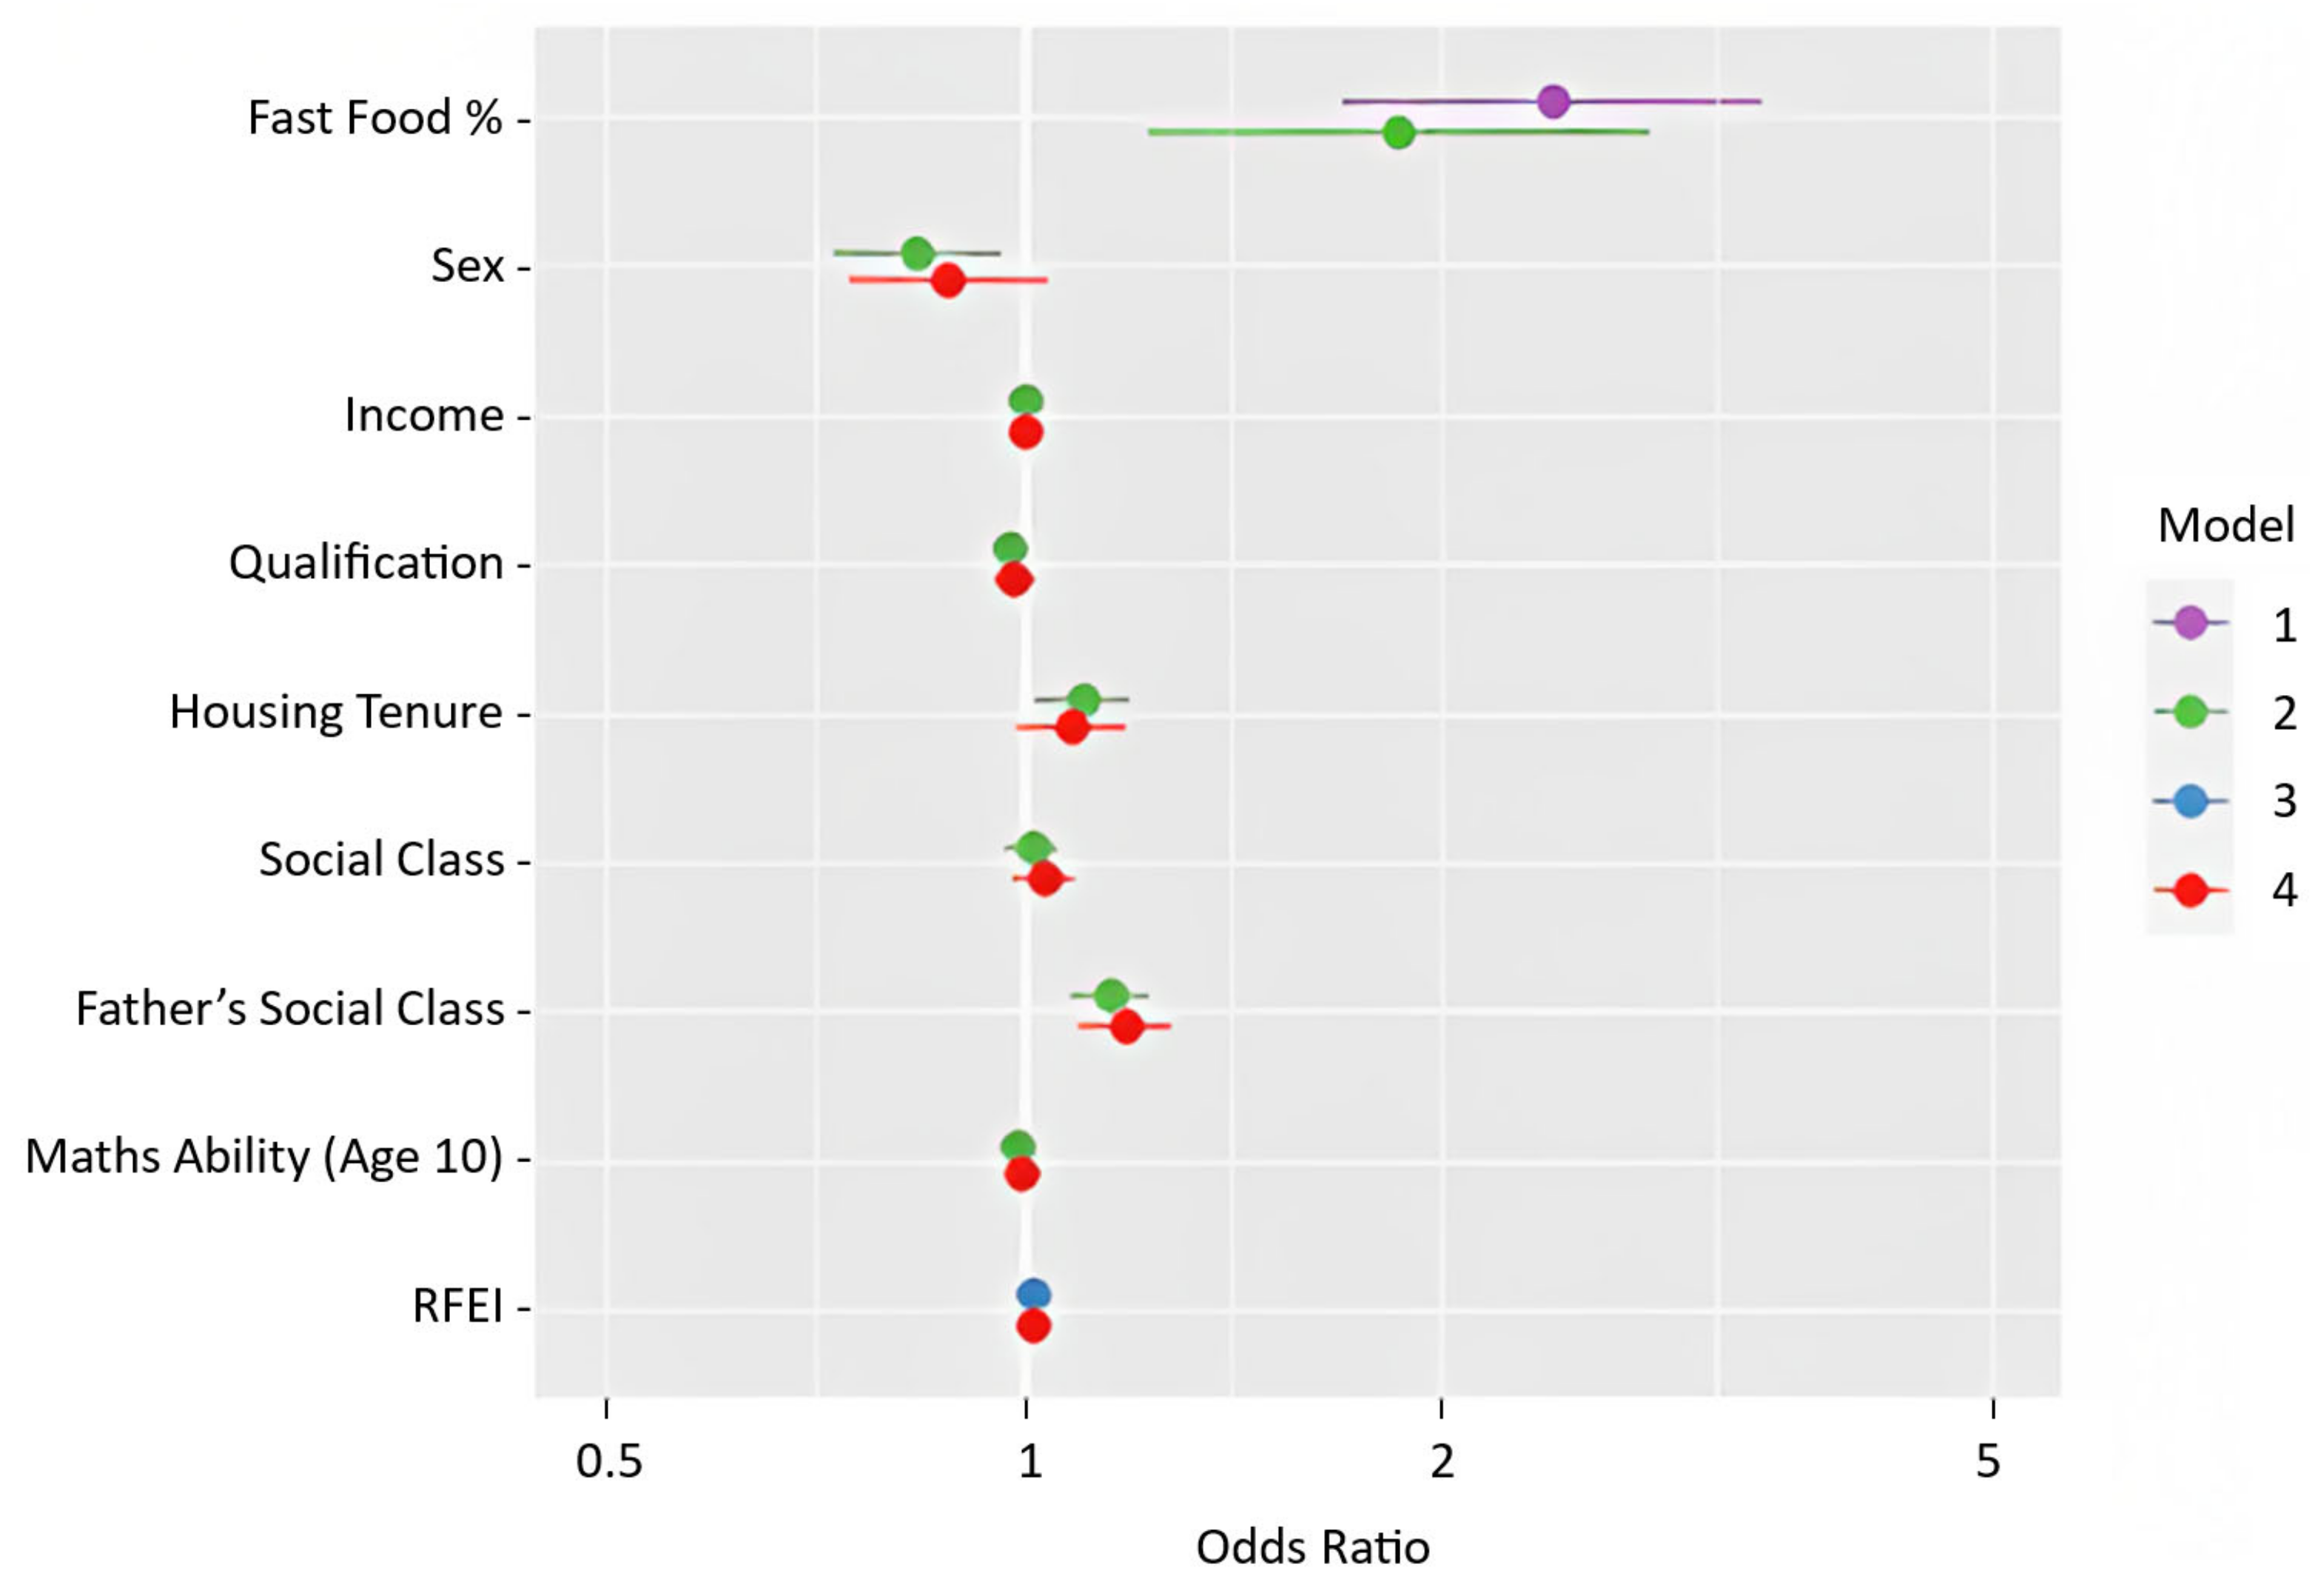
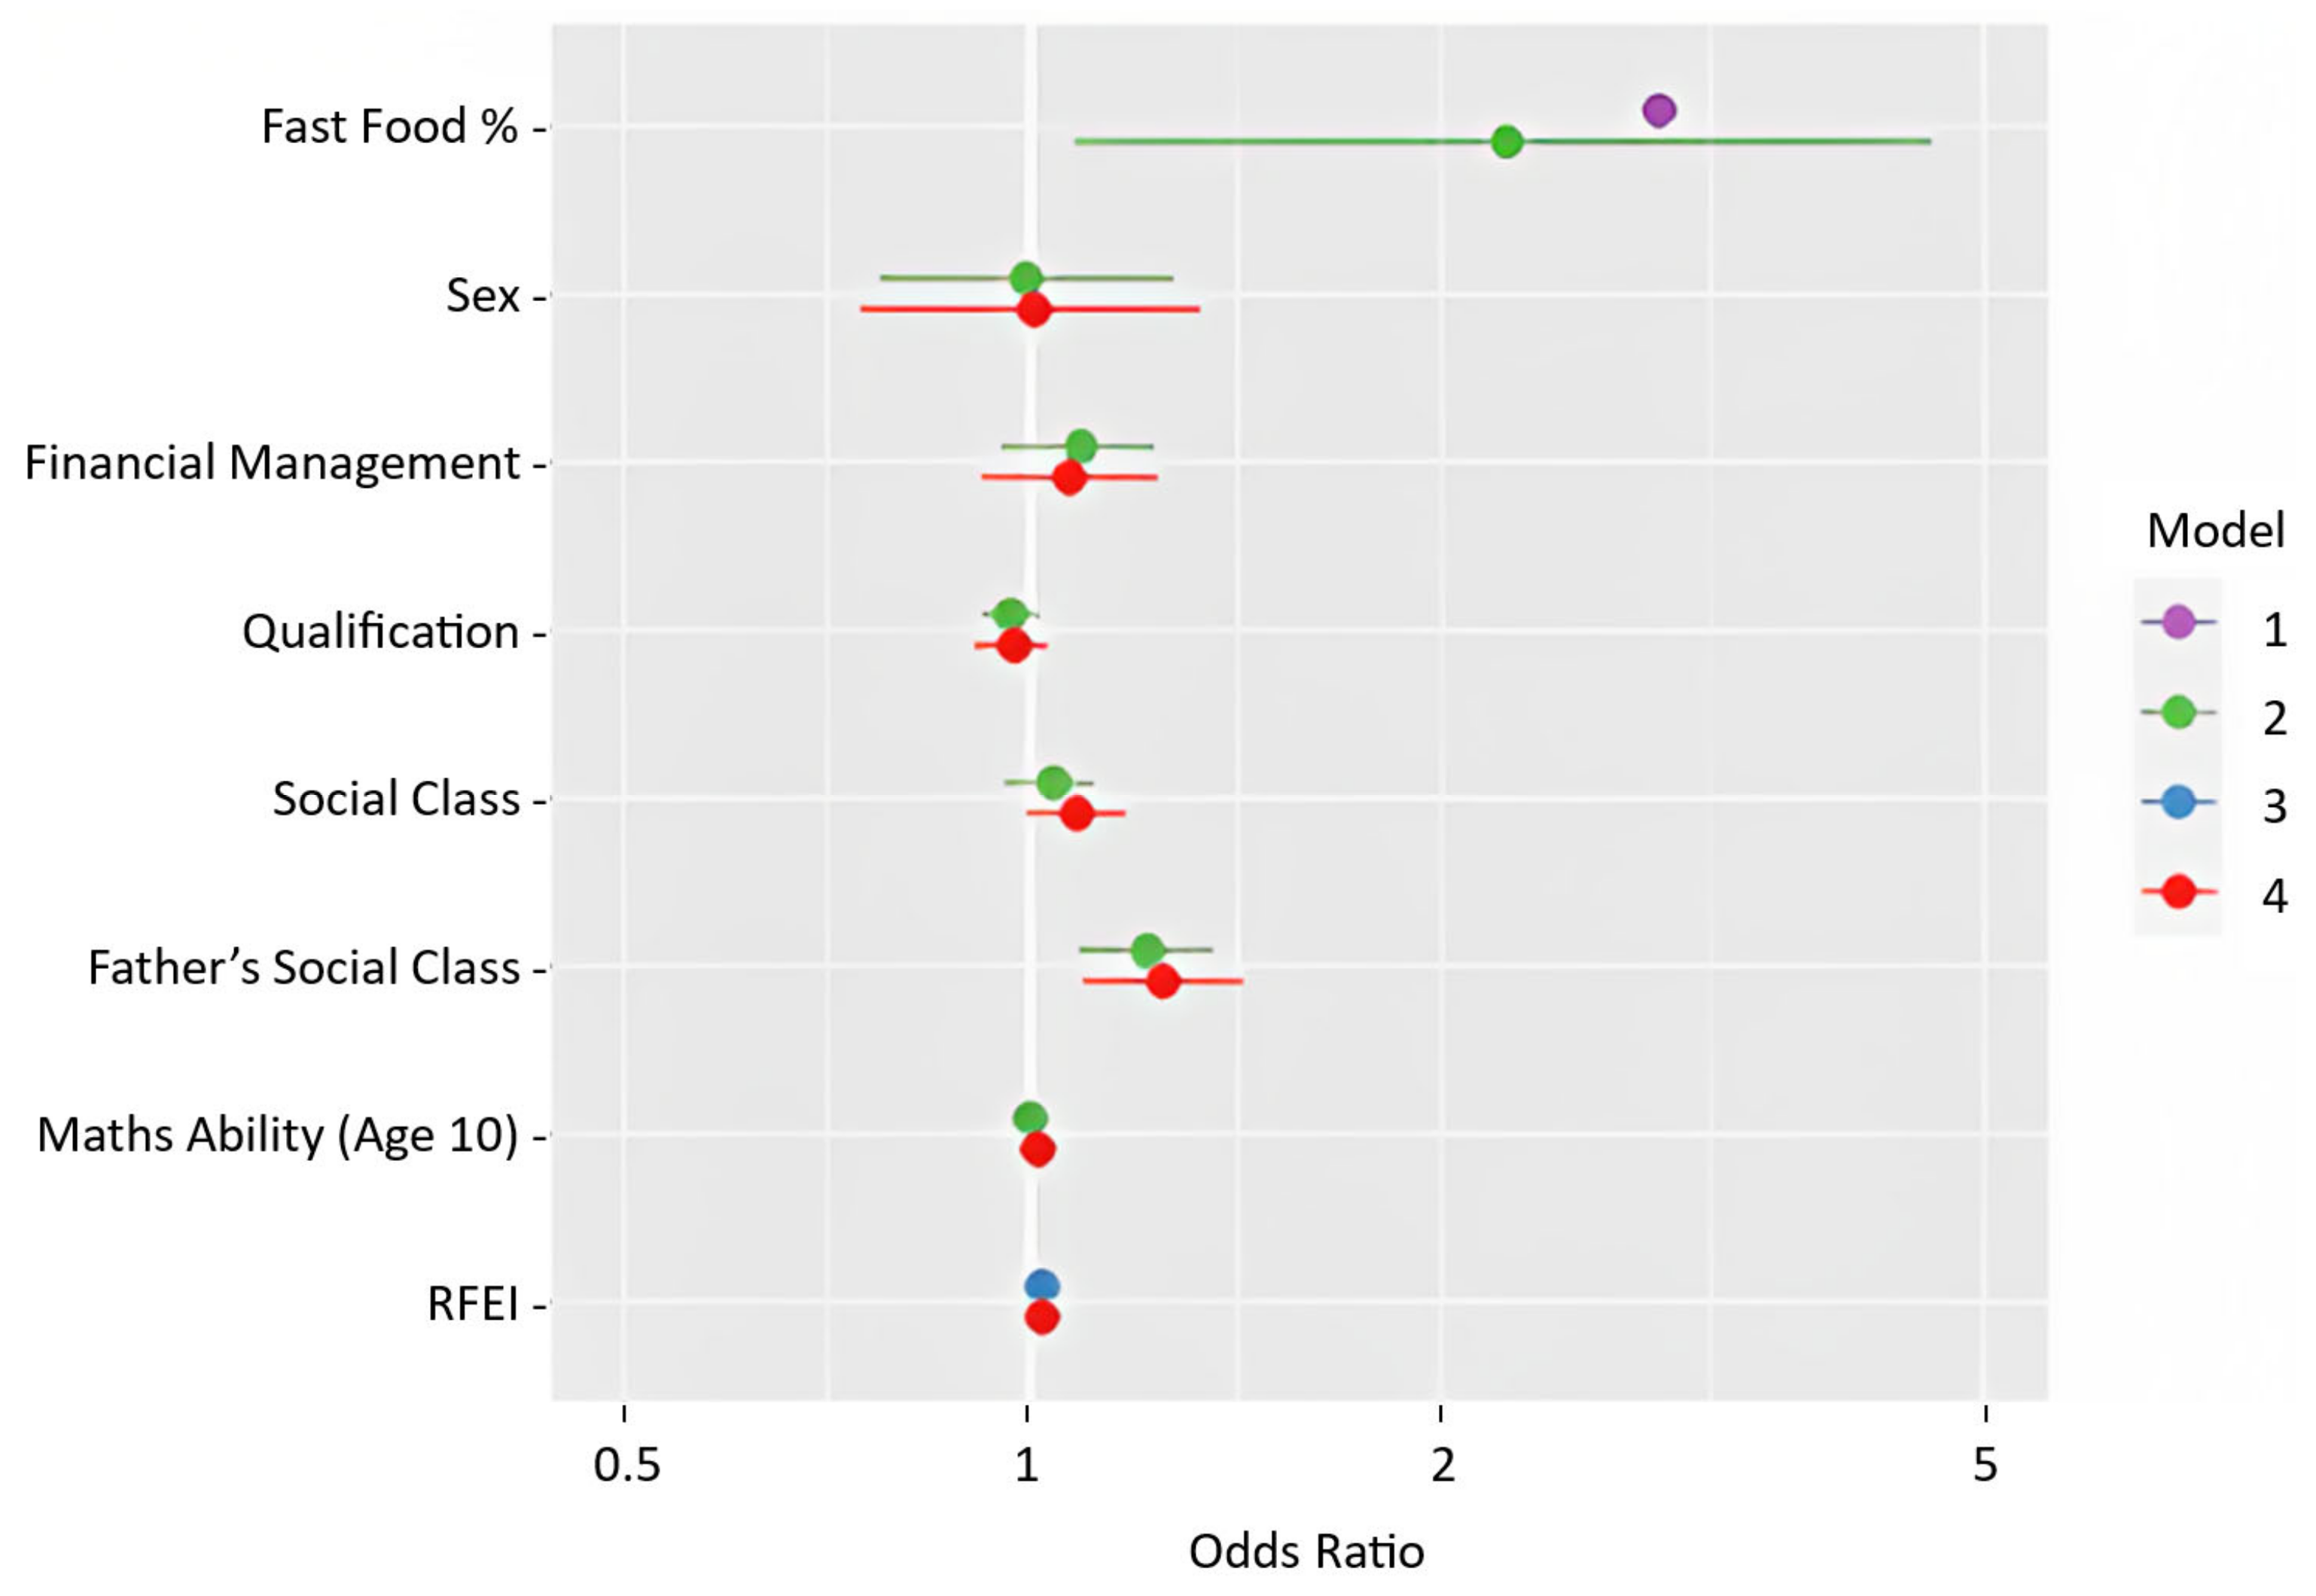
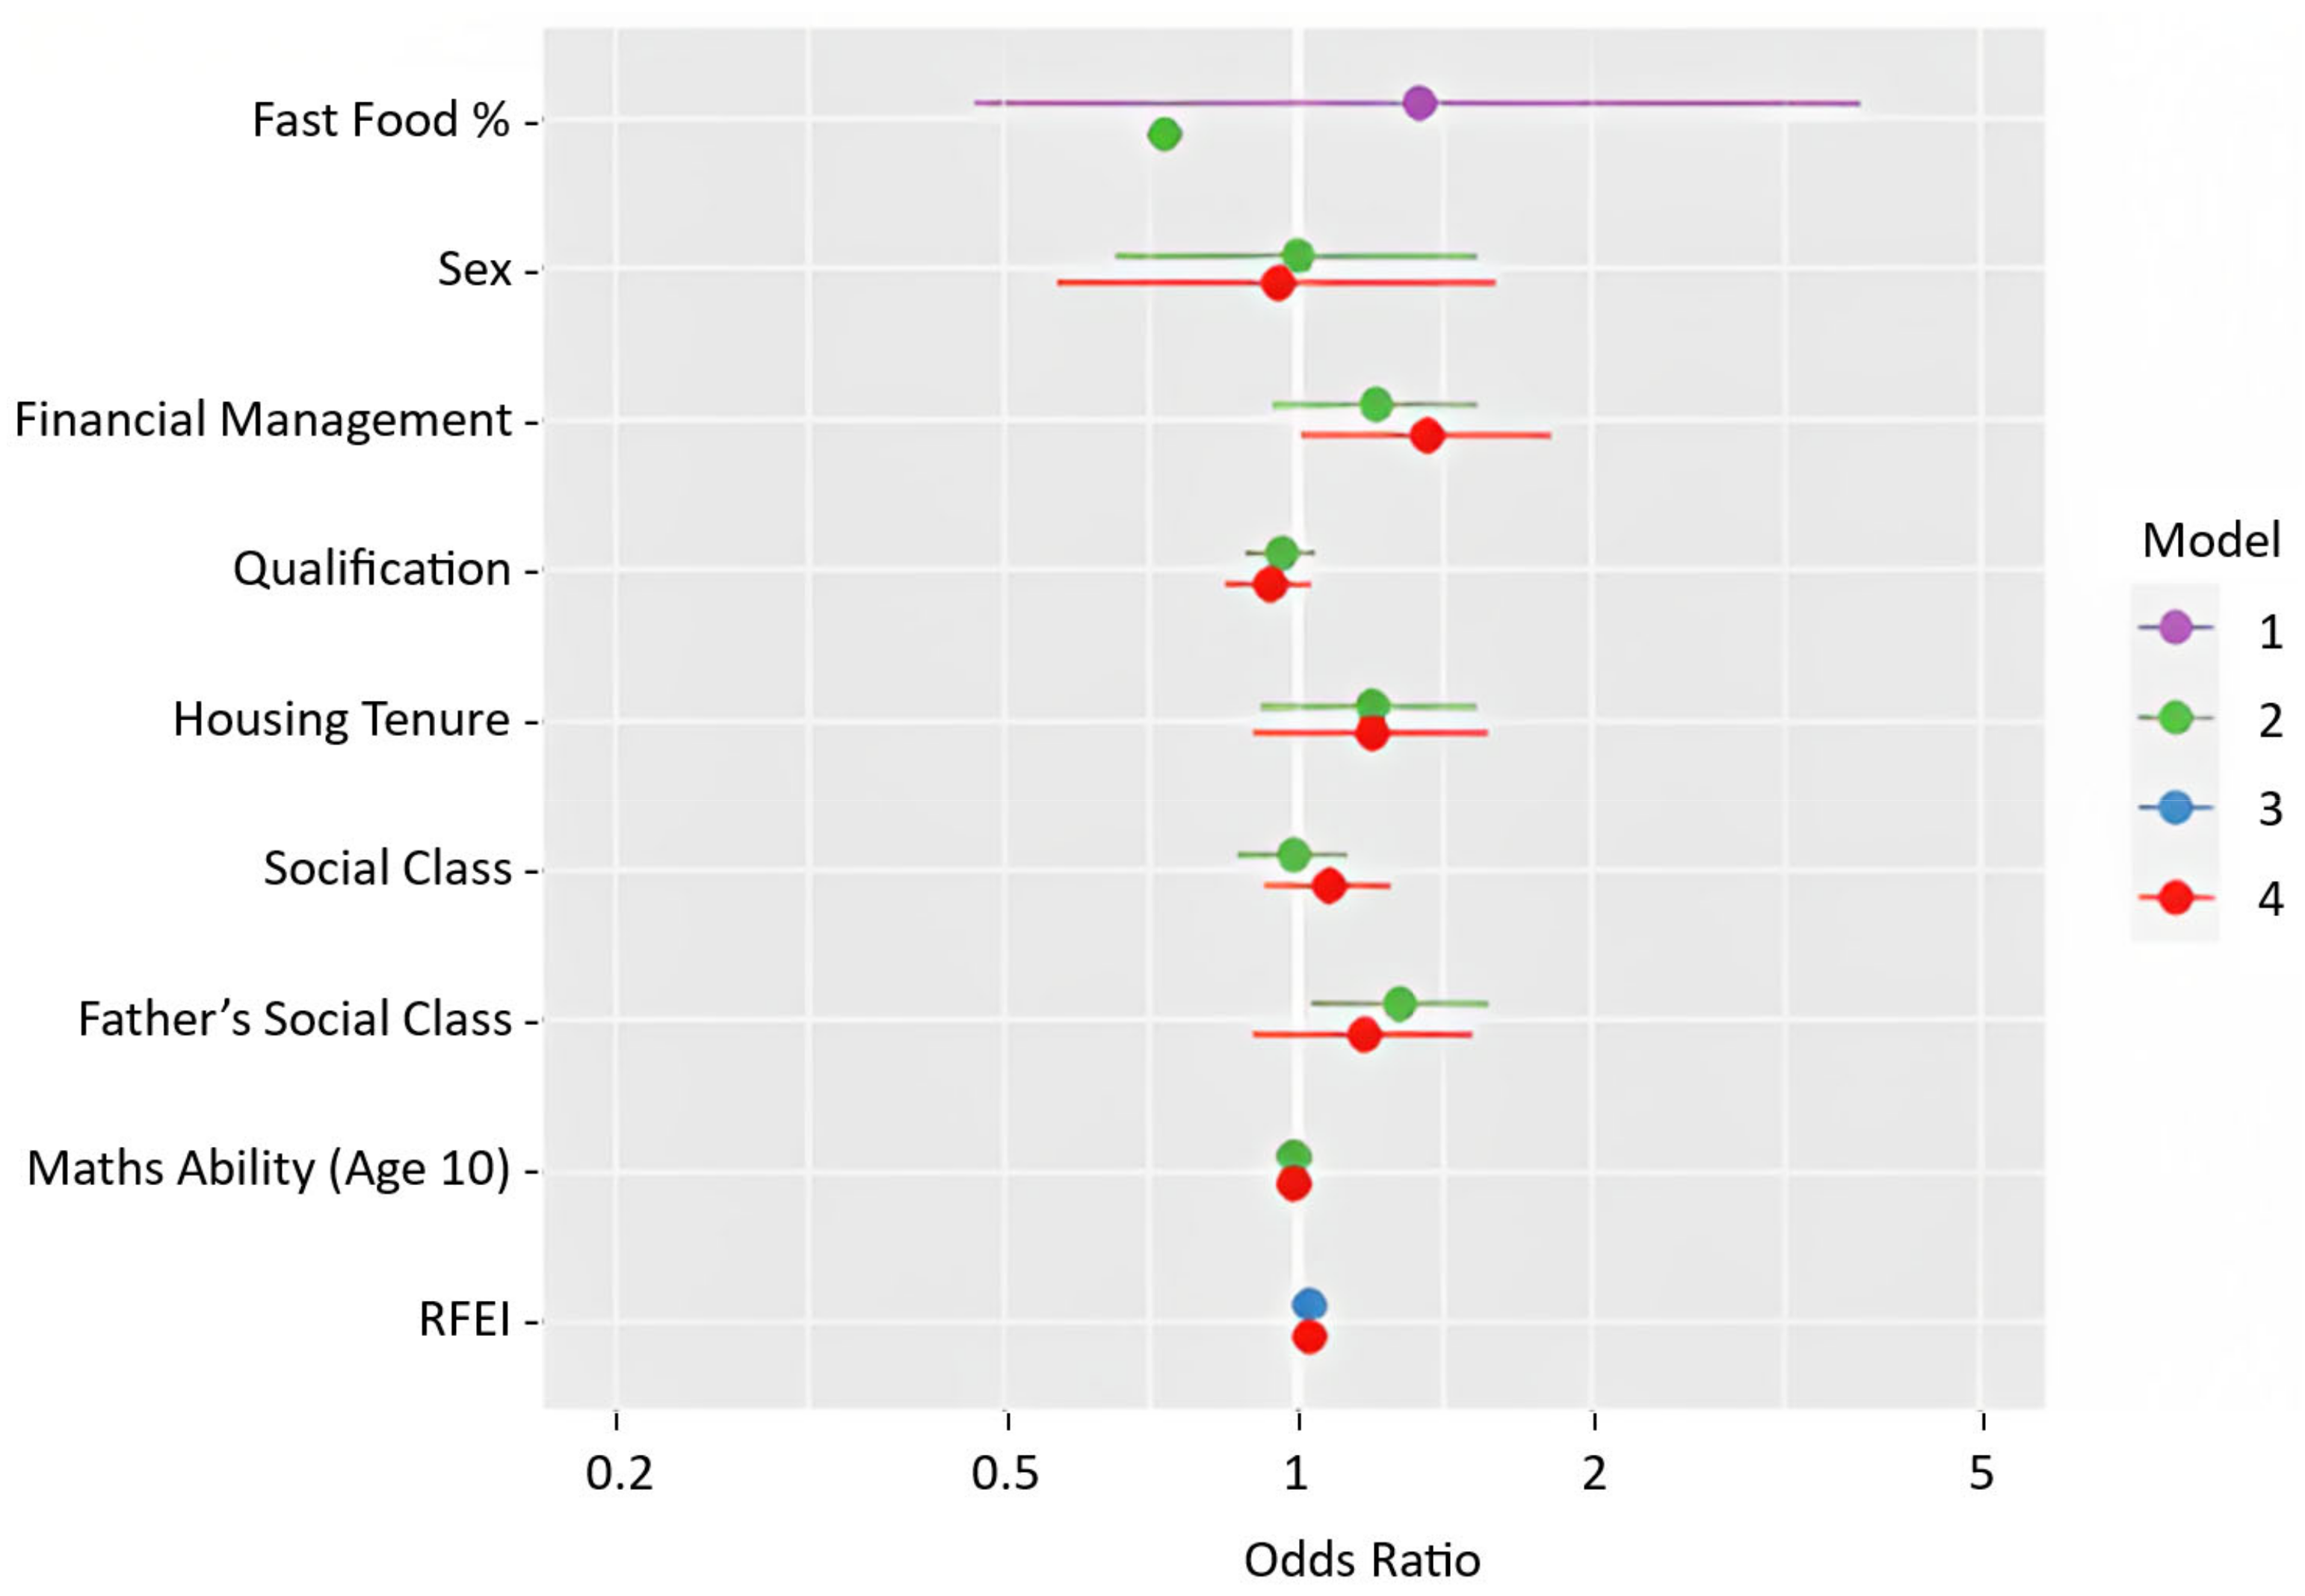
| REGRESSION ESTIMATES | ||||||||||||
|---|---|---|---|---|---|---|---|---|---|---|---|---|
| Sweep 10 | CSW1 | CSW2 | ||||||||||
| Variable | 1 | 2 | 3 | 4 | 1 | 2 | 3 | 4 | 1 | 2 | 3 | 4 |
| Fast Food Proportion | 2.41 *** (1.70–3.41) | 1.87 ** (1.23–2.83) | - | - | 2.888 *** (1.55–5.39) | 2.23 * (1.08–4.60) | - | - | 1.34 (0.47–3.82) | 0.73 (0.20–2.71) | - | - |
| RFEI | - | - | 1.02 ** (1.01–1.03) | 1.01 * (1.00–1.03) | - | - | 1.02 * (1.00–1.04) | 1.02 (1.00–1.04) | - | - | 1.03 (1.00–1.06) | 1.03 (1.00–1.07) |
| Sex | - | 0.84 * (0.73–0.97) | - | 0.88 (0.75–1.04) | - | 0.99 (0.78–1.27) | - | 1.00 (0.75–1.34) | - | 1.01 (0.66–1.54) | - | 0.96 (0.57–1.60) |
| Income | - | 1.00 | - | 1.00 | - | - | - | - | - | - | - | - |
| Financial Manageability | - | - | - | - | - | 1.08 (0.95–1.23) | - | 1.07 (0.92–1.24) | - | 1.20 (0.95–1.53) | - | 1.36 * (1.02–1.83) |
| Highest Qualification | - | 0.98 (0.95–1.01) | - | 0.98 (0.95–1.02) | - | 0.97 (0.92–1.02) | - | 0.97 (0.91–1.03) | - | 0.97 (0.89–1.05) | - | 0.94 (0.85–1.05) |
| Housing Tenure | - | 1.11 * (1.02–1.20) | - | 1.09 . (0.99–1.19) | - | - | - | - | - | 1.19 (0.93–1.54) | - | 1.19 (0.90–1.57) |
| Social class | - | 1.02 (0.97–1.06) | - | 1.04 (0.99–1.09) | - | 1.04 (0.96–1.12) | - | 1.08 . (0.99–1.18) | - | 1.00 (0.87–1.14) | - | 1.08 (0.93–1.25) |
| Father’s social class at birth | - | 1.16 *** (1.08–1.23) | - | 1.18 *** (1.10–1.28) | - | 1.216 *** (1.09–1.36) | - | 1.25 ** (1.09–1.43) | - | 1.28 * (1.04–1.57) | - | 1.18 (0.91–1.53) |
| Maths ability at Age 10 Years | - | 0.99 * (0.98–1.00) | - | 1.00 (0.99–1.00) | - | 1.00 (0.98–1.01) | - | 1.01 (0.99–1.02) | - | 1.00 (0.97–1.02) | - | 1.00 (0.97–1.02) |
| N | 5138 | 3624 | 3805 | 2627 | 1733 | 1253 | 1285 | 904 | 656 | 470 | 466 | 327 |
| Model 1 FFP | Model 2 Adj. FFP | Model 3 RFEI | Model 4 Adj. RFEI | |
|---|---|---|---|---|
| Sweep 9 | 0.293 | 0.296 | 7.606 | 7.697 |
| CSW1 | 0.287 | 0.290 | 7.681 | 7.756 |
| CSW2 | 0.290 | 0.292 | 8.236 | 8.434 |
| Model 1 | Model 2 | Model 3 | Model 4 | ||||||||||||
|---|---|---|---|---|---|---|---|---|---|---|---|---|---|---|---|
| Swp9 | CSW1 | CSW2 | Swp9 | CSW1 | CSW2 | Swp9 | CSW1 | CSW2 | Swp9 | CSW1 | CSW2 | ||||
| Swp9 | 0.238 | 0.705 | Swp9 | 0.254 | 0.640 | Swp9 | 0.726 | 0.063 | Swp9 | 0.824 | 0.087 | ||||
| CSW1 | 0.238 | 0.705 | CSW1 | 0.254 | 0.785 | CSW1 | 0.726 | 0.133 | CSW1 | 0.824 | 0.149 | ||||
| CSW2 | 0.705 | 0.705 | CSW2 | 0.640 | 0.785 | CSW2 | 0.063 | 0.133 | CSW2 | 0.087 | 0.149 | ||||
Disclaimer/Publisher’s Note: The statements, opinions and data contained in all publications are solely those of the individual author(s) and contributor(s) and not of MDPI and/or the editor(s). MDPI and/or the editor(s) disclaim responsibility for any injury to people or property resulting from any ideas, methods, instructions or products referred to in the content. |
© 2023 by the authors. Licensee MDPI, Basel, Switzerland. This article is an open access article distributed under the terms and conditions of the Creative Commons Attribution (CC BY) license (https://creativecommons.org/licenses/by/4.0/).
Share and Cite
Alonge, O.; Shiode, S.; Shiode, N. The Impact of Fast-Food Density on Obesity during the COVID-19 Lockdown in the UK: A Multi-Timepoint Study on British Cohort Data. Sustainability 2023, 15, 8480. https://doi.org/10.3390/su15118480
Alonge O, Shiode S, Shiode N. The Impact of Fast-Food Density on Obesity during the COVID-19 Lockdown in the UK: A Multi-Timepoint Study on British Cohort Data. Sustainability. 2023; 15(11):8480. https://doi.org/10.3390/su15118480
Chicago/Turabian StyleAlonge, Oluwanifemi, Shino Shiode, and Narushige Shiode. 2023. "The Impact of Fast-Food Density on Obesity during the COVID-19 Lockdown in the UK: A Multi-Timepoint Study on British Cohort Data" Sustainability 15, no. 11: 8480. https://doi.org/10.3390/su15118480
APA StyleAlonge, O., Shiode, S., & Shiode, N. (2023). The Impact of Fast-Food Density on Obesity during the COVID-19 Lockdown in the UK: A Multi-Timepoint Study on British Cohort Data. Sustainability, 15(11), 8480. https://doi.org/10.3390/su15118480