Article

Collapsibility Mechanisms and Water Diffusion Morphologies of Loess in Weibei Area

1
School of Geological Engineering and Geomatics, Chang’an University, Xi’an 710064, China
2
China Coal Xi’an Design Engineering Company with Limited Liability, Xi’an 710001, China
*
Author to whom correspondence should be addressed.
Sustainability 2023, 15(11), 8573; https://doi.org/10.3390/su15118573
Submission received: 2 April 2023 / Revised: 3 May 2023 / Accepted: 15 May 2023 / Published: 25 May 2023

Abstract

:
A large-scale immersion experiment was carried out to assess the collapsibility characteristics of loess in Bu Li village located in the Weibei Loess Tableland, and the seepage characteristics and collapsibility evolution of loess were determined. The effects of void ratio, natural moisture content, material composition, and microstructure evolution on the loess collapsibility were characterized by X-ray diffraction, scanning electron microscopy, and water-soluble salt analysis to elucidate the collapsibility mechanisms. The water diffusion morphologies considering various foundation lithologies, initial water contents, and stratum combinations were studied with the numerical simulation method, and an inverted-box-shape barrier measure preventing loess from the water immersion was proposed. The results showed that the maximum consolidation settlement was approximately 380.5 mm for the test site, and the expansion of clay minerals and the dissolution of soluble salts during wetting were the critical reasons for loess collapse. The void ratio and natural moisture content showed a positive and negative correlation with the collapsibility coefficient, respectively, and the concept of collapsibility potential was introduced. The water diffusion morphologies in distinct stratum combinations significantly depended on the permeability capacity of the lower soil layer, and the optimal depths of the vertical barrier were recommended to be set at the maximum inflection point in the diffusion morphology or the main action layer.

1. Introduction

Loess is widely distributed on the Loess Plateau of China [1], covering an extensive area of 640,000 km2, while the area of collapsible loess accounts for more than 60%, about 380,000 km2 [2]. There are massive cementitious materials with obvious pores between the collapsible loess particles, which leads to the characteristics of high compressibility and weak cementation, as well as the collapsibility and low strength of loess [3,4]. The engineering structure sitting on the collapsible loess is prone to deformation and settlement when loaded and subjected to water immersion, which brings potential hazards to the construction and serviceability of the projects [5,6]. It is of significance to grasp the water diffusion pattern in the stratum and the collapsibility mechanism of loess to guarantee the safety of engineering projects on the Loess Plateau.
Several laboratory tests and field tests for common physical and mechanical indexes of loess have been conducted [7,8], and the collapsible behavior of loess was studied by analyzing the composition and mechanical properties [9,10], which contributed to the knowledge of collapsible characteristics. Nevertheless, the stress state and path of the loess sample taken in the laboratory tests are different from the actual state in the stratum, resulting in the collapse type and settlement amount of loess determined by the calculated value being distinct from the field immersion experiments, which were carried out for numerous projects [11,12,13,14] to directly obtain the water diffusion range and the cumulative settlement of the site loess, with favorable accuracy and reliability.
The contributions of the components and microstructure of loess have been considered by researchers and engineers to explain collapsibility mechanisms, which determine its macroscopic properties. Miao et al. [15] put forward the hypothesis that the collapse deformation of loess is caused by microstructure instability by the microstructure test. Sha et al. [16] studied the pore characteristics and chemical composition of compacted loess and discussed the relationship between microstructure and collapsibility. Liu et al. [1] attributed the wetting-induced collapse to both primary and secondary microstructure features—the former was the abundance of weakly cemented, unsaturated, porous pure clay and clay–silt mixture aggregates, and the latter consisted of high porosity, unstable particle contacts, and clay coating on silt particles. Particle size, mineral composition, and soluble salt play vital roles in loess collapsibility because the bond between them may be weakened or removed by water invasion [17,18,19]. With the development of observation technologies—such as scanning electron microscopy (SEM), nuclear magnetic resonance (NMR), and X-ray computed tomography (CT)—the relationship between microstructure characteristics and the collapsibility evolution of loess has been explored, in part, quantitatively [20,21,22], which can reasonably explain the collapsible essence.
There are many methods to optimize the engineering foundation with loess to reduce the potential collapsibility, such as heavy tamping, soil-pile compacting, chemical reinforcement, or adding cementation materials [23,24,25]. However, the above methods improve the loess compactness from the perspective of its porosity, leading to problems of high cost, great limitations, and unstable performance. Few studies have focused on protecting loess from water immersion, which is the dominant inducement for collapsibility.
In this research, a large-scale field immersion experiment was conducted to investigate the settlement characteristics and water diffusion behavior of loess in Bu Li village. The collapsibility mechanisms were explored by analyzing the effects of the natural moisture content, void ratio, material composition, and microstructure evolution. Finally, a water-barrier measure was proposed to prevent loess from the water immersion by obtaining the water diffusion morphologies, considering the factors of the lithologic characteristics, initial water content, and stratum combinations using the numerical simulation method.

2. Project Overview and Water Immersion Test

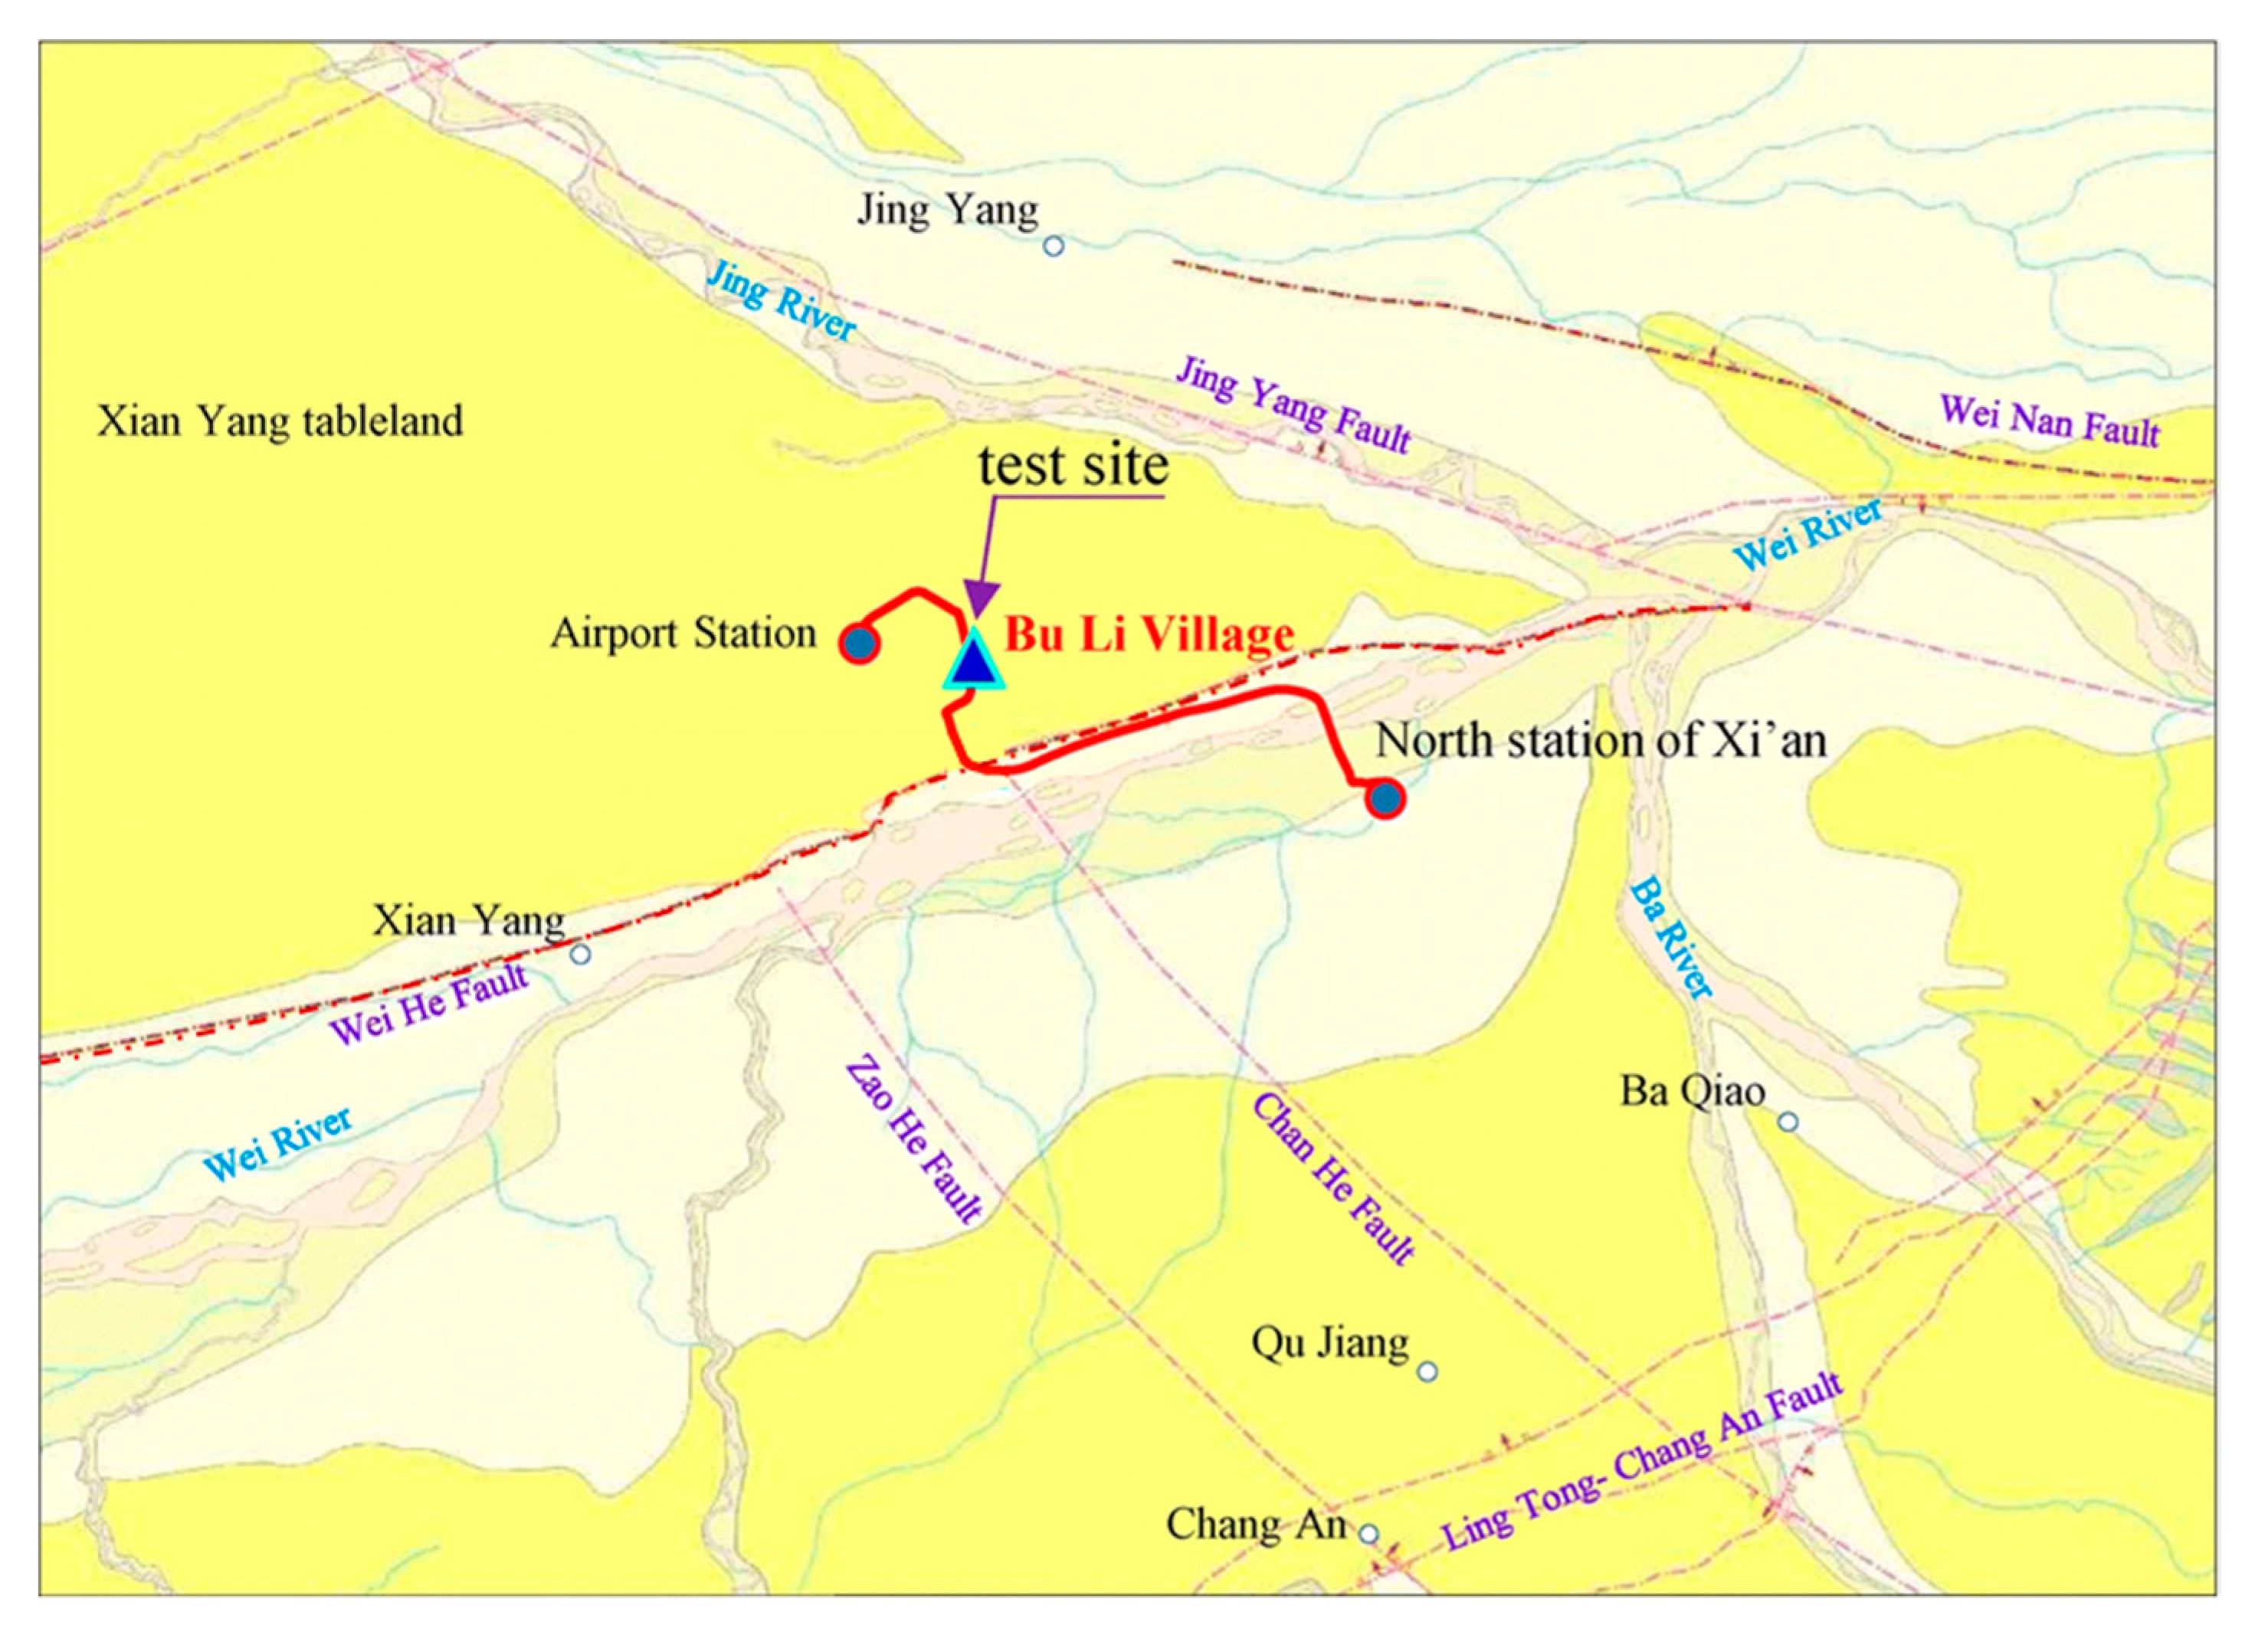
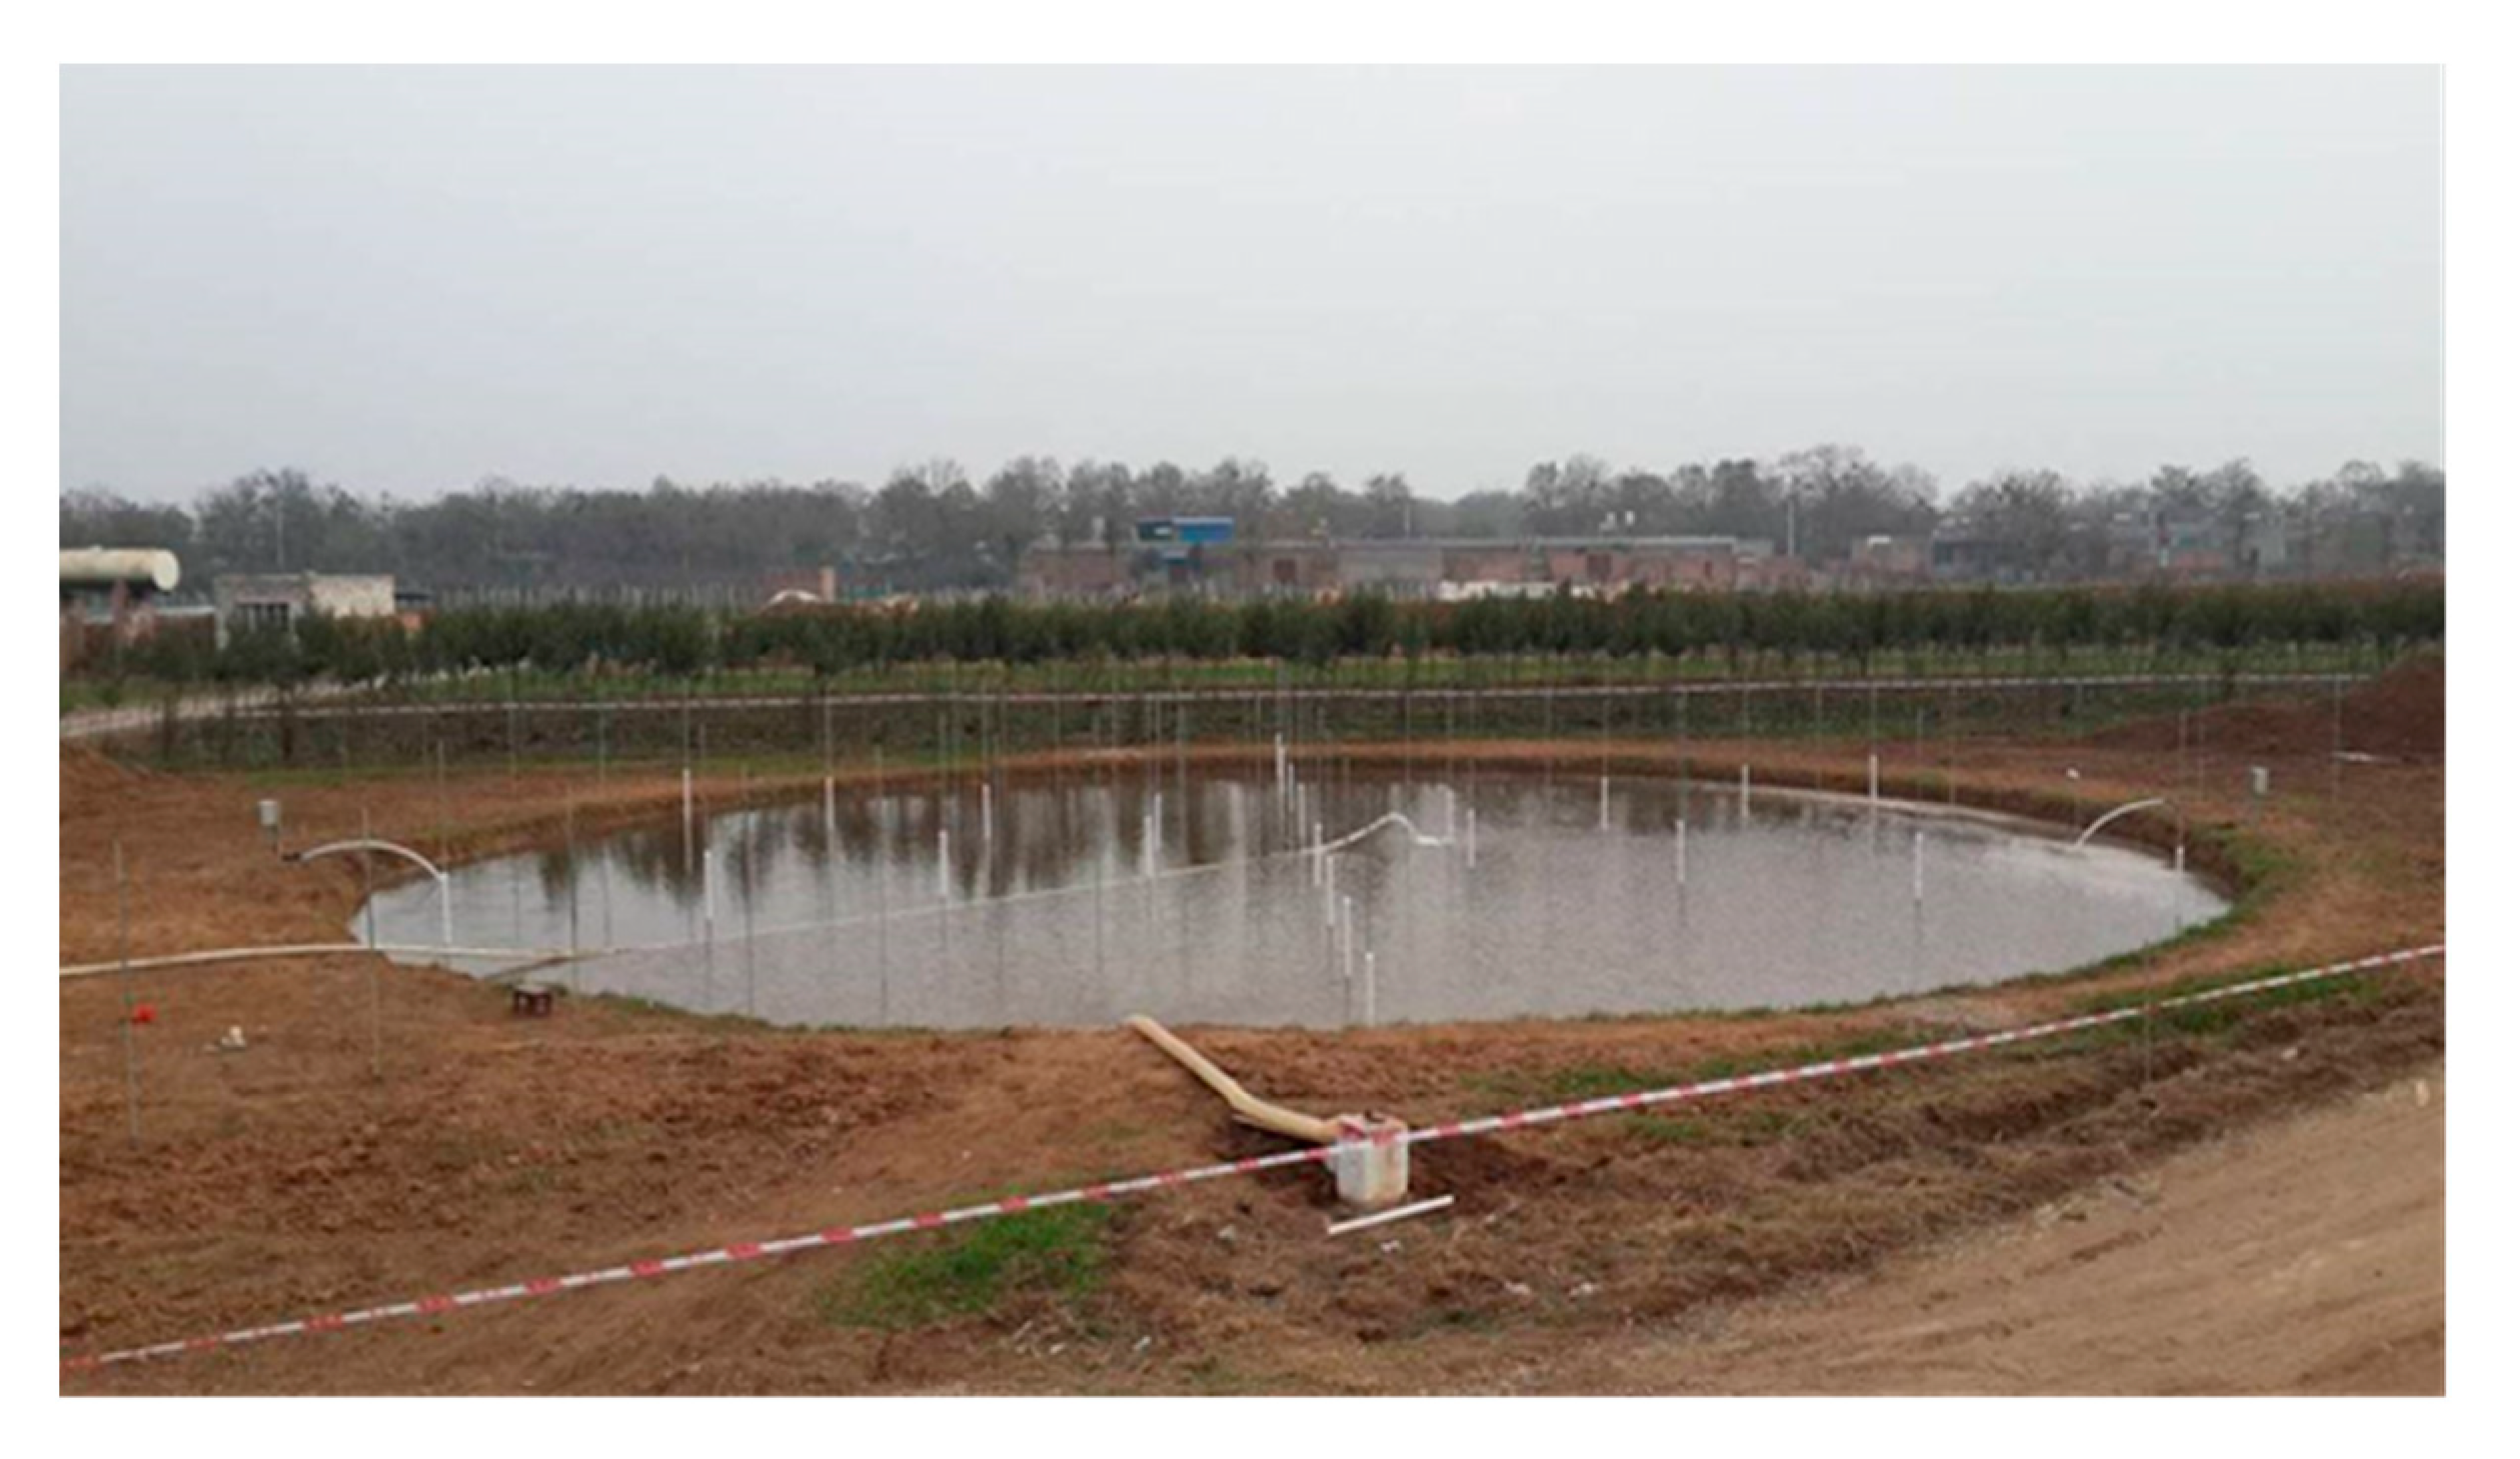
2.1. Field Test Site Selection

To make the selection of the immersion test site more reasonable, the geomorphic features of the test site are required to be distinctive and representative, and faults are not allowed to appear in loess layers, which are with prominent collapsible and loessial characteristics. Additionally, the water and electricity supply should be advantageous to guarantee the test implementation, as well as the environmental conditions, such as transportation and site size.
According to the above principles, the site located at DK23+236 m on the Xi’an North to Airport Intercity Railway was selected to conduct the water immersion test, which was within the scope of Bu Li village in the Weibei Loess Tableland. As shown in Figure 1, the distance between the test site and the planned intercity railway was about 50 m, and the center coordinates were X = 3,812,505.038, Y = 495,941.149, and H = 465.88.
Based on the previous geological survey, the geological information of the loess tableland—consisting of layers, ages, and stratigraphic characteristics—is summarized in Table 1. The well-testing results showed that the minimum collapse depth of the loess varied from 17.5 to 20.5 m, while the self-weight collapse coefficient (δzs) and the collapse coefficient (δs) were in the range of 0.016–0.069 and 0.018–0.093, respectively. The calculated values of the self-weight collapse and collapse were in the range of 195–423 mm and 534–948 mm, respectively, and the collapse depth was between 15.5 and 20.5 m. In consequence, the foundation settlement level was evaluated to be between self-weight grade III (severe) and grade IV (very severe).

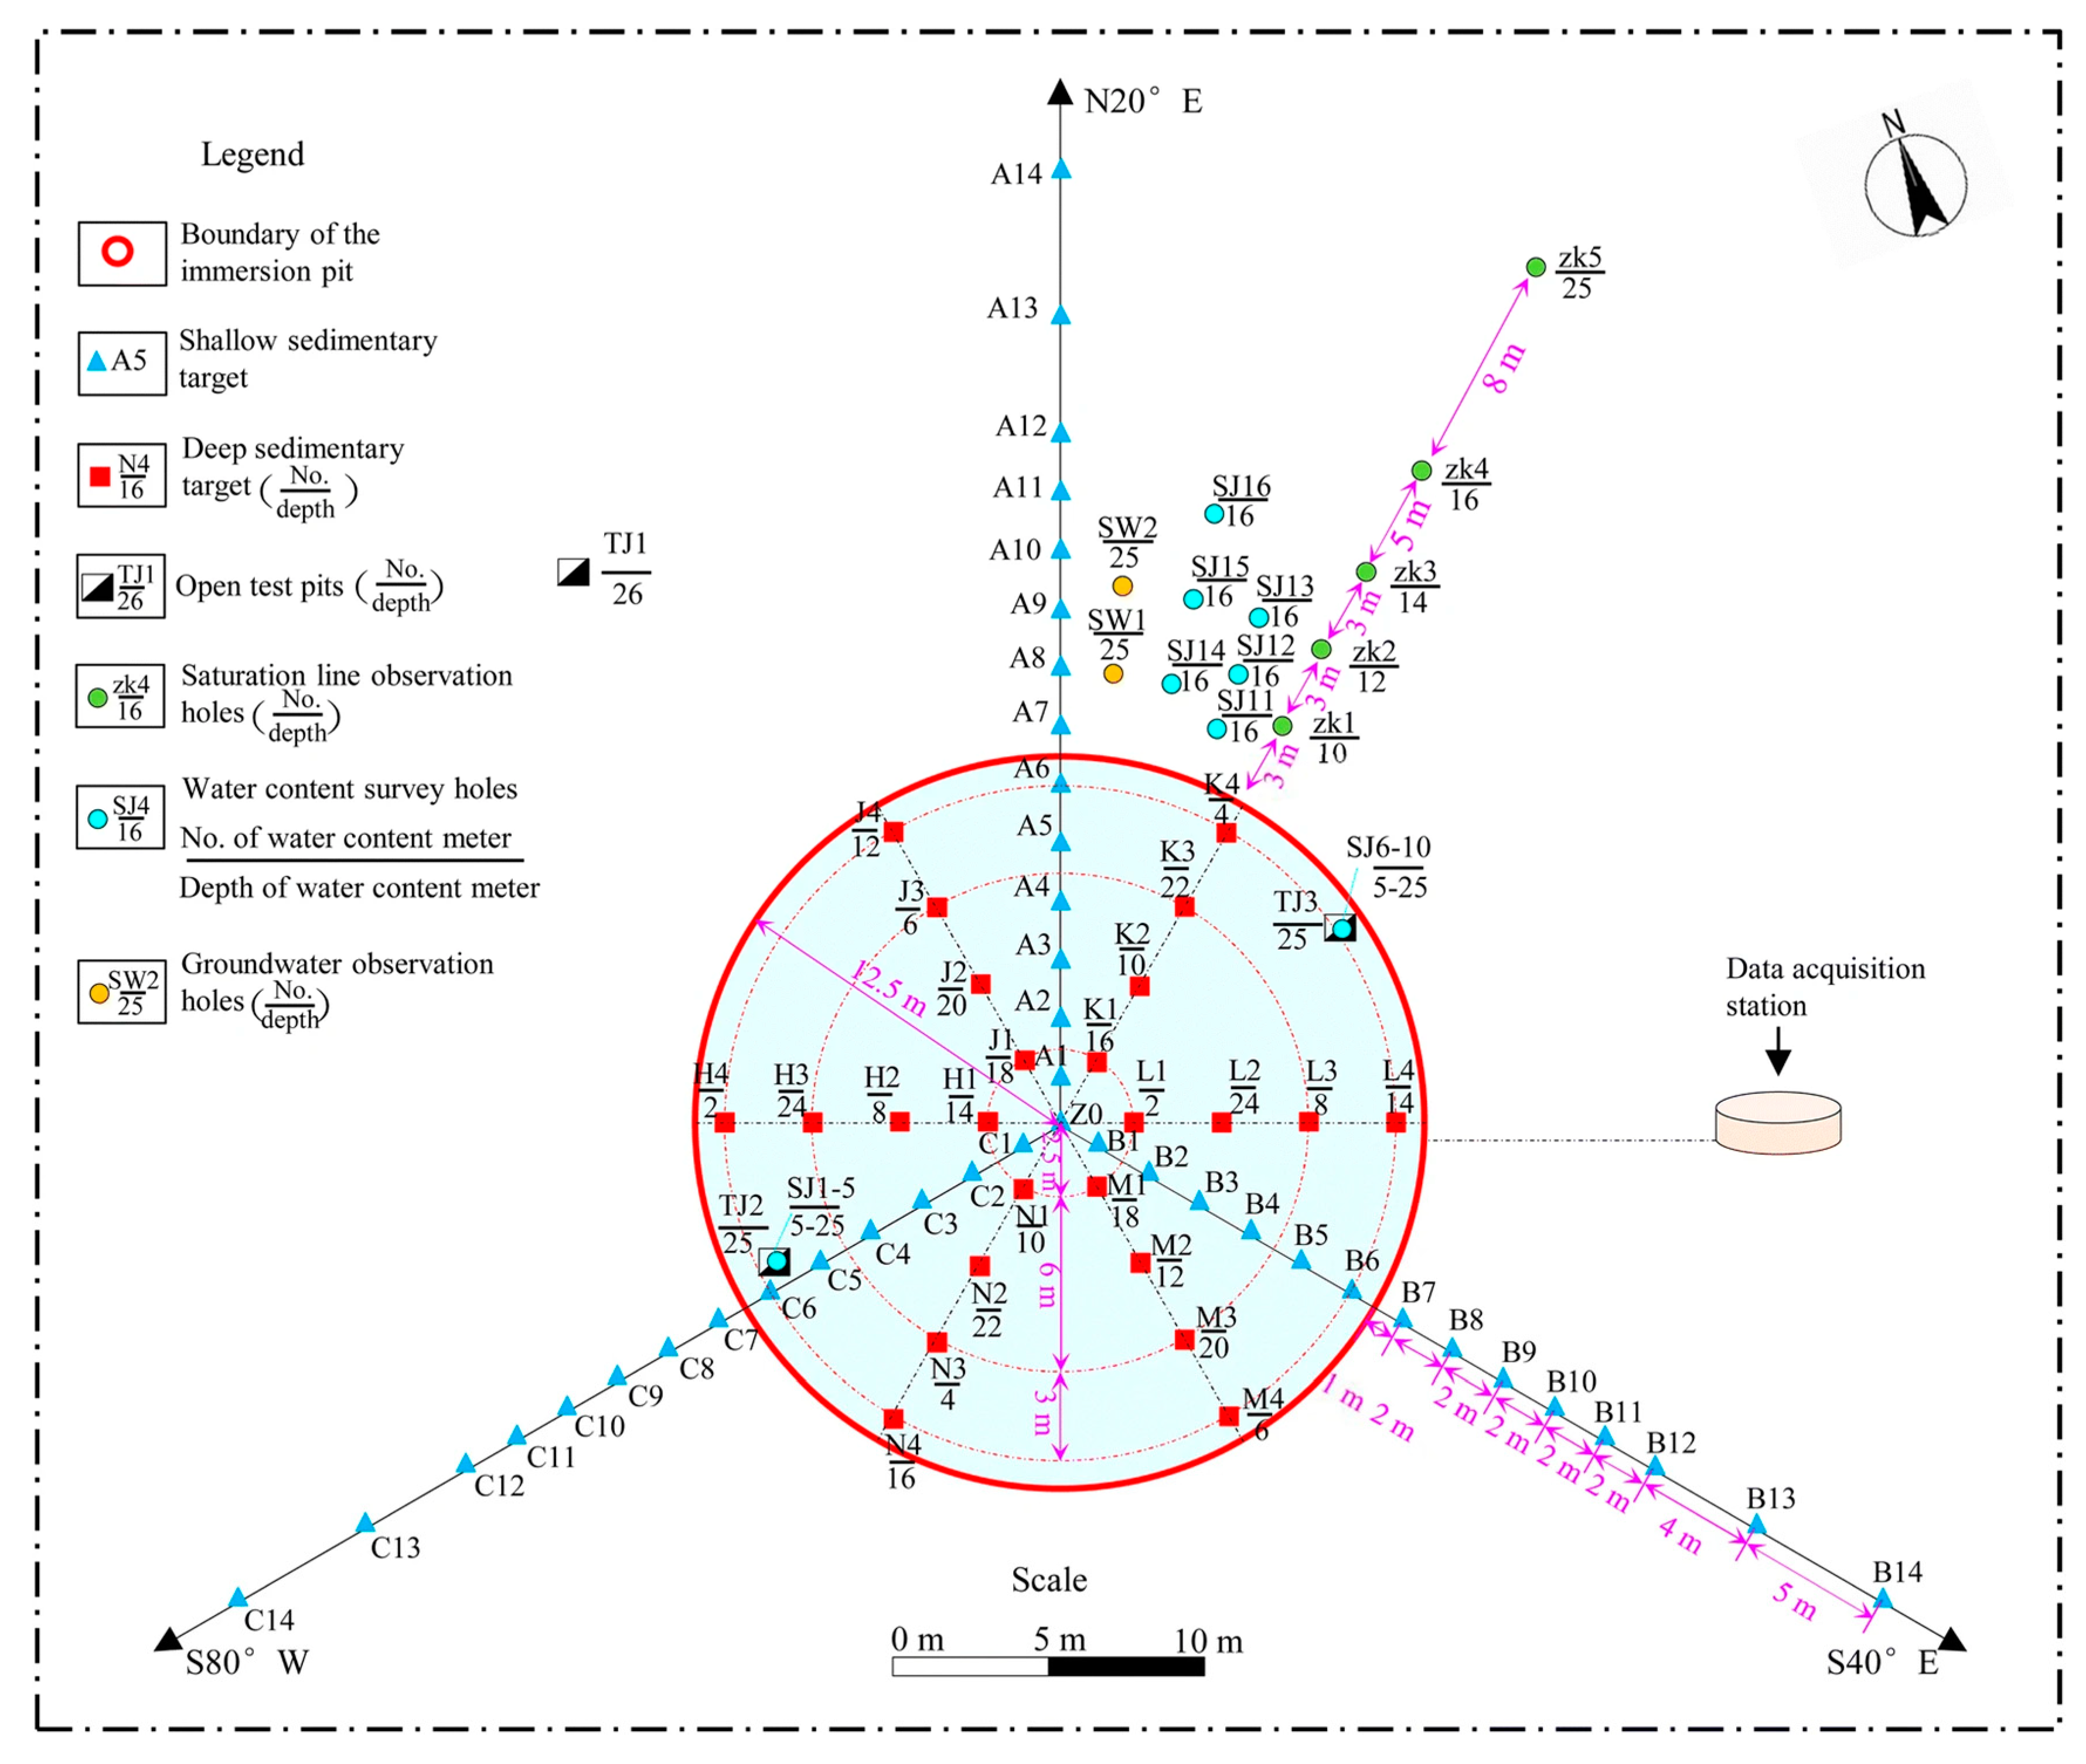
2.2. Field Test Scheme

In order to make the loess generate sufficient self-weight collapse under the saturated water immersion condition, the diameter and the depth of the test pit were set to 25.0 m and 0.5 m, in turn. The moisture meters placed at different depths and positions were used to monitor the changes in soil moisture content to obtain knowledge of the spatiotemporal variation law of water. A total of 43 shallow benchmark points were set to observe the surface settlement of the immersion test pit and its affected range. The experiment began on 28 November 2014 and ended on 14 January 2015, and settlement observations continued until 5 February 2015. The panoramic view of the immersion test pit is shown in Figure 2, while the layout of the moisture meters and shallow observation points are detailed in Figure 3.

2.3. Test Results and Analysis

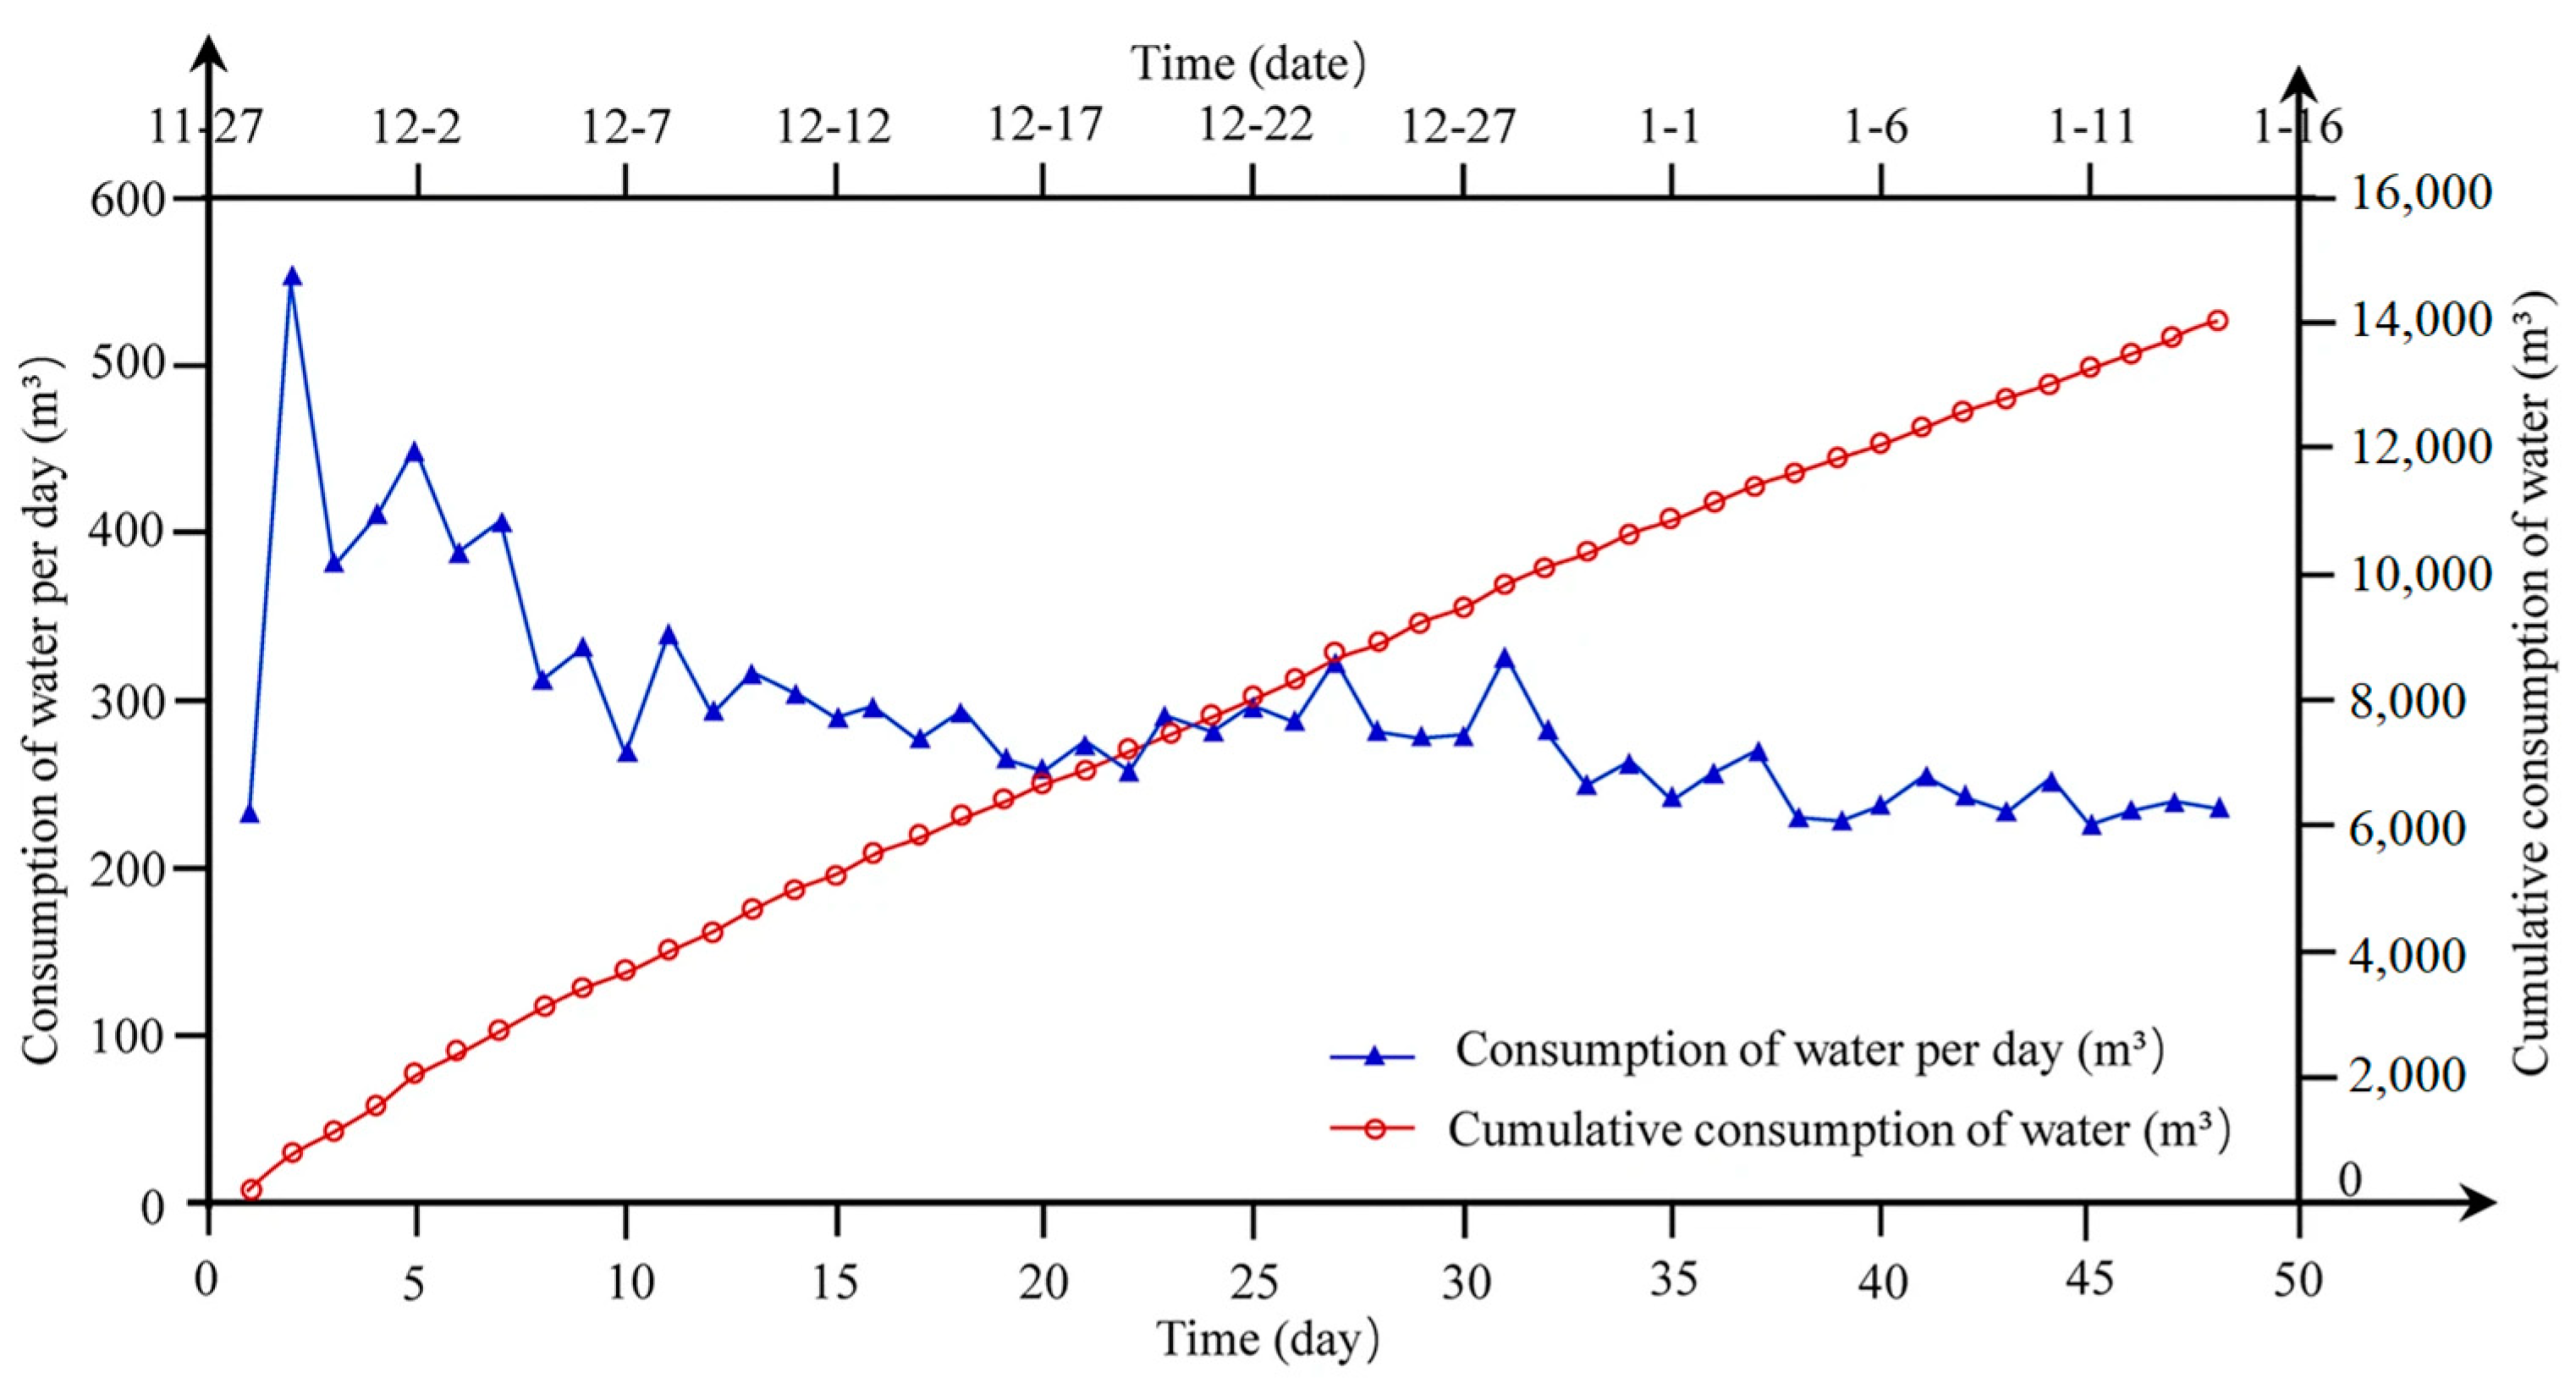
2.3.1. Water Consumption

The single-day and cumulative water consumptions are shown in Figure 4. The water consumption in the early stage of the test was large, and the maximum consumption was 550 m3, which occurred on the second day. Then, the daily consumption followed a declining trend and finally settled between 220 m3 and 280 m3. A total of 14,011 m3 water was used during the 48-day injection period. The effect of weather on the water injection volume was ignored because abnormal weather conditions, such as excessive evaporation or precipitation, did not appear during the experiment process.

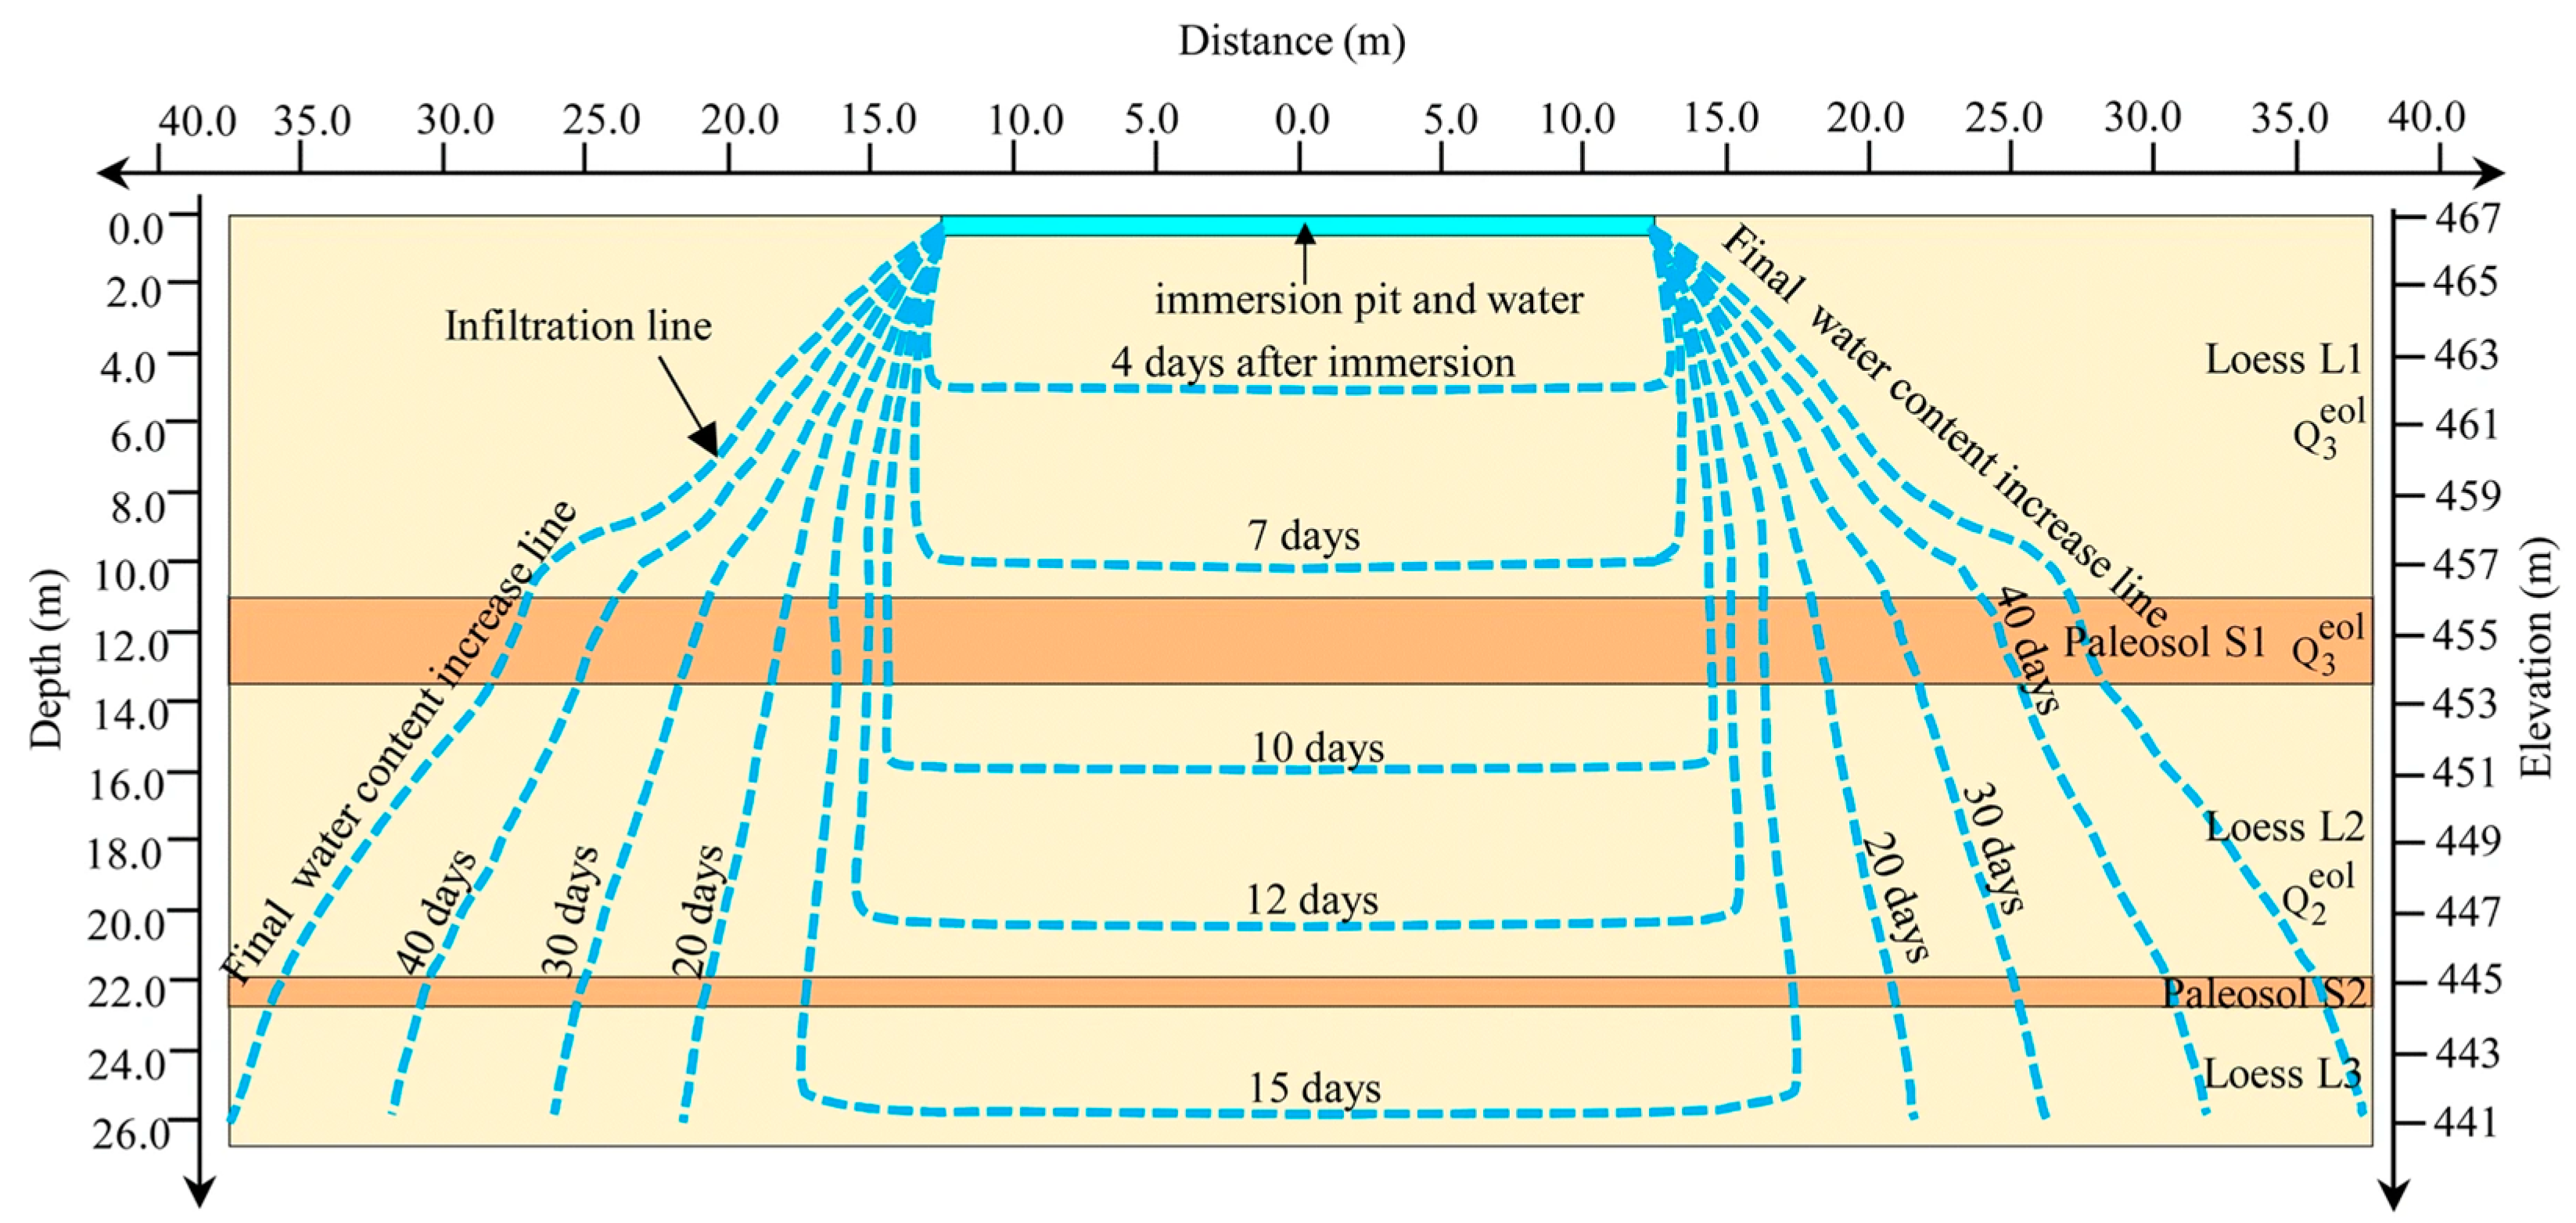
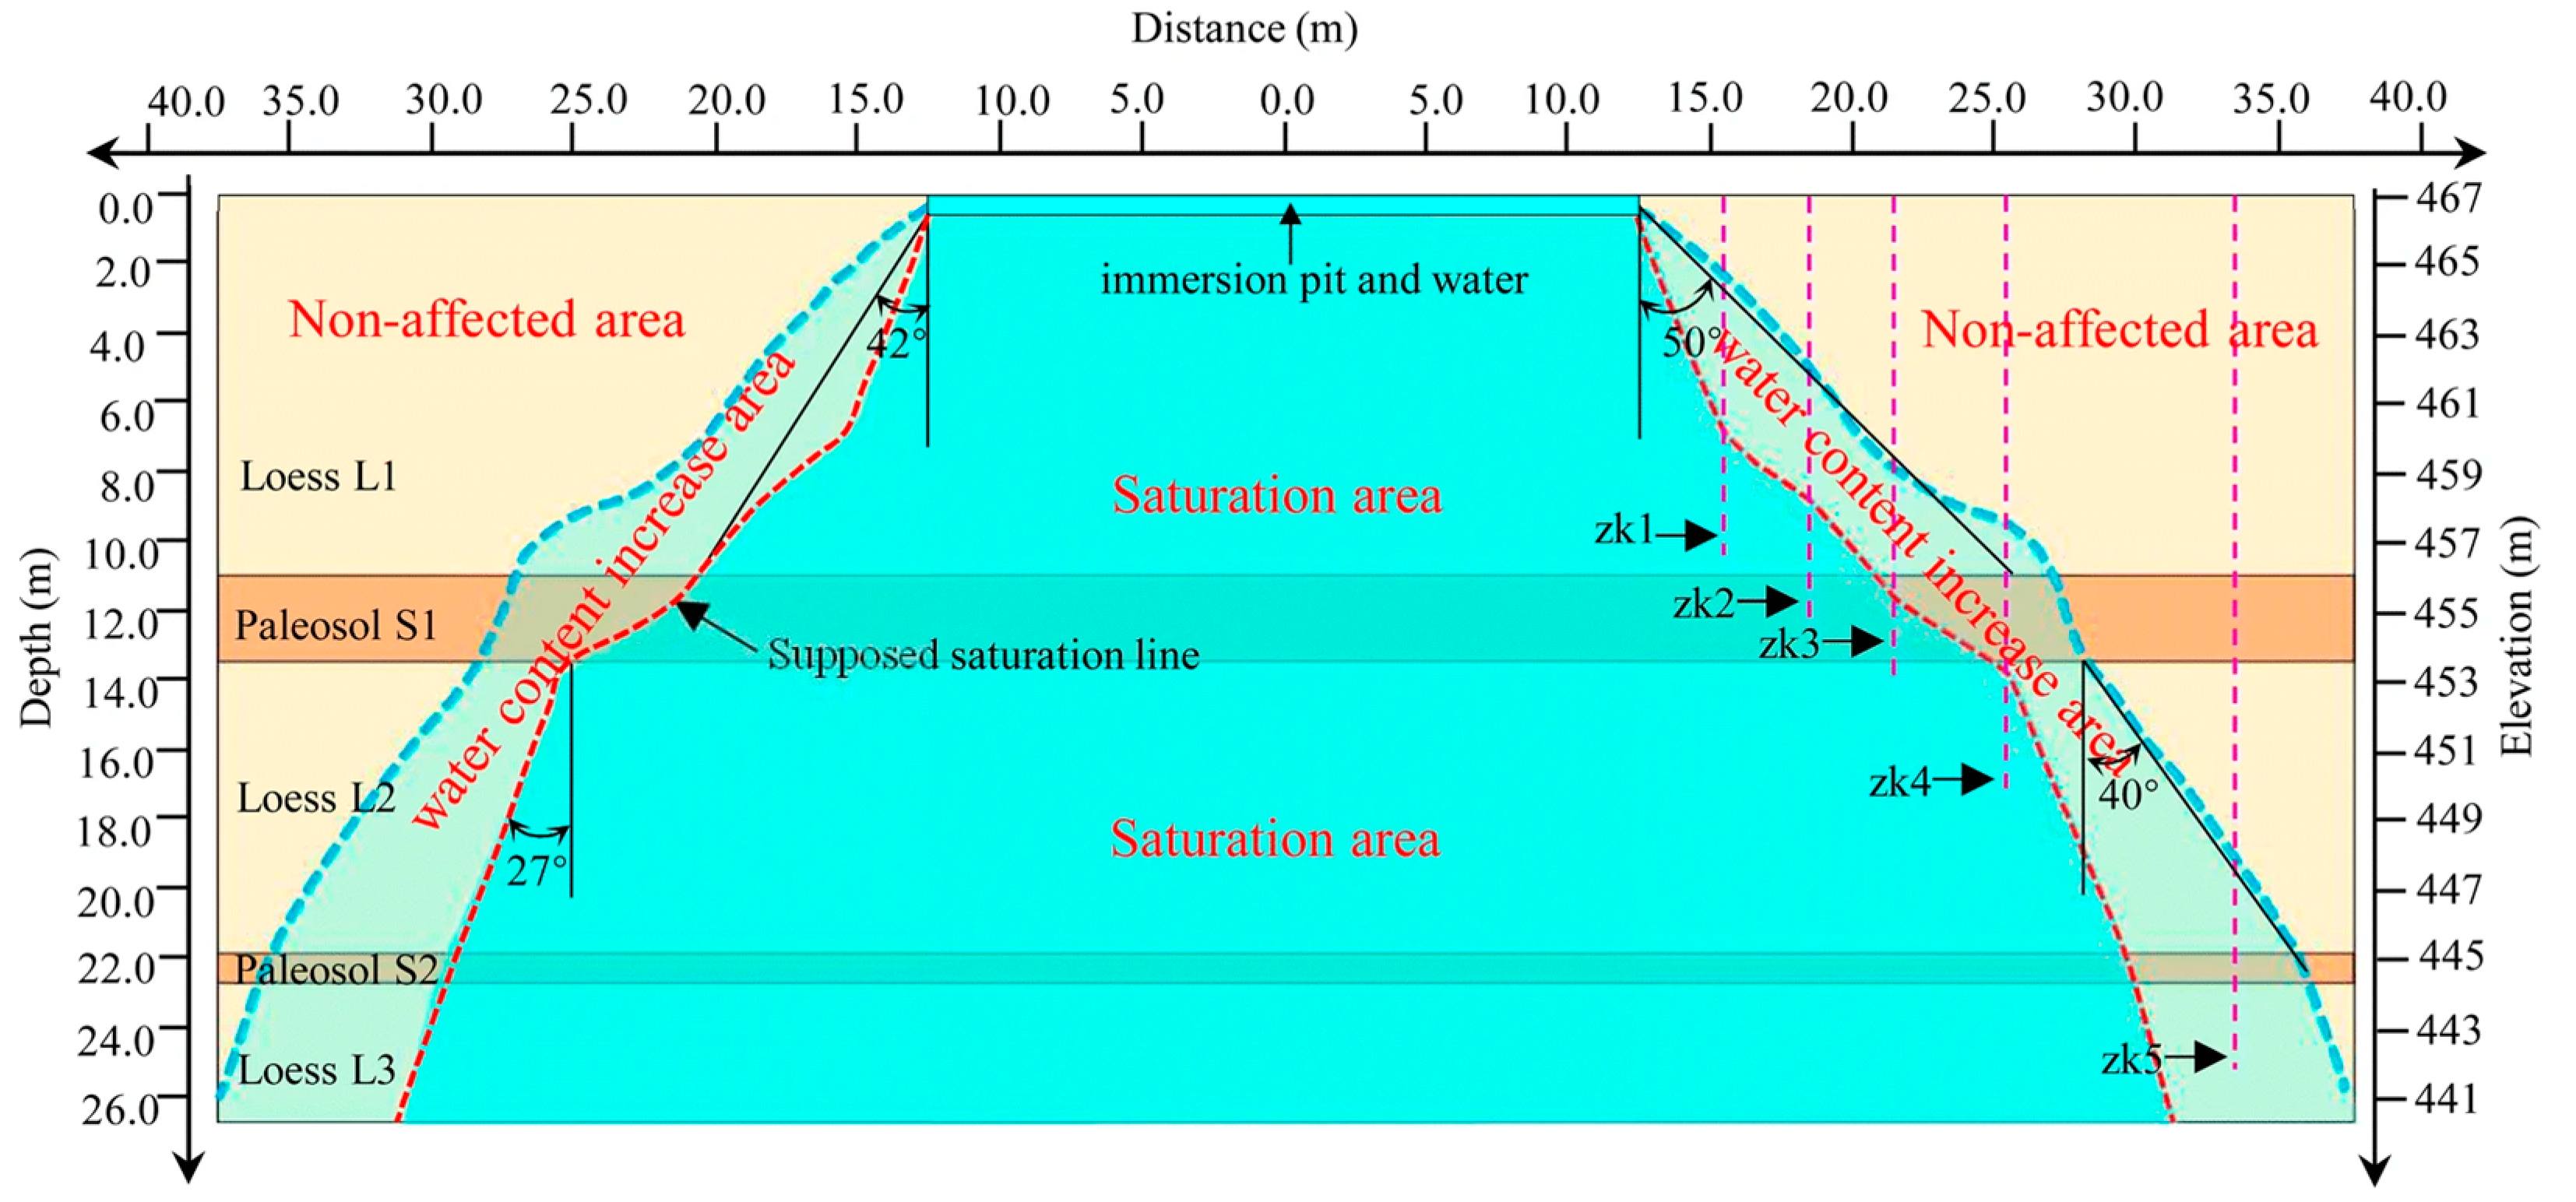
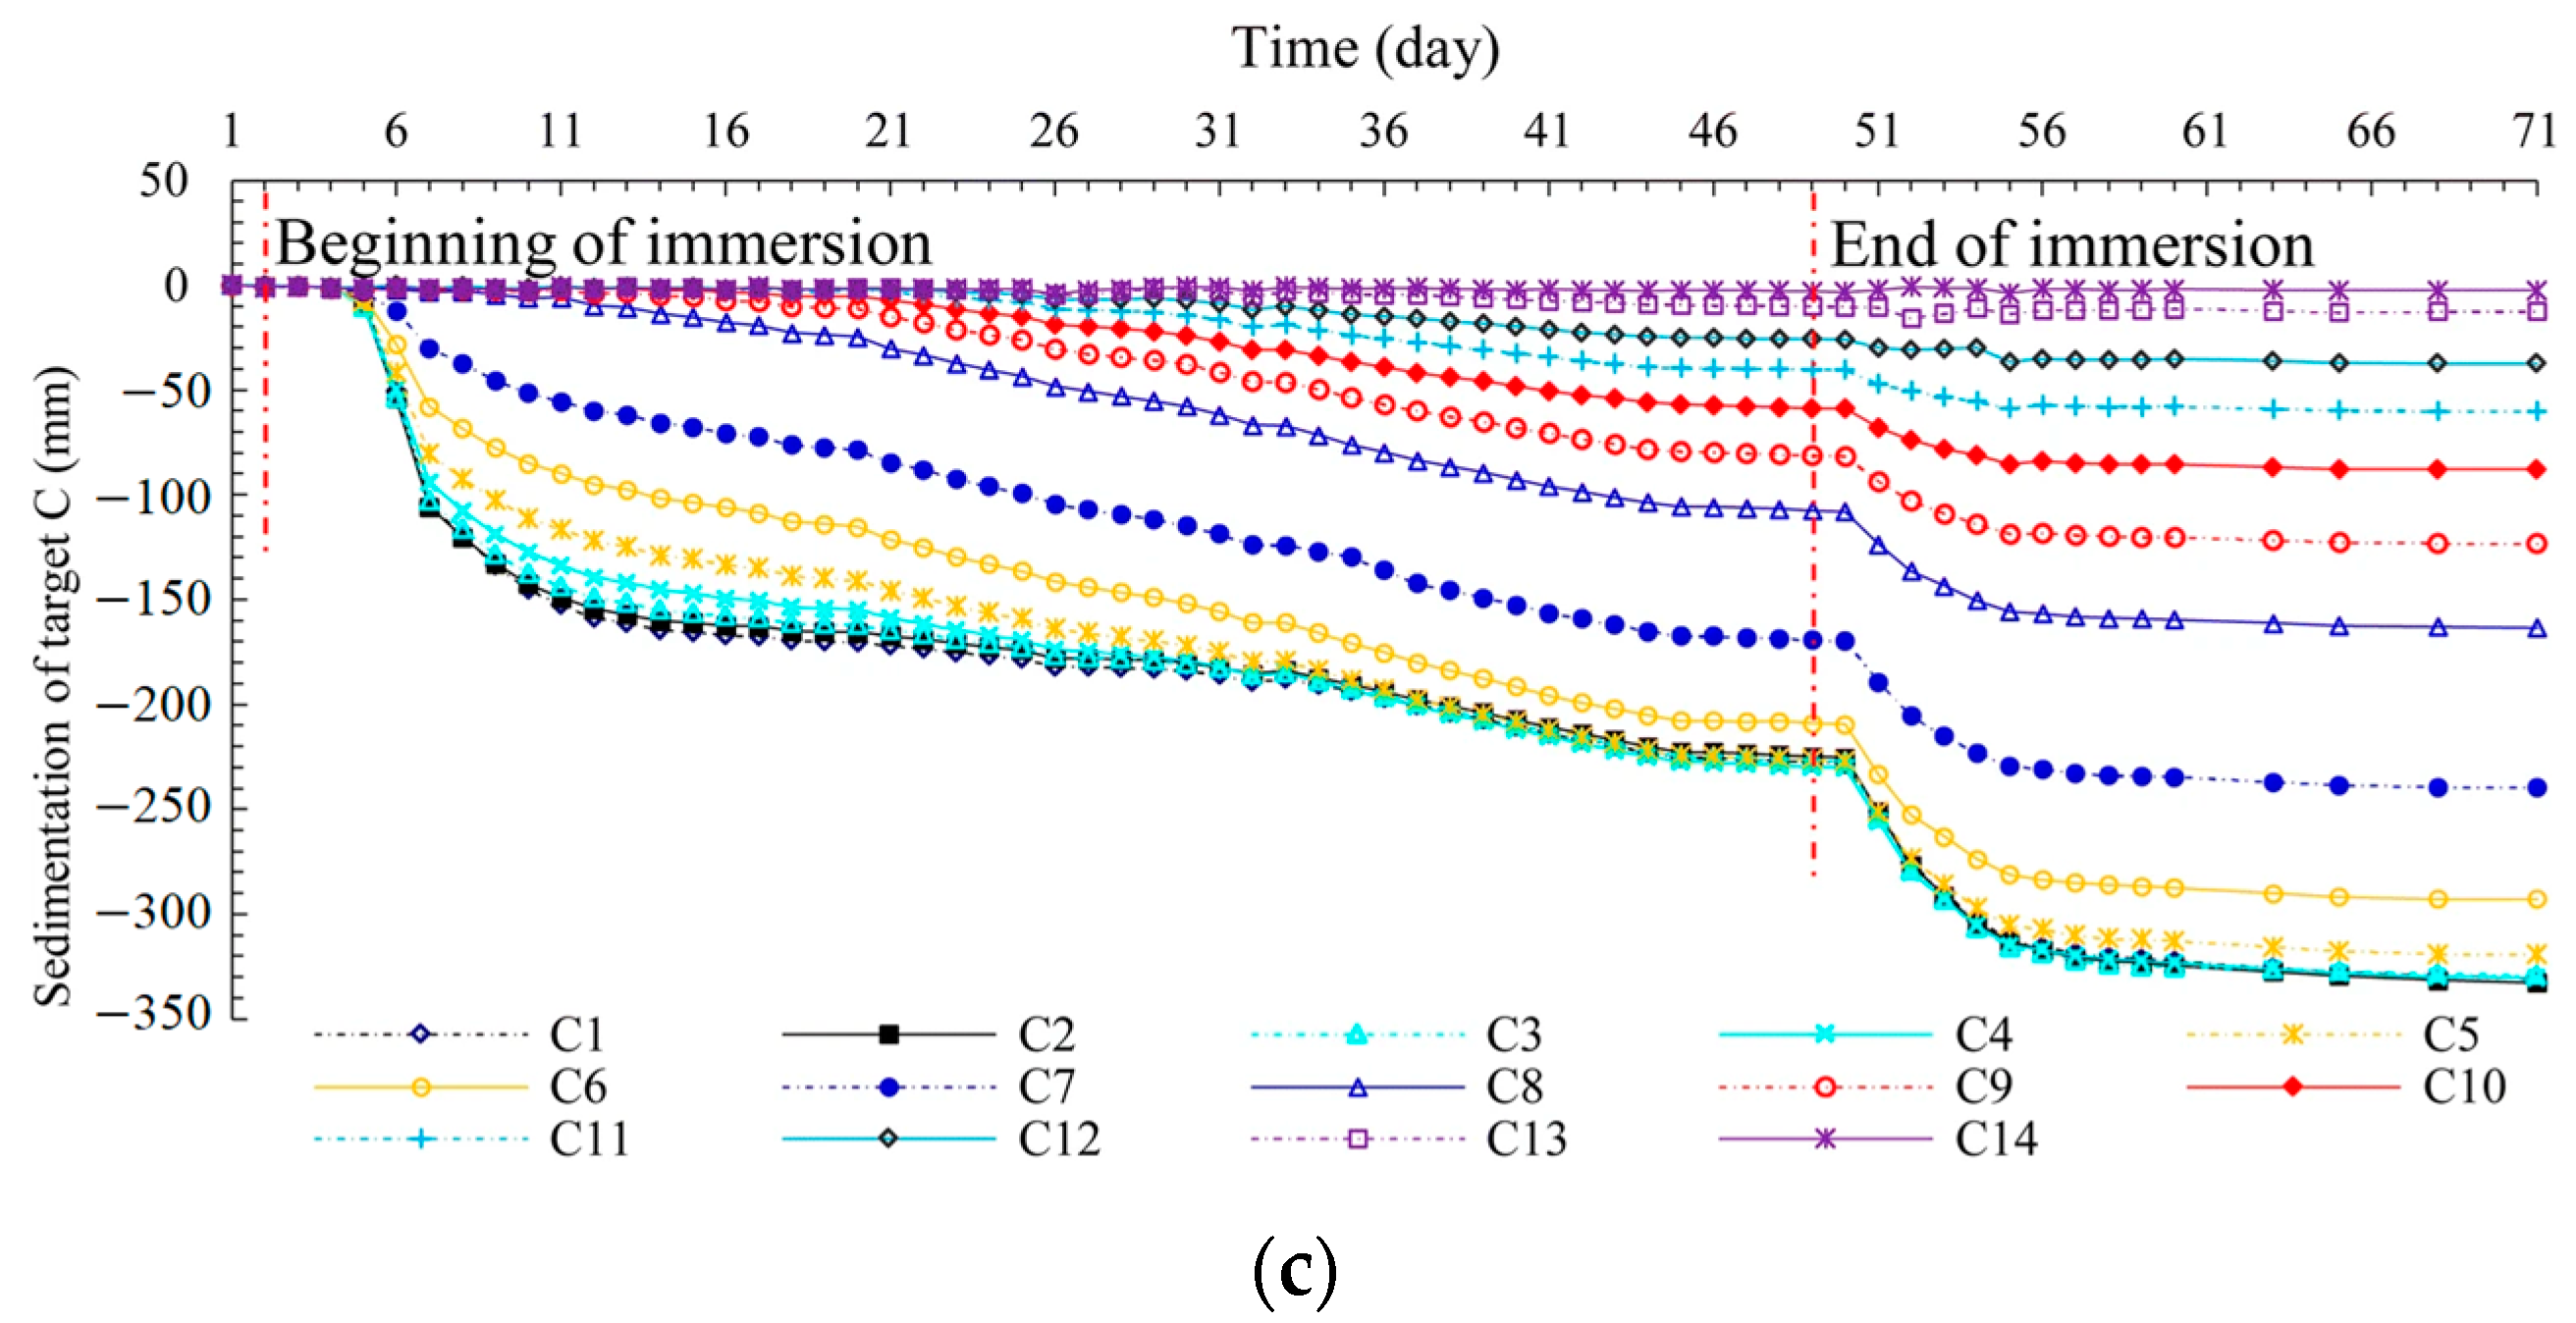
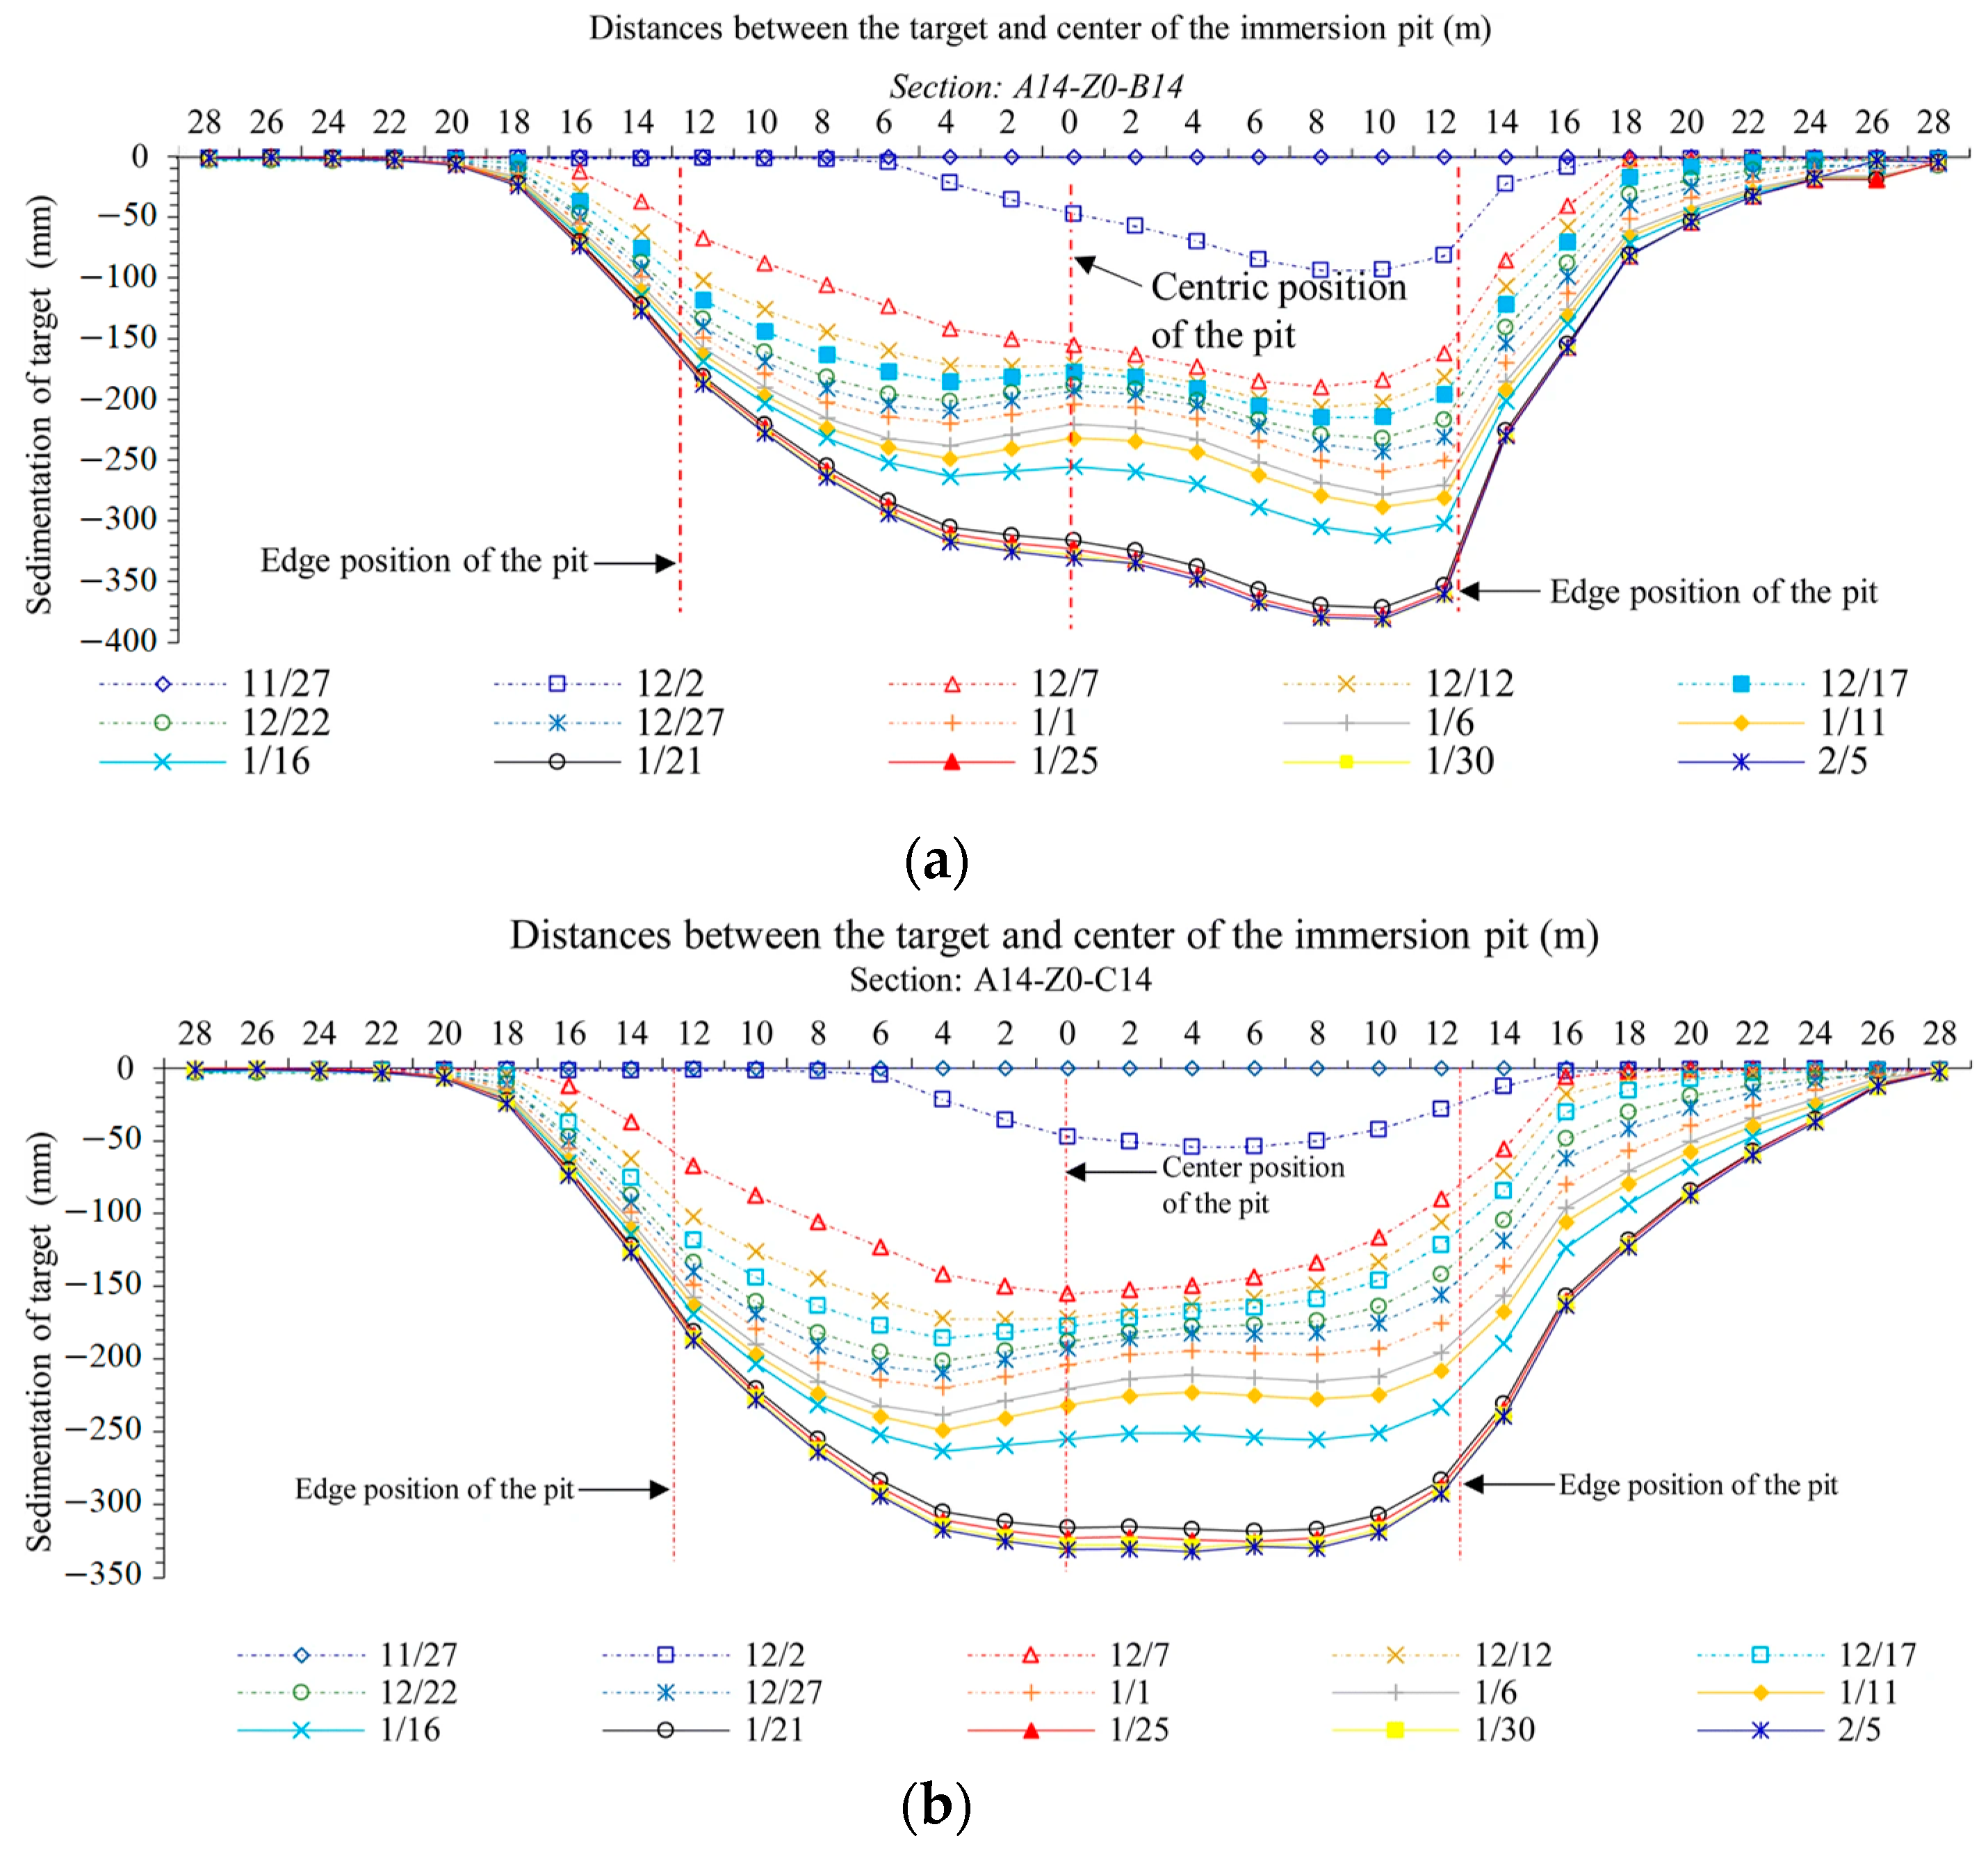
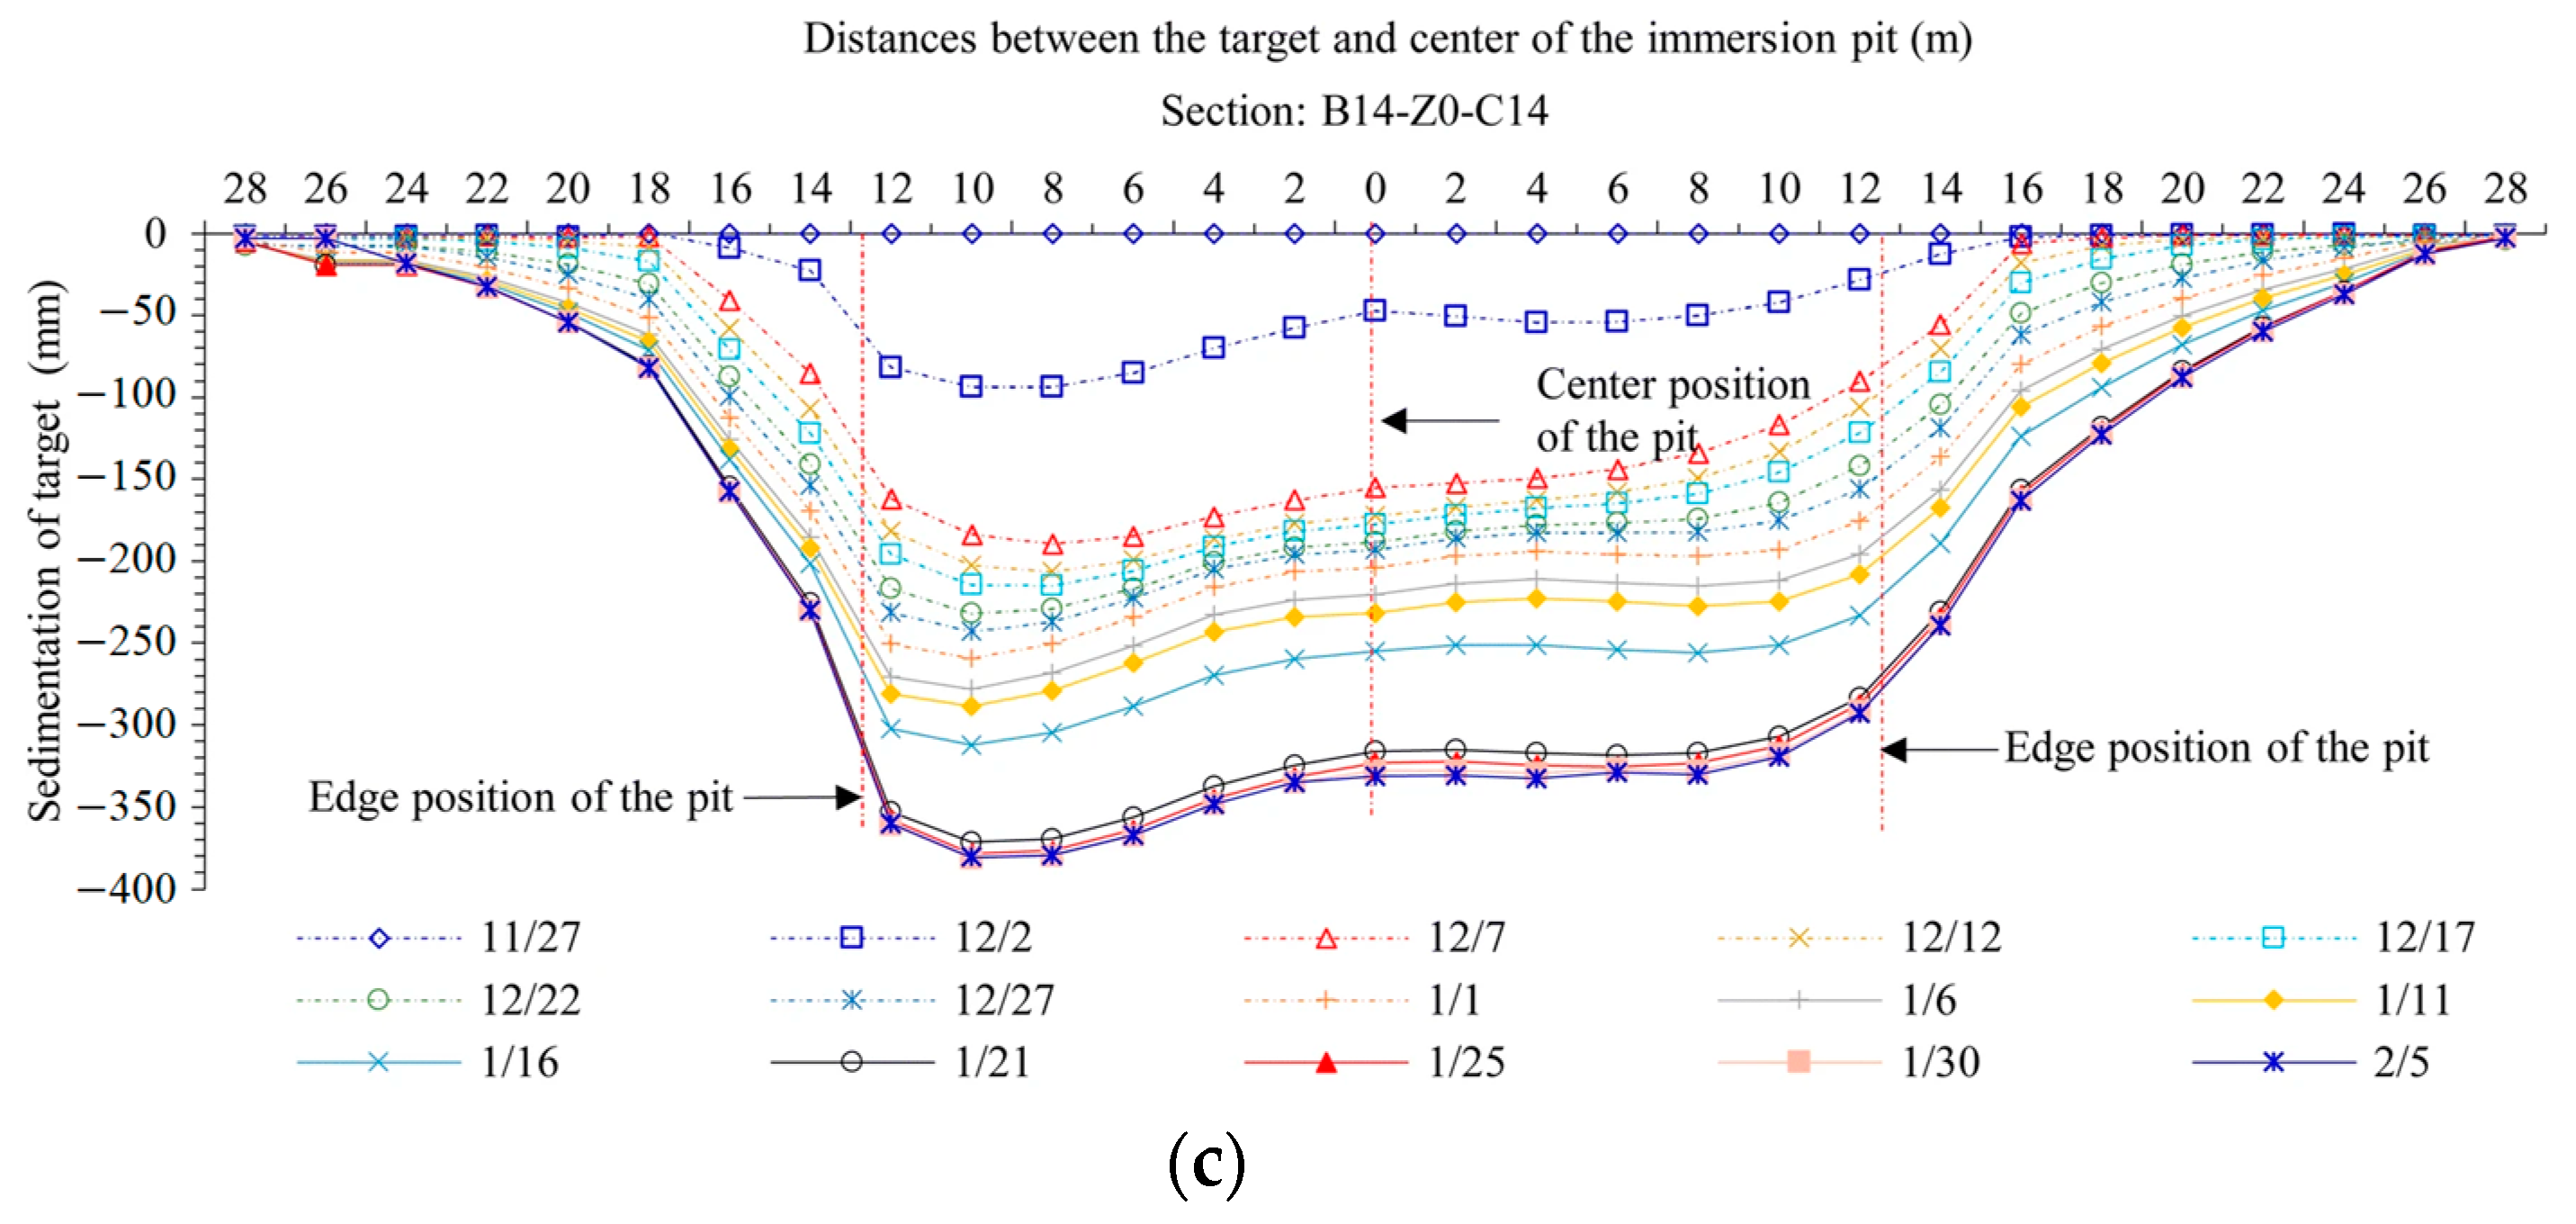
2.3.2. Characteristics of the Seepage Field

Figure 5 and Figure 6 present the infiltration and diffusion behavior of water in the Bu Li village test field, from which the infiltration range and the slope of the saturation boundaries can be determined. The water diffusion shape was approximately an inverted funnel, which slightly protruded horizontally in the upper paleosol with poor permeability. As the depth increased, the diffusion range and saturation zone continuously expanded. The dip angles of the saturation line were approximately 42° in the upper L1 layer, 27° in the lower L2 layer, and 36° overall, while the dip angles for the unsaturated boundary were approximately 50° and 40° in layers L1 and L2, respectively, and 44° overall. At the depth of 25 m, the scope of saturation and the infiltration line were 30.5 m and 37.5 m from the central axis of the pit, respectively.

2.3.3. Loess Collapsibility Evaluation

By summarizing the measured data from the on-site immersion test, the cumulative deformation curves of each shallow benchmark point over time are shown in Figure 7. The collapsibility process can be divided into five stages: slow settlement, rapid collapsibility deformation, tendency to stabilize, consolidated settlement, and tendency to stabilize. During the initial stage, there was a settlement with a slow rate at each benchmark point. When the immersion test was carried out for 5–10 days, the settlement rate increased exponentially, and it gradually decreased after 11 days. After the water injection stopped, the settlement increased significantly within the first 5 days and then remained at a fixed value without further changes.
The cumulative settlement curves labeled A-B, A-C, and B-C, which combine the measured data of each shallow benchmark point, are shown in Figure 8. The surface settlement was distributed symmetrically around the center of the pit (Z0 mark), and the overall settlement shape exhibited a U shape. The consolidation settlement did not vary significantly with the depth, but it decreased with the increasing distance from the pit edge, which was believed to be related to the moisture diffusion. The maximum consolidation settlement was observed at the shallow mark B5, and the final value was 380.5 mm.

3. Microscopic Collapsibility Mechanism

3.1. Natural Moisture Content and Void Ratio

The soil samples were taken at vertical intervals of 1 m in the exploratory well to investigate the relationships between natural moisture content, void ratio, and collapsibility coefficient, as shown in Figure 9. The collapsibility coefficient was negatively correlated with natural moisture content, and it increased gradually as the void ratio increased. The void ratio and collapsibility coefficient decreased with the increasing depth because the pores in loess were filled with particles under the effects of water and load, followed by the reduction of the collapsibility coefficient.
The concept of collapsibility potential, defined as the possibility of collapsibility, was proposed. The collapsibility potential of loess became greater with the smaller natural moisture content and larger void ratio, which was not a variable but an initial property of loess at the natural state, reflecting the variation of indexes and the possibility of loess collapse by water. It could be concluded that the collapsibility potential varied with the depth in the same field, resulting in the different collapsibility indexes of loess.

3.2. Material Composition of Loess

The material composition of loess significantly affected its collapsibility, on which the effects of the particle size composition, mineral composition, and water-soluble salt composition were analyzed. An exploratory well was excavated 30 m away from the immersion test pit, and six samples of new loess were taken at the 3-1-1 new loess with a depth interval of 2.0 m. Sieve analysis, densitometer method, and X-ray diffraction were adopted to obtain the composition characteristic of loess.
The particle size compositions of the soil samples are presented in Table 2. It can be concluded that the main component of the soil was silt, followed by clay, and finally sand, whose average contents were 74%, 19%, and 7%, in turn. Moreover, the relationship between the clay content and the collapsibility properties was consistent with the regional characteristics of the loess area, and the clay content could reflect the sensitivity of the collapsibility.
Table 3 presents the mineral composition of loess in Bu Li village. Illite, montmorillonite, kaolinite, and chlorite were the main components of clay minerals in the loess tableland area, with an average content of 18%. Due to the weakening effect of clay minerals on the bonding force between soil particles, the extent of collapsibility in the loess tableland area was intensified.
The results of water-soluble salt content in the loess tableland are shown in Table 4. The content of the insoluble salt was the highest, followed by moderately soluble salt, and finally soluble salt, and the corresponding contents were 14.3%, 0.20%, and 0.08%, in turn. After soaking the loess, the volume and thickness of the bonding materials between soil particles decreased, owing to the dissolution of moderately and highly soluble salts, while the insoluble salt was not easily dissolved, determining the residual strength of the bonding materials. The bonding material fractured when the residual strength could not resist external forces that moved soil particles. Eventually, collapsibility occurred due to the low stiffness and strength of the soil structure.

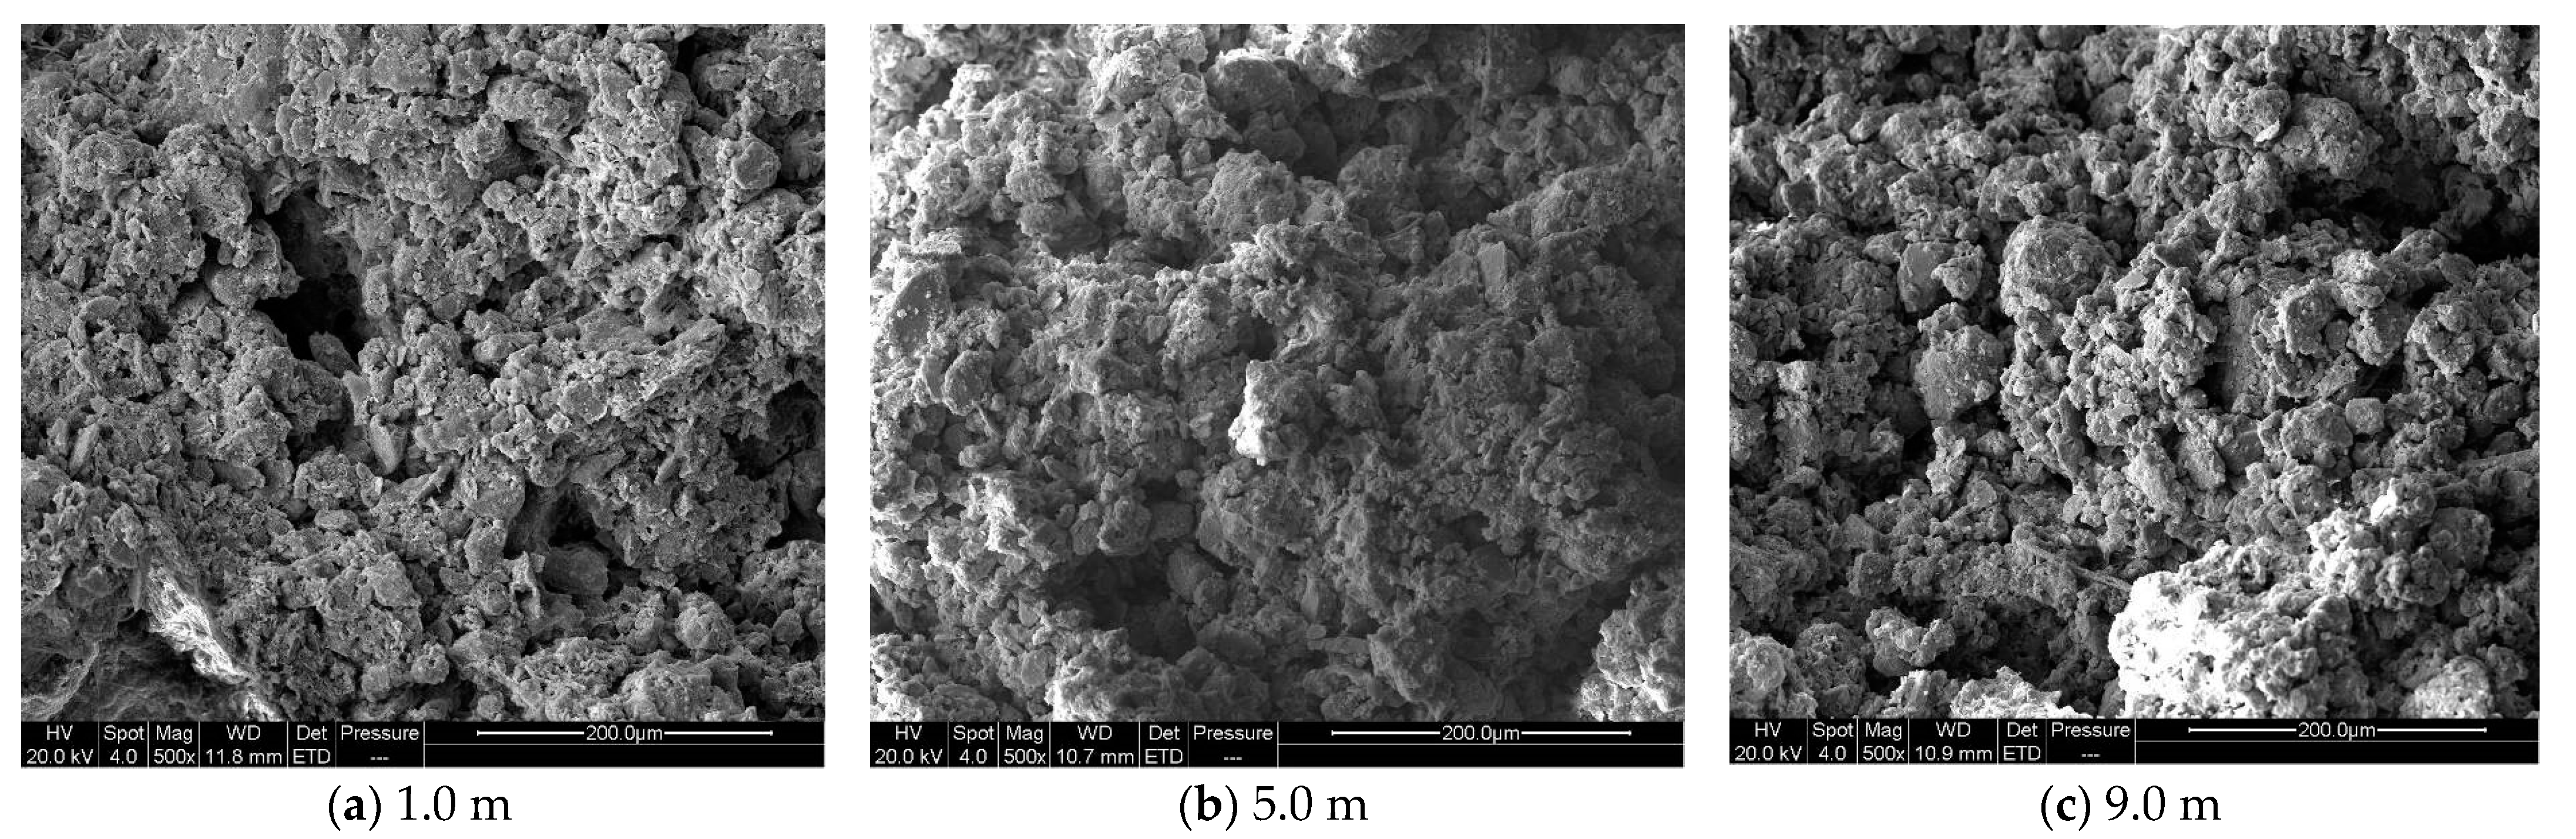
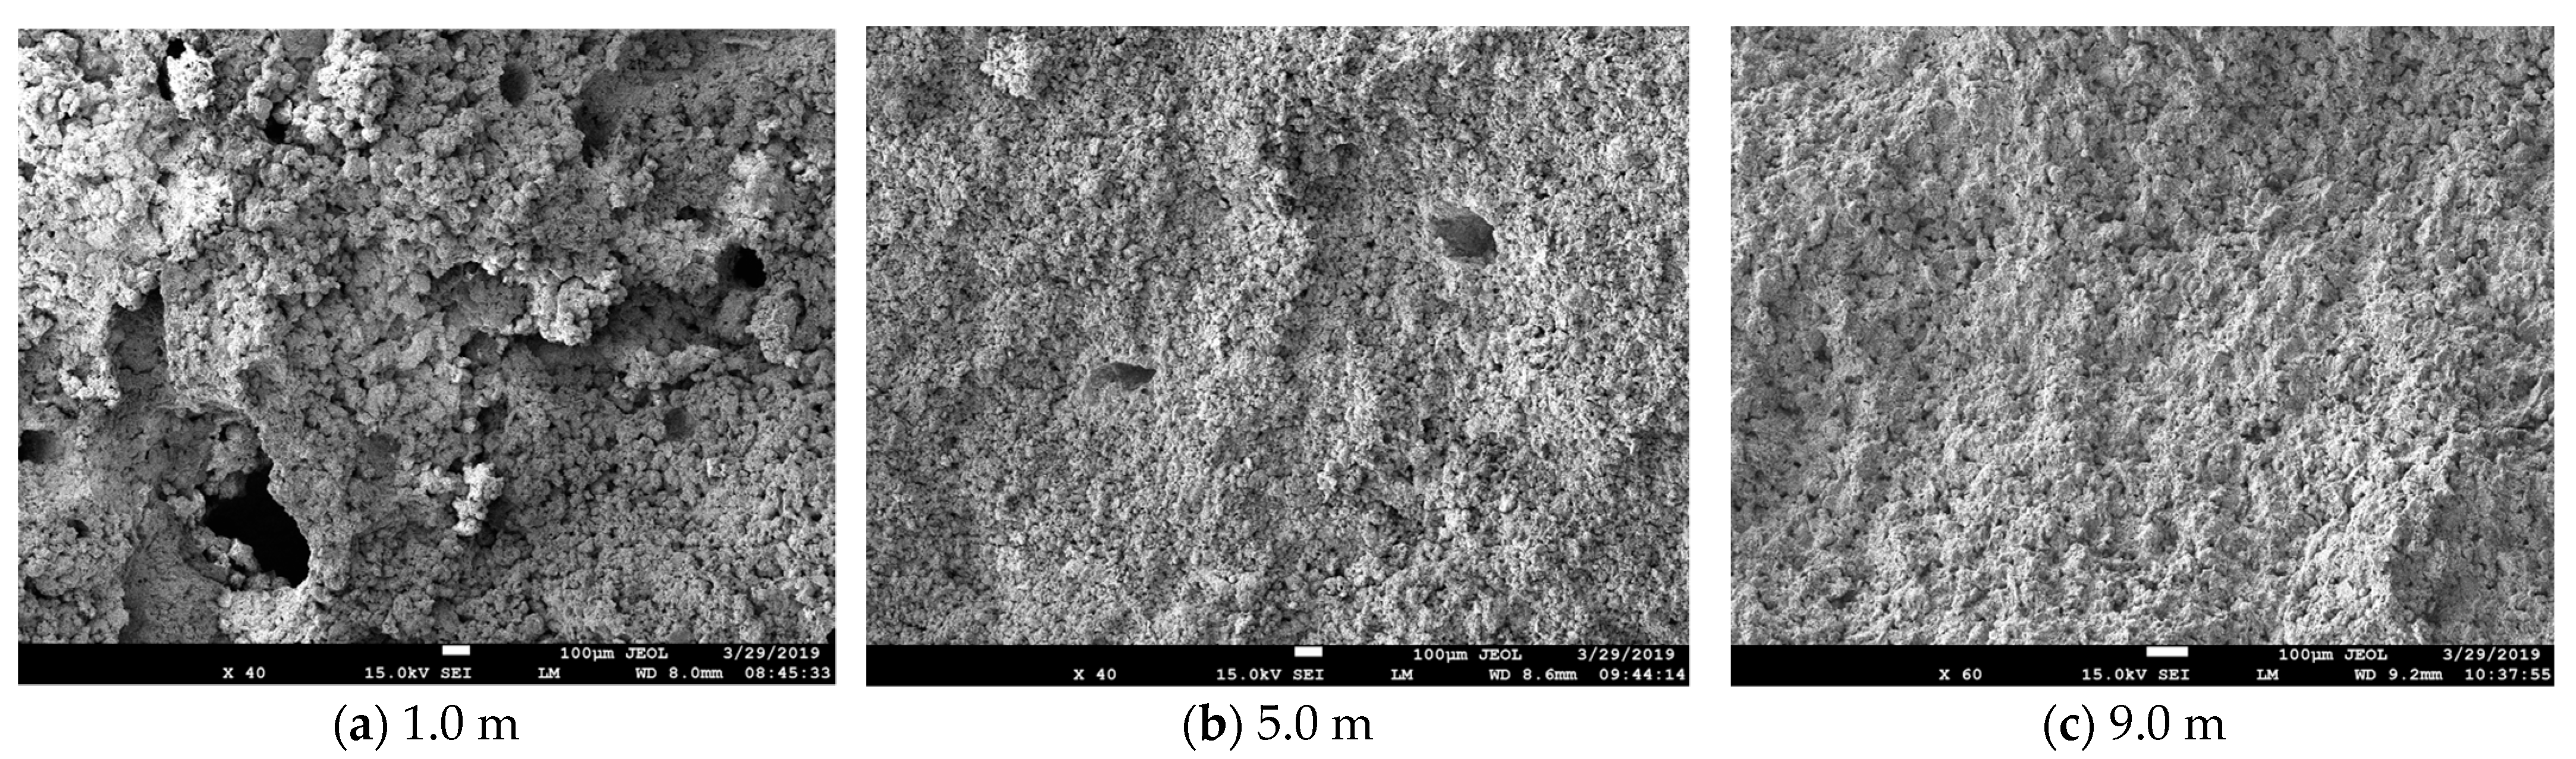
3.3. Microstructure Evolution of Loess

The physical and mechanical properties of soil were determined by the microstructure, whose characteristics consisted of particle arrangement modes, pore structure features, and cementation forms [26]. The particle arrangement modes were the most significant factors affecting loess collapsibility. They can be divided into three arrangements: bracket, bracket–inlaid, and inlaid. The collapsibility proneness of loess decreased, in turn. There were two forms for the pore structure in loess: bracketed-micropore and inlaid-micropore. The former, with positive connectivity and strong water permeability under dry conditions, was susceptible to instability by water, while the latter, with fissures, was formed by tightly packed framework particles, which were relatively stable under the effects of water and pressure. Particle cementation was another vital factor for the loess collapsibility, and cementation sites were prone to stress concentration and damage under a load [27,28].
Soil samples were taken from the test pit at various depths. Using the scanning electron microscope, the microstructure of loess was studied at depths of 1.0 m, 5.0 m, and 9.0 m before and after water immersion. The framework particles, pore structures, and cementation types are summarized in Table 5. As shown in Figure 10, the framework particles of the 3-1-1 new loess were arranged in a bracket before immersion. The skeleton particles were embedded in the fine material, but the outline was clear. The skeleton particles were loosely arranged and supported each other, forming the scaffold macropore, and the loose arrangement between particles provided the basic condition for collapse because of the characteristics of water permeability, poor stability, and cementation. As presented in Figure 11, the arrangement of framework particles was changed from bracket to bracket-inlaid after immersion. The content of fine particles was higher and constituted the matrix in which the skeleton particles were embedded. The skeleton particles were closely arranged, which can be clearly seen; the arrangement mode was mainly inlaid, and the soil was relatively dense [2]. The number of bracketed micropores was greatly reduced due to the redistribution of soil particles after the collapse, and the pores were filled with clay and fine particles, causing lower pore connectivity. Finally, a stable, interlocking, inlaid-micropore, and semi-cemented structure was formed, owing to the evaporation of water.
According to the comparative analysis results of the microstructure of the loess tableland before and after immersion, it can be concluded that the collapsibility of loess was closely related to its microstructural characteristics. The arrangement of skeleton particles was the basic condition for collapsibility of loess, and it determined the pore characteristics in soil to a large extent. In addition, the strength of the cementation body was affected by the microstructure of soil; the weak cementation strength was caused by the small contact area between the cement body and the soil particles, while the pores have good connectivity, strong permeability, and poor water stability. As a result, the connection strength between the skeleton particles was low and easily damaged by the action of water. Therefore, the overall structural strength of the loess tableland was poor.

3.4. Collapsible Mechanisms of Loess

Loess is a porous and multiphase structure, which consists of scattered sand particles, coarse silt particles, and cementing materials, such as fine silt particles and clay particles [29]. The material composition and structural characteristics of loess were the critical factors for the occurrence of collapsibility. The cementing materials determining the structural strength of loess were damaged with the expansion of clay minerals (illite and montmorillonite) and the dissolution of soluble salts during wetting, and the moisture was prone to diffuse in the loess arranged in a bracket with pore connectivity and permeability. The cementing strength diminished as the reduced bonding area between cementing bodies and soil particles; then, the cementing bodiesfractured, owing to the inability to resist water infiltration and soil weight. Finally, the soil particles were compacted into the pore area, as well as continuously compressed and drained, characterized by collapsibility. A higher-strength cementing body was formed by the clay among the soil particles after stopping water injection. With the moisture decreased, the pore connectivity of the soil was reduced, and a stable structure (inlaid arrangement) with weak collapsibility emerged.
In other words, the integration of multiple factors—i.e., formation environment, collapse potential, material composition, microstructure, and external conditions—results in the complex mechanism of loess collapse [22]. Moreover, the essential reason for the collapse was the soil structure destruction by water, and the extent of loess collapse depended on the collapse potential at the initial state.

4. Water Diffusion Morphology in Collapsible Loess

4.1. Numerical Modeling

A numerical model simulating the water diffusion morphology in collapsible loess was established based on the prototype of the in-situ pit immersion test. The water pit with a diameter of 20 m and a depth of 1 m was located in the middle of the model, and the groundwater level was set at a depth of 60 m below the surface.

4.1.1. Principles and Method

The commercial software SEEP/W is a widely used finite element analysis tool for saturated–unsaturated seepage, which can solve water transport and pore water pressure distribution in porous media. Based on unsaturated soil theory, SEEP/W considers soil water content and permeability as continuous functions of matric suction, represented by the soil water characteristic curve and the hydraulic conductivity curve, respectively. Its flow law is still Darcy’s law, and the governing equation and basic principles of two-dimensional saturated–unsaturated seepage analysis are the same, as shown in Equation (1):
x K x ψ x + y K y ψ y = m 2 w γ w ψ t
where Kx and Ky are the permeability coefficients of the soil element in the x and y directions, mw2 is the slope of the soil water characteristic curve corresponding to matric suction (or pore water pressure), gw is the specific weight of water, and y is the matric suction (or pore water pressure). This governing equation is based only on continuity and Darcy’s law, without considering volume change during seepage. For saturated soil, the slope of the water retention curve is zero (i.e., the water content does not change with positive pore water pressure changes), so Equation (1) has the same form as the governing equation for saturated seepage. In Equation (1), y can be positive or negative, representing positive pore water pressure and matric suction, respectively, so Equation (1) can conveniently unify saturated and unsaturated seepage for analysis.
During calculation, the water retention curve is inputted based on experimental results or empirical values, and Van Genuchten’s method for deriving the unsaturated hydraulic conductivity using the water retention curve and saturated hydraulic conductivity can be employed:
K θ = K s 1 a ψ n 1 1 + a ψ n m 2 1 + a ψ n m / 2
where K(q) is the hydraulic conductivity, Ks is the saturated hydraulic conductivity, q is the volume water content, y is the matric suction, n is 1/(1 − m), and a and m are curve fitting parameters, as shown in Equations (3)–(6):
S p = 1 θ s θ r d θ p d log ψ p
m = 1 exp 0.8 S p
When 0 ≤ Sp ≤ 1,
m = 1 0 . 5755 S p + 0.1 S p 2 + 0.025 S p 3
When Sp > 1,
a = 1 ψ 2 1 / m 1 1 m
SEEP/W assumes that the matric suction is simplified as negative pore water pressure, with the pore air pressure assumed to be equal to atmospheric pressure, which can simulate water transport in the saturated zone, unsaturated zone, and interface between them well. SEEP/W can be used to solve various problems of saturated and unsaturated seepage, such as rainfall infiltration, leakage of reservoirs, dissipation of excess pore water pressure, and other complex transient flow problems. Flow boundary conditions can be set as flow boundaries or hydraulic head boundaries with time as a variable in SEEP/W. Long-term application practices [30,31,32,33] have proven the reliability of SEEP/W in analyzing saturated–unsaturated seepage problems and demonstrated the feasibility of using it for two-dimensional saturated–unsaturated seepage analysis.

4.1.2. Design Parameters

Thirteen working conditions were designed considering the characteristics of collapsible loess in different regions of China, including the lithology characteristic, initial water content by volume, stratum combination, and thickness combination, which were divided into three groups according to different stratum combinations. The detailed design parameters are presented in Table 6, Table 7 and Table 8.

4.1.3. Model Size

The models were developed with a length of 110 m and a width of 80 m, and the mesh size was set to 1 m for the accuracy and prevention of boundary effects on the numerical calculation results.

4.1.4. Boundary Conditions

The water pit in the upper part of the models was treated as an infiltration boundary with a position waterhead of 79.5 m, consistent with the boundary conditions of the in-situ pit immersion test. Default values were adopted at the bottom, sides, and other nodes of the models.

4.1.5. Model Verification

Based on the thickness and combination of soil layers of the in-situ pit immersion test, a model for comparation and verification was established. The model is in good agreement with the test results in Figure 12.

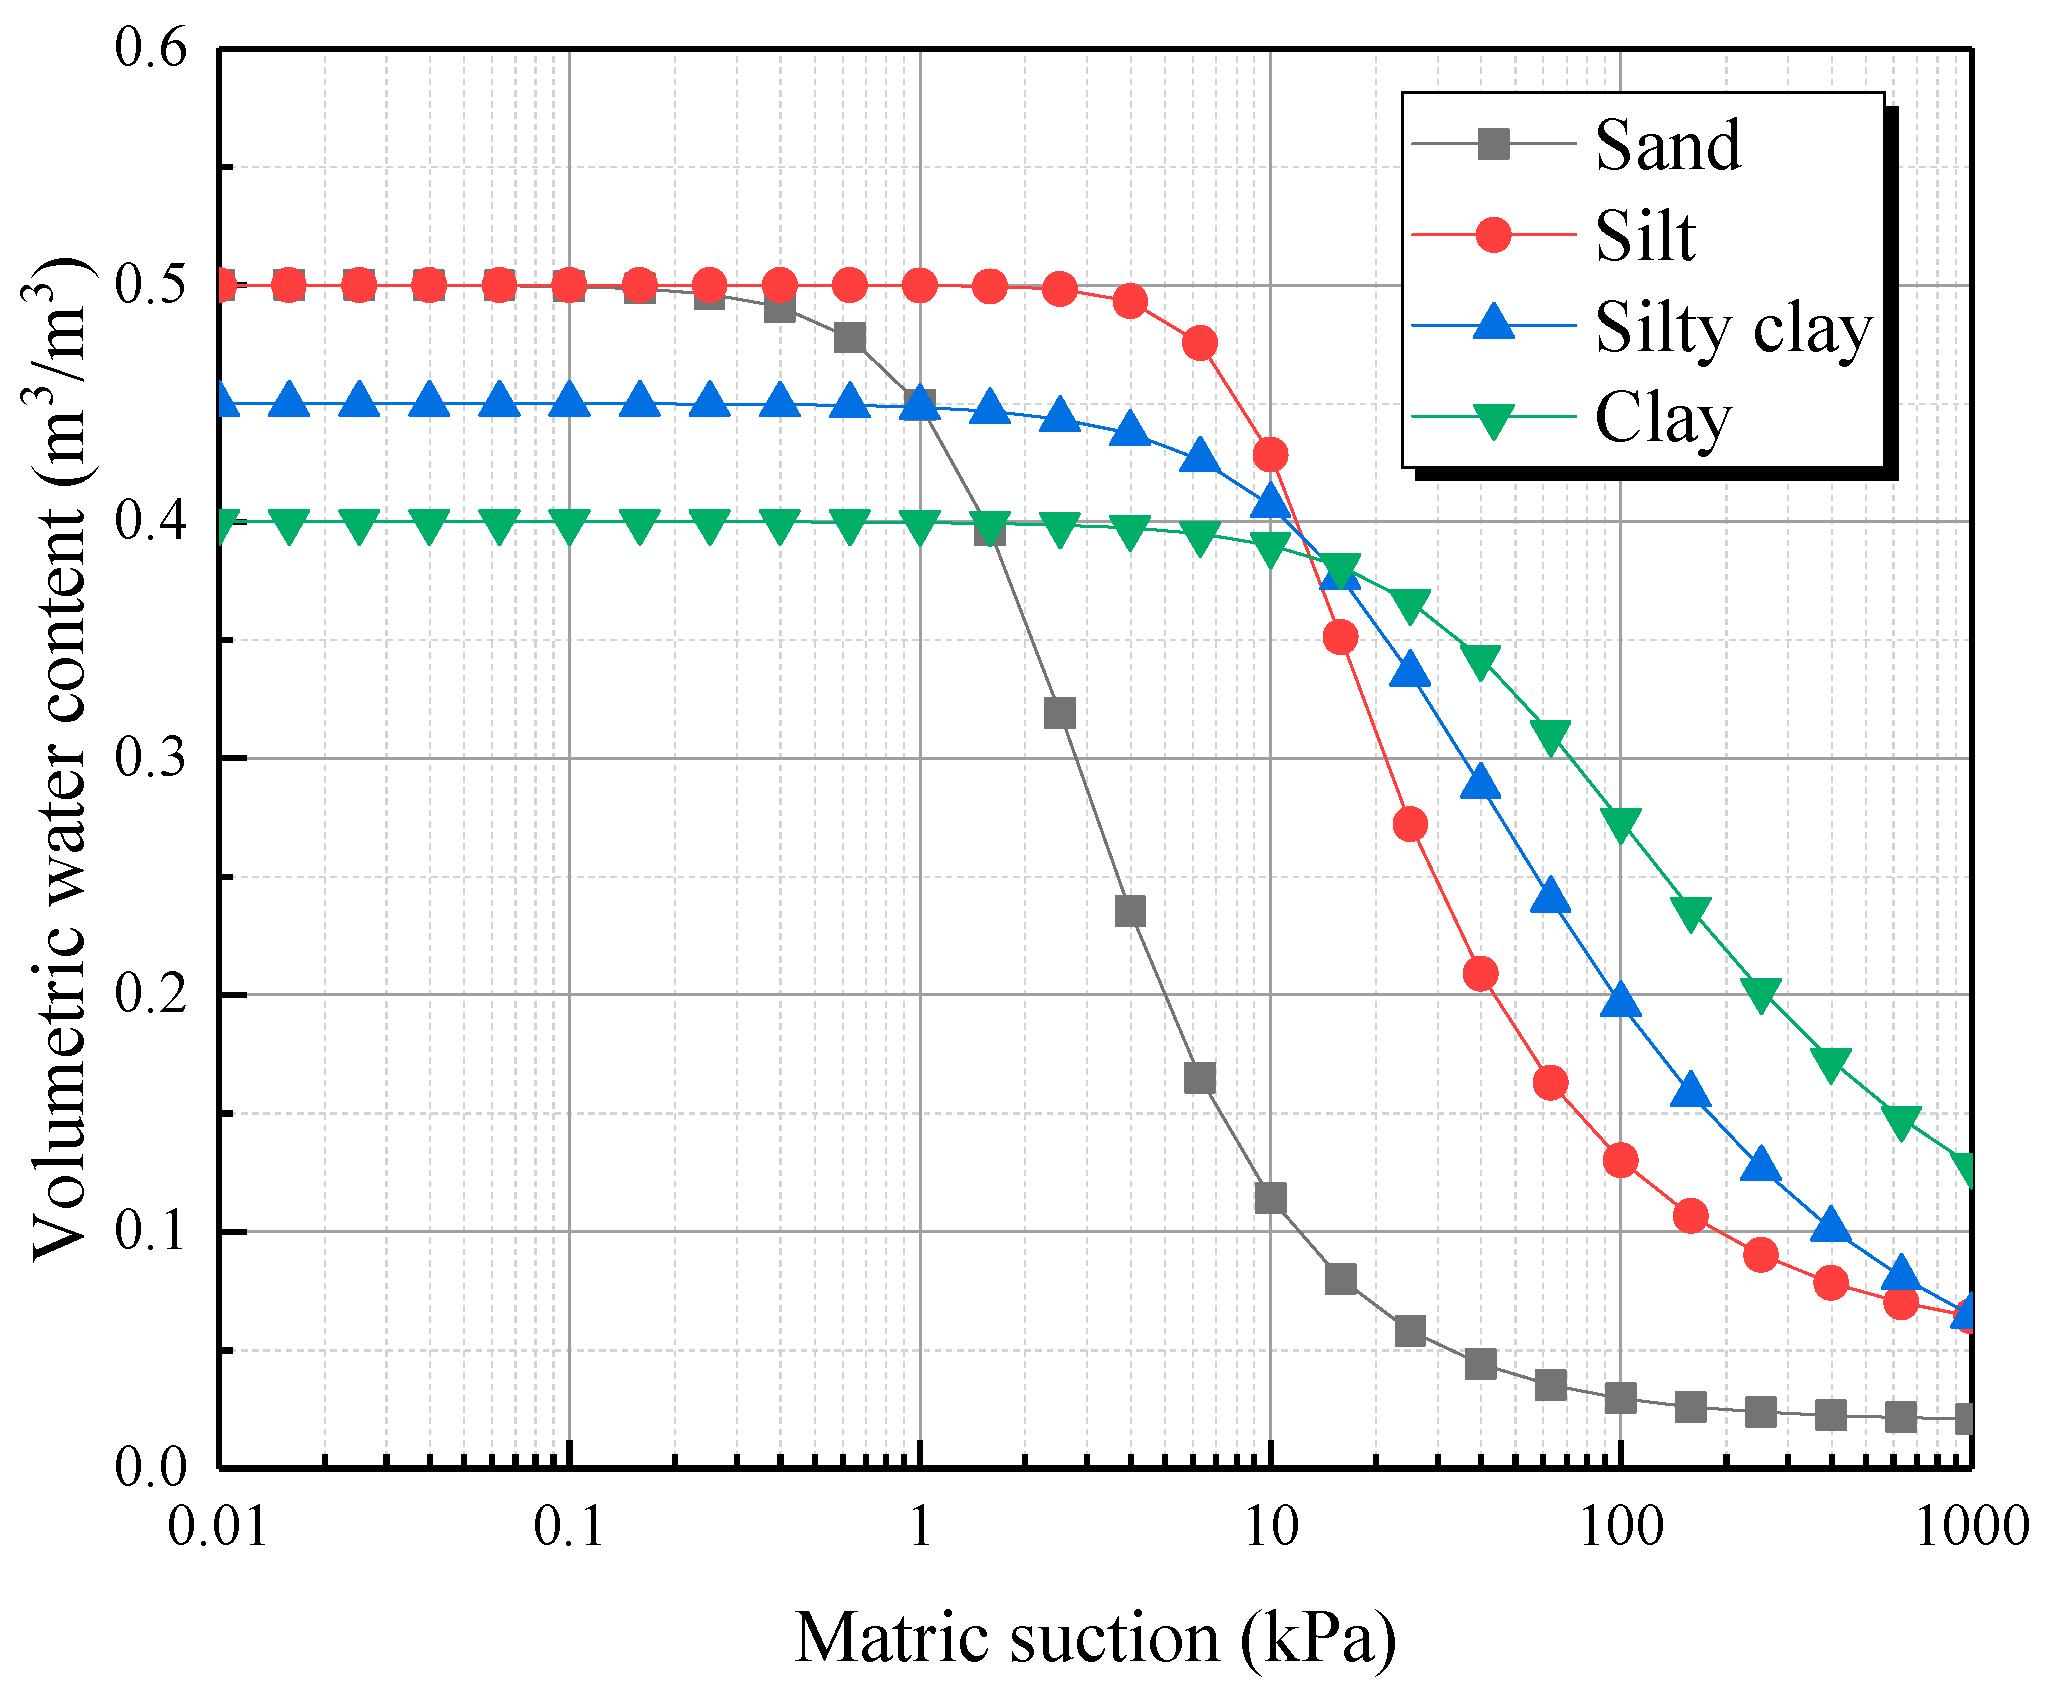
4.2. Soil–Water Characteristic Curves

The soil–water characteristic curves of sand, silt, silty clay, and clay in the SEEP/W module were adopted as the basic parameters for this numerical analysis, along with the corresponding empirical values for the saturated permeability coefficient, as summarized in Figure 13 and Table 9. The unsaturated permeability coefficient and soil–water characteristic curves were deduced from the empirical model proposed by Van Genuchten [34,35].

4.3. Simulation Results and Analysis

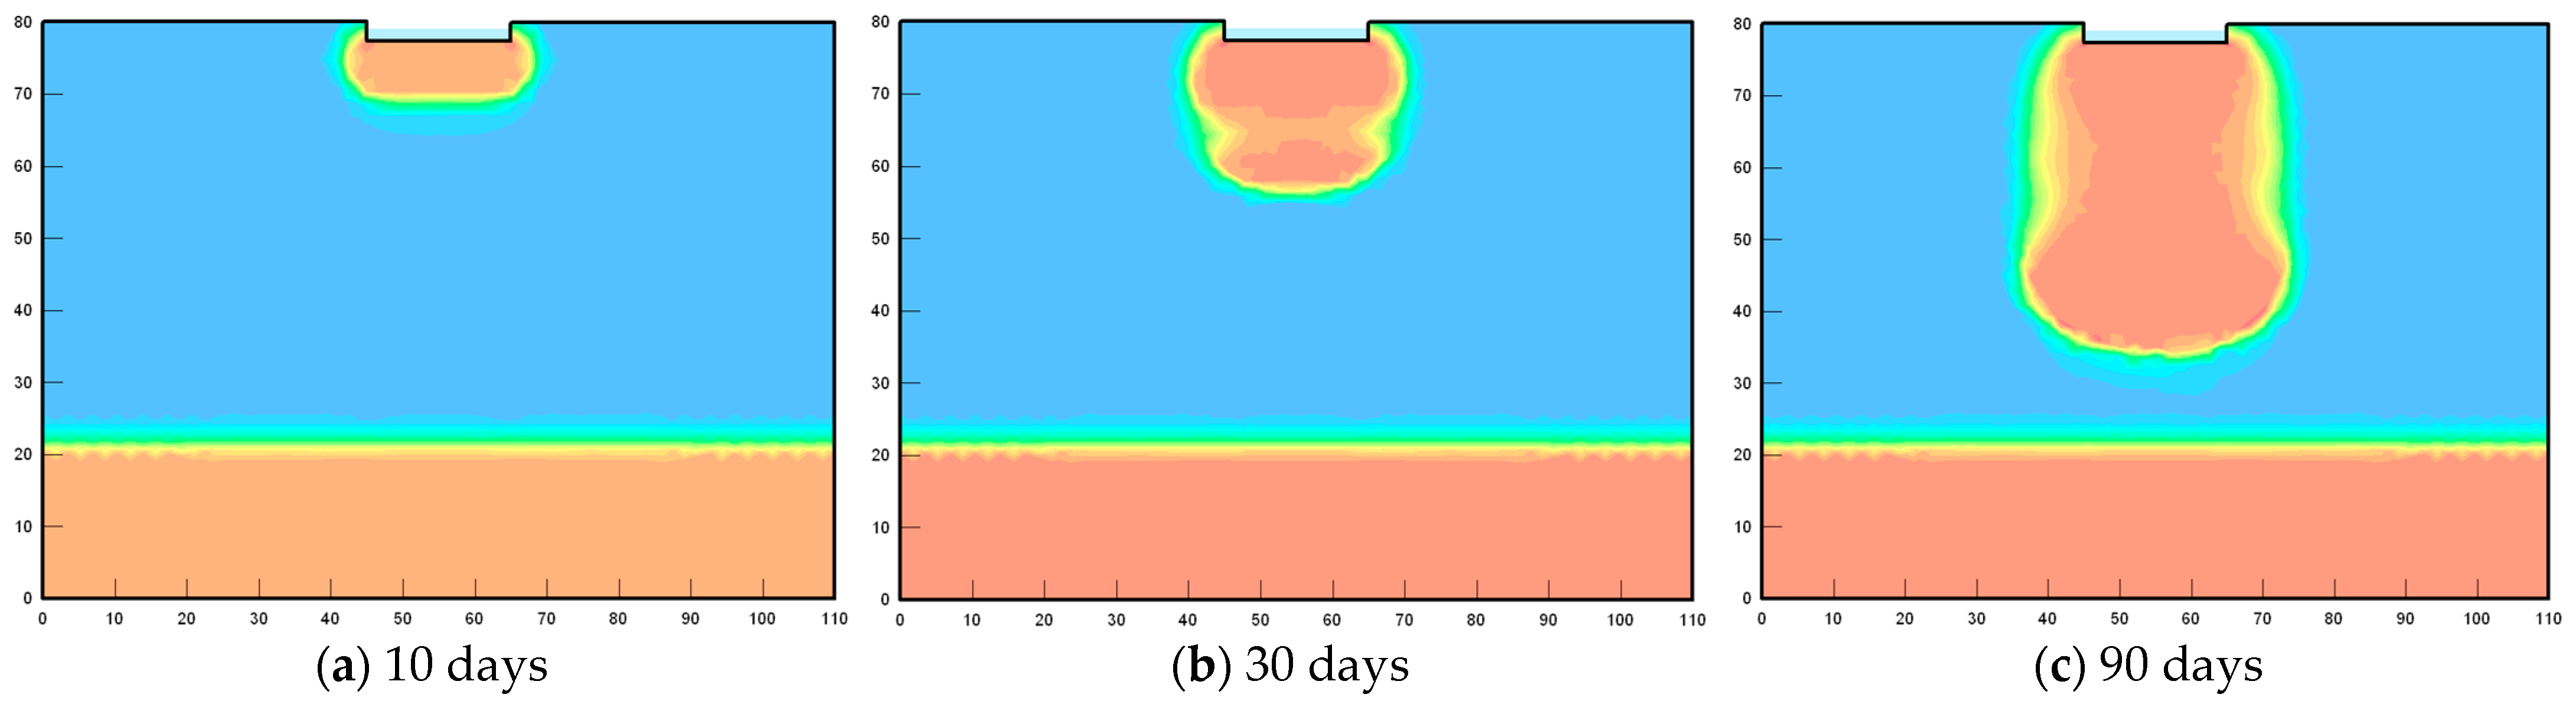
4.3.1. Effect of Foundation Lithology

The typical water diffusion morphologies in the single-layer stratum, regardless of the initial water content, are shown in Figure 14 and Figure 15. During the initial immersion stage, the water diffusion morphologies in silt and silty clay diffused downwards and laterally in a horizontal elliptical shape under the combined action of gravity and matrix potential. The horizontal diffusion range increased over time, and the horizontal component of the gravitational potential at the saturated zone edge continuously decreased simultaneously. The driving force generated by horizontal diffusion gradually changed to that generated by the matrix potential. For the last immersion stage, water mainly diffused downward with gravity and matrix suction as the driving force, and the elliptical shape of water morphologies was continuously stretched to a pear shape. By comparing the water diffusion pattern, it can be concluded that the foundation lithologies with different permeability coefficients led to various infiltration rates but similar diffusion and morphological processes [37].

4.3.2. Effect of Initial Water Content

The water diffusion morphologies in single-layer silty clay with distinct initial water contents were examined, as shown in Figure 16. The permeability rate and range in the unsaturated soil were significantly affected by the initial water content, which determined the magnitude of the matrix suction. The matrix suction hindered the infiltration of water when passing through the unsaturated soil and increased with the decreasing water content, causing a diminishment in the infiltration rate simultaneously. Moreover, the water diffusion range was proportional to the initial water content of the soil.

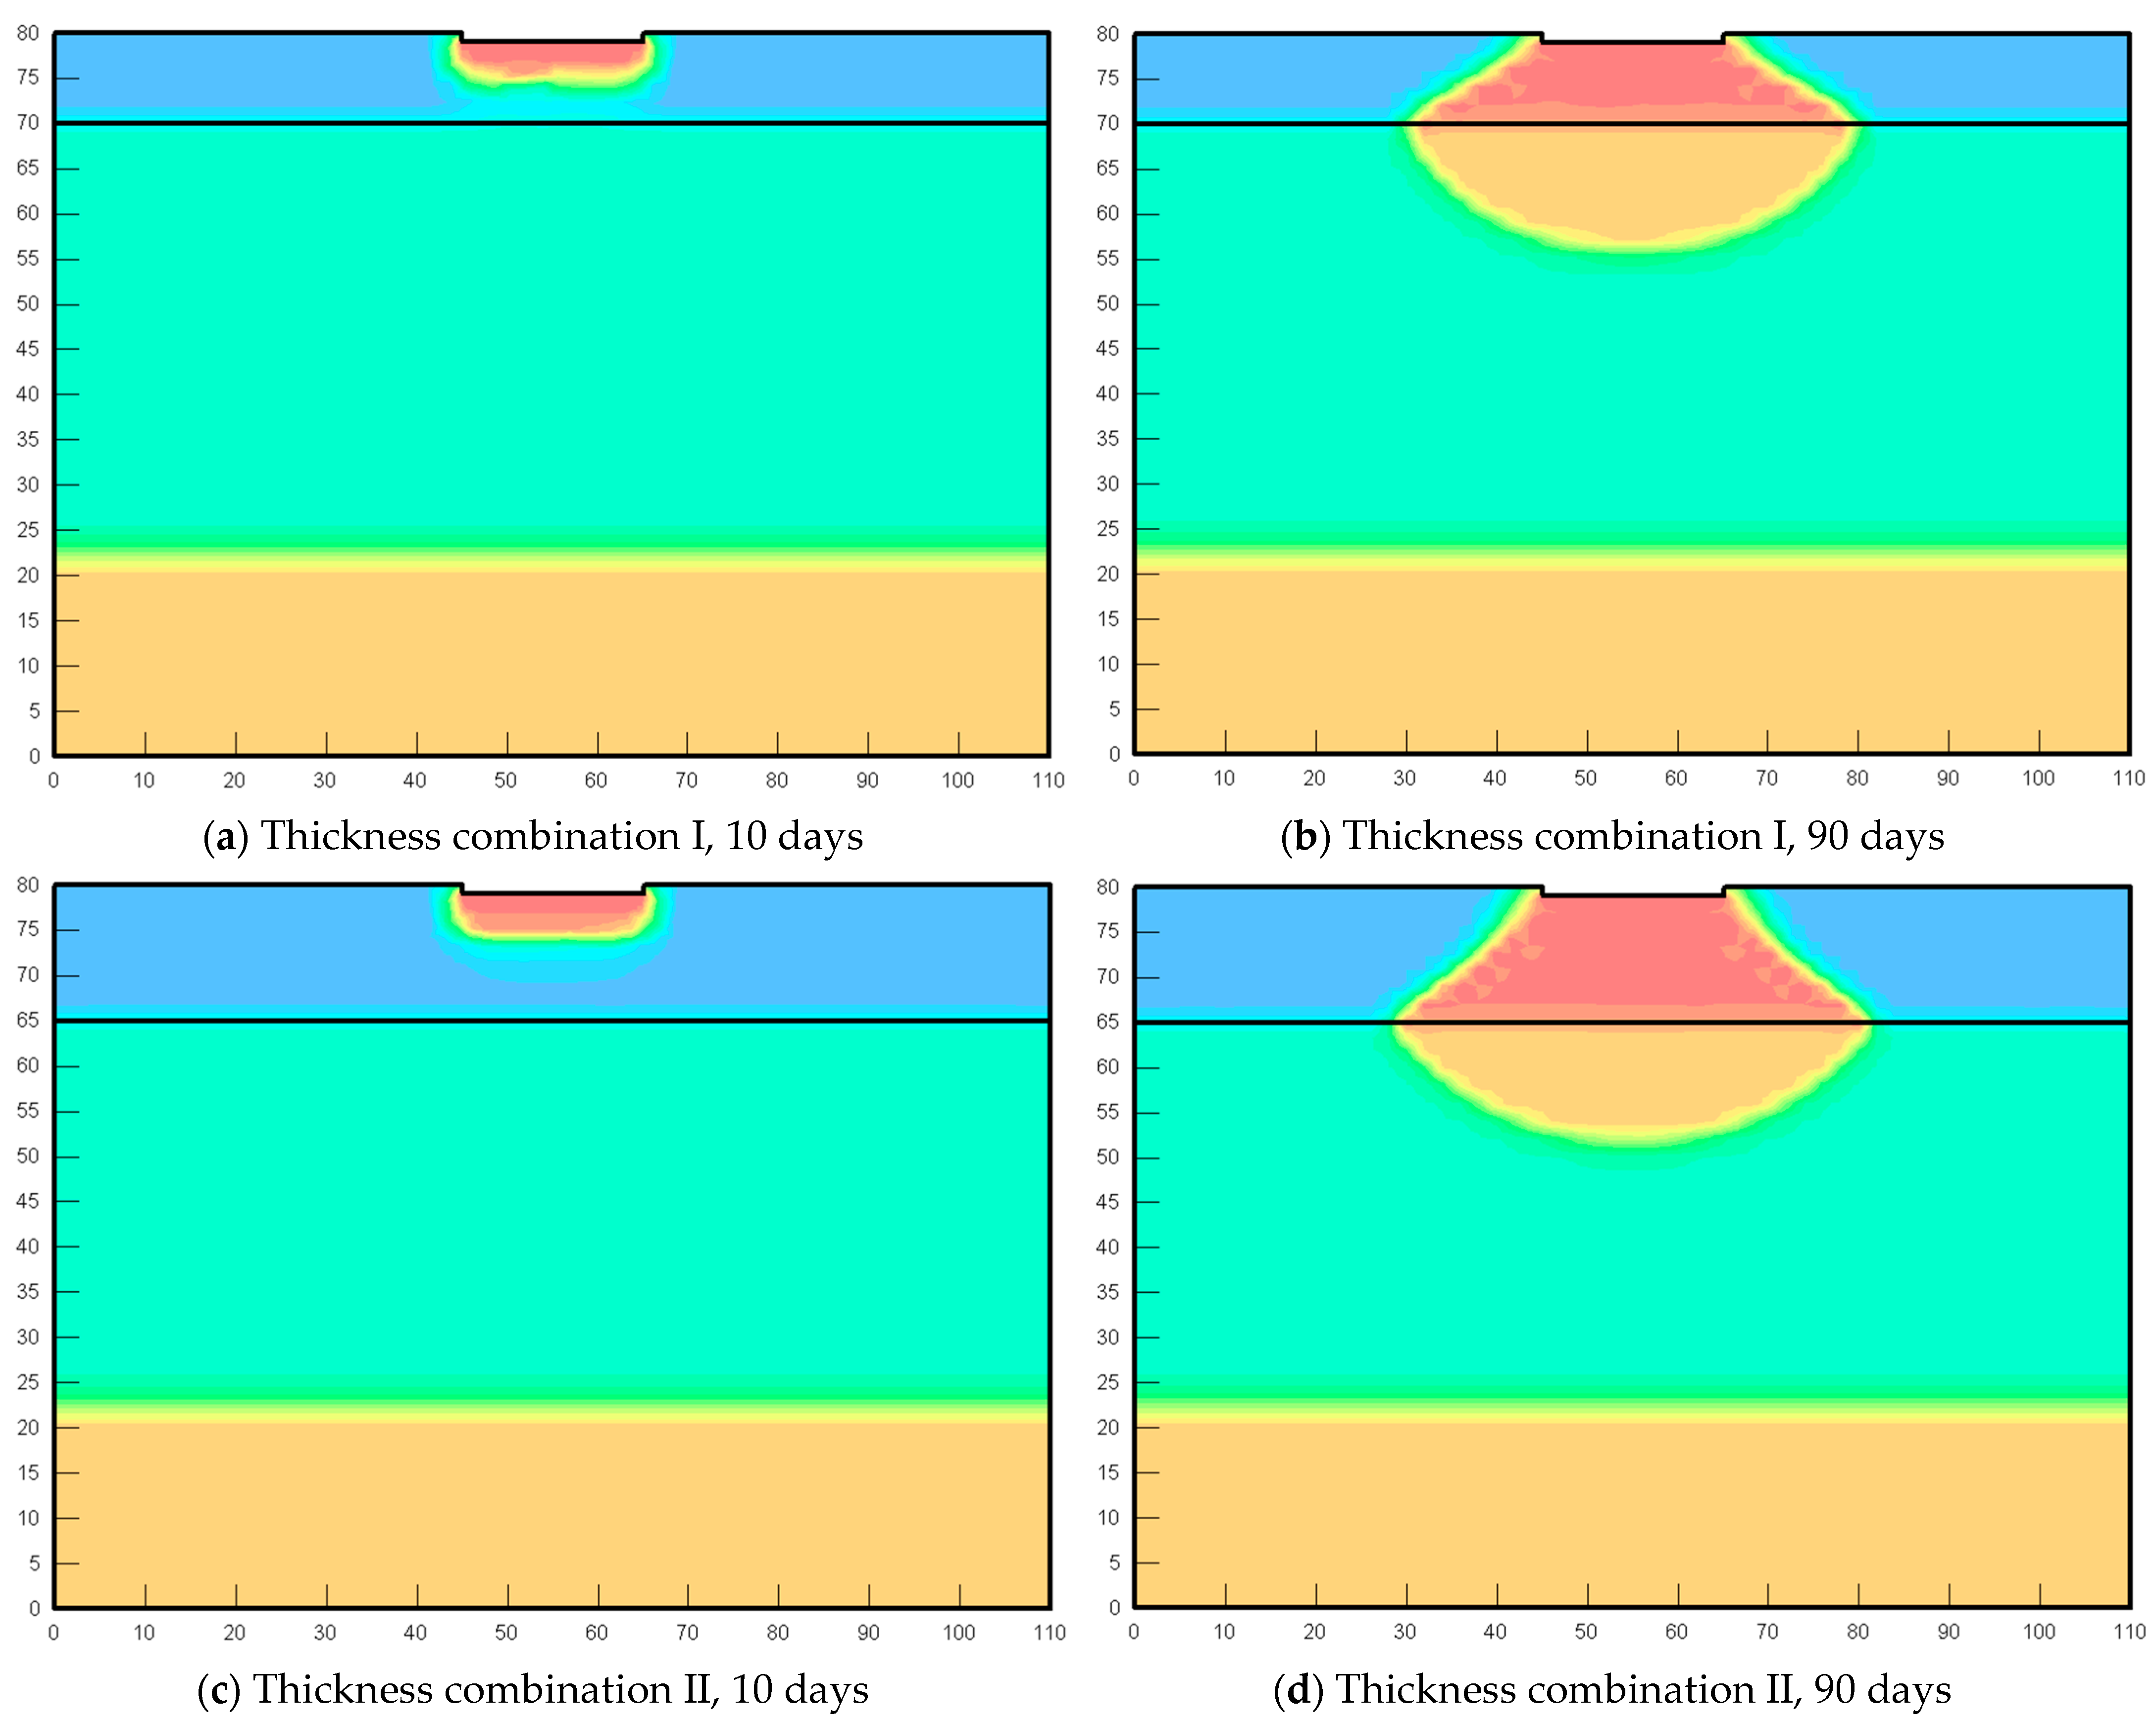
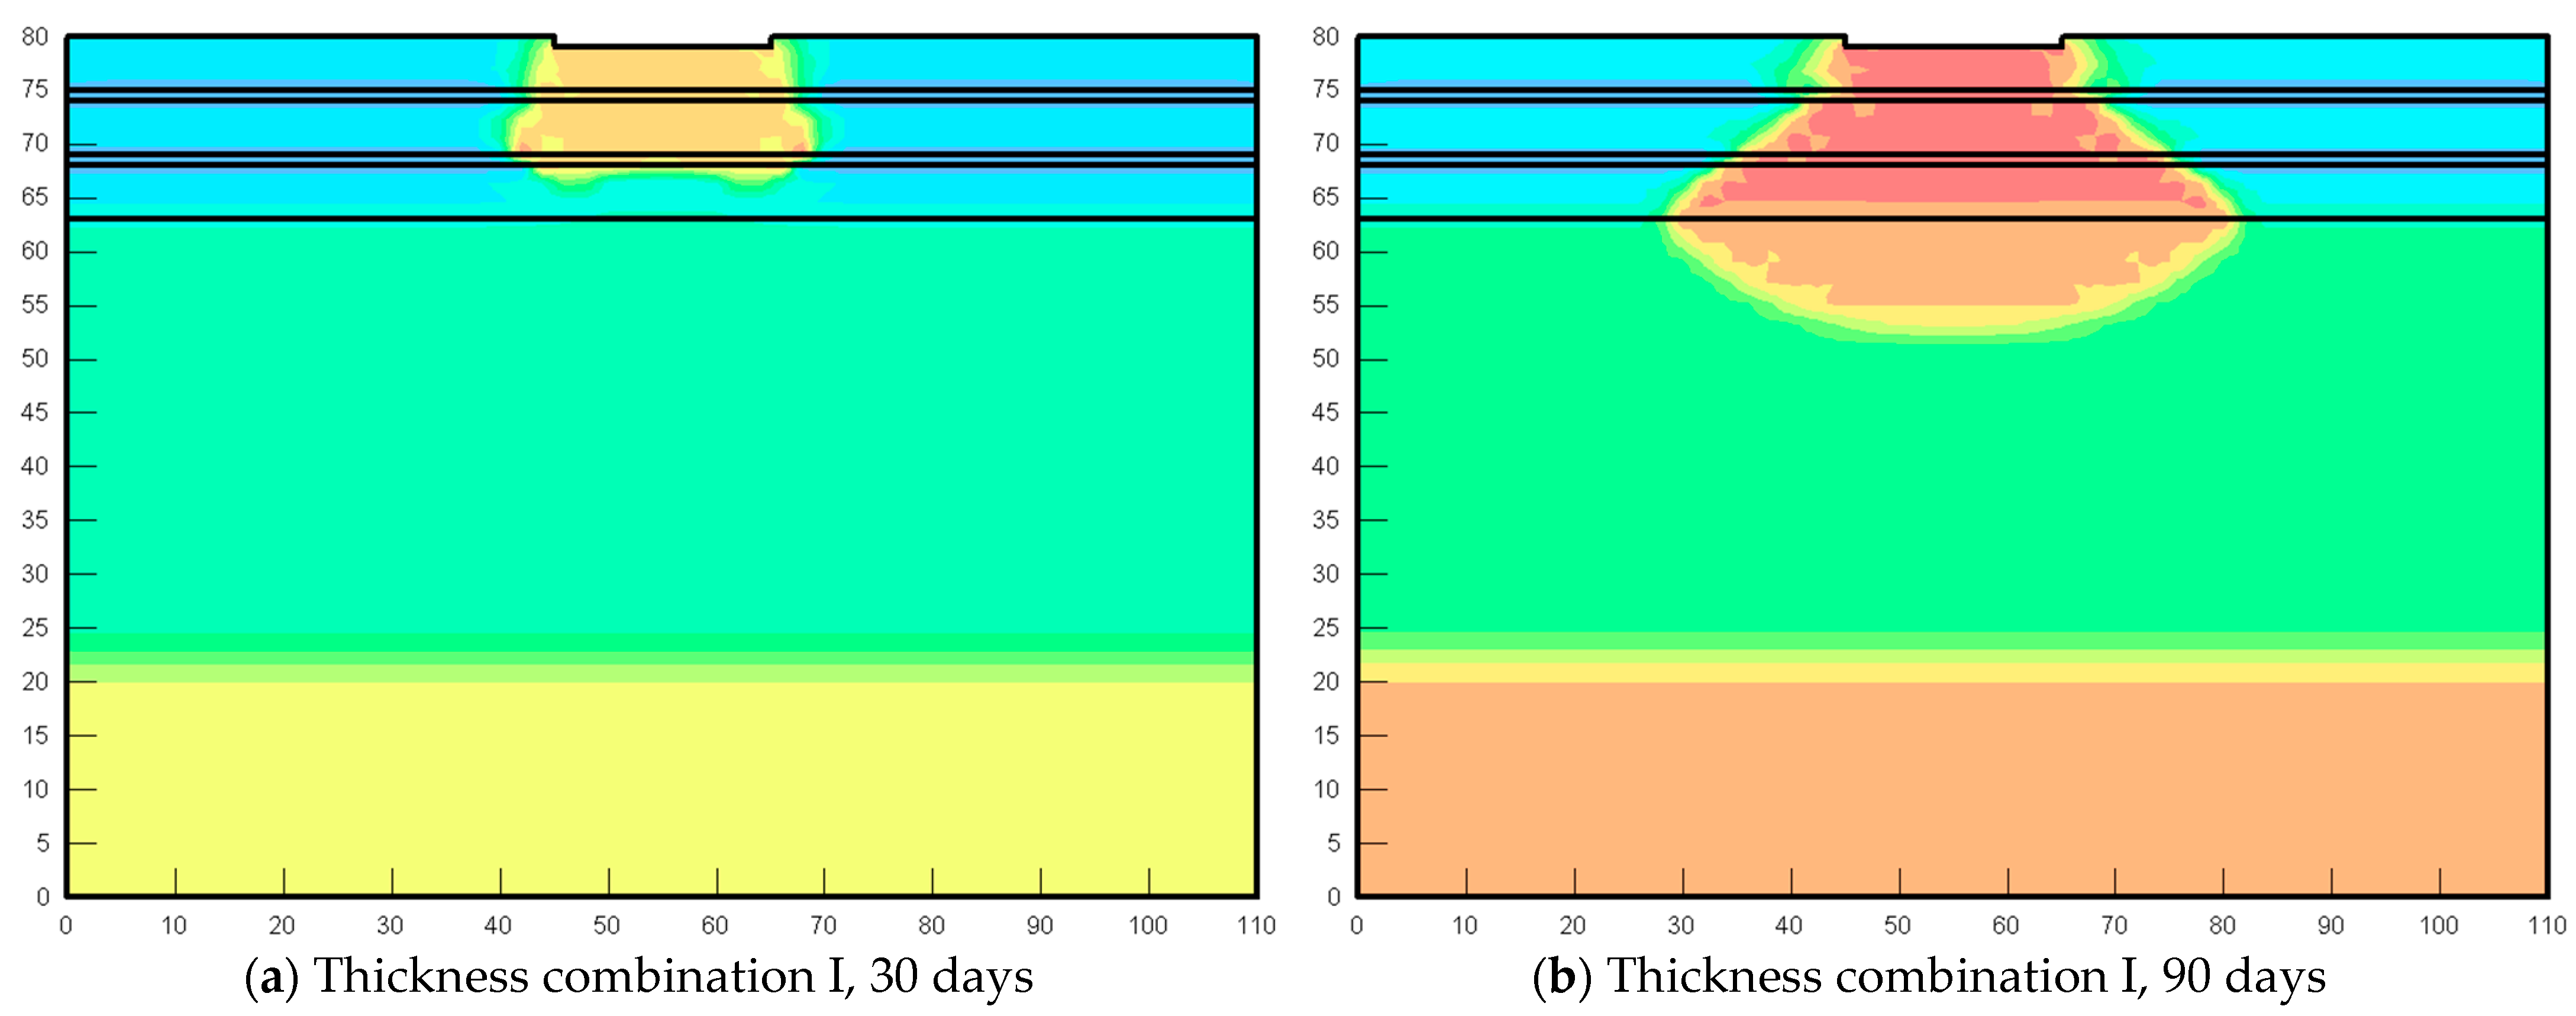
4.3.3. Effect of Stratum Combination

(1)
Double-layer stratum combination
Figure 17 and Figure 18 depict the simulation results of silty clay (aquitard) and sand (permeable) in the lower layer of the double-layer stratum combinations, respectively, along with various thickness combinations. At the initial immersion (10 days), the infiltration morphologies were consistent with that of the single-layer stratum before the water diffused to the silty clay and sand layers. When the lower layer was silty clay, the water diffusion morphology was an inverted funnel shape, while it was a long axe shape in the sand layer.
It can be concluded that the final water diffusion morphology is significantly dependent on the permeability capacity of the non-collapsible soil in the lower layer. The infiltration diameter increased with the permeability capacity of the lower soil layer, while the viscous resistance of the downward driving force decreased, reducing the horizontal diffusion range. When the lower soil layer was relatively impermeable, the vertical component of the gravitational potential in the upper layer was weakened, and the horizontal component was strengthened, resulting in an increased horizontal diffusion distance. The effect of the relatively impermeable or permeable layer on the original diffusion morphology gradually decreased with increasing depth, and the overall diffusion morphology did not change when the permeability capacity of the non-collapsible soil was close.
(2)
Multi-layer stratum combination
The water diffusion morphologies in the multi-layer stratum combinations are shown in Figure 19 and Figure 20. The diffusion morphologies resulted in a multi-layer cone shape for the sparse aquitards (Figure 19a,b), an inverted funnel shape for the dense aquitards (Figure 19c,d) or the sparse permeable layer (Figure 20a,b), and a long axe shape for the dense permeable layer (Figure 20c,d), in turn, which were similar to the shapes of the single-layer stratum, the double-layer stratum combinations with an aquitard, and a permeable lower layer.
Compared to the double-layer stratum combinations, the aquitards and permeable layers were in the middle of the collapsible soil layers and had little impact on the diffusion range for the multi-layer stratum combination. Similar morphologies were formed by the stratum distribution of the double-layer and multi-layer combinations.

4.4. Classification of Water Diffusion Morphology

Under the water immersion condition, the infiltration characteristics of water behaved complexly considering factors such as lithology characteristics, stratum combinations, and initial water content. The morphologies and range of the water diffusion varied when changing the bottom boundary of collapsibility (collapsible soil thickness). As follows, the relationship between the water diffusion morphologies and the bottom boundary of collapsibility was established, and the typical diffusion patterns were classified, as shown in Figure 21 and Table 10.

5. Optimization of Collapsible Loess Foundation

5.1. Optimization Scheme

The collapsibility of the loess foundation would result in the settlement, cracking, and incline of structures, causing potential security problems and economic losses. It is imperative to propose a high-efficiency optimization scheme for the foundation.
By combining the collapsibility mechanisms and water diffusion morphology of loess in the Weibei area, an “inverted box shape” barrier was proposed in this paper to protect the soil layer from water immersion, which could decrease the thickness of the collapsible loess above and the residual collapsible settlement, as shown in Figure 22.

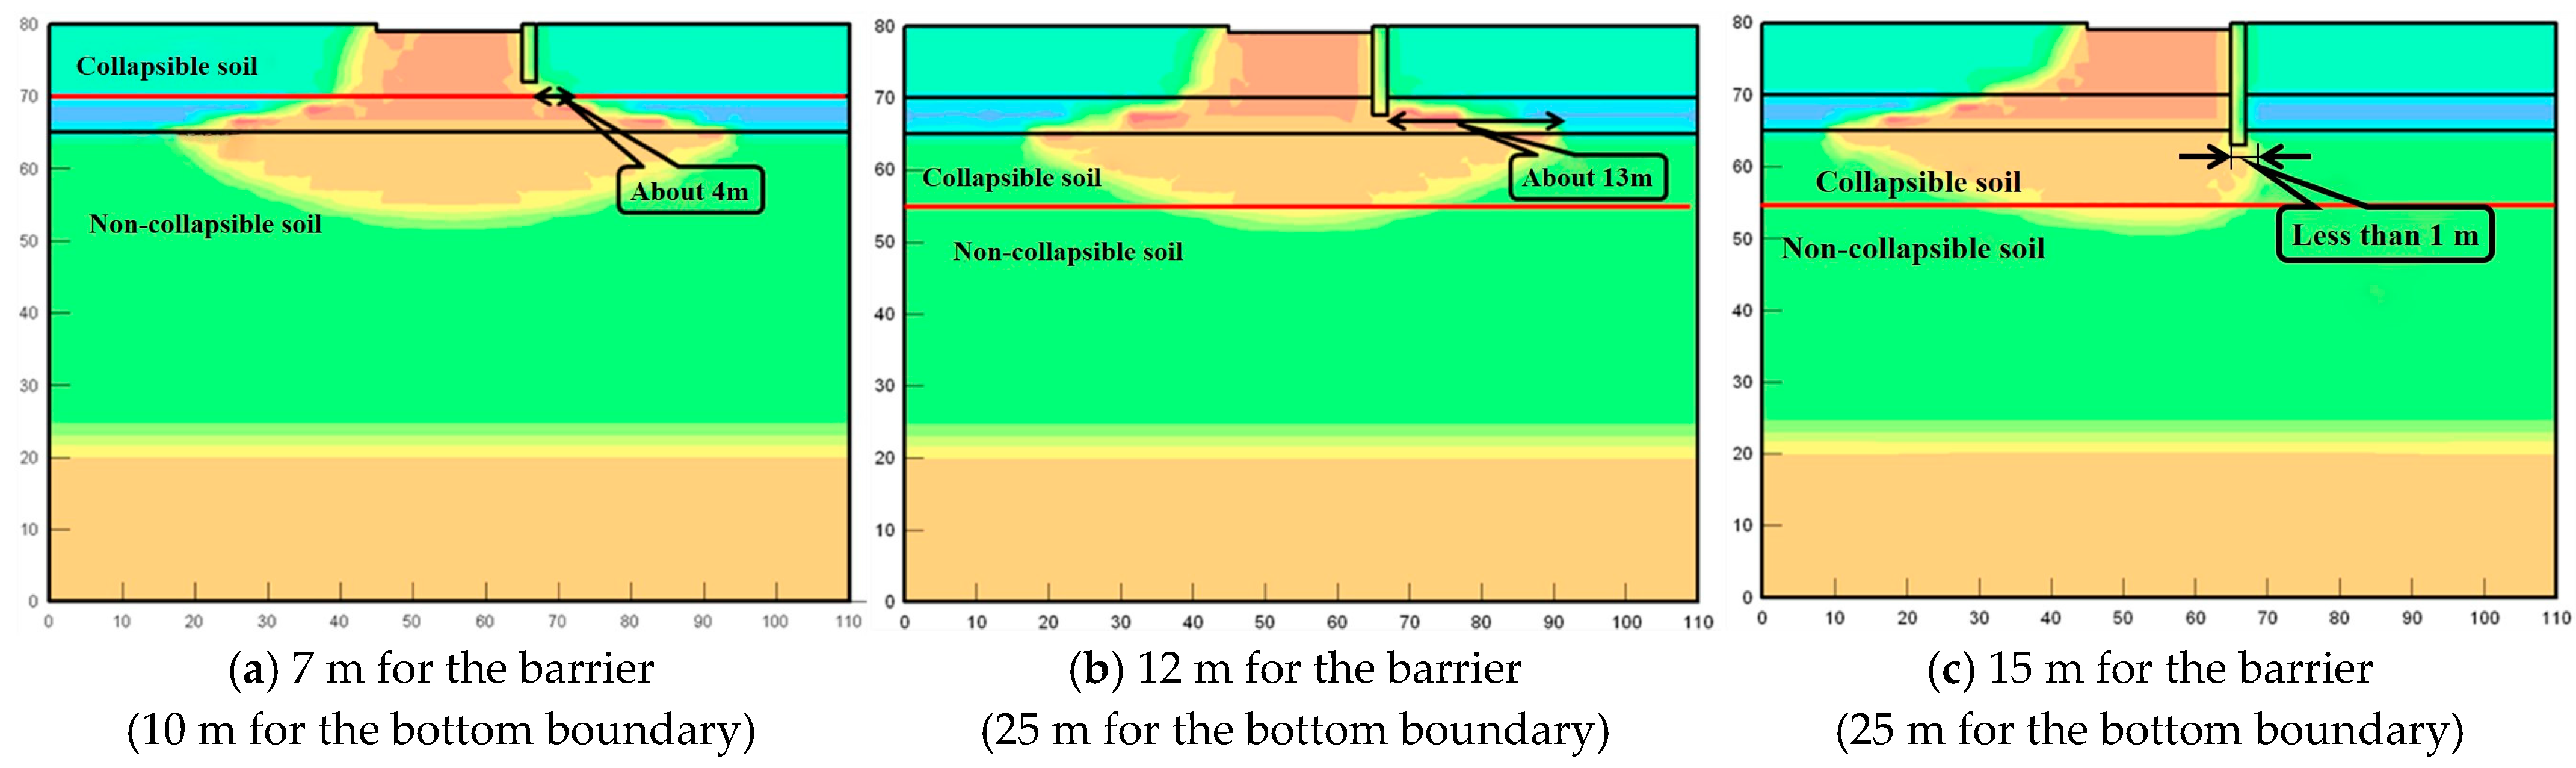
5.2. Evaluation of the Proposed Barrier Scheme

5.2.1. Effect of the Proposed Scheme

The single-layer and double-layer stratum combinations were selected to evaluate the effect of different barrier depths on the water diffusion behavior. The model parameters were the same as those in Section 3.1, and the water barrier with an identical depth of collapsible loess and a width of 2 m was set as the same properties as clay.
The water could not permeate toward the inside of the water barrier due to the waterproof and interceptive effects when the depth of the vertical water barrier was equal to the thickness of the collapsible soil layer, but the gravitational potential of the water was enhanced, which increased infiltration depth and horizontal diffusion range, as presented in Figure 23, Figure 24 and Figure 25.

5.2.2. Analysis of Combination Scheme

According to the loess specification [38], there is no necessity to eliminate the total collapsibility settlement for class B and class C buildings, for which the method of partial isolation was adopted to analyze the horizontal diffusion range of water under various vertical barrier depths in this paper. The relationship between the vertical depths of barriers and the horizontal diffusion ranges of the residual settlement section was established, and the feasibility and applicability of the proposed measure were verified.
Double-layer collapsible soils with two thicknesses of 10 m and 25 m were selected to investigate the effect of the barriers with different vertical depths on the horizontal diffusion range of water. The stratum combination, vertical depth of the barrier, and horizontal diffusion range of water in the residual settlement section in the numerical models are detailed in Table 11, and the water content distributions are shown in Figure 26 and Figure 27.
For the collapsible soil layer with a depth of 10 m, the water diffusion morphology in the double-layer soil with the aquitard as the lower layer was an inverted funnel shape, and the horizontal diffusion range of water decreased with the increasing vertical depth of barriers. The barrier with a depth not exceeding the top of the impermeable layer had little effect on reducing the horizontal diffusion range. Similarly, the horizontal diffusion range of water in the double-layer soil with a permeable lower layer behaved in a similar trend as the above, and the barrier showed little improvement, attributed to the shallow depth of barriers.
As for the collapsible soil layer with a depth of 25 m, the water diffusion morphology of the double layer with an aquitard as the lower layer was a short axe shape. The optimal depth of the vertical barrier was set at the top of the relatively impermeable layer, and the increasing barrier depth had little effect on the reduction in the horizontal diffusion range once it exceeded the top depth. Moreover, the water diffusion morphology in the double layer with a permeable lower layer was a long axe shape. It was advised that the optimal depth of the vertical barrier for this situation be set at the bottom of the permeable layer since the horizontal diffusion range barely changed when the depth of the barrier exceeded the bottom depth.
In summary, it is recommended that the optimal depths of the vertical barrier be located at the top of the relatively impermeable layer or the bottom of the permeable layer for the double-layer stratum combination, respectively. The relative depth of the collapsible bottom boundary and the water diffusion morphology, especially the position of the maximum inflection point in the diffusion morphology and the main action layer (the aquitard or permeable layers), largely determine the effectiveness of the proposed barrier measure. When the depth of the collapsible bottom boundary was deeper than the maximum inflection point in the water diffusion morphology or the main action layer, the optimal depth of the vertical barrier was set at these characteristic positions, and the proposed scheme had little effect on preventing water diffusion when the bottom boundary as shallower than the characteristic positions.

6. Conclusions

In this research, by integrating the results of the large-scale pit immersion experiments in Bu Li village located in Weibei Loess Tableland—the loess microstructure test, the simulated seepage process of water, and the proposed water-barrier measure—the main conclusions can be summarized as follows:
  • The water diffusion morphology in the loess was an inverted funnel shape, and the scope of saturation and the infiltration line were 30.5 m and 37.5 m from the central axis of the pit at a depth of 25 m, respectively. The measured maximum consolidation settlement was approximately 380.5 mm.
  • The void ratio and natural moisture content of loess exhibited a positive and negative correlation with the collapsibility coefficient, respectively, and the concept of collapsibility potential was put forward. The expansion of clay minerals and the dissolution of soluble salts during wetting were the critical reasons for the failure of loess skeleton and cementing materials.
  • The water diffusion morphologies in various stratum combinations were classified, and a water-barrier measure of “inverted box shape” was proposed to prevent loess from water immersion, whose feasibility and applicability were verified. The optimal depths of the vertical barrier were recommended to be set at the maximum inflection point in the water diffusion morphology or the main action layer.

Author Contributions

Methodology, C.Z.; Formal analysis, Y.L.; Investigation, J.Z.; Resources, J.Z.; Writing—original draft, Y.L.; Writing—review & editing, Y.L. and C.Z.; Supervision, C.Z. All authors have read and agreed to the published version of the manuscript.

Funding

This study was supported by the National Natural Science Foundation of China (No. 41877242), the project name is “Reliable analysis and robust decision-making for slope stability and prevention in the loess terrace irrigation area”.

Institutional Review Board Statement

Not applicable.

Informed Consent Statement

Not applicable.

Data Availability Statement

Not applicable.

Conflicts of Interest

The authors declare no conflict of interest.

References

  1. Liu, Z.; Liu, F.; Ma, F.; Wang, M.; Bai, X.; Zheng, Y.; Yin, H.; Zhang, G. Collapsibility, composition, and microstructure of loess in China. Can. Geotech. J. 2016, 53, 673–686. [Google Scholar] [CrossRef]
  2. Yang, H.; Xie, W.-L.; Liu, Q.-Q.; Zhu, R.-S.; Liu, Y.-Y. Three-stage collapsibility evolution of Malan loess in the Loess Plateau. Catena 2022, 217, 106482. [Google Scholar] [CrossRef]
  3. Xie, D. Exploration of some new tendencies in research of loess soil mechanics. Chin. J. Geotech. Eng. 2001, 1, 3–13. [Google Scholar]
  4. Wang, L.; Shi, Y.; Liu, X. Loess Dynamics; Seismological Press: Beijing, China, 2003. [Google Scholar]
  5. Houston, S.L.; Houston, W.N.; Zapata, C.E.; Lawrence, C. Geotechnical engineering practice for collapsible soils. Geotech. Geol. Eng. 2001, 19, 333–355. [Google Scholar] [CrossRef]
  6. Rogers, C.D.F.; Dijkstra, T.A.; Smalley, I.J. Hydroconsolidation and subsidence of loess: Studies from China, Russia, North America and Europe: In memory of Jan Sajgalik. Eng. Geol. 1994, 37, 83–113. [Google Scholar] [CrossRef]
  7. Garakani, A.A.; Haeri, S.M.; Khosravi, A.; Habibagahi, G. Hydro-mechanical behavior of undisturbed collapsible loessial soils under different stress state conditions. Eng. Geol. 2015, 195, 28–41. [Google Scholar] [CrossRef]
  8. Li, P.; Li, T.L.; Wang, H.; Liang, Y. Soil-water characteristic curve and permeability prediction on Childs & Collis-Geroge model of unsaturated loess. Rock Soil Mech. 2013, 34, 184–189. [Google Scholar]
  9. Ma, Y.; Wang, J.; Peng, S.; Li, B. Relationships between physical-mechanical and collapsibility of loess soil and its prediction model. Bull. Soil Water Conserv. 2016, 36, 120–128. [Google Scholar]
  10. Zhang, W.; Zhang, A.; Chen, J.; Liu, Y. Effect of moisture content and density on collapsibility coefficient of Ili loess. J. Northwest A F Univ.-Nat. Sci. Ed. 2017, 45, 211–220. [Google Scholar]
  11. Deng, L.S.; Fan, W.; Yin, Y.P.; Cao, Y.B. Case study of a collapse investigation of loess sites covered by very thick loess-paleosol interbedded strata. Int. J. Geomech. 2018, 11, 05018009. [Google Scholar] [CrossRef]
  12. Lu, Q.; Liu, Y.; Peng, J.; Li, L.; Fan, W.; Liu, N.; Sun, K.; Liu, R. Immersion test of loess in ground fissures in Shuanghuaishu, Shaanxi province, China. Bull. Eng. Geol. Environ. 2020, 79, 2299–2312. [Google Scholar] [CrossRef]
  13. Liu, B.; Xie, Y.; Yu, Y. In-situ testing study on infiltration in unsaturated loess. J. Eng. Geol. 2004, 24, 4156–4160. [Google Scholar]
  14. Yang, J.; Wang, J.; Li, K.; Zhao, J.; Chao, J. Experimental study on site test pit immersion in loess tableland section of Xi’an North-airport intercity railway. J. China Railw. Soc. 2022, 44, 107–115. [Google Scholar]
  15. Miao, T.D.; Wang, Z.G. Deformation mechanism of collapsible loess in consideration of the microstructure instability. Catena Suppl. 1991, 20, 93–105. [Google Scholar]
  16. Sha, A.; Chen, K. Relationship between collapsibility and microstructure of compacted loess. J. Chang’an Univ. Nat. Sci. Ed. 2006, 26, 1–4. [Google Scholar]
  17. Tang, L. Synthetic effect of microstructure and uneven suction on loess subsidence. Rock Soil Mech. 2003, 11, 30–35. [Google Scholar]
  18. Yang, Y. Study of the mechanism of loess collapse. Sci. China Ser. B Chem. Life Sci. Earth Sci. 1989, 5, 604–617. [Google Scholar]
  19. Derbyshire, E. Genesis and Properties of Collapsible Soils; Springer Science & Business Media: New York, NY, USA, 2012; Volume 468. [Google Scholar]
  20. Xie, W.-L.; Li, P.; Zhang, M.-S.; Cheng, T.-E.; Wang, Y. Collapse behavior and microstructural evolution of loess soils from the Loess Plateau of China. J. Mt. Sci. 2018, 15, 1642–1657. [Google Scholar] [CrossRef]
  21. Wang, J.-D.; Li, P.; Ma, Y.; Vanapalli, S.K.; Wang, X.-G. Change in pore-size distribution of collapsible loess due to loading and inundating. Acta Geotech. 2020, 15, 1081–1094. [Google Scholar] [CrossRef]
  22. Shao, X.; Zhang, H.; Tan, Y. Collapse behavior and microstructural alteration of remolded loess under graded wetting tests. Eng. Geol. 2018, 233, 11–22. [Google Scholar] [CrossRef]
  23. Ayadat, T.; Hanna, A. Design of foundations built on a shallow depth (less than 4 m) of Egyptian macro-porous collapsible soils. Open J. Geol. 2013, 3, 209–215. [Google Scholar] [CrossRef]
  24. Jefferson, I.; Rogers, C.; Evstatiev, D.; Karastanev, D. Treatment of Metastable Loess Soils: Lessons from Eastern Europe; Elsevier Geo-engineering Book Series; Elsevier: Amsterdam, The Netherlands, 2005; Volume 3, pp. 723–762. [Google Scholar]
  25. Zhang, S.J.; Huang, X.F.; Zhu, Y.P. Foundation treatment depth and reasonable control on remnant collapse in area of dead weight collapse loess with great thickness. Rock Soil Mech. 2013, 34, 344–350. [Google Scholar]
  26. Yuan, K.; Ni, W.; Lü, X.; Zhu, M.; Wang, H.; Nie, Y. Mechanical properties and microstructure evolution of Malan loess. Quatern. Int. 2022, 637, 74–84. [Google Scholar] [CrossRef]
  27. Nie, Y.; Ni, W.; Tuo, W.; Wang, H.; Yuan, K.; Zhao, Y. Microstructure and compressibility evolution of sulfate saline compacted loess under drying-wetting cycles. Quatern. Int. 2022, 625, 96–106. [Google Scholar] [CrossRef]
  28. Xu, P.; Zhang, Q.; Qian, H.; Qu, W.; Li, M. Microstructure and permeability evolution of remolded loess with different dry densities under saturated seepage. Eng. Geol. 2021, 282, 105875. [Google Scholar] [CrossRef]
  29. Wei, Y.; Fan, W.; Ma, G. Characteristics of microstructure and collapsible mechanism of Malan Loess Plateau, China. J. Earth Sci. Environ. 2022, 44, 581–592. [Google Scholar]
  30. Ren, Z.; Pan, J.; Li, Z.; Xiao, P.; Shen, Z.; Jia, L.; Li, X. The Interaction of Aeolian Sand and Slope on Runoff and Soil Loss on a Loess Slope via Simulated Rainfall under Laboratory Conditions. Water 2023, 15, 888. [Google Scholar] [CrossRef]
  31. Zhu, Y.; Ishikawa, T.; Subramanian, S.S.; Luo, B. Simultaneous analysis of slope instabilities on a small catchment-scale using coupled surface and subsurface flows. Eng. Geol. 2020, 275, 105750. [Google Scholar] [CrossRef]
  32. Pato, F.J.; Aranda, M.S.; Navarro, G.P. A 2D finite volume simulation tool to enable the assessment of combined hydrological and morphodynamical processes in mountain catchments. Adv. Water Resour. 2020, 141, 103617. [Google Scholar] [CrossRef]
  33. Yuan, S.; Sun, B.; Han, G.; Duan, W.; Wang, Z. Application and Prospect of Curtain Grouting Technology in Mine Water Safety Management in China: A Review. Water 2022, 14, 4093. [Google Scholar] [CrossRef]
  34. Van Genuchten, M.T.A. Closed-form equation for predicting the hydraulic conductivity of unsaturated soils. Soil Sci. Soc. Am. J. 1980, 44, 892–898. [Google Scholar] [CrossRef]
  35. Lu, N.; Willian, J.L. Unsaturated Soil Mechanics; John Wiley & Sons, Inc.: New York, NY, USA, 2004. [Google Scholar]
  36. Xia, J. Soil Mechanics and Engineering Geology; Zhejiang University Press: Hangzhou, China, 2012. [Google Scholar]
  37. Xiong, X.; Shi, Z.; Xiong, Y.; Peng, M.; Ma, X.; Zhang, F. Unsaturated slope stability around the Three Gorges Reservoir under various combinations of rainfall and water level fluctuation. Eng. Geol. 2019, 261, 105231. [Google Scholar] [CrossRef]
  38. Ministry of Housing and Urban-Rural Department of the People’s Republic of China. GB50025-2018 Standard for Building Construction in Collapsible Loess Regions; China Construction Industry Press: Beijing, China, 2018. [Google Scholar]
Figure 1. Locations of the test site.
Sustainability 15 08573 g001
Figure 2. Panoramic view of the immersion test pit.
Sustainability 15 08573 g002
Figure 3. Design diagram of the immersion test pit.
Sustainability 15 08573 g003
Figure 4. Water consumption in the field collapsibility experiment.
Sustainability 15 08573 g004
Figure 5. Diffusion process of infiltration.
Sustainability 15 08573 g005
Figure 6. Infiltration area and saturation area.
Sustainability 15 08573 g006
Figure 7. Curves of cumulative subsidence versus observation time for the Bu Li village test. (a) Shallow targets labeled A, (b) shallow targets labeled B, and (c) shallow targets labeled C.
Sustainability 15 08573 g007aSustainability 15 08573 g007b
Figure 8. Evolution of the settlement curve for the Bu Li village test. (a) A14-Z0-B14 profile, (b) A14-Z0-C14 profile, and (c) C14-Z0-B14 profile.
Sustainability 15 08573 g008aSustainability 15 08573 g008b
Figure 9. Relationship between natural water content, void ratio, and collapsibility coefficient.
Sustainability 15 08573 g009
Figure 10. Microstructures of 3-1-1 soil in loess tableland before immersion.
Sustainability 15 08573 g010
Figure 11. Microstructures of 3-1-1 soil in loess tableland after immersion.
Sustainability 15 08573 g011
Figure 12. Comparison of infiltration line between in-situ test and simulation.
Sustainability 15 08573 g012
Figure 13. Typical soil–water characteristic curves.
Sustainability 15 08573 g013
Figure 14. Water diffusion process in silt.
Sustainability 15 08573 g014
Figure 15. Water diffusion process in silty clay.
Sustainability 15 08573 g015
Figure 16. Water diffusion pattern in silty clay with different initial water content (90 days).
Sustainability 15 08573 g016
Figure 17. Water diffusion morphologies in double-layer stratum combination A.
Sustainability 15 08573 g017
Figure 18. Water diffusion morphologies in double-layer stratum combination B.
Sustainability 15 08573 g018
Figure 19. Water diffusion morphologies in multi-layer stratum combination A.
Sustainability 15 08573 g019
Figure 20. Water diffusion morphologies in multi-layer stratum combination B.
Sustainability 15 08573 g020aSustainability 15 08573 g020b
Figure 21. Typical water diffusion morphology in various stratum combinations. (a) Single layer, (b) double layer with aquitard as the lower layer, (c) double layer with a permeable lower layer, (d) multi-layer with aquitard as middle layers, and (e) multi-layer with permeable middle layers.
Sustainability 15 08573 g021
Figure 22. Schematic diagram of “inverted box shape” barrier for foundation.
Sustainability 15 08573 g022
Figure 23. Water content distribution in single-layer soil.
Sustainability 15 08573 g023
Figure 24. Water content distribution in double-layer soil (with aquitard as the lower layer).
Sustainability 15 08573 g024
Figure 25. Water content distribution in double-layer soil (with a permeable lower layer).
Sustainability 15 08573 g025
Figure 26. Horizontal diffusion ranges of water in double-layer soil with aquitard as the lower layer.
Sustainability 15 08573 g026
Figure 27. Horizontal diffusion ranges of water in double-layer soil with a permeable lower layer.
Sustainability 15 08573 g027
Table 1. Geological information of the loess tableland.
LayerAgeStratigraphic Characteristics
ColorConditionCollapsibility
Plain fill
(1-2)
Q4mlLight yellow~
brown yellow
Slight collapse
New loess
(3-1-1)
Q3eolBrown yellowMainly hard plastic, local plasticModerate collapse ~ severe collapse
Paleosol
(3-2-1)
Q3elMaroonMainly hard plastic, local plasticModerate collapse
Old loess
(4-1-1)
Q2eolBrown yellowMainly hard plastic, local plasticModerate collapse
Paleosol
(4-2-1)
Q2elMaroonPlasticSlight collapse
Table 2. Particle size composition of new loess.
NumberParticle Size (%)
Sand
>0.05 mm
Silt
0.05~0.005 mm
Clay
<0.005 mm
61~1266~7711~23
Average77419
Table 3. Mineral composition (%) in loess tableland.
Illite and MontmorilloniteKaolinite and ChloriteQuartzAnorthose and AlbiteCalciteDolomite, Pyrite, and SideriteCollapsible Characteristic
Range7.5~108~9.546~5314~1913~141~2Self-weight Collapsible site
Average99491713.51.5
Table 4. Analysis results of water-soluble salt in loess tableland.
NumberWater-Soluble Salt Content (%)
Soluble SaltModerately Soluble SaltInsoluble Salt
60.05~0.120.18~0.2312.3~16.7
Average0.080.2014.3
Table 5. Microstructure characteristics of loess before and after water immersion.
Geomorphic UnitGeological InformationDepthMicrostructure Characteristics
Particle Arrangement Pore StructureParticle Cementation
Loess tableland3-1-1
New loess
1.0 m
before immersion
BracketBracketed-microporeBracketed-micropore semi-cemented structure
1.0 m
after immersion
Bracket-inlaidInlaid-microporeInlaid-micropore semi-cemented structure
5.0 m
before immersion
BracketBracketed-microporeBracketed-micropore semi-cemented structure
5.0 m
after immersion
InlaidInlaid-microporeInlaid-micropore semi-cemented structure
9.0 m
before immersion
BracketBracketed-microporeBracketed-micropore semi-cemented structure
9.0 m
after immersion
InlaidInlaid-microporeInlaid-micropore semi-cemented structure
Table 6. Design parameters of the single-layer model.
Lithology CharacteristicSiltSilty Clay
Initial water content by volume0.270.11/0.15/0.27/0.35
Table 7. Design parameters of the double-layer model.
Thickness CombinationStratum Combination (Lithology Characteristic)
I/mII/mAB
1015Silt (collapsible)Silt (collapsible)
55Silty clay (aquitard)Sand (permeable)
6560Clay (non-collapsible)Clay (non-collapsible)
Table 8. Design parameters of the multi-layer model.
Thickness CombinationStratum Combination (Lithology Characteristic)
I/mII/mAB
510Silt (collapsible)Silt (collapsible)
11Silty clay (aquitard)Sand (permeable)
52.5Silt (collapsible)Silt (collapsible)
11Silty clay (aquitard)Sand (permeable)
52.5Silt (collapsible)Silt (collapsible)
6363Silty clay (aquitard)Silty clay (aquitard)
Table 9. Saturated permeability coefficients of various soils [36].
Types of SoilClaySilty ClaySiltSilty Sand
Permeability coefficient k (cm/s)<10−710−5~10−610−4~10−510−3~10−4
Table 10. Classification of water diffusion morphological characteristics.
Types of Stratum CombinationBottom Boundary of CollapsibilityMorphology Characteristic
Single layerMiddle of infiltration regionEllipse shape
Underpart of infiltration regionPear shape
Double layer with aquitard as the lower layerAquitardBowl shape
Underpart of infiltration regionInverted funnel
Double layer with a permeable lower layer Ladder shape
Underpart of infiltration regionLong axe shape
Multi-layer with aquitard as middle layersFirst aquitardBowl shape
Underpart of infiltration regionMulti-layer cone shape
Multi-layer with permeable middle layersFirst permeable layerLadder shape
Underpart of infiltration regionLong axe shape
Table 11. Combination schemes of foundation optimization treatment.
Types of Stratum CombinationThickness of the Collapsible Soil/mVertical Depths of the Barrier/mHorizontal Diffusion Ranges of Water/m
Double layer with aquitard as the lower layer10016 *
313 *
710 *
Double layer with a permeable lower layer1005 *
54 *
74 *
Double layer with aquitard as the lower layer25103 *
12 m (2 m below the aquitard)2 *
15 m (the depth of the aquitard)<1
17<1
20<1
Double layer with a permeable lower layer251014 *
12 m (2 m below the permeable layer)13 *
15 m (the depth of the permeable layer)4 *
171 *
20<1
Note: * indicates an approximate value.
Disclaimer/Publisher’s Note: The statements, opinions and data contained in all publications are solely those of the individual author(s) and contributor(s) and not of MDPI and/or the editor(s). MDPI and/or the editor(s) disclaim responsibility for any injury to people or property resulting from any ideas, methods, instructions or products referred to in the content.

