Article

Variations in Root Morphology and Yield among Rice Varieties in Response to Potassium under Subtropical Conditions

1
Department of Agronomy, Bangladesh Agricultural University, Mymensingh 2202, Bangladesh
2
Department of Crop Botany, Bangladesh Agricultural University, Mymensingh 2202, Bangladesh
3
Department of Agronomy, Patuakhali Science and Technology University, Dumki, Patuakhali 8602, Bangladesh
4
On Farm Research Division, Bangladesh Agricultural Research Institute, Gazipur 1701, Bangladesh
5
School of Agriculture and Food Sciences, The University of Queensland, Brisbane, QLD 4072, Australia
6
Botany and Microbiology Department, College of Science, King Saud University, P.O. Box. 2460, Riyadh 11451, Saudi Arabia
7
Plant Production Department, College of Food and Agricultural Sciences, King Saud University, P.O. Box. 2460, Riyadh 11451, Saudi Arabia
*
Author to whom correspondence should be addressed.
Sustainability 2023, 15(11), 8589; https://doi.org/10.3390/su15118589
Submission received: 20 April 2023 / Revised: 17 May 2023 / Accepted: 19 May 2023 / Published: 25 May 2023

Abstract

:
The relationship between rice root morphology and Potassium (K) is a major concern for its growth and development, and it has a substantial impact on yield as well. In light of this, the current pot research was run in the net house of the Department of Agronomy at the Bangladesh Agricultural University, Mymensingh, Bangladesh, throughout the boro (dry season irrigated) season of 2020–2021. Binadhan-10, Hira-2 and BRRI dhan29 were grown with five K fertilizers: 0 kg K ha−1 (K0), 32 kg K ha−1 (K32), 65 kg K ha−1 (K65), 98 kg K ha−1 (K98) and 130 kg K ha−1 (K130). Three replications of the investigation were conducted using a completely randomized design (CRD). The root number (RN), root length (RL), root volume (RV), root porosity (RP) along with leaf area index (LAI), total dry matter (TDM) and yield were assessed. Binadhan-10 with the K65 treatment significantly increased the RN, RL, RV, LAI, TDM and yield. With the further increase in the dosage of K that was under K98 and K130, the value of the root traits and yield did not increase. A positive connection was documented between the grain yield (GY) and all the root traits, excluding the RP. Binadhan-10 can be grown with 65 kg K ha−1 at field level for a satisfactory yield.

1. Introduction

Rice (Oryza sativa L.) is considered an extensively used cereal crop around the world, which is consumed as a regular diet by more than three billion individuals globally [1]. A crucial ingredient for plant growth and productivity is K. The requirement for potassium fertilizer has increased significantly in the last ten years with the rise in global food consumption [2]. Similar to nitrogen (N) and phosphorus (P), K is regarded as more crucial than most essential minerals needed for plant growth and development when present in relatively significant amounts. Enhanced rigidity to insects and pathogens, photosynthetic activity, osmotic regulation, enzymatic activities, activation and transfer of photosynthates, protein biogenesis, ionic equilibrium, consistency among monovalent and divalent cations in the water transportation through stomatal movement, support for plant turgidity, stress resistance, and the activation of several enzymes are just a few of the many functions of potassium in agricultural production systems [3,4]. The main organ for nutrient intake in plants is the root. There were significant differences in root morphological traits among rice cultivars and a positive association between root traits and yield [5]. Additionally, upland paddy’s root systems account for approximately 22% of the plant’s dry mass production and are primarily organized at the upper 20 to 40 cm soil depth; however, these characteristics may fluctuate depending on the soil’s chemical characteristics [6]. Highland rice plants collect a significant quantity of potassium from the soil [7,8]. The yield generated by the K application is not substantially higher compared to that produced by the N and P application, even after taking into consideration the diversity within the varieties [9].
Jia et al. [10] stated that in hydroponics, K absorption, as well as its transport to the shoot parts in rice plants, are regulated by root phenological factors, namely RL, RN, surface area, volume, the number of secondary roots, and the fineness (diameter 0.2 mm) as well as the thickness (diameter > 0.2 mm) of roots. Moreover, they found that compared to the varieties that produced at optimal K levels, K-efficient varieties generated 25% more fine roots at relatively lower potassium rates. Additionally, the potassium-efficient varieties generated 1.5-fold more roots and 1.3 times more surface area in comparison with the inefficient rice genotypes. Moreover, the roots of pea, barley, red clover, rye, perennial ryegrass and oil seed rape all have different root morphologies as a result of lower and moderate K levels [11]. In reaction to lower K concentrations, crops alter the length of their root hairs to sustain the absorption from scarcely dissolved potassium suppliers. Even with limited K availability, root systems can grow greatly to absorb water and minerals [12,13]. Researchers have looked at how K fertilization affects the development of plant roots [14]; however, few studies on upland rice are documented.
Finally, prior research was mostly focused on analyzing how K fertilization affected the upland rice variety’s yielding attributes, yield productivity and quality metrics [9,15]. Moreover, research has also been conducted on how K levels affect the root growth of rice seedlings and lowland rice varieties [16,17]. However, it is crucial to account for this information when adjusting the K rate recommendations for highland rice. Therefore, the current study emphasizes the evaluation of how K levels affect the upland rice variety’s root traits and its connection to yield and yield components.

2. Materials and Methods

2.1. Experimental Site and Plant Materials

The study was carried out under controlled conditions in the net house of the Department of Agronomy, Bangladesh Agricultural University, Mymensingh, Bangladesh (latitude: 24°42′55”, longitude: 90°25′47”) throughout the boro (dry season irrigated) period of 2020–21. The area is under the non-calcareous murky-grim floodplain soil below the Old Brahmaputra Floodplain Agro-ecological Zone (AEZ 9) [18]. Three different boro rice varieties, namely BRRI dhan29 (inbred), Binadhan-10 (inbred) and Hira-2 (hybrid), were selected as research materials based on previous superior findings. Table 1 lists the specifics of the above-mentioned rice varieties. Figure 1 displays the weather information during the study period in the mentioned area. The physicochemical parameters of the potting soil were examined before starting the experiment and have been shown in Table 2.

2.2. Experimental Design and Crop Management

Three replications of the investigation were run using a completely randomized design (CRD). The K levels, K0-0 kg K ha−1, K32-32 kg K ha−1, K65-65 kg K ha−1, K98-98 kg K ha−1 and K130-130 K kg ha−1, were used in the experiment. Fifteen pots per replication were arranged side by side with 15 to 25 cm of space between them. The treatments for each variety were randomly arranged to avoid any biases with placement.
The accumulated soil was sun-dried, grounded, well-mixed and then loaded into each 30 L plastic container (35 cm diameter) at a weight of 25 kg. Fertilizers, namely urea, Triple Super Phosphate (TSP), Gypsum and Zinc sulphate for the pot experiment were applied (AEZ basis) at 8.14 g, 2.5 g, 2.81 g and 0.09 g pot−1, respectively [19]. The fields were fertilized at the end of ploughing, with one-third of urea and whole amounts of other fertilizers. The remaining amount of urea (5.43 g) per pot was applied at 20 and 40 days after transplanting (DAT), respectively. The source of K was Muriate of Potash (MoP), and for K0-0 kg ha−1 soil, 0 g MoP pot−1 was applied; for K32-32 kg ha−1 soil, 1.6 g MoP pot−1; for K65-65 kg ha−1 soil, 3.25 g MoP pot−1; for K98-98 kg ha−1 soil, 4.9 g MoP pot−1; and for K130-130 kg ha−1 soil, 6.5 g MoP pot−1 was applied during the final pot preparation. The chosen varieties of seedlings, which had previously been grown in the seedbed, were transplanted into the pot at a maturity of forty days. At the time of transplanting, there was 4 cm of water in the pot. Prior to harvest, the irrigation was maintained for up to 15 days. Usually, weeds were found across the crop growing times, mainly during the early phases, and plucked by hand pulling. No harmful insect pests were recognized.

2.3. Determination of Root Morpho-Physiological Attributes

Data on root characters were documented at 20, 40, 60 and 80 DAT as well as at the harvest period. A deep dig was used to gently remove three plants from each pot, ensuring that the main tap root and all lateral roots could be safely uprooted. The tested plants were preserved for roughly 12 h in water-filled poly bags. To ensure that no roots were left and to facilitate easy root separation, the roots were thoroughly cleaned using 1 mm mesh sieves, and the recorded data of different attributes were then summed up.

2.3.1. Root Number (RN)

The entire count of roots for each plant in the crown area was numbered and documented.

2.3.2. Root Length (cm)

Root length (RL) was determined at all sampling dates from the core samples [20].

2.3.3. Root Volume (cm3 hill−1)

Root volume (RV) was determined using Archimedes’ law. The root of a single plant was put inside a measuring cylinder filled with water. The water volume was replaced by the RV. The RV was computed as the variation between the water level in the graduated cylinder before and after the roots were added and expressed as cm3 hill−1.

2.3.4. Root Porosity (RP, %)

The roots were kept in sealed polythene bags and conserved in water to safeguard the novel temperature. The pycnometer vials’ weights with and without water were measured, and the temperature of the water containing the vials was taken. For transferring extra water to the blotting paper, tissue paper was utilized to delicately wipe the roots. Using an electric measuring scale, the root weights were taken. The core root samples were submerged in the water containing the vials. To remove the air bubbles, the root samples submerged in the vials were managed with a sterilized needle. After taking the weight of the water and the whole core roots with an electric balance, the roots were collected from the vials and grounded with a glass mortar and pestle to make them homogenous. The total homogenate was loaded into the pycnometer vial to its capacity and weighed after reaching room temperature. The RP was computed using the following equation [21]:
%   porosity   = W hr   +   w W fr   +   w W w + W fr W fr   + w
Here, W hr+w indicates the weight of the grounded root samples and the weight of the water containing the vials; W fr+w indicates the weight of the fresh roots and the water containing the vials; Ww indicates the weight of the water containing the vials; and Wfr indicates the weight of fresh root.

2.3.5. Physiological Traits

Three leaves of the plants were taken, cleaned in water and subsequently dried using tissue paper in order to calculate the LAI. The surface area of the fresh, green leaves was calculated with a leaf area meter (Model LICOR 3000, Lincoln, NE, USA) and reported in cm2 plant−1. Extreme care was taken not to overlap any of the leaves when they were being placed on the roller. LAI was estimated using the equation mentioned by Evans [22].
LAI = Total   leaf   area   cm 2 / plant Ground   area   spacing   cm 2 / plant
Using the formulas outlined by Hunt [23], the crop growth rate (CGR), relative growth rate (RGR), and net assimilation rate (NAR) were estimated based on the plant dry matter accumulation over time.

2.3.6. Crop Growth Rate (g m−2 day−1)

The CGR was computed with the equation defined as:
CGR = SA   × Wii Wi Tii Ti
Here, Wi and Wii denote dry weights (g hill−1) during the periods of Ti and Tii, respectively. SA indicates the surface area covered by the hill.

2.3.7. Relative Growth Rate (mg g−1 day−1)

The RGR was determined by the equation defined as:
RGR = loge   Wii loge   Wi Tii Ti
Here, Wi and Wii denote dry weights (g hill−1) during the periods of Ti and Tii, respectively. Loge (Natural log value) = 2.3

2.3.8. Net Assimilation Rate (mg m−2 day−1)

The Net Assimilation rate (NAR) was estimated using the formula defined as:
NAR = CGR   × loge   Lii loge   Li Lii Li
Here, Li and Lii indicate the leaf area (m2) during the periods of Ti and Tii, respectively.
The CGR indicates the Crop Growth Rate (g m−2 day−1).

2.3.9. Total Dry Matter (TDM)

Three hills (plants) were removed per treatment during every growth period. Separated leaves, stems and inflorescences were kept in paper bags and dried in an oven. The weight of the dried materials was measured using an electronic balance, and afterwards, their mean scores (g hill−1) were estimated. The dry masses of the above-mentioned crop organs were added up to determine the total dry matter.

2.3.10. Yield and Yield Components

Data on grain yields and associated attributes, such as plant height (PH), number of effective tiller plant−1 (ET), panicle number (PN), panicle length (PL), grains number panicle−1 (GNP), 1000-grain weight (TGW), grain yield (GY) and straw yield (SY) were documented with the procedures mentioned by Peng et al. [24].

2.4. Statistical Analysis

The analytical program JMP Pro 16 (SAS Institute Inc, North Carolina, America) was employed to perform the two-way analysis of variance (ANOVA) test, and the mean deviations were assessed with Tukey’s honestly significant difference (HSD) post hoc test at the 5% and 1% probability ranges. The dataset visualization and association matrix were constructed using the Sigma Plot v14 (Systat Software, Inc., San Jose, CA, USA, http://www.systatsoftware.com, (accessed on 30 August 2022) and R (R for Windows 4.1.2) [25].

3. Results

3.1. Root Morphological Traits, Total Dry Matter and Leaf Area Index

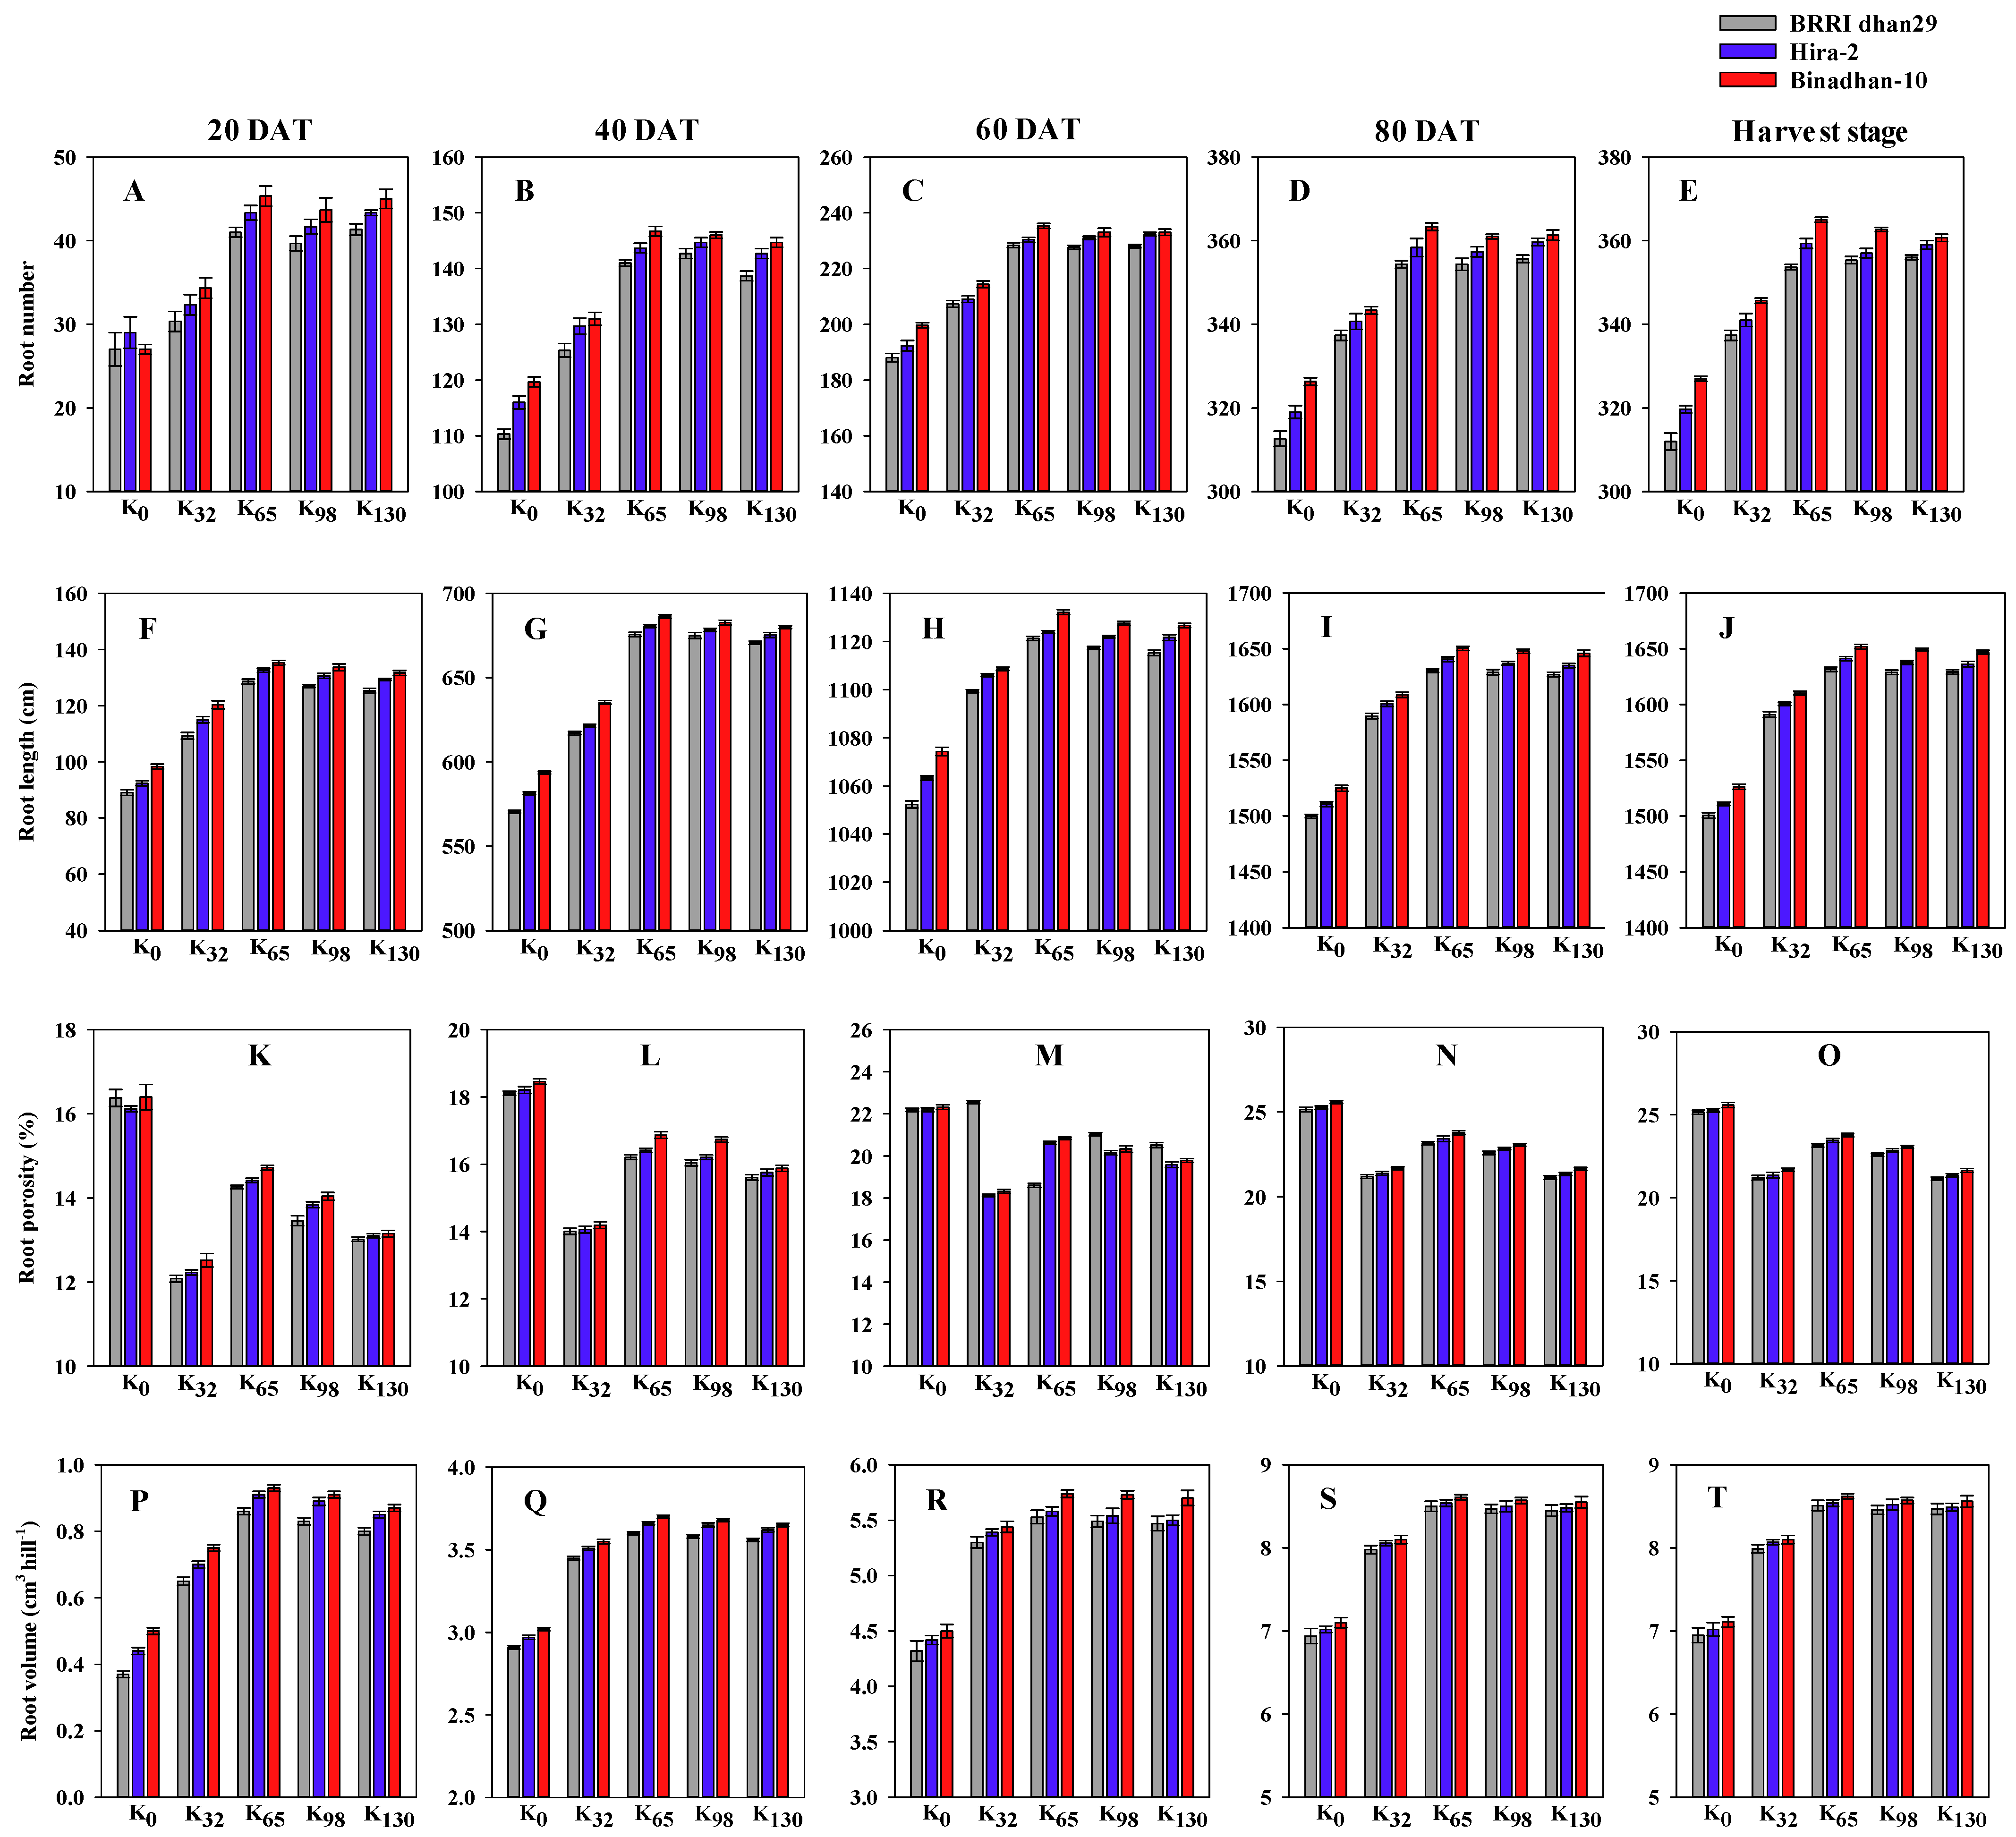
The RN of the three rice varieties was significantly impacted by the rate of K. At the K65 level, the highest RN was recorded as 43.22, 143.78, 231.33, 358.67 and 359.33, respectively, at 20, 40, 60, and 80 DAT as well as at the harvest stage. It is evident that K0 had the lowest RN at every observation when compared to other treatments. The RN grew from K0 to K65, but after that, it declined across all observations. The rice variety has a huge impact on the RN as well. Binadhan-10 generated the highest RN of 39.07, 137.60, 223.07, 351.07, and 352.20 at 20, 40, 60 and 80 DAT as well as at the harvest stage, accordingly. The interaction between K and each variety exerted a significant effect on RN as well (Figure 2). Binadhan-10 yielded the maximum RN of 45.33, 146.67, 235.33, 363.33 and 365.00 at 20, 40, 60 and 80 DAT as well as at the harvest stage, accordingly, along with K65. In the case of Binadhan-10, the RNs at 80 DAT with K32, K65, K98 and K130 were 5.21, 11.34, 10.62 and 10.73% greater than with K0 level, respectively.
Similar to the RN, K had a considerable impact on the RL of all the studied rice varieties as well. The largest RL was observed at the K65 levels of 132.22, 680.78, 1125.83, 1640.44 and 1641.67 cm at 20, 40, 60 and 80 DAT as well as at the harvest stage, accordingly. On the other hand, the lowest RL was noticed at the K0 level. Binadhan-10 generated the maximum RL of 123.87, 655.53, 1113.90, 1615.60 and 1617.00 cm at 20, 40, 60 and 80 DAT and at the harvest stage, correspondingly. The impact of the interaction between K and each variety also exhibited a substantial influence on the RL (Figure 2). Binadhan-10 with K65 had the highest RL of 135.33, 686.00, 1132.17, 1650.33 and 1652.00 cm at 20, 40, 60 and 80 DAT as well as at harvest time, correspondingly. The RLs with K32, K65, K98 and K130 for Binadhan-10 at 80 DAT were 5.49, 8.22, 8.07 and 7.93% higher, respectively, than with K0 level at 80 DAT.
The RP was significantly affected by the rice varieties and K treatments. The RP was found to be at its maximum level under the K0 treatment, measuring 16.30, 18.26, 22.36, 25.33 and 25.34% at 20, 40, 60 and 80 DAT as well as at the harvest time. The RP increased with the decrease in K, and it might be due to the development of aerenchyma at the K deficit level. Binadhan-10 produced the greatest value of RP, i.e., 14.16, 14.43, 20.53, 23.14 and 23.1% at 20, 40, 60 and 80 DAT as well as at the harvest time. On the contrary, BRRI dhan29 had the lowest value of RP as 13.48, 16.00, 21.13, 22.64 and 22.66% at 20, 40, 60 and 80 DAT as well as at the harvest time. Binadhan-10 generated the greatest score of RP at the K0 level as 16.40, 18.46, 22.56, 25.58 and 25.59% at 20, 40, 60 and 80 DAT as well as at the harvest time, accordingly (Figure 2).
When K was added to the three rice varieties, the RV of each variety was greatly enhanced; however, at greater concentrations, it tended to decline regardless of the type of variety. The maximum RV was observed at the K65 level of 0.90, 3.65, 5.62, 8.55 and 8.55 cm3 hill−1 at 20, 40, 60 and 80 DAT as well as at the harvest stage, accordingly. In the case of variety, Binadhan-10 generated the greatest RV of 0.79, 3.52, 5.42, 8.19 and 8.19 cm3 hill−1 at 20, 40, 60 and 80 DAT as well as at the harvest stage, correspondingly. Binadhan-10 with K65 had the highest root volumes of 0.93, 3.70, 5.74, 8.61 and 8.62 cm3 hill−1 at 20, 40, 60 and 80 DAT as well as at the harvest stage, accordingly (Figure 2). The RVs of Binadhan-10 with K32, K65, K98, and K130 at 80 DAT were 14.08, 21.27, 20.70 and 20.42% higher, respectively, when compared with the K0 level.
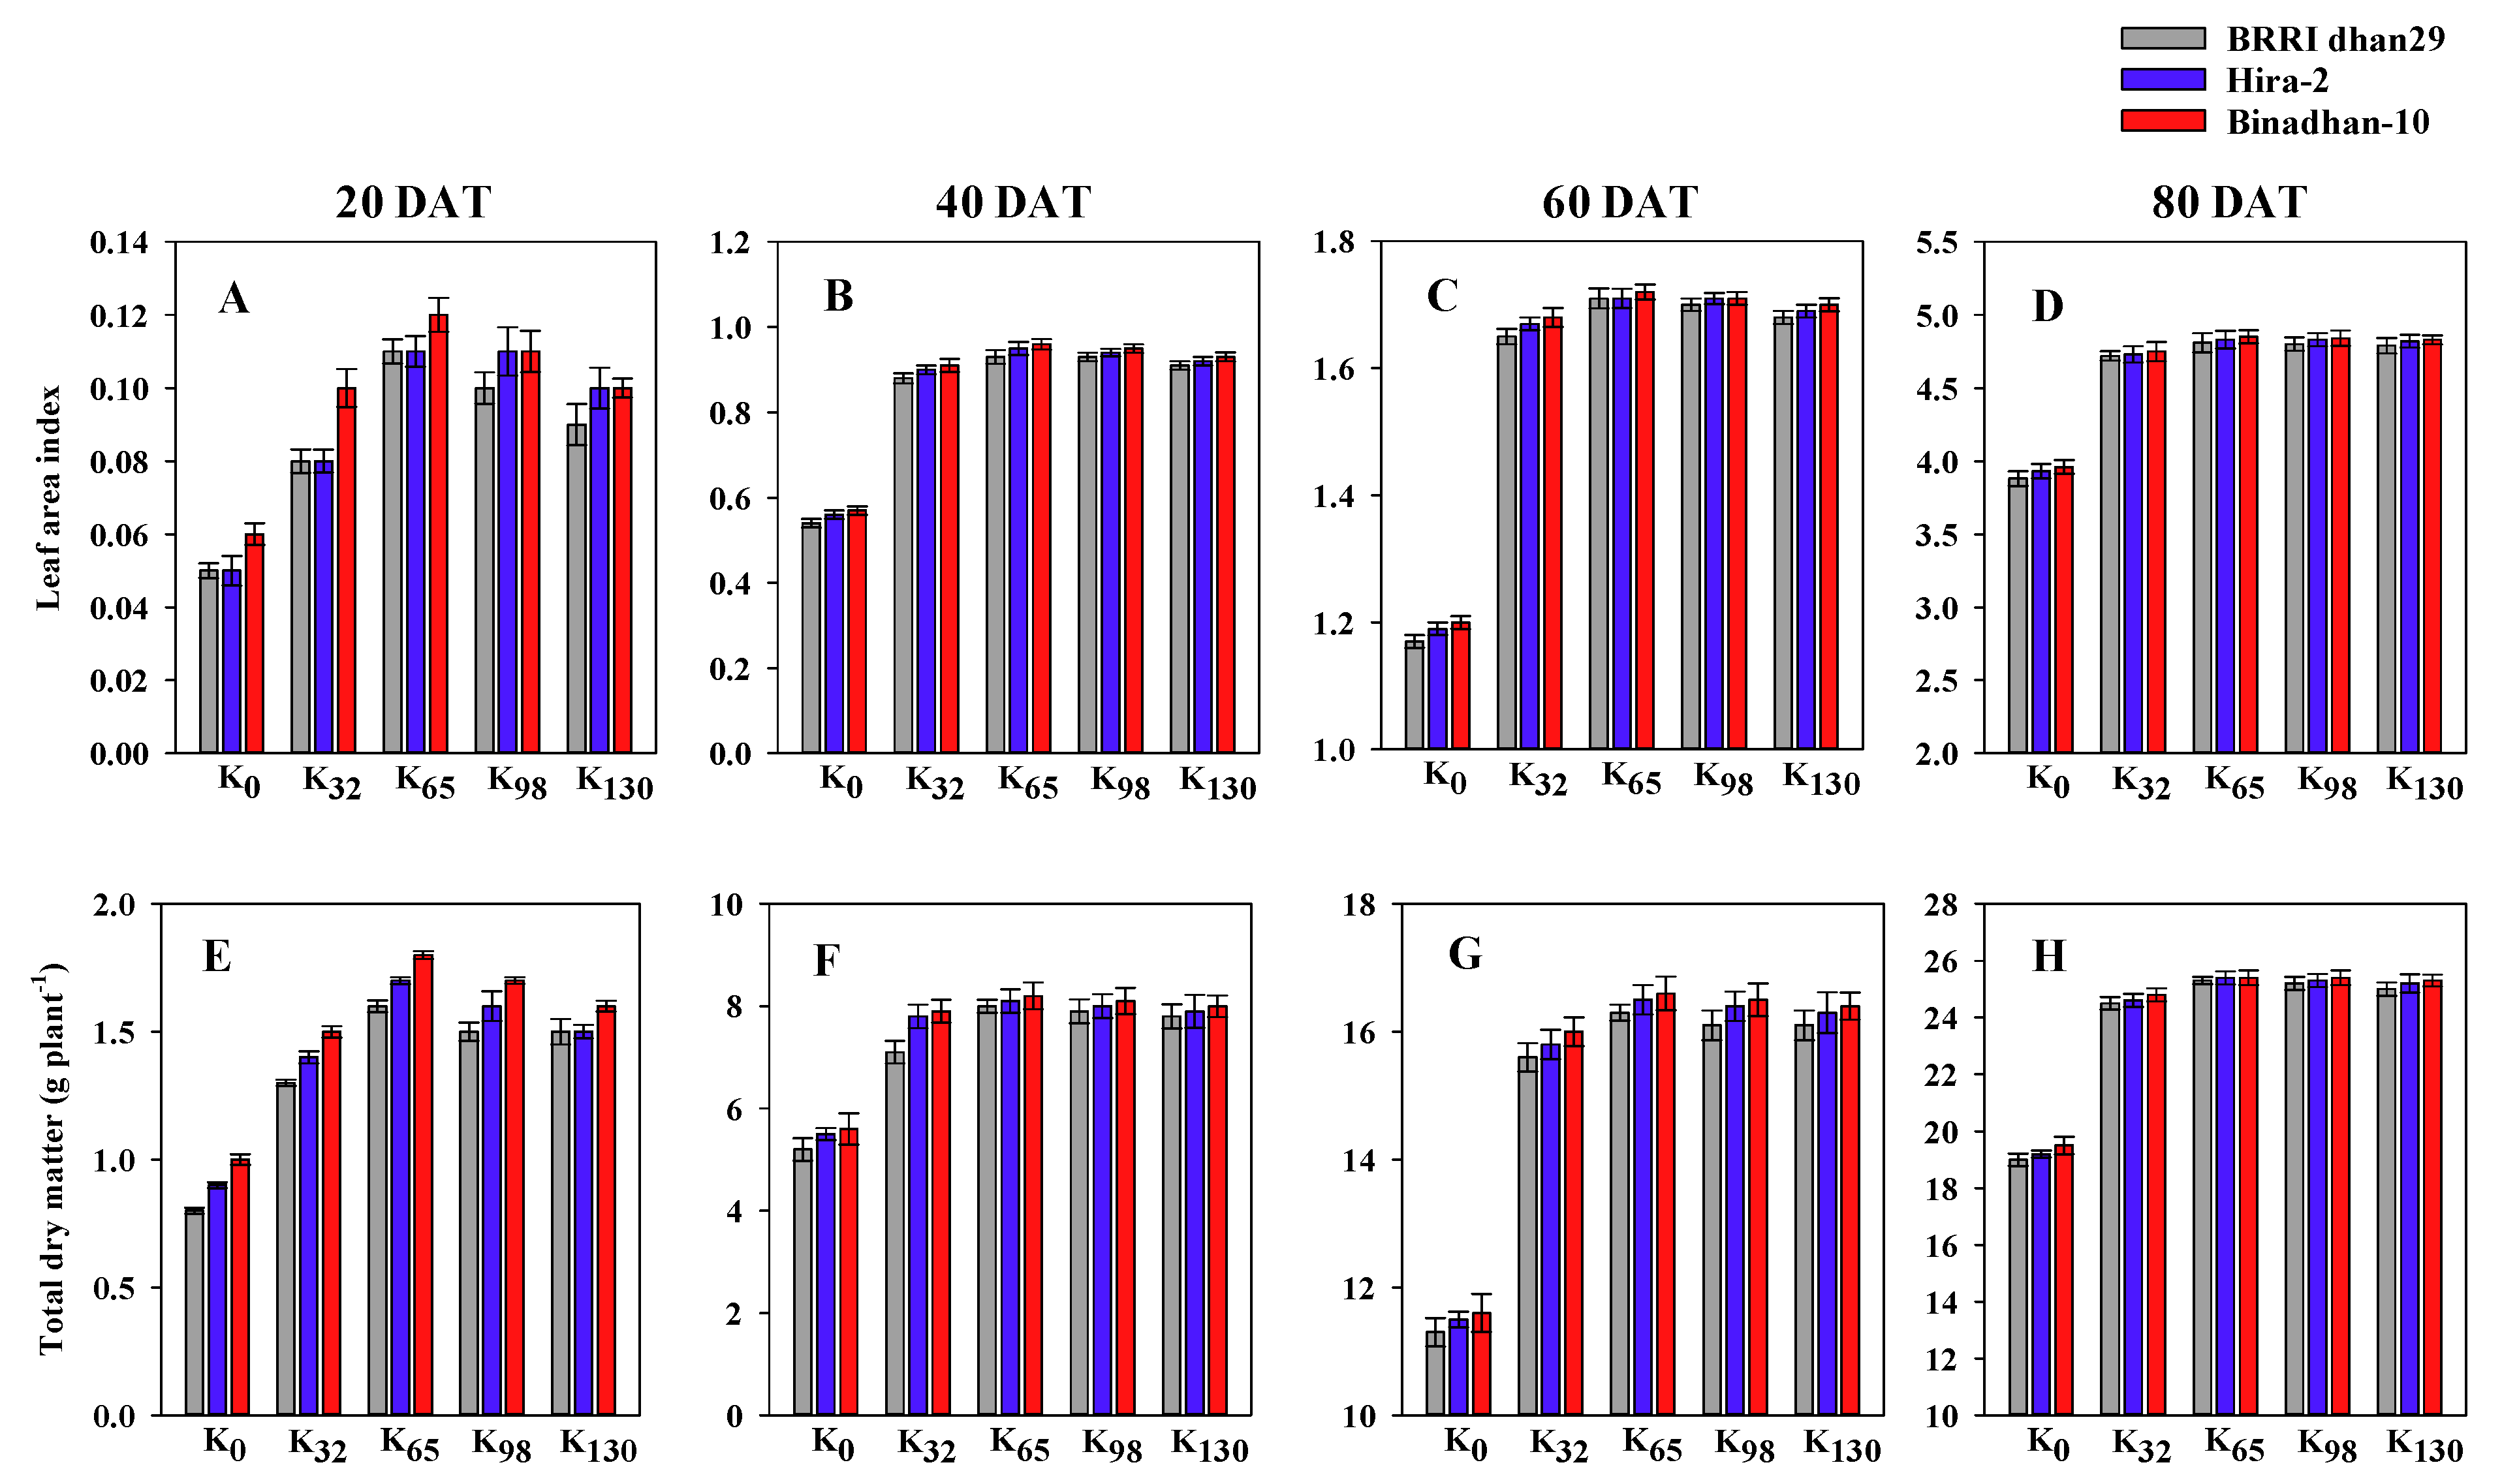
Figure 3 illustrates the influence of K and the type of variety on the TDM and LAI at several DATs. At 80 DAT, Binadhan-10 exhibited the maximum TDM (24.08 g plant−1) and LAI (4.65), whereas BRRI dhan29 produced the smallest TDM (23.80 g plant−1) and LAI (4.60). Under the K65 treatment, the highest TDM (25.35 g plant−1) and LAI (4.83) at 80 DAT were recorded, while the minimum value was documented at K0 with the TDM of 19.25 g plant−1 and the LAI of 3.92 at 80 DAT. When considering interactions, Binadhan-10 yielded the biggest TDM (25.37 g plant−1) and LAI (4.85) at 80 DAT under the K65 treatment, whereas BRRI dhan29 generated the smallest TDM (19.03 g plant−1) and LAI (3.88) values.

3.2. Growth Parameters

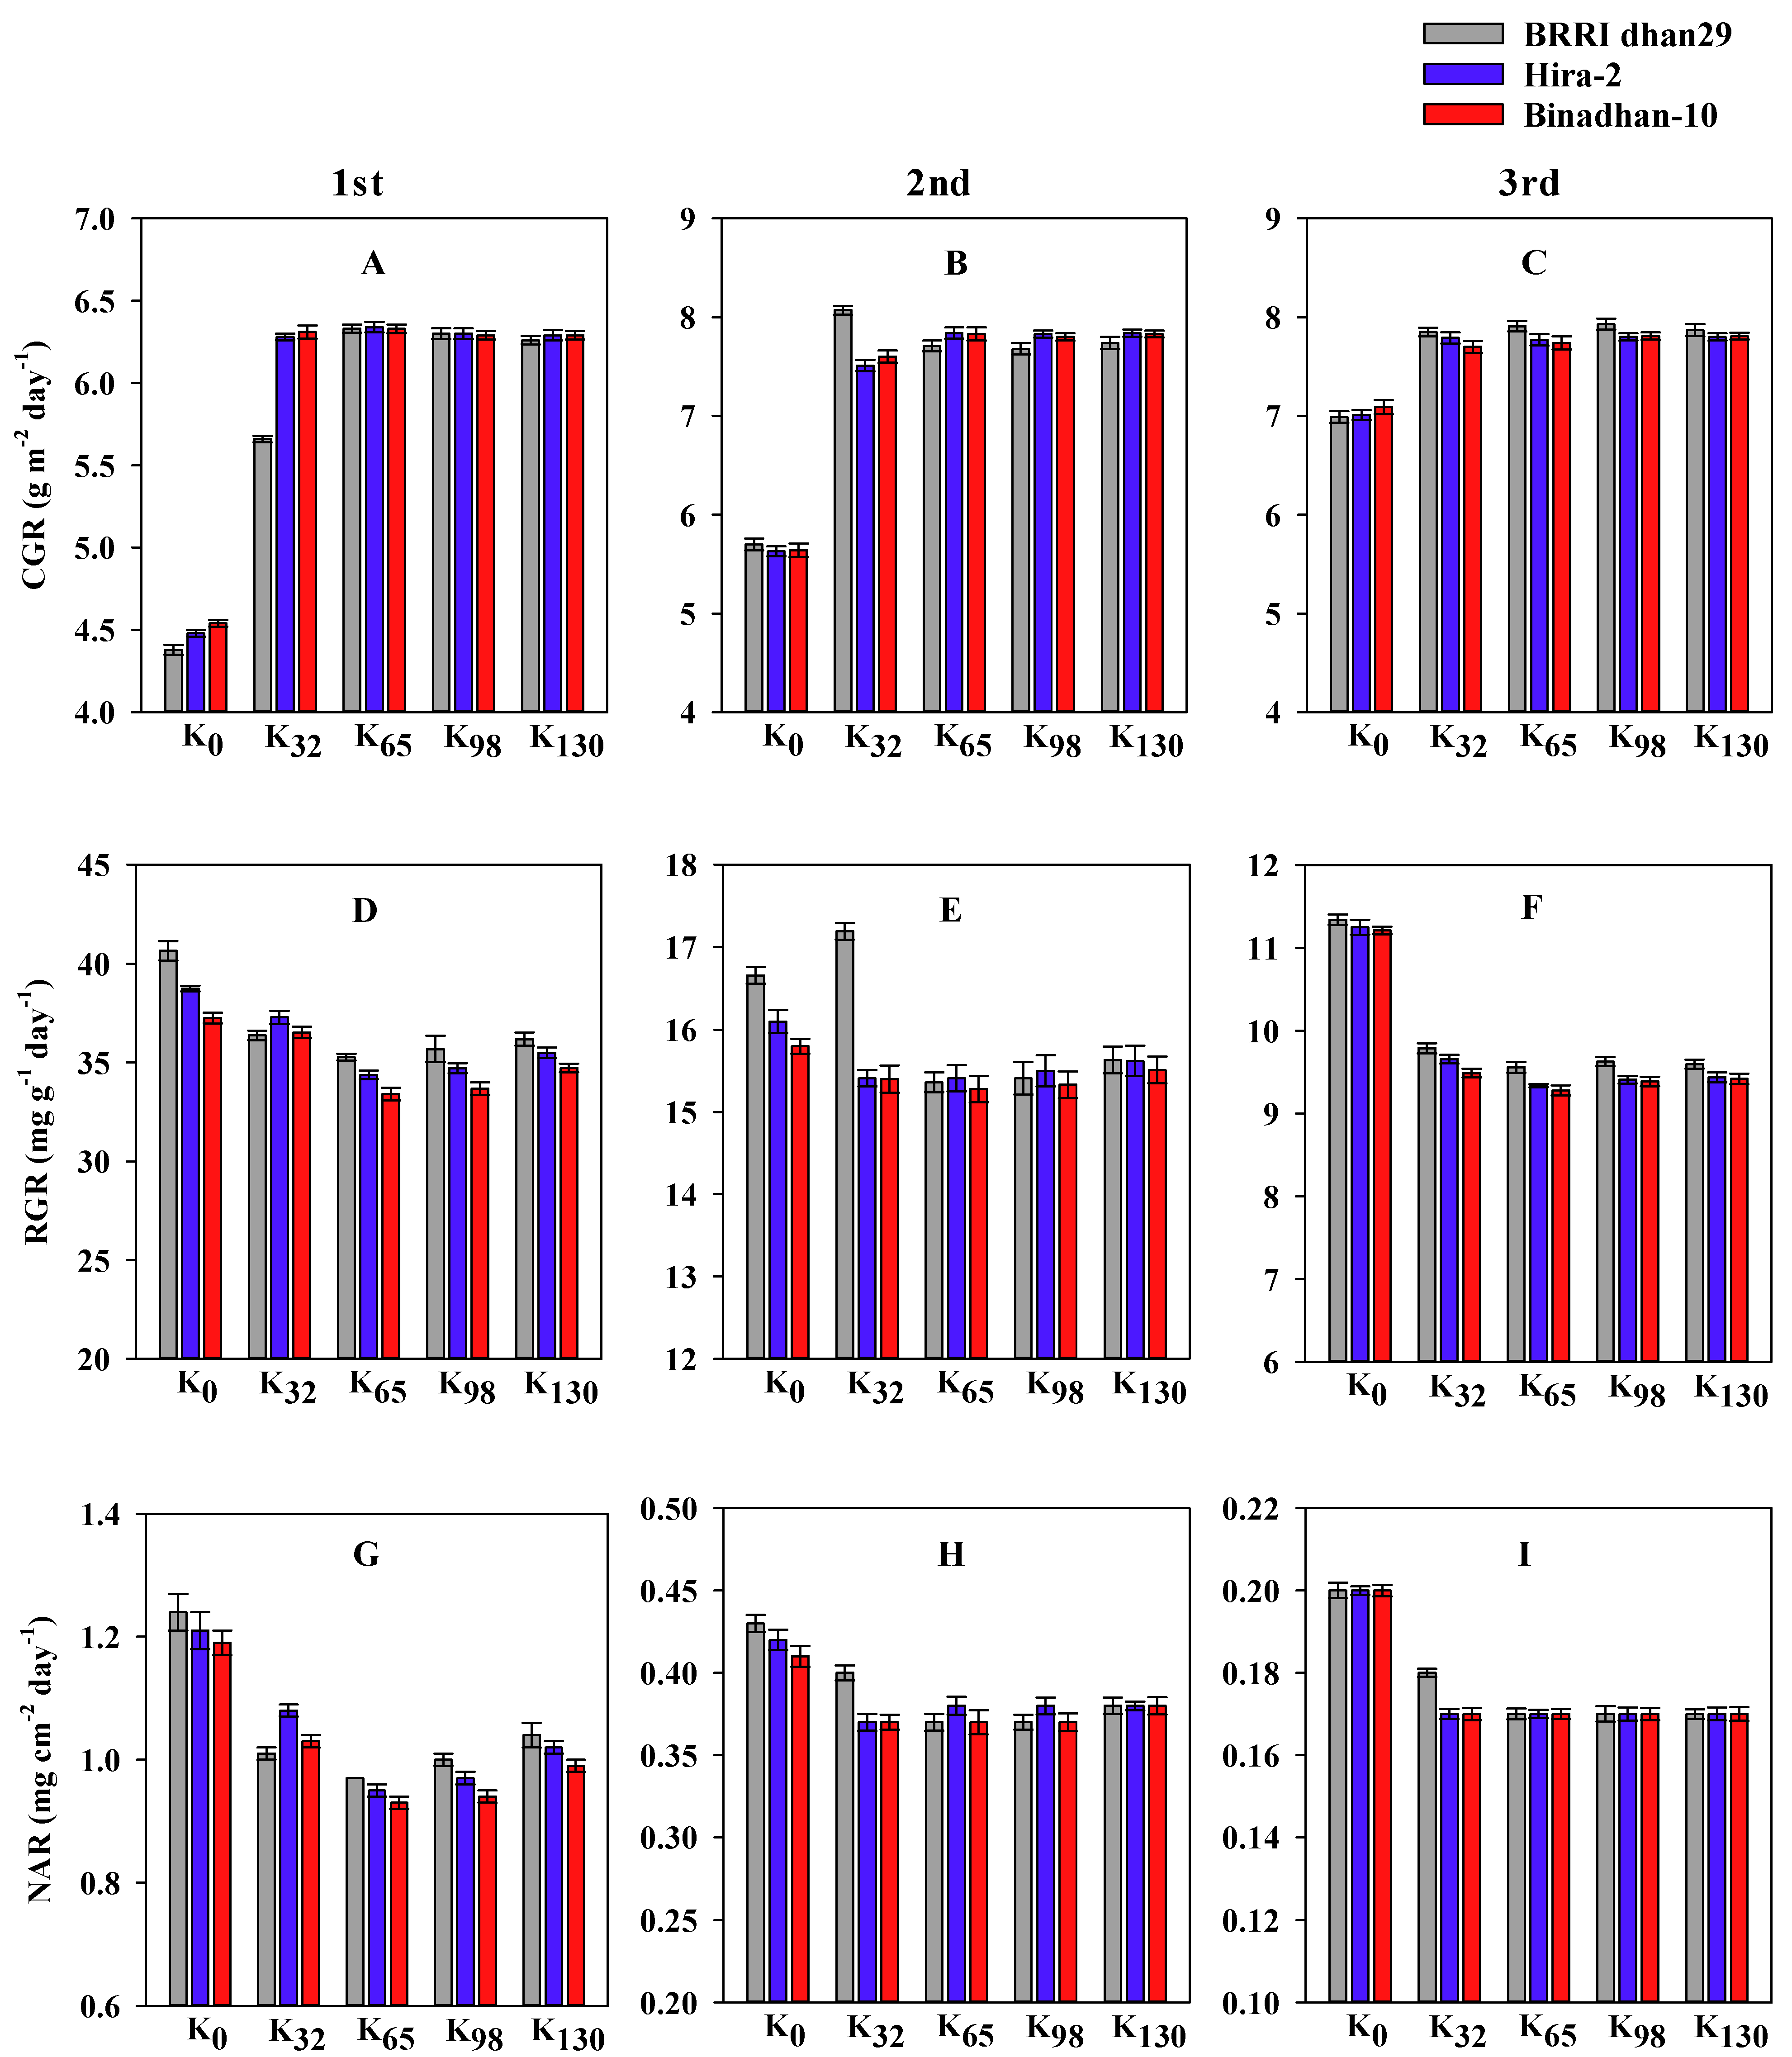
The values of CGR, RGR and NAR at 20–40 DAT (1st), 40–60 DAT (2nd) and 60–80 DAT (3rd) of the examined varieties were also significantly varied under different K levels. The CGR value was at its minimum during the initial growth phases but reached its peak at 60–80 DAT. Irrespective of varieties and treatments, the RGR was higher at the earlier growth stages and tended to decline as the plant development phases progressed. At 60–80 DAT, BRRI dhan29 produced the greatest (7.71 g m−2 day−1) CGR score, while the least (7.63 g m−2 day−1) value was found in Binadhan-10. When considering the K treatments, K98 generated the greatest (7.85g m−2 day−1) CGR, and K0 yielded the minimum (7.03 g m−2 day−1) CGR. When considering the interaction between the varieties and potassium, the biggest CGR (7.93 g m−2 day−1) was noticed in BRRI dhan29 at K98. BRRI dhan29 produced the biggest (9.98 mg g−1 day−1) RGR value during 60–80 DAT. Under different K treatments, the biggest (11.27 mg g−1 day−1) RGR was found in the K0 treatment. In the case of the interaction between each variety and K, the greatest RGR (11.34 mg g−1 day−1) was noticed in BRRI dhan29 under K0 at 60–80 DAT, while the lowest value (9.28mg g−1 day−1) was observed in BInadhan-10 with the K65 treatment (Figure 4). In some cases, BRRI dhan29 with K32 produced the highest CGR, and this might be due to the imbalance of the K application.
The NAR of different rice varieties continued to reduce from 20 to 40 DAT regardless of how often they were measured or how much K was supplied. Moreover, a consistent decline in the NAR was seen from 40 to 60 DAT of the variety. BRRI dhan29 generated the greatest NAR value (0.18 mg cm−2 day−1) during 60–80 DAT. On the other hand, in the case of K treatment, the greatest NAR score (0.20 mg cm−2 day−1) was recorded under K0, but K65 produced the minimum value of RGR (0.16 mg cm−2 day−1) during 60–80 DAT. When considering interactions, BRRI dhan29 with K0 generated the greatest NAR score (0.19 mg cm−2 day−1), while Binadhan-10 produced the minimum value (0.17 mg cm−2 day−1) under the K65 level at 60–80 DAT (Figure 4).

3.3. Grain Yield and Yield Component of the Rice Varieties

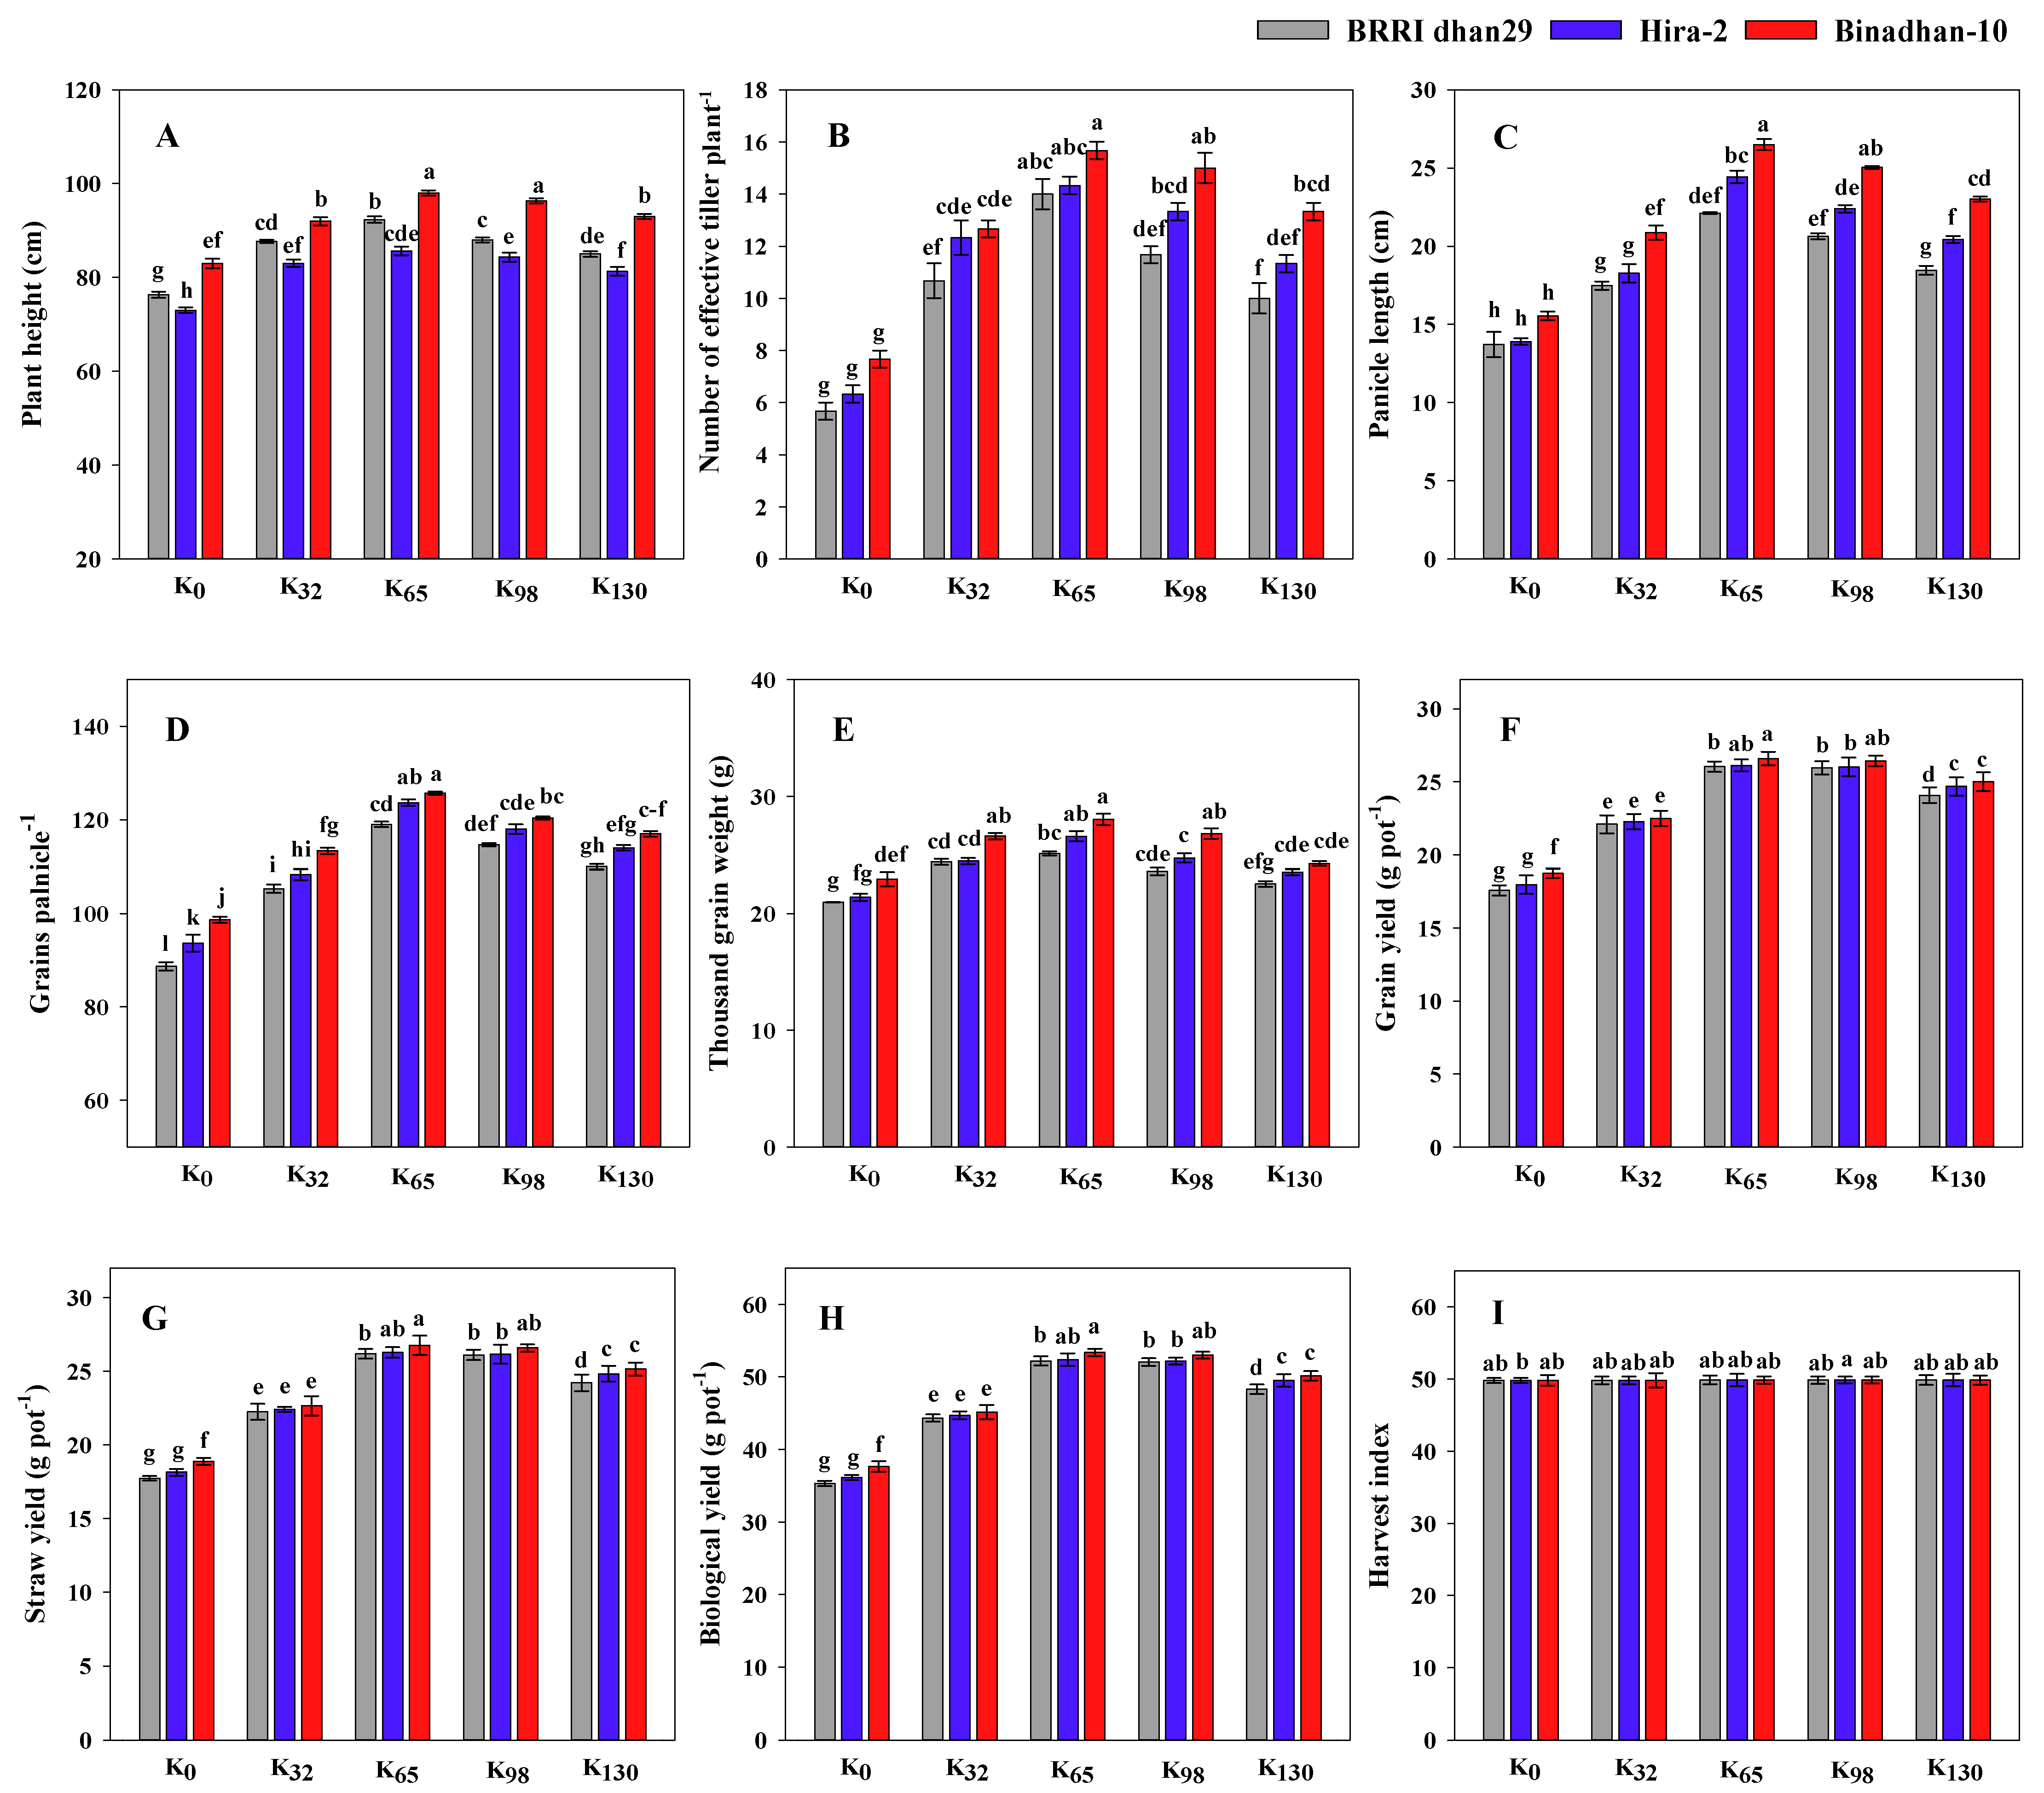
Yield attributes and yield influenced by the rice variety and K levels are presented in Table 3. Binadhan-10 yielded the highest values of PH (92.47 cm), ET (12.87 cm), PL (22.19 cm), GNP (115.00 g), TGW (25.73 g) and grain yield (23.86 g pot−1), while BRRI dhan29 yielded the smallest values of all the above-mentioned attributes (Table 3). When considering the K treatments, the K65 level gave the highest values for the parameters PH (92.00 cm), ET (14.67), PL (24.35 cm), GNP (122.78), TGW (26.58 g) and grain yield (26.26 g pot−1), while the smallest readings of these attributes were produced at K0. Figure 5 displays that yield and yielding parameters were substantially influenced by the interaction between the varieties and K. The maximum values of ET (15.67), PL (26.50 cm), GNP (125.67), TGW (28.03 g) and GY (26.60 g pot−1) were identified in Binadhan-10 at K65, at the same time the lowest values were discovered in BRRI dhan29 at the K0 level (Figure 5). The grain yield for Biandhan-10 was seen to be 19.89%, 41.79%, 40.88% and 33.26% higher with the K32, K65, K98 and K130 levels, respectively, than with K0.

3.4. Relationship among Root Traits, Growth Indices, Yield and Yield Attributes

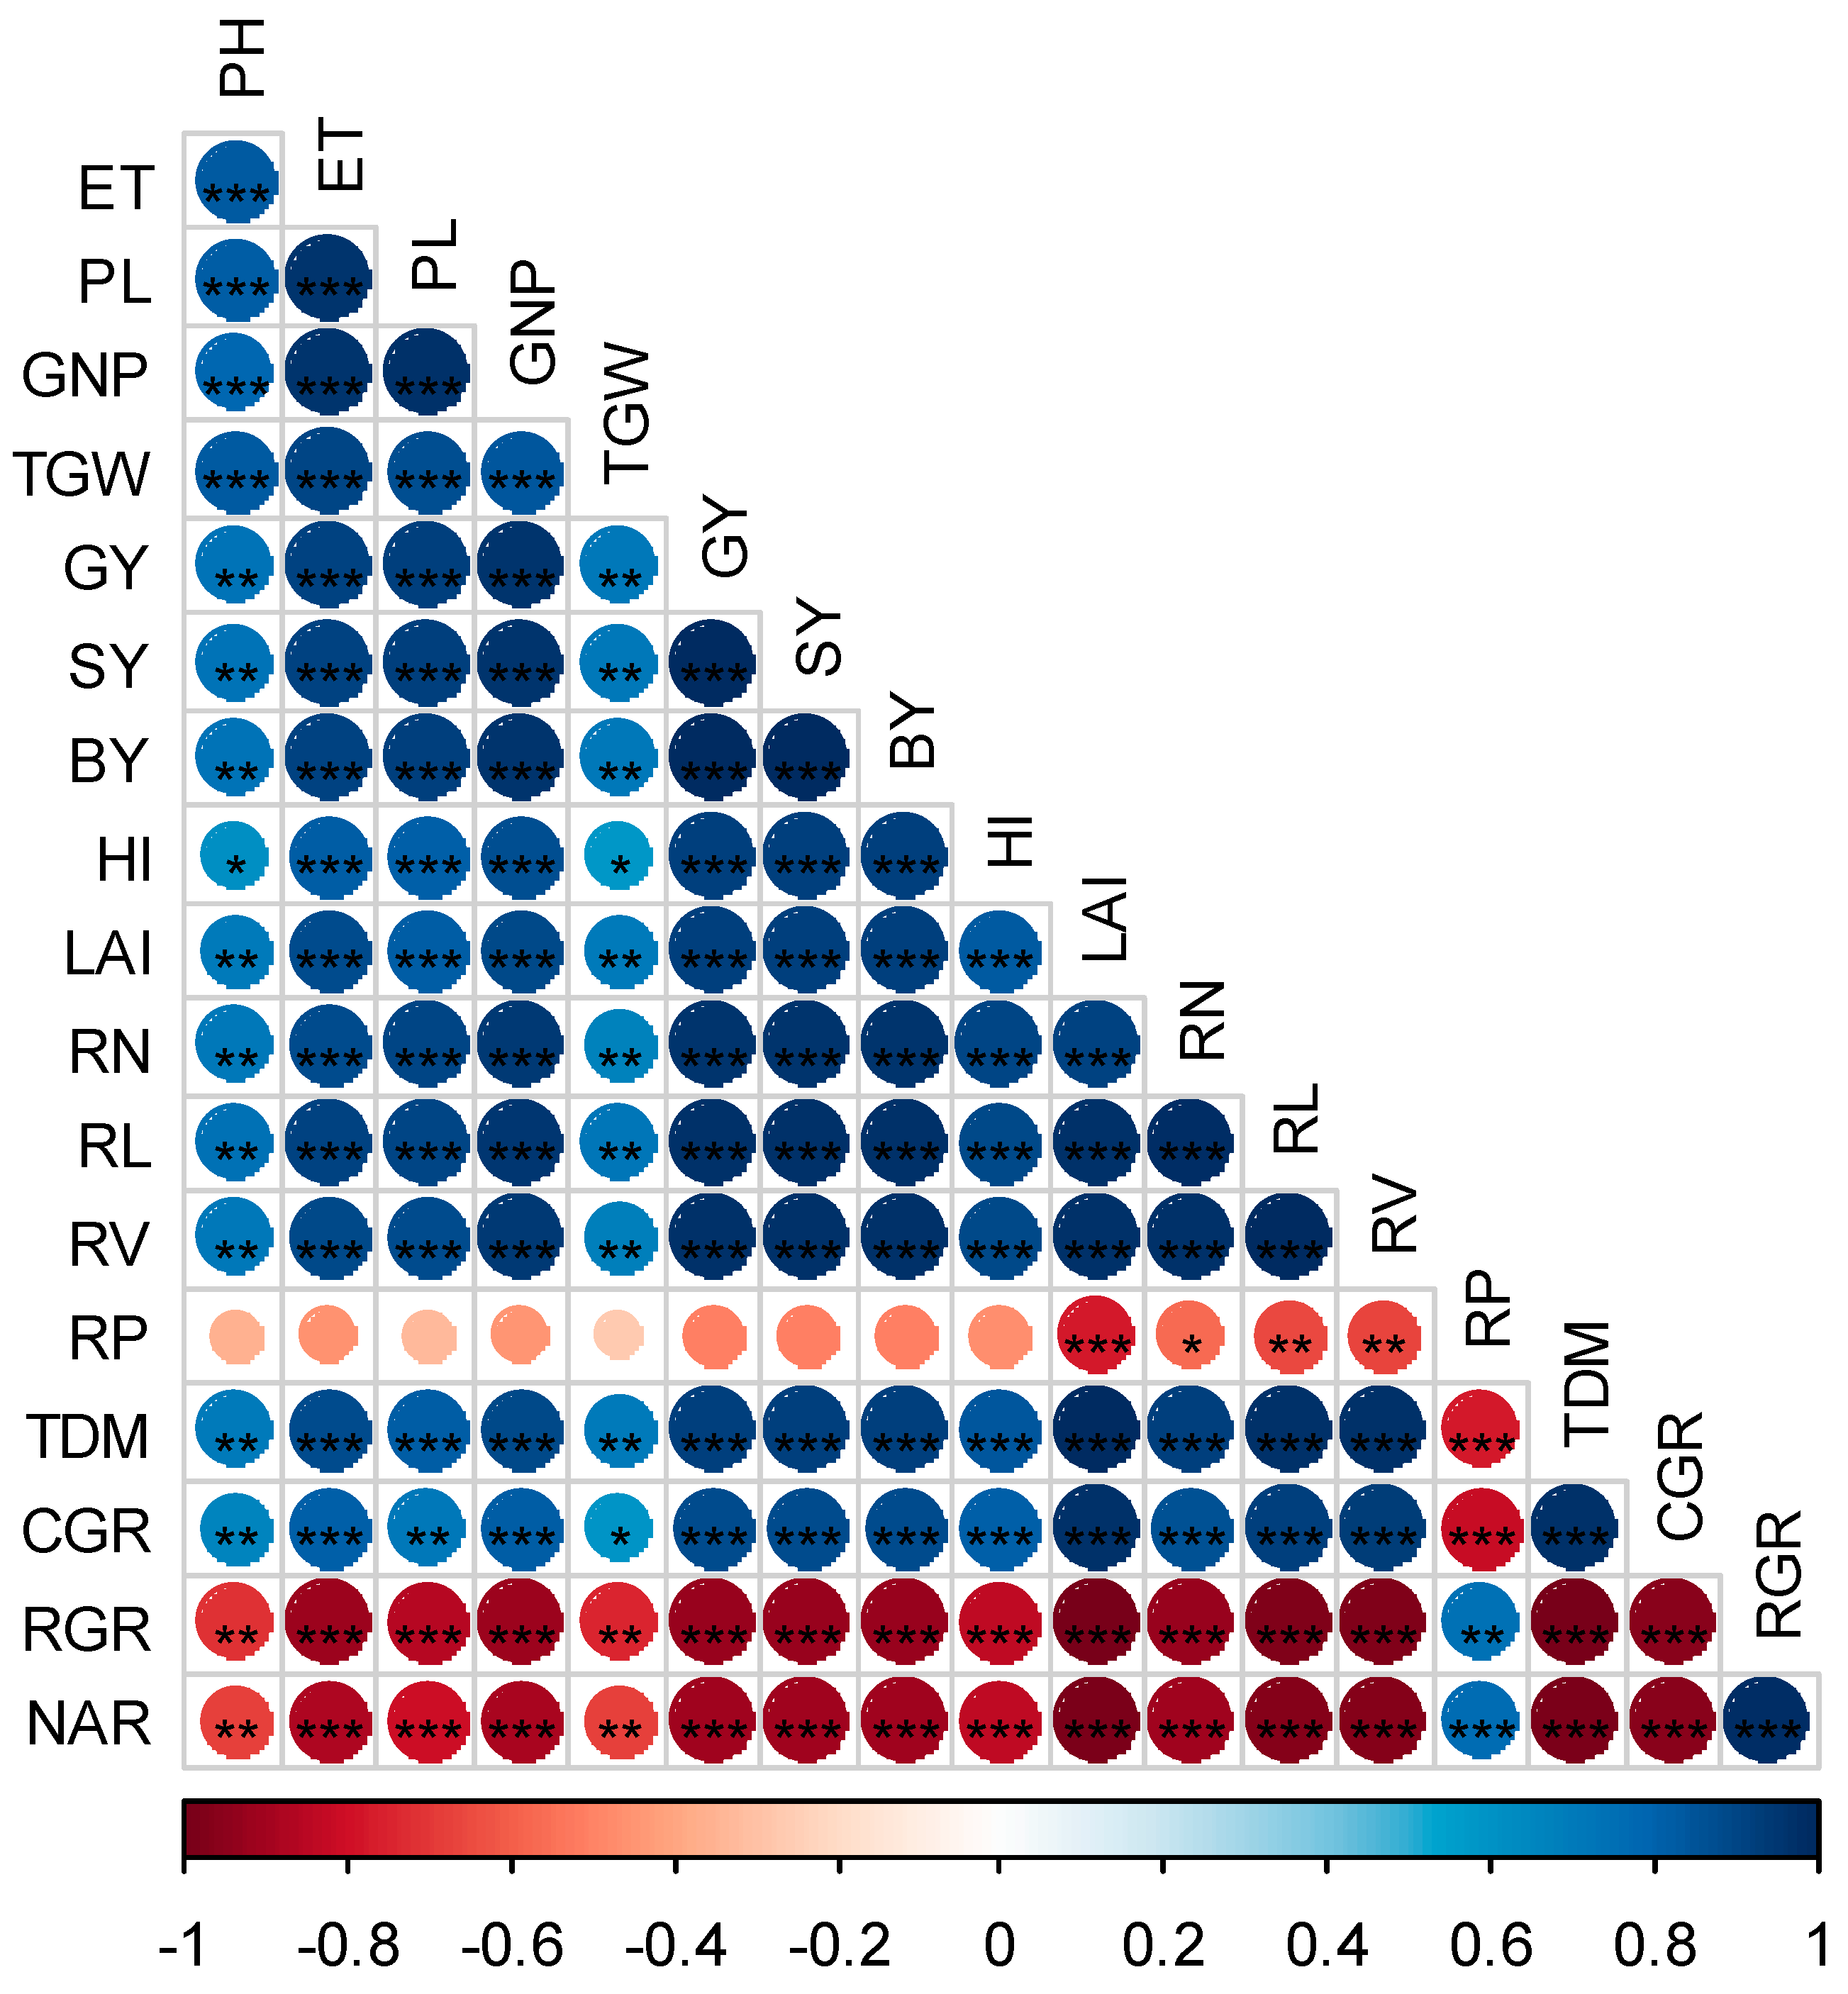
Figure 6 depicts the correlation matrix for root traits, growth indices, yield and yield components in order to investigate the relationships among them. The LAI and TDM had a significantly positive relationship with all root traits, apart from RP. The relationship of CGR with LAI and TDM is significantly positive, while for the RGR and NAR, it is negative. The GY, SY, BY and HI showed substantial positive correlations with all root traits, apart from RP. On the other hand, the relationships of GY, SY, BY and HI with CGR were positive and significant, whereas, with RGR and NAR, they were negative. Again, PH, ET, PL, GNP and TGW also had significant and positive relationships with RN, RL and RV, while with RP, there was a negative relationship.

4. Discussion

Numerous crop plants, including alfalfa [26], tomato [27], ramie [28], wheat [29] and barley [30], showed genotypic heterogeneity in potassium utilization efficacy. In low K soils, rice also exhibited genetic variations [31]. According to Shah et al. [32], rice is typically grown using five fertilizers, among which potassium becomes essential for crop development as well as fertility [33]. K deficiency limits plant establishment, root growth and yield [34]. K is needed for the proper functioning of a wide range of enzymes, such as those associated with carbohydrate metabolism, protein biosynthesis and solute transportation. By inhibiting the pathways for anion buildup and electron transfer, it also considerably enhances cell turgor, particularly in rapidly growing cells [35,36]. So, a relationship exists between K and plant roots and yield. Five potassium dosages were used in the current research in order to focus on this issue. In this study, we found that rice varieties and K doses had a substantial impact on root characteristics, growth dynamics and grain yield.
LAI and CGR were highest at 80 DAT and were then reduced regardless of all varieties and treatments, whereas RGR and NAR showed a diminishing trend from the very early stages. The rise in metabolically activated tissues, which provided less support for crop development, is probably responsible for the decline in the RGR. The shadowing of older leaves by upper leaves has also been proposed as a possible factor for the decline in RGR [37]. The NAR represents plant photosynthetic efficiency. At the advanced phases of plant development, the shadowing of the lower leaves, as well as the rise in photosynthetically inefficient older leaves, might be responsible for the decline in the NAR. This study showed that the PH, LAI, CGR, RGR and NAR increased markedly in plants treated with K65 over those with K0, K32, K98 and K130. K is one of the three macronutrients most crucial for crop development and grain output, and its insufficiency in rice fields has emerged as one of the major limitations for enhancing rice plant development. Additionally, prior research has shown that K stress exerts a substantial impact on the physiological mechanism of various rice cultivars [38]. K has the potential to lessen the NH4 fixation in the soil and thereby promote the supply of nitrogen. The most likely reason is that K fertilization makes it possible for K ions to fill up non-exchangeable areas and lowers the spaces usable for NH4 absorption [39,40], which raises the N level of the soil. The enhanced N supply may boost the PH and the synthesis of dry mass, which in turn, raises the CGR, RGR and NAR.
The ultimate purpose of applying any input to a crop is dry matter production due to its close association with productivity. K is an essential plant nutrient that may contribute to as much as 10% of the plant’s dry matter [41]. It is hypothesized that large sink sizes can be produced by greater dry mass synthesis during the mid-development phases by stimulating grain differentiation, minimizing grain degradation and boosting endosperm cell growth during the initial phases of grain formation [42,43,44,45]. In this study, the TDM linearly increased up to K65 and at 80 DAT; after that, at the harvest stage and at higher doses, it did not increase at all. Binadhan-10 produced the highest TDM at all observations, followed by Hira-2 and BRRI dhan29. Tabatabei et al. [46] reported that the elevated K levels might substantially enhance the TDM during the booting stage because K promotes N assimilation. The results of the current investigation indicated that the dry matter accumulation in rice was greatly boosted by K fertilization. The rise in the net photosynthetic activity, which was associated with greater chlorophyll levels because of K fertilization, might be the reason for the rise in dry matter deposition. Our findings supported the earlier research’s findings that K fertilization might boost chlorophyll concentrations and net photosynthetic rates [47].
In this study, the RN, RL and RV increase linearly up to K65 irrespective of all varieties under all observations. After that, under a high dose of K, the root traits did not increase at all. Binadhan-10 generated the highest RN, RL and RV, followed by Hira-2 and BRRI dhan29 at the K65 level. We found that moderate K concentrations (65 kg ha−1) may encourage root development. In addition, inadequate K input rates substantially impeded root development which might be owing to the increased ethylene production as well as decreased indole-3-acetic acid (IAA) levels in the roots [48]. Root growth inhibition caused by excessive K input, however, might be responsible for the inadequate supply of photosynthates from leaves to roots. In order to maintain equilibrium with anions and osmotic potential, K is the most readily available cation in tissues, and its deficiency decreases the turgor pressure required for root development [49,50] and causes a charge ratio imbalance [51] that inhibits cell growth. Energy and photosynthates are used up during root growth, and the morphological properties of the roots exert a direct influence on the intake of moisture and minerals [52]. The RL, RV, and RN were lower at low K levels, whereas greater K levels resulted in the opposite. This reveals that the rice variety and variations in K levels were closely associated with the morpho-physiological attributes of the roots. The findings are in accordance with those reported for soybean [53], wheat [54] and ryegrass [55].
The value of RP is determined by the degree of aerenchyma growth, which permits the transport of crucial gases from the shoot sections to root parts [56]. The amount and size of aerenchyma in the roots are affected by the various K treatments. In our research, the following varieties produced the highest root porosity at the K0 level, regardless of all the observations. This could indicate a variety’s ability to cope with adversity. A universal stress hormone that mediates responses to a variety of nutritional deficits is ethylene [57]. Ethylene plays a role in aerenchyma formation signalling [58]. A possible rise in ethylene synthesis based on a lack of potassium [59] may also result in increased aerenchyma formation, which is consistent with our findings.
In this study, the application of more potassic fertilizer raised the K content, which is the potential cause of the rise in plant height. Our findings corroborate with the observations of Zayed et al. [60], who studied inbred and hybrid rice varieties under different K levels and found that elevated K levels substantially promote cell proliferation and elongation, leading to the production of the longest plants. One of the greatest crucial elements of grain yield is the TGW, and greater yields result from heavier grain. K is crucial for synthesizing carbohydrates and the development of grains [61], and hence, a sufficient supply of K exhibited a positive impact on developing heavier rice grains [62]. In our research, grain yield increases linearly from K0 up to K65. Usually, K fertilization improves several biochemical processes, such as N metabolism, carbohydrate metabolism, enzyme activities, cell growth and development, protein biosynthesis, crop quality, as well as crop resilience to pathogens and insects [63], ultimately leading to an increase in grain yield. The K contribution, which favourably affects all the yield-contributing characteristics of rice plants, may account for the better yield with the increase in K dose [32]. Large amounts of starch are produced due to the increased potassium levels because of K-mediated carbohydrate metabolism. Additionally, it facilitates the effective transfer of photosynthates to growing sinks and grains [64], and it facilitates the use of entirely supplied nitrogen and potassium fertilizers by plants. Thereby, potassium contributes to the production of greater volume and heavier weight in the rice grains and straw. In this research, higher ETH, GNP and higher TDM were noticed in Binadhan-10 compared to BRRI dhan29 and Hira-2. Binadhan-10 ultimately produced higher grain yield over those of BRRI dhan29 and Hira-2. The variation in the productivity of different rice cultivars is thought to be responsible for the differences in their production capacities. Thakur et al. [65] also found identical variations in the productivity of different rice varieties.
The correlation between root traits and growth dynamics in this study was positive and significant. Similarly, the relation between RN, RL and RV with yield attributes was also positive and significant. The exact reason why high–yielding rice cultivars exhibit a superior yielding potential is not fully acknowledged. On the basis of earlier discoveries, several explanations could be offered. Firstly, higher root biomass and deeper root spread were found in high-yield rice. Many studies have claimed that substantial root biomass is needed to enhance a significant amount of above-ground biomass generation [66,67,68,69]. Secondly, high-yielding rice produced more dry matter at the mid-and late-development stages. As per the results, Binadhan-10 had superior root traits, produced more dry matter over Hira-2 and BRRI dhan29 and ranked highest at the K65 level in regards to yield over Hira-2 and BRRI dhan29, which is reliable with the statement above.
Sustainable crop production is a key issue for maintaining soil health and proper resource use efficiency. Because of continuous rice cultivation in Bangladesh, it is crucial to maintain the soil nutrient balance for the proper growth and development of rice crops. Rice roots can uptake nutrients in a proper way if these are available in the root zone with available water. In our study, we observed that Binadhan-10 had the highest root characters with the recommended rate of K in the soil media that finally produced the highest yield, and this is due to the maintenance of soil water and K balance. In earlier studies, rice varieties varied in their reaction to small, reasonable and acceptable levels of K in the growth medium, and the K-efficient variety had a greater root architecture to adjust to a low K condition [10].

5. Conclusions

Based on this investigation, it has been observed that K fertilization has a positive impact on root traits, development indicators and grain output. At K65, the value of RN, RL, RV, LAI, TDM, the yield attributes and the yield reached a peak, and after that, at K98 and K130, the value of these traits decreased. The highest values of RN, RL and RV were found at 80 DAT, and then these values were decreased at the harvest stage in most cases. Among the three varieties, Binadhan-10 outperformed others, followed by Hira-2 and BRRI dhan29 according to root traits, development indices and gain output. There was a positive correlation found between root parameters and yield, except for root porosity. The application of K fertilizer improved root characteristics, crop development and yield, although the intensity of such responses differed depending on the variety.

Author Contributions

Conceptualization: M.S.K., U.K.S., M.R.U. and M.A.H.; methodology, data collection and original data analysis: M.S.K., S.M. and U.S.; data presentation, writing: M.S.K., A.H. and E.F.A.; reviewing and editing: U.K.S., M.R.U., M.A.H., E.F.A., G.S. and A.K.C.; funding acquisition: M.R.U. and E.F.A. All authors have read and agreed to the published version of the manuscript.

Funding

This research was funded by the Bangladesh Agricultural University Research Systems (BAURES) Project number (2019/15/BAU) and the Ministry of Science and Technology (MOST), Bangladesh. The authors also would like to extend their sincere appreciation to the Researchers Supporting Project Number (RSP2023R134), King Saud University, Riyadh, Saudi Arabia.

Institutional Review Board Statement

Not applicable.

Informed Consent Statement

Not applicable.

Data Availability Statement

The dataset analyzed during the present study is accessible from the corresponding author upon reasonable request.

Acknowledgments

The authors extend their appreciation to BAURES Project number (2019/15/BAU), Bangladesh Agricultural University, Mymensingh and the Ministry of Science and Technology (MOST) Bangladesh. The authors also would like to extend their heartfelt gratitude to the Researchers Supporting Project Number (RSP2023R134), King Saud University, Riyadh, Saudi Arabia.

Conflicts of Interest

The authors state no conflicts of interest.

References

  1. Zhao, C.; Chen, M.; Li, X.; Dai, Q.; Xu, K.; Guo, B.; Hu, Y.; Wang, W.; Huo, Z. Effects of soil types and irrigation modes on rice root morphophysiological traits and grain quality. Agronomy 2021, 11, 120. [Google Scholar] [CrossRef]
  2. Hartati, S.; Purnomo, D. Effectiveness and efficiency of potassium fertilizer application to increase the production and quality of rice in Entisols. Environ. Earth Sci. 2018, 142, 012031. [Google Scholar] [CrossRef]
  3. Dhillon, J.S.; Eickhoff, E.M.; Mullen, R.W.; Raun, W.R. World potassium use efficiency in cereal crops. Agron. J. 2019, 111, 889–896. [Google Scholar] [CrossRef]
  4. Popp, M.P.; Slaton, N.A.; Norsworthy, J.S.; Dixon, B. Rice yield response to potassium: An economic analysis. Agron. J. 2020, 113, 287–297. [Google Scholar] [CrossRef]
  5. Kaysar, M.S.; Sarker, U.K.; Monira, S.; Hossain, M.A.; Haque, M.S.; Somaddar, U.; Saha, G.; Chaki, A.K.; Uddin, M.R. Dissecting the relationship between root morphological traits and yield attributes in diverse rice cultivars under subtropical condition. Life 2022, 12, 1519. [Google Scholar] [CrossRef]
  6. Fageria, N.K.; Moreira, A. The role of mineral nutrition on root growth of crop plants. Adv. Agron. 2011, 110, 251–331. [Google Scholar] [CrossRef]
  7. Slaton, N.; Golden, B.R.; Norman, R.J.; Wilson, C.E.; Delong, R.E. Correlation and calibration of soil potassium availability with rice yield and nutritional status. Soil Sci. Soc. Am. J. 2009, 73, 1192–1201. [Google Scholar] [CrossRef]
  8. Fageria, N.K.; Dos Santos, A.B.; Coelho, A.M. Growth, yield and yield components of lowland rice as influenced by ammonium sulfate and urea fertilization. J. Plant Nutr. 2011, 34, 371–386. [Google Scholar] [CrossRef]
  9. Farinelli, R. Agronomic characteristics of upland rice under no-tillage and nitrogen and potassium fertilization. Braz. J. Soil Sci. 2004, 28, 447–454. [Google Scholar]
  10. Jia, Y.; Yang, X.; Feng, Y.; Jilani, G. Differential response of root morphology to potassium deficient stress among rice genotypes varying in potassium efficiency. J. Zhejiang Univ. Sci. 2008, 9, 427–434. [Google Scholar] [CrossRef]
  11. Hogh-Jensen, H.H.; Pedersen, M.B. Morphological plasticity by crop plants and their potassium use efficiency. J. Plant Nutr. 2003, 26, 969–984. [Google Scholar] [CrossRef]
  12. Fageria, N.K.; Baligar, V.C.; Li, Y.C. The role of nutrient efficient plants in improving crop yields in the twenty first century. J. Plant Nutr. 2008, 31, 1121–1157. [Google Scholar] [CrossRef]
  13. Guimaraes, C.M. Root system of upland rice under water stress. Trop. Agric. Res. 2011, 41, 126–134. [Google Scholar]
  14. Costa, S.E.V.G.A.; Souza, E.D.; Anghinoni, I.; Flores, J.P.; Andriguetti, M.H. Potassium and root distribution in soil and corn growth in long-term soil management and fertilization systems. Braz. J. Soil Sci. 2009, 33, 1291–1301. [Google Scholar] [CrossRef]
  15. Zaratin, C. Effects of four doses of potassium on six sprinkler-irrigated upland rice cultivars. I. Production and productivity components. Cientifica 2004, 32, 115–120. [Google Scholar]
  16. Patel, D.S.; Kirti, B.; Dhiraji, P.P.; Vipulkumar, P.; Suchismita, J.; Ajay, V.N.; Harshadkumar, N.C. Does plant root architecture respond to potassium under water stress? A case from rice seedling root responses. Curr. Sci. 2021, 120, 1050–1056. [Google Scholar] [CrossRef]
  17. Klinsawang, S.; Sumranwanich, T.; Wannaro, A.; Saengwilai, P. Effects of root hair length on potassium acquisition in rice (Oryza sativa L.). Appl. Ecol. Environ. Res. 2018, 16, 1609–1620. [Google Scholar] [CrossRef]
  18. United Nations Development Program; Food and Agriculture Organization. Land Resources Appraisal of Bangladesh for Agricultural Development Report 2. Agro-Ecological Region of Bangladesh; United Nations Development Program and Food and Agricultural Organization: Dhaka, Bangladesh, 1988; pp. 212–221. [Google Scholar]
  19. FRG. Fertilizer Recommendation Guide; Bangladesh Agricultural Research Council (BARC): Farmgate, Dhaka, 2018; p. 274.
  20. Kato, Y.; Kamoshita, A.; Yamagishi, J. Growth of Three Rice Cultivars (Oryza sativa L.) under Upland Conditions with Different Levels of Water Supply. Plant Prod. Sci. 2006, 9, 435–445. [Google Scholar] [CrossRef]
  21. Jensen, C.R.; Luxmoore, R.J.; Van Gundy, S.D.; Stolzy, L.H. Root air space measurements by a pycnometer method. Agron. J. 1969, 61, 474–475. [Google Scholar] [CrossRef]
  22. Evans, G.C. Quantitative Analysis of Growth; Blackwell Scientific Publication: Oxford, UK, 1972. [Google Scholar]
  23. Hunt, R. Plant Growth Analysis; Edward Arnold: London, UK, 1978; pp. 26–38. [Google Scholar]
  24. Peng, S.B.; Huang, J.L.; Sheehy John, E.; Laza Rebecca, C.; Viseras Romeo, M.; Zhong, X.H.; Centeno Grace, S.; Khush Gurdev, S.; Cassman Kenneth, G. Rice yields decline with higher night temperature from global warming. Proc. Natl. Acad. Sci. USA 2004, 101, 9971–9975. [Google Scholar] [CrossRef]
  25. R Core Team. R: A Language and Environment for Statistical Computing; R Foundation Statistical Computation: Vienna, Austria, 2013; Available online: http://www.R-project.org/ (accessed on 30 March 2023).
  26. James, D.W.; Tindall, T.A.; Turst, C.J.; Hussein, A.N. Alfalfa cultivar responses to phosphorus and potassium deficiency: Biomass. J. Plant Nutr. 1995, 18, 2431–2445. [Google Scholar] [CrossRef]
  27. Chen, J.J.; Gabelman, W.H. Isolation of tomato strains varying in potassium acquisition using a sand-zeolite culture system. Plant Soil. 1995, 176, 65–70. [Google Scholar] [CrossRef]
  28. Liu, F.H.; Liang, X.N.; Zhang, S.W. Accumulation and utilization efficiency of potassium in ramie varieties. J. Plant Nutr. 2000, 23, 785–792. [Google Scholar] [CrossRef]
  29. Zhang, G.P.; Chen, J.X.; Tirore, E.A. Genotypic variation for potassium uptake and utilization efficiency in wheat. Nutr. Cycl. Agroecosys. 1999, 54, 41–48. [Google Scholar]
  30. Pettersson, S.; Jensén, P. Variation among species and varieties in uptake and utilization of potassium. Plant Soil. 1983, 72, 231–237. [Google Scholar] [CrossRef]
  31. Yang, X.E.; Liu, J.X.; Wang, W.M. Potassium internal use efficiency relative to growth vigor, potassium distribution, and carbohydrate allocation in rice genotypes. J. Plant Nutr. 2004, 27, 837–852. [Google Scholar] [CrossRef]
  32. Saha, P.K.; Akter, M.; Miah, M.A.M.; Zaman, S.K. Effects of organic and inorganic sources of K on rice yield and soil K balance in the rice-rice cropping system. Bangladesh J. Agric. Res. 2011, 36, 305–311. [Google Scholar] [CrossRef]
  33. Fageria, N.K.; Moreira, A.; Coelho, A.M. Yield and yield components of upland rice as influenced by nitrogen sources. J. Plant Nutr. 2011, 34, 361–370. [Google Scholar] [CrossRef]
  34. Rengel, Z.; Damon, P.M. Crops and genotypes differ in efficiency of potassium uptake and use. Physiol. Plant. 2008, 133, 624–636. [Google Scholar] [CrossRef]
  35. Amtmann, A.; Hammond, J.P.; Armengaud, P.; White, P.J. Nutrient sensing and signaling in plants: Potassium and phosphorus. Adv. Bot. Res. 2006, 43, 209–257. [Google Scholar] [CrossRef]
  36. White, P.J.; Karley, A.J. Potassium. Plant Cell Monographs 17, Cell Biology of Metals and Nutrients; Hell, R., Mendel, R.R., Eds.; Springer: Berlin/Heidelberg, Germany, 2010; pp. 199–224. [Google Scholar]
  37. Thorne, G.N. Effects of age and environment on net assimilation rate of barley. Ann. Bot. 1961, 25, 29–38. [Google Scholar] [CrossRef]
  38. Yang, X.E.; Wang, W.M.; He, Z.L. Physiological and Genetic Characteristics of High Nutrient Efficiency of Plants in Acid Soils. In The Red Soils of China: Their Nature, Management and Utilization; Wilson, M.J., He, Z.L., Yang, X.E., Eds.; Kluwer Academic Publishers: Dordrecht, The Netherlands, 2004; pp. 78–83. [Google Scholar]
  39. Raju, G.S.N.; Mukhopadhyay, A.K. Each of the sequence of addition of K and NH4 and pre-absorbed cations on fixation of applied NH4 ions in soils. J. Indian Soc. Soil Sci. 1975, 23, 172–176. [Google Scholar]
  40. Badhe, M.N.; Begum, M.; Varade, S.B. Effect of potassic fertilizers on ammonium fixation in soils of Marathwada. In Bulletin 10; Indian Soil Science Society: New Delhi, India, 1976; pp. 103–106. [Google Scholar]
  41. Leigh, R.A.; Wyn Jones, R.G. A hypothesis relating critical potassium concentrations for growth to the distribution and functions of this ion in the plant cell. New Phytol. 1984, 97, 1–13. [Google Scholar] [CrossRef]
  42. Horie, T.; Shiraiwa, T.; Homma, K.; Katsura, K.; Maeda, Y.; Yoshida, H. Can yields of lowland rice resume the increases that showed in the 1980s? Plant Prod. Sci. 2005, 8, 259–274. [Google Scholar] [CrossRef]
  43. Fageria, N.K. Yield physiology of rice. J. Plant Nutr. 2007, 30, 843–879. [Google Scholar] [CrossRef]
  44. Fu, J.; Huang, Z.H.; Wang, Z.Q.; Yang, J.C.; Zhang, J.H. Pre anthesis non-structural carbohydrate reserve in the stem enhances the sink strength of inferior spikelets during grain filling of rice. Field Crops Res. 2011, 123, 170–182. [Google Scholar] [CrossRef]
  45. Zhang, Z.J.; Chu, G.; Liu, L.J.; Wang, Z.Q.; Wang, X.M.; Zhang, H.; Yang, J.C.; Zhang, J.H. Mid-season nitrogen application strategies for rice varieties differing in panicle size. Field Crops Res. 2013, 150, 9–18. [Google Scholar] [CrossRef]
  46. Tabatabaei, A.S.; Shakeri, S.S.; Mirjalili, M.R. Effect of different levels of potassium Sulphate on yield, yield components and protein content of wheat cultivars. Appl. Math. Eng. Manag. Technol. 2014, 2, 119–123. [Google Scholar]
  47. Ma, L.; Ren, G.X.; Shi, Y. Effects of potassium fertilizer on diurnal change of photosynthesis in Stevia Rebaudiana Bertoni. Adv. Mat. Res. 2012, 542–543, 1087–1090. [Google Scholar] [CrossRef]
  48. Zhang, Z.; Yang, F.; Tian, X. Coronatine-induced lateral formation in cotton (Gossypium hirsutum) seedlings under potassium-sufficient and-Deficient conditions in relation to auxin. J. Plant Nutr. Soil Sci. 2009, 172, 435–444. [Google Scholar] [CrossRef]
  49. Dolan, L.; Davies, J. Cell expansion in roots. Curr. Opin. Plant Biol. 2004, 7, 33–39. [Google Scholar] [CrossRef]
  50. Jordan-Meille, L.; Pellerin, S. Shoot and root growth of hydroponic maize (Zea mays L.) as influenced by K deficiency. Plant Soil. 2008, 304, 157–168. [Google Scholar] [CrossRef]
  51. Walker, D.J.; Black, C.R.; Miller, A.J. The role of cytosolic potassium and pH in the growth of barley roots. Plant Physiol. 1998, 118, 957–964. [Google Scholar] [CrossRef]
  52. Marschner, H. Mineral Nutrition of Higher Plants; Academic Press: San Diego, CA, USA, 1995. [Google Scholar] [CrossRef]
  53. Wang, X.G.; Cao, M.J.; Wang, W. Effect of potassium concentration in the soil on the morphological and physiological characteristics of soybean root. Soybean Sci. 2005, 24, 126–130. [Google Scholar]
  54. Zou, C.Q.; Li, Z.S.; Li, J.Y. Study on difference in morphological and physiological characters of wheat varieties to potassium. Plant Nutr. Fert. Sci. 2001, 7, 36–43. [Google Scholar]
  55. Mengel, K.; Steffens, D. Potassium uptake of ryegrass (Lolium perenne) and red clover (Trifolium pratense) as related to root parameters. Biol. Fert. Soils 1985, 1, 53–58. [Google Scholar] [CrossRef]
  56. Armstrong, W.; Drew, M.C. Root Growth and Metabolism under Oxygen Deficiency. In Plant Roots: The Hidden Half, 3rd ed.; Marcel Dekker: New York, NY, USA, 2002; pp. 729–761. [Google Scholar]
  57. Brown, K.M.; Zhang, Y.J.; Kim, H.J.; Lynch, J.P. The ethylene underground. Acta Hortic. 2003, 618, 193–198. [Google Scholar] [CrossRef]
  58. Drew, M.C.; He, C.J.; Morgan, P.W. Programmed cell death and aerenchyma formation in roots. Trends Plant Sci. 2000, 5, 123–127. [Google Scholar] [CrossRef]
  59. Jung, J.Y.; Shin, R.; Schachtman, D.P. Ethylene mediates response and tolerance to potassium deprivation in Arabidopsis. Plant Cell 2009, 21, 607–621. [Google Scholar] [CrossRef]
  60. Zayed, B.A.; Elkhoby, W.M.; Shehata, S.M.; Ammar, M.H. Role of potassium application on the productivity of some inbred and hybrid rice varieties under newly reclaimed saline soils. Afr. Crop Sci. J. 2007, 8, 53–60. [Google Scholar]
  61. Mengel, K. Factors and process affecting potassium requirement of crops. Potash Rev. 1982, 16, 1–12. [Google Scholar]
  62. Niazi, K.; Mehdi, S.M.; Mahmood, T.; Iqbal, J. Potassium fertilizer use efficiency in sodic soils. In 4th National Congress of Soil Science Abstract; Soil Salinity Research Institute: Pindi Bhattian, Pakistan, 1992; p. 73. [Google Scholar]
  63. Ramazanpour, M.R.; Dastfal, M.; Malakouti, M.J. The effect of potassium in reducing drought stress in wheat in darab region of fars. J. Plant Soil Sci. 2008, 22, 127–135. [Google Scholar]
  64. Beringer, H. Functions of Potassium in Plant Metabolism with Particular Reference to Yield. In Potassium in Soils and Crops; Sekhon, G.S., Ed.; Potash Research Institute of India: New Delhi, India, 1978; pp. 185–202. [Google Scholar]
  65. Thakur, A.C.; Borah, R.; Bhagwati, P.C. Performance of summer rice varieties under different dates of transplanting in rice (winter)-rice (summer) system. J. Agric. Sci. Soc. Northeast India 2002, 15, 79–81. [Google Scholar]
  66. Garnett, T.; Conn, V.; Kaiser, B.N. Root based approaches to improving nitrogen use efficiency in plants. Plant Cell Environ. 2009, 32, 1272–1283. [Google Scholar] [CrossRef]
  67. Yang, J.C.; Zhang, H.; Zhang, J.H. Root morphology and physiology in relation to the yield performance of rice. J. Integr. Agric. 2012, 11, 920–926. [Google Scholar] [CrossRef]
  68. Ju, C.; Buresh, R.J.; Wang, Z.; Zhang, H.; Liu, L.; Yang, J.; Zhang, J. Root and shoot traits for rice varieties with higher grain yield and higher nitrogen use efficiency at lower nitrogen rates application. Field Crops Res. 2015, 175, 47–55. [Google Scholar] [CrossRef]
  69. Chu, G.; Wang, Z.Q.; Zhang, H.; Yang, J.C.; Zhang, J.H. Agronomic and physiological performance of rice under integrative crop management. Agron. J. 2016, 108, 117–128. [Google Scholar] [CrossRef]
Figure 1. Weather situation for the period of crop growth phases of boro rice. (Source: Department of Irrigation and Water Management, Bangladesh Agricultural Universiry, Mymensingh, Bangladesh, https://iwm.bau.edu.bd/, accessed on 10 May 2023).
Sustainability 15 08589 g001
Figure 2. Variable root morphological features of three rice varieties from 20 DAT to the harvest period at five K levels. K0: 0 kg K ha−1; K32: 32 kg K ha−1; K65: 65 kg K ha−1; K98: 98 kg K ha−1; K130: 130 kg K ha−1; (AE) represent root number; (FJ) represent root length; (KO) represent root porosity; (PT) represent root volume.
Sustainability 15 08589 g002
Figure 3. Leaf area index (LAI) and total dry matter (TDM) of three rice varieties at five K levels from 20 DAT to 80 DAT. K0: 0 kg K ha−1; K32: 32 kg K ha−1; K65: 65 kg K ha−1; K98: 98 kg K ha−1; K130: 130 kg K ha−1; (AD) represent LAI; (EH) represent TDM.
Sustainability 15 08589 g003
Figure 4. CGR, RGR and NAR of three rice varieties at five K levels at 20–40 (1st), 40–60 DAT (2nd) and 60–80 DAT (3rd). K0:0 kg K ha−1; K32: 32 kg K ha−1; K65: 65 kg K ha−1; K98:98 kg K ha−1; K130:130 kg K ha−1. (AC) denote CGR; (DF) denote RGR; (GI) denote NAR at 20–40 DAT (1st), 40–60 DAT (2nd) and 60–80 DAT (3rd), respectively.
Sustainability 15 08589 g004
Figure 5. Yield attributing traits and yield of three rice varieties at five K levels. Figure with same letters do not differ significantly. K0: 0 kg K ha−1; K32: 32 kg K ha−1; K65: 65 kg K ha−1; K98: 98 kg K ha−1; and K130: 130 kg K ha−1. The letters (AE) indicate the PH, ET, PL, GP and TGW, respectively; (FI) indicate the GY, SY, BY and HI, respectively.
Sustainability 15 08589 g005
Figure 6. Correlation matrix and heatmap of the root parameters, growth indices, yield contributing traits and yield. Blue and red ellipses, respectively, were used to denote the positive and negative associations. The stronger coefficient is displayed by the increased color intensity. The symbols *, ** and *** indicate levels of significance at the 5%, 1% and 0.01% levels of probability, respectively. List of parameters: PH—Plant height; ET—No. of effective tillers; RN—Root number; RL—Root length; RP—Root Porosity (%); RV—Root volume; TDM—Total dry matter; PL—Panicle length; GNP—Grain number panicle−1; TGW—Thousand grain weight; GY—Grain yield; SY—Straw yield; BY-Biological yield; HI—Harvest index; CGR—Crop growth ratio; RGR—Relative growth rate; NAR—Net assimilation rate.
Sustainability 15 08589 g006
Table 1. Inventory of the three rice varieties employed in this research for root attributes and yield, along with their genetic foundation and parental basis.
Sl. NoVarietyGenetic SourceParental Origin/Accession NumberSource
1.BRRI dhan29InbredBG90-2 × BR51-46-5BRRI
2.Binadhan-10InbredIR42598-B-B-B-B-12 × Nona BokraBINA
3.Hira-2Hybrid-Local market
Table 2. Properties of the soil in the pot prior to beginning the trial.
Soil PropertiesValues
Textural classClay loam
Soil reaction6.12
Electrical conductance (μs/cm)649
Organic Carbon (%)1.028
Total Nitrogen (N) (%)0.121
Available Phosphorus (ppm)29.1
Available Potassium (ppm)84.61
Available Sulphur (ppm)24.89
Table 3. Yield components of the three rice varieties at the five K levels.
VarietyPH (cm)ET (no.)PL (cm)GNPTGW(g)GY
(g pot−1)
SY
(g pot−1)
HI (%)
V185.87b10.40b18.48b107.53c23.33b23.15c23.30c49.84
V281.47c11.53ab19.89ab111.53b24.15b23.42b23.56b49.84
V392.47a12.87a22.19a115.00a25.73a23.86a24.01a49.84
Potassium
K077.44c6.56d14.38d93.67e21.77d18.11d18.26d49.80c
K3287.56ab11.89c18.87c109.00d25.16b22.28c22.44c49.83b
K6592.00a14.67a24.35a122.78a26.58a26.26a26.40a49.86a
K9889.56ab13.33b22.69a117.67b25.05b26.13a26.28a49.86a
K13086.44b11.56c20.64b113.67c23.44c24.59b24.74b49.85ab
Variety**************ns
K****************
CV (%)1.126.683.071.302.420.740.720.73
The mean values denoted by the identical letters in each column did not vary substantially from one another. According to the analysis of variance, the symbols ** and ns denote significance at the 1% level and non-significance, respectively. V1 = BRRI dhan29, V2 = Hira-2, V3 = Binadhan-10.
Disclaimer/Publisher’s Note: The statements, opinions and data contained in all publications are solely those of the individual author(s) and contributor(s) and not of MDPI and/or the editor(s). MDPI and/or the editor(s) disclaim responsibility for any injury to people or property resulting from any ideas, methods, instructions or products referred to in the content.