Abstract
In the era of Industry 4.0, digital transformation has become an important strategic choice in driving enterprise development. However, there are few studies on how digital transformation affects the total factor productivity of enterprises. In order to fill this theoretical gap, this study explored the impact of digital transformation on total factor productivity from the perspective of information transmission that analysts focus on. Based on data from Chinese A-share listed companies from 2012 to 2021, this work constructed a fixed effects model and a mesomeric effect model. The experimental results show the following: (1) the digital transformation of enterprises significantly improves total factor productivity; (2) the attention of analysts has significantly improved the total factor productivity of enterprises; (3) enterprise digital transformation can significantly improve analysts’ attention, which plays an intermediary role between enterprise digital transformation and total factor productivity; (4) the heterogeneity analysis showed that digital transformation has a more significant promoting effect on the total factor productivity of tertiary industry enterprises and enterprises with lower competitiveness in their respective industries. For the first time, this study explored the mechanism by which digital transformation impacts total factor productivity from the perspective of analysts. It is necessary to encourage enterprises to attach importance to the role of analysts in information transmission in the process of digital transformation. It is suggested that enterprises formulate strategies according to the characteristics of their industries in digital transformation, and the government should formulate differentiation strategies according to the different industries and the different levels of competition between industries in the national economy.
1. Introduction
China has entered a stage of high-quality development, and the digital economy has become a new driving force for economic development [1]. As an important component of the market, enterprises’ digital transformation plays a crucial role in the high-quality development of China’s economy. Almost all industries have taken a series of measures to explore and apply digital technology [2]. Enterprise digital transformation refers to enterprises’ use of AI, blockchain, cloud computing, big data, and other disruptive technologies to reform production and operation methods, improve productivity, and create value and social welfare [3,4]. Relying on advanced digital technology to improve enterprise production efficiency and empower the development of the real economy has become an inevitable trend. Digital transformation has become an important strategic means to promote enterprise development. At the same time, total factor productivity is a key driving force for economic progress [5]. In the process of enabling the traditional production mode with digital technology, whether digital transformation can have a positive impact on the improvement of total factor productivity is an important issue for enterprises in achieving high-quality development.
According to signal transmission theory, digital transformation is a strategic choice for enterprises in line with the trend of the times, which will certainly attract extensive attention and investment enthusiasm from investors, leading to an increasing demand for private information from investors. The complexity of digital technology will also lead to a huge contradiction between excessive information resources and limited individual information-processing capabilities. In the face of an explosive growth in data volume and unbalanced data quality, investors require the professional advantages associated with security analysts to help them understand and judge the performance trends of digital transformation enterprises and optimize investment decisions. After obtaining the overall development level of enterprise digitalization, analysts convey more effective information to the capital market, which will have an impact on the high-quality development of enterprises. It can be seen that there is a close connection between digital transformation, analysts’ attention, and total factor productivity.
In academia, there is still little discussion on the relationship between digital transformation and total factor productivity. Scholars have conducted research from different perspectives based on different samples. For example, Wang Jianlong et al. [6] found that enterprises’ digital transformation can significantly improve green total factor productivity. The research by Su J et al. [7] confirmed that highly polluting enterprises can improve their level of green technology innovation, increase their willingness to take on social responsibility, reduce cost stickiness and, thus, improve total factor productivity. At the same time, improving enterprise operation efficiency, reducing costs, enhancing innovation, reducing the supplier concentration ratio, and improving the customer concentration ratio, liquidity turnover, human capital structure, and financing constraints [8,9,10] are all impact mechanisms of digital transformation on total factor productivity. However, the impact mechanism of digital transformation on total factor productivity has not been studied from an external perspective. The existing literature provides a certain theoretical basis for the research in this article, and this article will innovate on the basis of the existing research. Specifically, this paper studies the relationship between enterprise digital transformation and total factor productivity from the perspective of analysts, mainly addressing the following issues:
- (1)
- Whether enterprises’ digital transformation has a positive impact on total factor productivity;
- (2)
- Whether enterprises’ digital transformation can improve total factor productivity by increasing analysts’ attention;
- (3)
- Whether the impact of digital transformation on total factor productivity will have heterogeneous results due to different industries and levels of competitiveness.
In order to solve these problems, we sourced data from China’s A-share listed companies from 2012 to 2021 as the sample and built fixed effects models and mesomeric effect models, aiming to fill the theoretical gap in the impact mechanism of digital transformation on total factor productivity from the perspective of analysts. The possible contributions of this study are as follows: First, taking China’s A-share listed companies from 2012 to 2021 as a sample, we study the impact of digital transformation on total factor productivity, enriching the research on the economic effects of the digital transformation of different sample companies. Second, the relationship between analysts’ attention and total factor productivity is explored, enriching the existing research in this field. Third, this study integrates digital transformation, analysts’ attention, and total factor productivity into the same theoretical framework, systematically discusses and verifies the role of analysts’ attention in the relationship between digital transformation and total factor productivity from the perspective of the information intermediary role of analysts’ attention, enriches the path of digital transformation’s impact on total factor productivity, and expands the theoretical framework for the integrated development of digital transformation and the real economy. Fourth, according to industry classification and market competition in the national economy, the heterogeneity analysis provides empirical evidence for an in-depth understanding of the impact of the digital transformation of enterprises with different external characteristics on total factor productivity, and provides policy enlightenment for the government to better encourage the digital transformation of enterprises and promote high-quality economic development.
2. Literature Review
2.1. Economic Effects of Enterprise Digital Transformation
Scholars have discussed the economic effects of enterprise digital transformation from both macro and micro perspectives. From a macro perspective, China’s urban digital transformation can improve cities’ resilience to COVID-19 by promoting social communication, collaborative governance, and resilience [11], and the development of the digital economy has improved the investment efficiency of green finance in China’s provinces [12], promoted rapid economic growth, improved people’s living standards, improved the effective use of resources, and enhanced environmental protection [13]. Digital transformation in China’s power system can improve the utilization efficiency of renewable energy [14] and bring energy-saving effects to various cities in China through technological optimization and industrial upgrading [15].
From a micro perspective, enterprise digital transformation has lower costs and better operational efficiency, which can bring better performance to enterprises [16,17], promote enterprise innovation [18], and enhance enterprise value [19] and enterprises’ risk-bearing capacity [20]. At the same time, digital transformation can encourage enterprises to implement internationalization strategies. The higher the degree of digitization, the higher the degree of internationalization of enterprises [21]. From an environmental perspective, digital transformation can reduce enterprise pollution emissions [22] and promote green transformation [23] and green innovation [24], which has a certain promoting effect on enterprise environmental performance. From a governance perspective, digital transformation can promote a culture of internal innovation and improve enterprise governance [25].
2.2. The Influencing Factors of Enterprise Total Factor Productivity
Research on the influencing factors of total factor productivity has been conducted from both internal and external perspectives in the literature. From the perspective of internal factors, digital transformation is a brand-new strategic measure to improve enterprise total factor productivity [26], and the R&D activities of enterprises are key activities that promote the improvement of total factor productivity [27]. The progress of green technology in enterprises significantly promotes total factor productivity by improving unit labor productivity [28]. At the same time, when the level of mandatory disclosure of CSR is increased, the total factor productivity of enterprises significantly increases. This impact can be achieved through two paths of enterprise R&D and innovation expenditure [29]; however, the increasing degree of financialization of nonfinancial enterprises has had a negative impact on their total factor productivity [30].
From an external perspective, environmental regulation, carbon emission regulation, and emission trading plans all have a positive impact on total factor productivity, which leads to a comprehensive positive impact of environmental regulation on the lifespan of enterprises [31,32,33,34]. From a policy perspective, the implementation of China’s low-carbon city pilot policy has significantly promoted the total factor productivity of local enterprises, helping to achieve the “win—win goal” of emission reduction and high-quality development of enterprises [35]. However, not all policies have a positive impact on enterprise total factor productivity. For example, China’s new environmental protection law significantly hindered enterprise total factor productivity, which lasted for two years [36]. At the same time, with the uncertainty of economic policies and global oil prices increasing, enterprise total factor productivity has been negatively affected [37,38].
2.3. The Effect and Mechanism of Digital Transformation on Total Factor Productivity
Regarding the impact of digital transformation on total factor productivity, scholars have discussed different industries as samples. Ren, Y et al. [8] believe that the digital transformation of new energy enterprises can promote improvements in total factor productivity by improving enterprise operation efficiency, reducing costs, and enhancing innovation. Liu, H et al. [39] found that both digital transformation and environmental information disclosure of heavily polluting enterprises can improve total factor productivity, and there is a substitution effect. Li, N et al. [40] found that the ESG performance of manufacturing enterprises plays a positive moderating role in the relationship between digital transformation and total factor productivity. Zhang, H et al. [9] empirically found that digital transformation can improve total factor productivity by reducing the supplier concentration ratio, enterprise digital technology can improve total factor productivity by improving the customer concentration ratio, and digital applications can have a positive impact on total factor productivity by reducing the customer concentration ratio. Cheng, Y et al. [10] conducted an empirical analysis and found that digital transformation in real-economy enterprises affects total factor productivity through liquidity turnover, human capital structure, and financing constraints.
2.4. The Impact of Analysts’ Attention on Enterprises
Analysts’ attention is an important means of obtaining information in the capital market, which plays a supervisory role in fulfilling the entrusted economic responsibilities of enterprise agents, reducing earnings manipulation and agency costs [41]. At the same time, analysts’ attention can guide market judgment, alleviate resource mismatches caused by information asymmetry [42], and effectively improve the innovation legitimacy of listed companies [43]. When policy uncertainty is high, analysts pay more attention to the external legitimacy of enterprise social responsibility to ensure profitability elasticity [44] and play a crucial role in the external monitoring and information transmission of organizations [45].
3. Theoretical Analysis and Hypotheses
3.1. Impact of Digital Transformation on Total Factor Productivity
The world is witnessing the Fourth Industrial Revolution and the digital transformation of the business world [46]. In such an environment, in order for enterprises to achieve high-quality development, they need to break away from the traditional thinking of improving performance through factor expansion and use digital technology to replace old drivers, achieving improved production efficiency. Digital transformation influences total factor productivity from multiple dimensions, such as innovation, management, and strategy.
From an innovation perspective, digital transformation can improve total factor productivity by driving enterprise innovation. In recent years, companies from all walks of life have begun to put digital innovation into practice [47]. Firstly, enterprises increase investment in innovation [48] in the process of digital transformation, providing financial support for enterprise research and development activities and, at the same time, providing a good congenital environment for the improvement of enterprises’ innovation levels. Secondly, digital transformation can significantly enhance the technological innovation capabilities of enterprises, such as resource integration, information acquisition, and analysis [49]. The application of digital technology provides technical support for enterprise innovation activities and creates more opportunities for enterprise innovation, driving an increase in innovation output, a contraction of innovation processes, and an improvement in the level of sustained innovation of enterprises [50,51]. Finally, digital technology strengthens the way enterprises obtain information, helping them overcome spatial and temporal barriers, narrowing the distance between enterprises and customers [52,53], and promoting the gradual shift in enterprise product innovation concepts from “product value oriented” to “customer value oriented”. Through customer feedback, customer groups are classified, and standardized products are innovated based on different group preferences, encouraging personalized products to meet the differentiated needs of different customer groups, increasing product innovation output, driving breakthrough innovation in the enterprise, and ultimately improving the overall innovation level of the enterprise, leading to an increase in the output level and total factor productivity of the enterprise.
From a management perspective, digital transformation can improve the level of enterprise management, thereby enhancing total factor productivity. On the one hand, digital transformation can significantly improve the operational efficiency of enterprises and reduce errors [54]. Enterprises use digital information to fundamentally re-examine the decision-making processes and architecture within and between organizations [55], strengthen the efficiency of information communication between departments, reduce internal information asymmetry, optimize organizational frameworks, and improve the overall management level within enterprises. On the other hand, high-tech talent is essential for enterprise digital transformation [56]. To meet the demand for human capital in digitalization, enterprises tend to introduce more high-tech talent while cultivating employees’ digital awareness and reshaping their values. With the improvement of the level of enterprise human capital, the level of enterprise management also improves, ultimately driving the improvement of enterprise total factor productivity.
From a strategic perspective, digital transformation can improve the total factor productivity of enterprises by transforming their business models. Digital strategy not only drives the digitization of enterprise business infrastructure [57] but also enables companies to integrate rapidly through digital capabilities, establish new capabilities and competitive advantages, reconfigure their business models [58,59,60], and achieve a positive transformation of their business models. This provides a foundation for enterprises to achieve sustainable development in an increasingly complex market environment, which is conducive to the improvement of their total factor productivity. Based on the above theory, this research proposes the following hypothesis:
Hypothesis 1 (H1).
Digital transformation has a positive effect on total factor productivity.
3.2. Impact of Analysts’ Attention on Total Factor Productivity
Analysts provide an important decision-making basis for enterprise decision makers through earnings forecast information backed by their industry expertise. They collect information from multiple channels within and outside the company, provide investors with their evaluation of the company’s investment potential [61,62], and transmit high-value-added information to the market. On the one hand, analysts have reduced the level of information asymmetry between enterprises and market investors through information transmission [63,64], improved information disclosure transparency [65], provided more private information on enterprises to the market [66], and had a positive impact on enterprise investment and financing activities. Relieving enterprise financing constraints [67] provides strong guarantees for the improvement of the enterprise human capital structure and the application of new technologies, driving the continuous improvement of enterprise total factor productivity. On the other hand, analysts’ attention has an external supervisory and governance role [68], which makes up for the lack of internal supervision of enterprises, reduces the opportunistic behavior of enterprises, improves the efficiency of capital use [69], improves the overall level of resource utilization of enterprises, has a positive impact on the overall development of enterprises, and ultimately promotes the improvement of the total factor productivity of enterprises. Based on the above theory, this research proposes the following hypothesis:
Hypothesis 2 (H2).
Analysts’ attention has a positive effect on total factor productivity.
3.3. Digital Transformation, Analysts’ Attention, and Total Factor Productivity
As excavators and disseminators of information in the capital market, as well as predictors of future business operations, analysts focus on the mediating effects of information [70]. With the popularization of digital technology, the entry barriers to innovative concepts are decreasing, and enterprises can more easily showcase their achievements to the outside world [71]. Based on signal transmission theory, publishing digital achievements conveys signals of good development prospects and significant digital transformation effects to the outside world, attracting more analysts’ attention and increasing the attention of enterprises. To provide more valuable incremental information to market participants, analysts allocate their time and resources to focus on enterprise information [72], effectively identifying the operational status of the enterprise through its financial information. Against the backdrop of the country’s strong advocacy for the development of the digital economy, analysts are able to quickly and sensitively capture national policy directions and focus more energy on the digital transformation results of enterprises. Therefore, enterprises with excellent digital transformation results will inevitably receive more attention from analysts. The increase in analysts’ attention will provide market investors with more private information about the enterprise, help them fully understand the current digital development status of the enterprise, and provide more reference information for investors to make investment decisions. At the same time, under the era theme of “developing the digital economy and achieving high-quality development”, investors will prefer enterprises that engage in digital transformation. Enterprises can use analysts’ attention to convey good signals of digital transformation to the market, obtain sustainable resource support, alleviate financing constraints [73], have a positive impact on enterprise development, and ultimately improve enterprise total factor productivity. Based on the above theory, this research proposes the following hypotheses:
Hypothesis 3 (H3).
Enterprise digital transformation has a positive effect on analysts’ attention.
Hypothesis 4 (H4).
Analysts’ attention plays a mediating role between digital transformation and total factor productivity.
4. Research Design
4.1. Sample Selection and Data Sources
To verify the above hypotheses, this research selected data from Chinese A-share listed companies from 2012 to 2021 as the sample. To avoid the impact of extreme values on the experimental results, this research processed the sample data as follows: (1) considering the particularity of the financial industry, this research excluded financial enterprises; (2) this research excluded ST enterprises and delisted enterprises; (3) this research eliminated enterprises with severe data deficiencies; (4) to prevent the impact of data skewing to the right on the experimental results, this research winsorized all variables at the 1% and 99% levels. Finally, this research obtained the balanced panel data of 21,050 observations from 2105 enterprises. The data in this research were sourced from the CSMAR database, and empirical analysis was conducted using Stata 15.0.
4.2. Model Building
4.2.1. Basic Model
To test the relationship between digital transformation and total factor productivity, this research constructed a bidirectional fixed effects model after conducting the Hausman test (p = 0.000):
where TFP is the total factor productivity of enterprise i in year t, DT is the digital transformation of enterprise i in year t, Control is the control variable, year and Ind are the annual fixed effect and industry fixed effect, respectively, ε is the error term, and α0 is a constant term. If α1 is significantly positive, indicating that digital transformation has a positive impact on total factor productivity, H1 is validated.
4.2.2. Mediating Effect Model
In order to test the mechanism of analysts’ attention in the interaction between digital transformation and total factor productivity, this study drew on the mesomeric effect test method proposed by Baron, R et al. [74] to build a mesomeric effect model. Equations (1)–(3) were established for stepwise regression analysis. The LR test (p = 0.000) results showed that the mediation model is reasonable. The model was constructed as follows:
where Analyst represents the intermediate variable. Firstly, in the regression Formula (2), if γ2 is significantly positive, indicating that analyst attention can significantly improve the total factor productivity of the enterprise, H2 is validated. Secondly, based on this, in the regression Formula (3), if β1 and γ2 are significantly positive, then the mesomeric effect that analysts pay attention to exists, and H3 and H4 are verified. Finally, based on β1∗γ2, it can be determined whether the mediating role that analysts focus on is complete or constitutes as partial mediation.
4.3. Variable Definition
4.3.1. The Dependent Variable
The total factor productivity (TFP) of enterprises was chosen as the dependent variable. At present, there are methods to calculate total factor productivity, such as the LP method, OP method, OLS method, and GMM method. This study used the LP method [75] to calculate total factor productivity (TFP_LP), which can effectively solve the problem of simultaneity deviation caused by enterprises selecting output and capital inventory simultaneously [76]. In addition, the OP method (TFP_OP) and OLS method (TFP_OLS) were used for the robustness test. The LP method model was constructed as follows:
where Yi,t represents the total output of the enterprise, measured by the operating income of the enterprise; Ki,t represents capital investment, measured by the net fixed asset value of the enterprise; Li,t represents labor input, measured by the number of employees in the enterprise; and Mi,t represents intermediate investment, measured by operating costs + management expenses + financial expenses + sales expenses − depreciation and amortization − cash paid to and on behalf of employees.
Furthermore, in Equation (4), is a constant term, and represent the elasticity coefficients of capital investment, labor investment, and intermediary investment, symbolizing the dependency relationship between K, L, M, and Y.
4.3.2. Explanatory Variable
Enterprise digital transformation (DT) was selected as the explanatory variable. Scholars often use text analysis to measure digital transformation based on enterprises’ annual reports and semantic expressions of national policies related to the digital economy to construct a “digital” vocabulary for enterprises [77,78] and to measure the degree of digitalization of enterprises by measuring the frequency of key words in enterprise digital transformation. This research referred to the practice of scholars and took the natural logarithm of the enterprise “digital” word frequency plus 1 as the quantitative index of digital transformation. The enterprise “digital” word frequency data were obtained from the CSMAR database.
4.3.3. Mediating Variable
Analysts’ attention (Analyst) was selected as the mediating variable. This research took the number of analyst teams that followed the company in that year plus the natural logarithm of 1 as a measure of analysts’ attention [79].
4.3.4. Control Variables
This research selected the following variables as control variables from three aspects: enterprise characteristics, financial indicators, and governance level. First, company size (Size) and age (Age) were selected as micro-characteristic-level variables; Size and Age are closely related to an enterprise’s financial decision making [80]. Size is quantified by the natural logarithm of the enterprise’s total assets, and Age is quantified by the natural logarithm of the difference between the observation year and the enterprise’s founding year. Second, the financial leverage ratio (Lev), growth (Growth), and profitability (ROA) were selected as financial variables according to the specific financial characteristics of the enterprise; Lev is crucial for improving organizational efficiency in enterprises [81]. This research measured the ratio of a company’s total liabilities to total assets. Growth and ROA are important financial indicators for enterprises. Growth is calculated as the ratio of annual revenue growth in year t to the total revenue in year t − 1. ROA is calculated as the ratio of net revenue to total assets [82]. Finally, at the governance level, the equity concentration ratio (CR1) and dual (Dual) were selected as control variables. The investment of the largest controlling shareholder in a company has an impact on its production efficiency [83]. Therefore, this research used the shareholding ratio of the largest shareholder to measure CR1. Meanwhile, if the CEO/chairman position is held by the same person, then Dual is taken as 1; otherwise, it is 0 [84]. Due to the determination to construct a fixed effects model following the Hausman test, this research simultaneously controlled for two external variables: year and industry. The specific definitions and calculation methods of each variable are shown in Table 1.

Table 1.
Variable definitions.
5. Results
5.1. Descriptive Statistics and Collinearity Test
Table 2 reports the results of the descriptive statistics and collinearity test of the variables, in which the average value of total factor productivity is 16.050, indicating that the overall development level of Chinese A-share enterprises is relatively high, and the standard deviation is 1.129, indicating that there are still large differences in total factor productivity among enterprises. The average value of digital transformation is 1.329, and the standard deviation is 1.364, indicating that there are large differences in digital transformation levels among enterprises, and the dispersion of digital transformation among different enterprises is large, meaning there are certain differences in the attention given by enterprises to digital transformation. The results of the variance expansion factor test show that the VIF value is far less than 10, indicating that there is no serious multicollinearity among these variables, which proves that the selection of the variables was effective.
Table 2.
Descriptive statistics and correlation analysis.
5.2. Correlation Analysis and Collinearity Analysis
Table 3 reports the correlation between variables. The correlation coefficient between the digital transformation and total factor productivity of enterprises is 0.127, which is significant at the level of 1%, initially indicating the relationship between the digital transformation and total factor productivity of enterprises. The absolute values of the correlation coefficients of other variables are all below 0.5, indicating that the experimental results are not affected by multicollinearity.
Table 3.
Correlation analysis and collinearity analysis Correlation coefficient.
5.3. Normal Distribution
Figure 1 shows that the density of the data’s dependent variable (TFP_LP) follows a normal distribution, which lays the foundation for regression analysis and a Sobel test in this study.
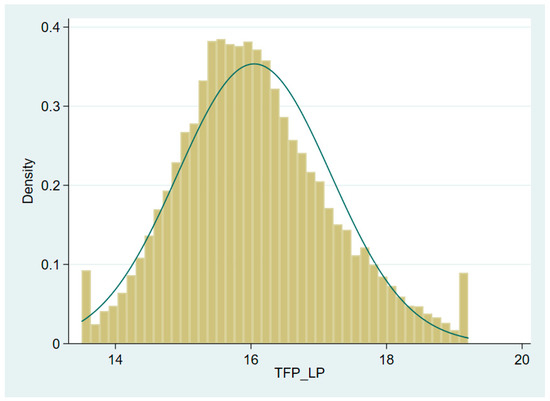
Figure 1.
Normal distribution histogram of dependent variable.
5.4. Benchmark Regression
Columns (1) and (2) of Table 4 report the impact of digital transformation on total factor productivity. On the premise of controlling the year fixed effect and industry fixed effect, the regression coefficient of digital transformation is positive regardless of whether control variables are added, which is significant at the level of 1%, indicating that digital transformation is conducive to improving total factor productivity and has become an important strategic measure for the high-quality development of enterprises. H1 is, therefore, validated. The results in column (3) of Table 4 show that the regression coefficient of digital transformation for analysts’ attention is significantly positive at the level of 1%, indicating that digital transformation attracts more analysts’ attention and increases the attention received by the company. Therefore, H3 is validated. The results in column (4) of Table 4 show that the regression result of analysts’ attention is significantly positive at the 1% level, indicating that analysts’ attention can significantly promote the improvement of the total factor productivity of enterprises. H2 is, therefore, validated. The results in columns (2) to (4) of Table 4 report the intermediary role of analysts’ attention between digital transformation and total factor productivity. The results in column (4) show that the regression coefficients of digital transformation and analysts’ attention are 0.026 and 0.050, respectively, which are significant at the level of 1%. In addition, the regression coefficient of digital transformation is less than that in column (1), indicating that analysts’ attention plays a mediating role in the relationship between digital transformation and total factor productivity. At the same time, according to the mesomeric effect results of analysts’ attention in Table 5, the coefficient of mesomeric effect → analysts’ attention → total factor productivity of “digital transformation” is 0.009, which is significant at the level of 1%. Therefore, H4 is verified, indicating that enterprises’ digital transformation attracts more attention from analysts, increases their popularity, and, thus, improves their total factor productivity.
Table 4.
Benchmark regression Baseline results.
Table 5.
Regression results of the mesomeric effect.
5.5. Endogeneity Testing
Considering that the experimental results may have endogeneity issues due to objective reasons such as causal inversion and sample selection bias, to avoid bias in the experimental results due to endogeneity issues, this research chose the lagged variable method, instrumental variable method, and propensity score matching method for endogeneity testing.
5.5.1. Lagged Variable Method
Since enterprises’ digital transformation needs to go through a series of processes from input to output, and the integration of digital technology and the real economy needs to be constantly deployed, enterprises’ digital transformation may have a time lag. For this purpose, this study used digital transformation lag phase 1 (L.DT) and lag phase 2 (L2.DT) as explanatory variables and substituted them into the Equation (1) for regression. The regression results are shown in columns (1) and (2) of Table 6. The results show that the regression coefficients of L.DT and L2.DT are 0.024 and 0.009, respectively, which are significant at the 1% and 10% levels. This shows that the lagged variable method once again verifies H1, i.e., the digital transformation of enterprises has a significantly positive impact on total factor productivity.
Table 6.
Endogeneity test.
5.5.2. Instrumental Variable Method
The instrumental variable method is used to solve the problem of causal inversion in natural experiments [85]. Instrumental variables refer to a type of variable that is related to the study exposure/treatment factor, unrelated to other confounding factors, and not directly related to the outcome variable. Instrumental variables only indirectly affect the outcome variable through their relationship with the exposure/treatment factor and the relationship between the exposure/treatment factor and the outcome variable [86,87].
Considering that enterprises with high total factor productivity have more advantageous resources and stronger profitability, and are more inclined towards digital transformation, there may be an endogeneity problem of causal inversion between digital transformation and total factor productivity. In order to avoid the impact of this issue on the experiment, the instrumental variable method (IV-2SLS) was used for endogeneity testing in this study. The first instrumental variable (IV1) was the natural logarithm of phone call duration over the last year in the region where the enterprise is located. The usage of mobile phones in the region is an important reference prerequisite for enterprise digital transformation and is highly related to enterprise digital transformation. At the same time, the natural logarithm of optical cable line length from the year previous to the observation year in the region where the enterprise is located was selected as the second instrumental variable (IV2). This indicator is closely related to digital transformation and depth of enterprise digital transformation. Both IV1 and IV2 are highly correlated with enterprise digital transformation, but they cannot directly affect enterprise total factor productivity. The correlation and endogeneity requirements of the instrumental variables are met. The Kleibergen–Paap rk LM statistic and Kleibergen–Paap rk Wald F statistic are 40.975 and 20.664, respectively, which are significant at the 1% level, indicating that the selection of IV1 and IV2 as instrumental variables for digital transformation through endogeneity testing was reasonable. Column (3) in Table 6 reports the first-stage regression results of the instrumental variables, and the results show that the regression coefficients of IV1 and IV2 are 0.120 and −0.063, respectively, which are significant at the 1% level. This indicates that IV1 and IV2 significantly affect digital transformation, once again confirming the effectiveness of IV1 and IV2 as instrumental variables in digital transformation. Column (4) in Table 6 reports the second-stage regression results of the instrumental variables, and the results confirm that the digital transformation regression coefficient is 0.979, which is significant at the 1% level. This indicates that after considering the endogeneity problem of causal inversion, the conclusion that digital transformation can significantly improve total factor productivity is still valid.
5.5.3. Propensity Score Matching Method
To alleviate the impact of sample selection bias on the experimental results, this research used the propensity score matching (PSM) method to match the samples and then substituted them into Equation (1) for regression. First, the sample was divided into an experimental group (DT2 = 1) with digital transformation and a control group (DT2 = 0) without digital transformation. Second, according to the different internal characteristics of enterprises, this research selected enterprise size (Size), enterprise age (Age), financial leverage (Lev), growth capacity (Growth), profitability (ROA), shareholding ratio (CR1), and Dual as covariates. Third, using the logit model to estimate propensity scores and performing 1:1 and 1:4 nearest neighbor matching, the average processing effects after matching, ATT, were 8.00 and 8.28, respectively, which were significant at the 1% level. Fourth, the matching samples were regressed again. The regression results are shown in columns (5) and (6) of Table 6. The results show that the regression coefficients of digital transformation for total factor productivity after 1:1 and 1:4 nearest neighbor matching are 0.029 and 0.027, respectively, which are significant at the 1% level. This once again confirms that digital transformation can significantly improve total factor productivity.
5.6. Robustness Test
To verify the robustness of the above results, this research selected three methods to test the robustness: the variable replacement method, model replacement method, and elimination of specific samples.
5.6.1. Variable Replacement Method
As part of robustness testing, we replaced the dependent variable. The OLS method and OP method were used to recalculate total factor productivity, and the regression results are shown in Table 7. The results show that even if the measurement method of total factor productivity changes, digital transformation still significantly promotes total factor productivity. The mesomeric effect of analysts’ attention is consistent with the above results, which verifies the robustness of the above results.
Table 7.
Robustness test 1.
Furthermore, we replaced the explanatory variables. Virtual variables were used as proxy indicators for enterprise digital transformation (DT2). If the annual report of the enterprise mentions words related to digital transformation (DT > 0), it is considered that the enterprise has conducted digital transformation in the current year, and DT2 is assigned a value of 1; otherwise, it is assigned a value of 0. This research substituted DT2 and total factor productivity (LP method) into Formulas (1)–(3) for regression, and the results are shown in columns (1) to (3) of Table 8. The regression results are consistent with the previous text, indicating that the results of this study are robust.
Table 8.
Robustness test 2.
5.6.2. Eliminate Specific Samples
COVID-19 has seriously affected China’s various industries, international trade, and labor employment, and has ultimately led to huge losses in China’s economic system in 2020 [88]. The development of various industries is constantly impacted, and the digitalization process of enterprises will also be affected to some extent. Therefore, in order to verify the robustness of the above research conclusions, this study excluded the transmission years of COVID-19 from 2020 to 2021 and reserved the samples from 2012 to 2019 for the robustness test. The regression results are shown in columns (4) to (6) of Table 8. The results show that after excluding specific samples, digital transformation (0.022, 1%) and analysts’ attention (0.043, 1%) still have a positive impact on total factor productivity, and the intermediary effect of analysts’ attention still exists. The regression results are consistent with the previous text, which again verifies the validity of the conclusions.
5.6.3. Model Replacement Method
To test the robustness of the mediating effect results, this research conducted a bootstrap test and a Sobel test. The results are shown in Table 9 and Table 10. The Z values of the bootstrap test and Sobel test are both significant at the 1% level. The results again prove that analysts’ attention has a mediating effect in the process of digital transformation affecting total factor productivity.
Table 9.
Bootstrap test.
Table 10.
Sobel test.
6. Heterogeneity Analysis
6.1. National Economy Industry
There are certain differences in the digital integration capabilities of enterprises in different industries, meaning that the impact of digital transformation on total factor productivity may vary. In order to study the impact of digital transformation on the total factor productivity of different types of enterprises, this study utilized the “Three Industry Classification Regulations (2012)” issued by the National Bureau of Statistics (http://www.stats.gov.cn/xxgk/tjbz/gjtjbz/201804/t20180402_1758923.html) URL (accessed on 23 March 2018) as a basis. The sample was divided into three categories according to the national economic industry: primary industry, secondary industry, and tertiary industry, and the impact of digital transformation on the total factor productivity of enterprises in different industries was tested. The regression results are shown in columns (1)–(3) of Table 11. The results indicate that the impact of enterprise digital transformation in the primary industry on total factor productivity is not significant, while the regression coefficients of digital transformation in the secondary and tertiary industries are 0.022 and 0.029, respectively, and both are significant at the 1% level. However, only the relationship coefficient between digital transformation and total factor productivity in the tertiary industry is greater than the relationship coefficient between the full-sample digital transformation and total factor productivity. The research results indicate that there is an imbalance in digital transformation output among enterprises in various industries, encouraging enterprises to develop digital strategies based on their own industry characteristics, and the government to formulate differentiated policies based on different industries.
Table 11.
Heterogeneity analysis Heterogeneity test.
6.2. Industry Competition Level
Industry competition affects a company’s attention to other companies in the same industry and its sensitivity to changes in the external environment. According to the theory of competitive dynamics, competition between enterprises is often dynamic [89]. In highly competitive industries, due to high levels of mutual attention, companies often increase familiarity, which further leads to a mutual tolerance effect between enterprises [90]. This leads to a faster resource flow and better information exchange efficiency between enterprises. When competitors gain advantages through digitalization, other enterprises react quickly and increase their learning and imitation efforts, leading to greater risks and uncertainties for enterprises in competitive industries during the digital transformation process, and the marginal utility of digital transformation for enterprise development is weakened. In contrast, companies in less competitive industries lack motivation in digital transformation and often rely on leading companies to drive them. The leading role of enterprises in digitalization is more prominent. Once the demonstration effect of digital transformation is achieved, usually by a leading enterprise, the marginal efficiency of digital transformation in less competitive industries will increase, and the impact of digital transformation on enterprise development will be more significant.
The Herfindahl index (HHI) is an indicator of the industry concentration ratio. The higher the industry concentration ratio, the lower the industry competitiveness. This study used the median of the HHI as the grouping criterion and divided the samples into high-competition and low-competition groups. The regression results are shown in columns (4) and (5) of Table 11. The results indicate that in an external environment with high industry competition, the coefficient of the influence of enterprise digital transformation on total factor productivity is 0.024, which is significant at the 1% level. However, when industry competition is low, the coefficient of the influence of digital transformation on total factor productivity is 0.03, which is significant at the 1% level, indicating that, due to differences in industry competition, the impact of digital transformation on total factor productivity is heterogeneous, and the impact of digital transformation on total factor productivity by enterprises in less competitive industries is better than that of enterprises in highly competitive industries.
7. Discussion
7.1. Theoretical Implications
The main theoretical contributions of this study are as follows: First, this study proves that digital transformation has a positive and significant impact on enterprise total factor productivity, enriching the theoretical achievements of digital transformation. Second, this study found that an increase in analysts’ attention to enterprises has a significant positive impact on total factor productivity, enriching the research on the influencing factors of total factor productivity. Third, most scholars have studied the mechanism of digital transformation’s impact on total factor productivity from the perspective of enterprises’ internal characteristics [8,9,10,39,40], without discussing whether analysts focus on playing a role in the process of digital transformation and affecting total factor productivity. In order to fill this theoretical gap, this study, for the first time, incorporated digital transformation, analysts’ attention, and total factor productivity into the same theoretical framework, laying the foundation for the information intermediary role of analysts’ attention between digital transformation and total factor productivity, and broadening the research on the impact of digital transformation on total factor productivity from the perspective of analysts’ attention. Fourth, the existing research lacks attention to the relationship between digital transformation and total factor productivity from the perspective of enterprises’ external characteristics. Therefore, based on the differences between external industry characteristics and the competitive environment characteristics of enterprises, this study conducted a heterogeneity analysis of the relationship between digital transformation and total factor productivity, expanding the breadth and depth of the existing research, and enriching the literature on the digital transformation of enterprises.
7.2. Practical Implications
Empowering the real economy with digital technology has become a key driving factor for improving enterprise production efficiency. Understanding how to achieve high-quality development by cultivating competitive advantages through digital transformation has become the focus of enterprises. This study has three management implications for businesses and governments.
First, enterprises’ digital transformation has become an important factor in improving their total factor productivity. Enterprises should speed up the construction of digital infrastructure and promote the digital process. In the process of digital transformation, enterprises should become familiar with advanced digital technology and excellent cases of digital transformation at home and abroad, identify the focus and direction of enterprise digital construction, consolidate the efficiency and quality of enterprise digital output, accelerate the organic integration of emerging technology and traditional production methods, and realize the improvement of production efficiency.
Second, enterprises should attach importance to the information transmission role that analysts are concerned about. Analysts are important information carriers in the capital market, playing a mediating role between digital transformation and total factor productivity. Enterprises should learn to use analysts to convey good development signals to the outside world, increase the transformation of digital achievements, show digital achievements to the market, attract more resource investment, ease enterprise financing difficulties, break through their own development bottlenecks, and strengthen the mesomeric effect of information that analysts pay attention to.
Finally, the impact of digital transformation on the total factor productivity of enterprises within different industries and with different levels of external competitiveness is heterogeneous. Enterprises should equate digital strategies that align with their internal and external characteristics. At the same time, as a macro-regulatory agency, the government should promote the deployment of digital strategies, implement differentiated policies for enterprises in different national economic industries and competitive market environments, guide different types of enterprises to explore digital paths suitable for their own development, and increase support for the primary industry. Supporting the secondary industry and industries with fierce market competition will create a good external ecological environment for enterprise digital transformation, reduce digital transformation imbalances between enterprises with different characteristics, promote the development of the digital economy, and provide strong support for high-quality economic development.
7.3. Shortcomings and Prospects
Although this study integrated digital transformation, analysts’ attention, and total factor productivity into the same theoretical framework, enriching the research on the impact mechanism of digital transformation on total factor productivity, which has certain theoretical and practical significance, there are still some limitations. Firstly, this study selected data from Chinese A-share listed companies from 2012 to 2021, covering almost all industry enterprises. However, enterprises in different industries have some differences in the direction of digital transformation and the transformation of achievements. The impact of digital transformation on total factor productivity may have differentiated results. Future research could conduct differentiated research on the digital transformation of different industries. Secondly, this study analyzed the direct impact of analysts’ attention on total factor productivity, and further exploration of the mechanism by which analysts’ attention affects the total factor productivity of enterprises could be examined in the future. Finally, this study focused on the information intermediary role played by analysts between digital transformation and total factor productivity. In the future, the research focus could be shifted to the external supervision (supervision) role played by analysts between digital transformation and total factor productivity.
8. Conclusions
Digital transformation has become an inevitable choice for enterprises to achieve high-quality development and an important strategic means for enterprises to establish competitive advantages and consolidate their market position. This research empirically tested the impact of digital transformation on total factor productivity using data from A-share listed companies in China from 2012 to 2021 and explored the mechanism of digital transformation’s impact on total factor productivity from an analyst’s perspective. The results showed that both digital transformation and analysts’ attention can significantly improve enterprise total factor productivity. Analysts’ attention was found to play an information intermediary role between digital transformation and total factor productivity. After a series of endogeneity and robustness tests, this conclusion remained valid. The impact of digital transformation on total factor productivity may exhibit heterogeneity due to different external macro-environments. When a company belongs to the tertiary industry of the national economic industry classification and the market competition level is low, the promotion effect of digital transformation on total factor productivity is more significant. Theoretically, this study is one of the first to explore the intermediary mechanism of enterprise digital transformation in affecting total factor productivity from the perspective of analysts. In practice, it is recommended that enterprises accelerate the digitization process and utilize the signal transmission function of analysts’ attention to cultivate reputation, acquire resources, and improve total factor productivity. In the process of digitalization, enterprises should consider their own industry characteristics and the degree of environmental competition. The government should formulate differentiated policies based on the division of national economic industries and the degree of industry competition.
Author Contributions
Conceptualization, G.X. and Z.Y.; methodology, G.X. and Z.Y.; software, Z.Y.; validation, G.X., Z.Y. and X.P.; formal analysis, Z.Y.; investigation, X.P.; resources, G.X.; data curation, G.X. and Z.Y.; writing—original draft preparation, G.X. and Z.Y.; writing—review and editing, Z.Y.; supervision, G.X. All authors have read and agreed to the published version of the manuscript.
Funding
This research was funded by Project supported by National Natural Science Foundation of China (71862003) and Graduate Education Innovation Project of the Department of Education of Guangxi Zhuang Autonomous Region (YCSW2022482).
Institutional Review Board Statement
Not applicable.
Informed Consent Statement
Not applicable.
Data Availability Statement
The datasets generated and/or analyzed during the current study are available from the corresponding author upon reasonable request.
Conflicts of Interest
The authors declare no conflict of interest.
References
- Li, Z.; Liu, Y. Research on the spatial distribution pattern and influencing factors of digital economy development in China. IEEE Access 2021, 9, 63094–63106. [Google Scholar] [CrossRef]
- Matt, C.; Hess, T.; Benlian, A. Digital transformation strategies. Bus. Inf. Syst. Eng. 2015, 57, 339–343. [Google Scholar] [CrossRef]
- Ilvonen, I.; Thalmann, S.; Manhart, M.; Sillaber, C. Reconciling digital transformation and knowledge protection: A research agenda. Knowl. Manag. Res. Pract. 2018, 16, 235–244. [Google Scholar] [CrossRef]
- Ebert, C.; Duarte, C.H.C. Digital transformation. IEEE Softw. 2018, 35, 16–21. [Google Scholar] [CrossRef]
- Dey, K.; Saha, S. Influence of procurement decisions in two-period green supply chain. J. Clean. Prod. 2018, 190, 388–402. [Google Scholar] [CrossRef]
- Wang, J.; Liu, Y.; Wang, W.; Wu, H. How does digital transformation drive green total factor productivity? Evidence from Chinese listed enterprises. J. Clean. Prod. 2023, 406, 136954. [Google Scholar] [CrossRef]
- Su, J.; Wei, Y.; Wang, S.; Liu, Q. The impact of digital transformation on the total factor productivity of heavily polluting enterprises. Sci. Rep. 2023, 13, 6386. [Google Scholar] [CrossRef]
- Ren, Y.; Zhang, X.; Chen, H. The impact of new energy enterprises’ digital transformation on their total factor productivity: Empirical evidence from China. Sustainability 2022, 14, 13928. [Google Scholar] [CrossRef]
- Zhang, H.; Zhang, Q. How Does Digital Transformation Facilitate Enterprise Total Factor Productivity? The Multiple Mediators of Supplier Concentration and Customer Concentration. Sustainability 2023, 15, 1896. [Google Scholar] [CrossRef]
- Cheng, Y.; Zhou, X.; Li, Y. The effect of digital transformation on real economy enterprises’ total factor productivity. Int. Rev. Econ. Financ. 2023, 85, 488–501. [Google Scholar] [CrossRef]
- Liu, J.; Liu, S.; Xu, X.; Zou, Q. Can digital transformation promote the rapid recovery of cities from the COVID-19 epidemic? An empirical analysis from Chinese cities. Int. J. Environ. Res. Public Health 2022, 19, 3567. [Google Scholar] [CrossRef]
- Tian, X.; Zhang, Y.; Qu, G. The Impact of digital economy on the efficiency of green financial investment in China’s provinces. Int. J. Environ. Res. Public Health 2022, 19, 8884. [Google Scholar] [CrossRef]
- Song, M.; Zheng, C.; Wang, J. The role of digital economy in China’s sustainable development in a post-pandemic environment. J. Enterp. Inf. Manag. 2022, 35, 58–77. [Google Scholar] [CrossRef]
- Zhao, Y.; Xia, S.; Zhang, J.; Hu, Y.; Wu, M. Effect of the digital transformation of power system on renewable energy utilization in China. IEEE Access 2021, 9, 96201–96209. [Google Scholar] [CrossRef]
- Wang, Q.; Hu, A.; Tian, Z. Digital transformation and electricity consumption: Evidence from the Broadband China Pilot Policy. Energy Econ. 2022, 115, 106346. [Google Scholar] [CrossRef]
- Zhai, H.; Yang, M.; Chan, K.C. Does digital transformation enhance a firm’s performance? Evidence from China. Technol. Soc. 2022, 68, 101841. [Google Scholar] [CrossRef]
- Yu, J.; Wang, J.; Moon, T. Influence of Digital Transformation Capability on Operational Performance. Sustainability 2022, 14, 7909. [Google Scholar] [CrossRef]
- Liu, M.; Li, C.; Wang, S.; Li, Q. Digital transformation, risk-taking, and innovation: Evidence from data on listed enterprises in China. J. Innov. Knowl. 2023, 8, 100332. [Google Scholar] [CrossRef]
- Ma, H.; Jia, X.; Wang, X. Digital transformation, ambidextrous innovation and enterprise value: Empirical analysis based on listed Chinese manufacturing companies. Sustainability 2022, 14, 9482. [Google Scholar] [CrossRef]
- Tian, G.; Li, B.; Cheng, Y. Does digital transformation matter for corporate risk-taking? Financ. Res. Lett. 2022, 49, 103107. [Google Scholar] [CrossRef]
- Gao, F.; Lin, C.; Zhai, H. Digital transformation, corporate innovation, and international strategy: Empirical evidence from listed companies in China. Sustainability 2022, 14, 8137. [Google Scholar] [CrossRef]
- Li, G.; Jin, Y.; Gao, X. Digital transformation and pollution emission of enterprises: Evidence from China’s micro-enterprises. Energy Rep. 2023, 9, 552–567. [Google Scholar] [CrossRef]
- Zhang, X.; Nutakor, F.; Minlah, M.K.; Li, J. Can Digital Transformation Drive Green Transformation in Manufacturing Companies?—Based on Socio-Technical Systems Theory Perspective. Sustainability 2023, 15, 2840. [Google Scholar] [CrossRef]
- Xue, L.; Zhang, Q.; Zhang, X.; Li, C. Can digital transformation promote green technology innovation? Sustainability 2022, 14, 7497. [Google Scholar] [CrossRef]
- Manita, R.; Elommal, N.; Baudier, P.; Hikkerova, L. The digital transformation of external audit and its impact on corporate governance. Technol. Forecast. Soc. Chang. 2020, 150, 119751. [Google Scholar] [CrossRef]
- Zeng, G.; Lei, L. Digital transformation and corporate total factor productivity: Empirical evidence based on listed enterprises. Discret. Dyn. Nat. Soc. 2021, 2021, 9155861. [Google Scholar] [CrossRef]
- Xiao, Z.; Peng, H.; Pan, Z. Innovation, external technological environment and the total factor productivity of enterprises. Account. Financ. 2022, 62, 3–29. [Google Scholar] [CrossRef]
- Song, M.; Peng, L.; Shang, Y.; Zhao, X. Green technology progress and total factor productivity of resource-based enterprises: A perspective of technical compensation of environmental regulation. Technol. Forecast. Soc. Chang. 2022, 174, 121276. [Google Scholar] [CrossRef]
- Li, Z.; Zou, F.; Mo, B. Does mandatory CSR disclosure affect enterprise total factor productivity? Econ. Res.-Ekon. Istraživanja 2022, 35, 4902–4921. [Google Scholar] [CrossRef]
- Miao, L.; Zhuo, Y.; Wang, H.; Lyu, B. Non-financial enterprise financialization, product market competition, and total factor productivity of enterprises. Sage Open 2022, 12, 21582440221089956. [Google Scholar] [CrossRef]
- Peng, J.; Xie, R.; Ma, C.; Fu, Y. Market-based environmental regulation and total factor productivity: Evidence from Chinese enterprises. Econ. Model. 2021, 95, 394–407. [Google Scholar] [CrossRef]
- Ai, H.; Hu, S.; Li, K.; Shao, S. Environmental regulation, total factor productivity, and enterprise duration: Evidence from China. Bus. Strategy Environ. 2020, 29, 2284–2296. [Google Scholar] [CrossRef]
- Pan, X.; Pu, C.; Yuan, S.; Xu, H. Effect of Chinese pilots carbon emission trading scheme on enterprises’ total factor productivity: The moderating role of government participation and carbon trading market efficiency. J. Environ. Manag. 2022, 316, 115228. [Google Scholar] [CrossRef]
- Wu, Q.; Wang, Y. How does carbon emission price stimulate enterprises’ total factor productivity? Insights from China’s emission trading scheme pilots. Energy Econ. 2022, 109, 105990. [Google Scholar] [CrossRef]
- Chen, H.; Guo, W.; Feng, X.; Wei, W.; Liu, H.; Feng, Y.; Gong, W. The impact of low-carbon city pilot policy on the total factor productivity of listed enterprises in China. Resour. Conserv. Recycl. 2021, 169, 105457. [Google Scholar] [CrossRef]
- Cai, W.; Ye, P. How does environmental regulation influence enterprises’ total factor productivity? A quasi-natural experiment based on China’s new environmental protection law. J. Clean. Prod. 2020, 276, 124105. [Google Scholar] [CrossRef]
- Li, K.; Guo, Z.; Chen, Q. The effect of economic policy uncertainty on enterprise total factor productivity based on financial mismatch: Evidence from China. Pac.-Basin Financ. J. 2021, 68, 101613. [Google Scholar] [CrossRef]
- Ren, X.; Jin, C.; Lin, R. Oil price uncertainty and enterprise total factor productivity: Evidence from China. Int. Rev. Econ. Financ. 2023, 83, 201–218. [Google Scholar] [CrossRef]
- Liu, H.; Liu, W.; Chen, G. Environmental information disclosure, digital transformation, and total factor productivity: Evidence from Chinese heavy polluting listed companies. Int. J. Environ. Res. Public Health 2022, 19, 9657. [Google Scholar] [CrossRef]
- Li, N.; Wang, X.; Wang, Z.; Luan, X. The impact of digital transformation on corporate total factor productivity. Front. Psychol. 2022, 13, 10711986. [Google Scholar] [CrossRef]
- Moyer, R.C.; Chatfield, R.E.; Sisneros, P.M. Security analyst monitoring activity: Agency costs and information demands. J. Financ. Quant. Anal. 1989, 24, 503–512. [Google Scholar] [CrossRef]
- Corredor, P.; Ferrer, E.; Santamaria, R. Value of analysts’ consensus recommendations and investor sentiment. J. Behav. Financ. 2013, 14, 213–229. [Google Scholar] [CrossRef]
- Bai, G.; Li, T.; Xu, P. Can analyst coverage enhance corporate innovation legitimacy?—Heterogeneity analysis based on different situational mechanisms. J. Clean. Prod. 2023, 405, 137048. [Google Scholar] [CrossRef]
- Chahine, S.; Daher, M.; Saade, S. Doing good in periods of high uncertainty: Economic policy uncertainty, corporate social responsibility, and analyst forecast error. J. Financ. Stab. 2021, 56, 100919. [Google Scholar] [CrossRef]
- Hu, M.; Xiong, W.; Xu, C. Analyst coverage, corporate social responsibility, and firm value: Evidence from China. Glob. Financ. J. 2021, 50, 100671. [Google Scholar] [CrossRef]
- Ghobakhloo, M. Industry 4.0, digitization, and opportunities for sustainability. J. Clean. Prod. 2020, 252, 119869. [Google Scholar] [CrossRef]
- Kraus, S.; Roig-Tierno, N.; Bouncken, R.B. Digital innovation and venturing: An introduction into the digitalization of entrepreneurship. Rev. Manag. Sci. 2019, 13, 519–528. [Google Scholar] [CrossRef]
- Wen, H.; Zhong, Q.; Lee, C.-C. Digitalization, competition strategy and corporate innovation: Evidence from Chinese manufacturing listed companies. Int. Rev. Financ. Anal. 2022, 82, 102166. [Google Scholar] [CrossRef]
- Sia, S.K.; Weill, P.; Zhang, N. Designing a future-ready enterprise: The digital transformation of DBS bank. Calif. Manag. Rev. 2021, 63, 35–57. [Google Scholar] [CrossRef]
- Agostini, L.; Galati, F.; Gastaldi, L. The digitalization of the innovation process: Challenges and opportunities from a management perspective. Eur. J. Innov. Manag. 2020, 23, 1–12. [Google Scholar] [CrossRef]
- Kraus, S.; Richter, C.; Papagiannidis, S.; Durst, S. Innovating and exploiting entrepreneurial opportunities in smart cities: Evidence from Germany. Creat. Innov. Manag. 2015, 24, 601–616. [Google Scholar] [CrossRef]
- Zeng, J.; Glaister, K.W. Value creation from big data: Looking inside the black box. Strateg. Organ. 2018, 16, 105–140. [Google Scholar] [CrossRef]
- Wang, H.; Feng, J.; Zhang, H.; Li, X. The effect of digital transformation strategy on performance: The moderating role of cognitive conflict. Int. J. Confl. Manag. 2020, 31, 441–462. [Google Scholar] [CrossRef]
- Gobble, M.M. Digitalization, digitization, and innovation. Res.-Technol. Manag. 2018, 61, 56–59. [Google Scholar] [CrossRef]
- Holmström, J.; Holweg, M.; Lawson, B.; Pil, F.K.; Wagner, S.M. The digitalization of operations and supply chain management: Theoretical and methodological implications. J. Oper. Manag. 2019, 65, 728–734. [Google Scholar] [CrossRef]
- Sousa, M.J.; Rocha, Á. Skills for disruptive digital business. J. Bus. Res. 2019, 94, 257–263. [Google Scholar] [CrossRef]
- Bharadwaj, A.; El Sawy, O.A.; Pavlou, P.A.; Venkatraman, N.v. Digital business strategy: Toward a next generation of insights. MIS Q. 2013, 37, 471–482. [Google Scholar] [CrossRef]
- Clauss, T.; Bouncken, R.B.; Laudien, S.; Kraus, S. Business model reconfiguration and innovation in SMEs: A mixed-method analysis from the electronics industry. Int. J. Innov. Manag. 2020, 24, 2050015. [Google Scholar] [CrossRef]
- Teece, D.J. A capability theory of the firm: An economics and (strategic) management perspective. N. Z. Econ. Pap. 2019, 53, 1–43. [Google Scholar] [CrossRef]
- Eller, R.; Alford, P.; Kallmünzer, A.; Peters, M. Antecedents, consequences, and challenges of small and medium-sized enterprise digitalization. J. Bus. Res. 2020, 112, 119–127. [Google Scholar] [CrossRef]
- Hong, H.; Lim, T.; Stein, J.C. Bad news travels slowly: Size, analyst coverage, and the profitability of momentum strategies. J. Financ. 2000, 55, 265–295. [Google Scholar] [CrossRef]
- Ayers, B.C.; Freeman, R.N. Evidence that analyst following and institutional ownership accelerate the pricing of future earnings. Rev. Account. Stud. 2003, 8, 47–67. [Google Scholar] [CrossRef]
- Amiram, D.; Owens, E.; Rozenbaum, O. Do information releases increase or decrease information asymmetry? New evidence from analyst forecast announcements. J. Account. Econ. 2016, 62, 121–138. [Google Scholar] [CrossRef]
- Naqvi, S.K.; Shahzad, F.; Rehman, I.U.; Qureshi, F.; Laique, U. Corporate social responsibility performance and information asymmetry: The moderating role of analyst coverage. Corp. Soc. Responsib. Environ. Manag. 2021, 28, 1549–1563. [Google Scholar] [CrossRef]
- Muslu, V.; Mutlu, S.; Radhakrishnan, S.; Tsang, A. Corporate social responsibility report narratives and analyst forecast accuracy. J. Bus. Ethics 2019, 154, 1119–1142. [Google Scholar] [CrossRef]
- Francis, J.; Schipper, K.; Vincent, L. Earnings announcements and competing information. J. Account. Econ. 2002, 33, 313–342. [Google Scholar] [CrossRef]
- Fracassi, C.; Petry, S.; Tate, G. Does rating analyst subjectivity affect corporate debt pricing? J. Financ. Econ. 2016, 120, 514–538. [Google Scholar] [CrossRef]
- Yu, F.F. Analyst coverage and earnings management. J. Financ. Econ. 2008, 88, 245–271. [Google Scholar] [CrossRef]
- Dyck, A.; Morse, A.; Zingales, L. Who blows the whistle on corporate fraud? J. Financ. 2010, 65, 2213–2253. [Google Scholar] [CrossRef]
- Mansi, S.A.; Maxwell, W.F.; Miller, D.P. Analyst forecast characteristics and the cost of debt. Rev. Account. Stud. 2011, 16, 116–142. [Google Scholar] [CrossRef]
- Legner, C.; Eymann, T.; Hess, T.; Matt, C.; Böhmann, T.; Drews, P.; Mädche, A.; Urbach, N.; Ahlemann, F. Digitalization: Opportunity and challenge for the business and information systems engineering community. Bus. Inf. Syst. Eng. 2017, 59, 301–308. [Google Scholar] [CrossRef]
- Francis, J.R.; Neuman, S.S.; Newton, N.J. Does tax planning affect analysts’ forecast accuracy? Contemp. Account. Res. 2019, 36, 2663–2694. [Google Scholar] [CrossRef]
- Wen, Y.; Tikoo, S. Corporate strategy uniqueness, analyst herding, and financing constraints. Strateg. Organ. 2022, 20, 368–388. [Google Scholar] [CrossRef]
- Baron, R.M.; Kenny, D.A. The moderator–mediator variable distinction in social psychological research: Conceptual, strategic, and statistical considerations. J. Personal. Soc. Psychol. 1986, 51, 1173. [Google Scholar] [CrossRef] [PubMed]
- Levinsohn, J.; Petrin, A. Estimating production functions using inputs to control for unobservables. Rev. Econ. Stud. 2003, 70, 317–341. [Google Scholar] [CrossRef]
- Ackerberg, D.A.; Caves, K.; Frazer, G. Identification properties of recent production function estimators. Econometrica 2015, 83, 2411–2451. [Google Scholar] [CrossRef]
- Zhong, Y.; Zhao, H.; Yin, T. Resource Bundling: How Does Enterprise Digital Transformation Affect Enterprise ESG Development? Sustainability 2023, 15, 1319. [Google Scholar] [CrossRef]
- Bai, F.; Liu, D.; Dong, K.; Shang, M.; Yan, A. Research on How Executive Connections Affect Enterprise Digital Transformation: Empirical Evidence from China. Sustainability 2023, 15, 2037. [Google Scholar] [CrossRef]
- Gao, Q.; Gao, L.; Long, D.; Wang, Y. Chairman Narcissism and Social Responsibility Choices: The Moderating Role of Analyst Coverage. Behav. Sci. 2023, 13, 245. [Google Scholar] [CrossRef]
- Tang, X.; Ding, S.; Gao, X.; Zhao, T. Can digital finance help increase the value of strategic emerging enterprises? Sustain. Cities Soc. 2022, 81, 103829. [Google Scholar] [CrossRef]
- Guo, H.; Legesse, T.S.; Tang, J.; Wu, Z. Financial leverage and firm efficiency: The mediating role of cash holding. Appl. Econ. 2021, 53, 2108–2124. [Google Scholar] [CrossRef]
- Ren, Y.; Li, B. Digital Transformation, Green Technology Innovation and Enterprise Financial Performance: Empirical Evidence from the Textual Analysis of the Annual Reports of Listed Renewable Energy Enterprises in China. Sustainability 2022, 15, 712. [Google Scholar] [CrossRef]
- Boubaker, S.; Manita, R.; Rouatbi, W. Large shareholders, control contestability and firm productive efficiency. Ann. Oper. Res. 2021, 296, 591–614. [Google Scholar] [CrossRef]
- Jizi, M.; Nehme, R. Board monitoring and audit fees: The moderating role of CEO/chair dual roles. Manag. Audit. J. 2018, 33, 217–243. [Google Scholar] [CrossRef]
- Burgess, S.; Small, D.S.; Thompson, S.G. A review of instrumental variable estimators for Mendelian randomization. Stat. Methods Med. Res. 2017, 26, 2333–2355. [Google Scholar] [CrossRef]
- Martens, E.P.; Pestman, W.R.; de Boer, A.; Belitser, S.V.; Klungel, O.H. Instrumental variables: Application and limitations. Epidemiology 2006, 17, 260–267. [Google Scholar] [CrossRef]
- Söderström, T.; Stoica, P. Instrumental variable methods for system identification. Circuits Syst. Signal Process. 2002, 21, 1–9. [Google Scholar] [CrossRef]
- Tan, L.; Wu, X.; Guo, J.; Santibanez-Gonzalez, E.D. Assessing the Impacts of COVID-19 on the Industrial Sectors and Economy of China. Risk Anal. 2022, 42, 21–39. [Google Scholar] [CrossRef]
- Sarangi, S.; Chakraborty, A.; Triantis, K.P. Multimarket competition effects on product line decisions–A multi-objective decision model in fast moving consumer goods industry. J. Bus. Res. 2021, 133, 388–398. [Google Scholar] [CrossRef]
- Peng, Y.-S.; Liang, I.-C. A dynamic framework for competitor identification: A neglecting role of dominant design. J. Bus. Res. 2016, 69, 1898–1903. [Google Scholar] [CrossRef]

Disclaimer/Publisher’s Note: The statements, opinions and data contained in all publications are solely those of the individual author(s) and contributor(s) and not of MDPI and/or the editor(s). MDPI and/or the editor(s) disclaim responsibility for any injury to people or property resulting from any ideas, methods, instructions or products referred to in the content. |
© 2023 by the authors. Licensee MDPI, Basel, Switzerland. This article is an open access article distributed under the terms and conditions of the Creative Commons Attribution (CC BY) license (https://creativecommons.org/licenses/by/4.0/).